

Translate this page into:
Synthesis of solar light driven nanorod-zinc oxide for degradation of rhodamine B, industrial effluent and contaminated river water
⁎Corresponding author. habibchem@du.ac.bd (Ahsan Habib)
-
Received: ,
Accepted: ,
This article was originally published by Elsevier and was migrated to Scientific Scholar after the change of Publisher.
Peer review under responsibility of King Saud University.
Abstract
Surface water contamination by various dyes and pigments is a global problem caused by rapid industry, particularly textile/dyeing. Bangladesh's export-oriented textile sector has exploded in recent decades, polluting local waterways significantly. In this study, nano-ZnO were prepared using surfactant-assisted sol–gel, hydrothermal and thermal methods. SEM, XRD, reflectance spectrophotometer, EDS and adsorption tests were used to characterize the synthesized nano-ZnO. BET isotherms were used to determine the surface area, pore volume, and pore size of the as-prepared nano-ZnO. The mixed surfactant assisted-sol gel method produced nanorod-ZnO, whereas the hydrothermal and/or thermal methods yielded clusters of needles ZnO, as proven by SEM images. XRD data revealed that the synthesized nanorod-ZnO had a mainly wurtzite crystalline structure and their size was estimated using the Scherrer equation to be about 23.90 nm. EDS spectra confirmed the synthesis of pure nanorod-ZnO. Using a UV–visible reflectance spectrophotometer, the band gap energy of the as-prepared nanorod-ZnO was found to be 3.35 eV. According to BET isotherms, the BET and Langmuir surface areas were 4 and 5.4 m2/g, respectively. Prior to analyzing photodegradation, the RB was adsorbing in the presence of various doses of the nanorod-ZnO in the dark, but no adsorption was observed. The photocatalytic activities of the synthesized nano-ZnO were compared to TiO2 (anatase) for the degradation of RB in an aqueous system under solar light, UV, fluorescence, and tungsten filament light irradiation. Nanorod-ZnO showed exceptional photocatalytic activity in degrading RB in an aqueous solution under solar light irradiation. The results suggest that 0.01 g/50 mL nanorod-ZnO with a solution pH of 7.8 is the best combination for complete degradation of 2.00 × 10⁻⁵ M RB under solar light irradiation. When nano-ZnO was exposed to light, the inhibiting effect of ethanol and/or tert-butanol on the degradation of RB confirmed the formation of mostly hydroxyl free radicals. The synthesized nanorod-ZnO shown substantial photocatalytic activity in the removal of pollutants from industrial effluents and contaminated river water under solar light irradiation. A mechanism of excellent photocatalytic activity of the nanorod-ZnO is discussed.
Keywords
Nanorod-ZnO
Solar light
Photocatalysis
Defects
Industrial effluents
Contaminated river water

1 Introduction
Bangladesh’s industrial development has been guided by a variety of strategies aimed at bolstering a manufacturing-based economy since 1972. With these initiatives in place, the manufacturing sector, notably export-oriented textile industries, contributed 17.9 % of GDP in 2010 and is predicted to rise to 40 % by 2025. However, textile industries use a lot of water and a lot of chemicals in their processes, thus they dump a lot of effluents containing various pollutants, especially synthetic dyes, into adjacent water bodies (Habib et al., 2012a; Habib et al., 2012b; Muslim et al., 2012; Habib et al., 2013; Muslim et al., 2013; Hossain et al., 2016; Ertugay and Acar, 2017; Ahmadi et al., 2020). In fact, Bangladesh Department of Environment (DoE) has made it essential for each textile unit to have an effluent treatment plant (ETP), however the ETP plants have been failing (Department of Environment (DoE), 2008). Therefore, water bodies in the vicinity of the textile and dyeing industries have been seriously affected (Habib et al., 2012a; Habib et al., 2012b; Muslim et al., 2012; Muslim et al., 2013; Hossain et al., 2016).
Synthetic dyes have been widely employed in a variety of industries, including textile and dyeing (Doulati et al., 2008), leather, printing, paper, plastics, cosmetics, pharmaceuticals, and petrochemicals etc (Benkhaya and El Harfi, 2017; Benkhaya et al., 2020). Synthetic dyes are produced and used at a rate of around 700,000 metric tons per year in various industrial units all over the world (Hoda et al. 2006; Moussavi and Mahmoudi 2009; Balarak et al., 2021). In the textile sector, 60–70 % of these synthetic dyes are used (Lacasse and Baumann, 2004; Rawat et al., 2016; Brüschweiler and Merlot, 2017). However, because only a tiny fraction of the dyes are used for staining during the dyeing process, a considerable portion is released as industrial effluents into nearby water bodies. To protect human health and the environment, an efficient and cost-effective method for the degradation/mineralization of unstained dyes from industrial effluents must be developed. Several methods for degrading and/or mineralizing organic pollutants from industrial effluents have already been developed. The most efficient methods have been found to be oxidation (Habib et al., 2012b; Muslim et al., 2013; Hossain et al., 2016; Ertugay and Acar, 2017; Ahmadi et al., 2018), photocatalytic degradation (Habib et al., 2012a; Muslim et al., 2012; Habib et al., 2013; Saravanan et al., 2013; Saravanan et al., 2014), adsorption (Habib et al., 2006; Han et al., 2008; Ahmadi and Igwegbe 2020; Igwegbe et al. 2020), and coagulation-flocculation (Obiora-Okafo and Onukwuli, 2018; Somasundaran and Runkana, 2005). The photocatalytic degradation method has been widely used to remove pollutants, particularly organic dyes, from aqueous solution because of its numerous advantages, including cost effectiveness, and significant mineralization efficiency.
Zinc oxide (ZnO) has piqued the interest of researchers due to its non-toxicity, low cost, and excellent photocatalytic activity (Habib et al., 2012a; Muslim et al., 2012; Ghaly et al., 2017; Khan et al., 2017; Mauro et al., 2017; Zhao et al., 2017; Sin and Lam, 2018; Karagoz et al., 2021). Because ZnO is an excellent inorganic ultraviolet (UV) absorber with a band gap energy of approximately 3.30 eV (Ding et al., 2016), it has a high oxidation power for photocatalytic degradation of organic pollutants (Gondal and Sayeed, 2007; Chu et al., 2012). Nano-ZnO with appropriate nanostructures has been found to have good photocatalytic activities for the degradation of organic contaminants in complex system (Lam et al., 2012). These materials can be synthesized in various morphologies, such as one-dimensional (1D) nanorods and three dimensional (3D) hierarchical nanoflowers. They all have the main advantage of high surface-to-volume ratios for increased photocatalytic activity (Wang, 2004; Ali et al., 2015). As photocatalysts, other metal oxides, including TiO2 (Meng and Sun, 2009; Habib et al., 2013; Fan et al., 2016a; Fan et al., 2016b; Karagoz et al., 2020), ZrO2 (Shinde et al., 2018), SnO2 (Luque et al., 2021), CeO2 (Meng et al., 2017), Bi2MoO6@In2S3 (Yu et al., 2022), etc., have been employed to degrade organic pollutants or convert CO2 into fuel.
Changing the morphology and/or crystallinity of metal oxides such as ZnO, TiO2, Fe2O3, etc improves photocatalytic activity (Fujishima and Honda, 1972; Do et al., 2020). Fujishima and Honda (1972) were the first to discover that altering the crystalline structure of TiO2 dramatically increases photocatalytic activity when exposed to solar light (Fujishima and Honda, 1972). They discovered hydrogen and oxygen formation from water splitting in the presence of crystalline TiO2 when exposed to solar light. When the morphology of nano-ZnO changes from spherical to nanorod, it is expected that its catalytic activity will change along with its electrical property. Sol-gel (Ristic et al., 2005; Dev et al., 2006; Li et al., 2008; Xian et al., 2012; Davis et al., 2019), spray pyrolysis (Patil et al., 2011; pan et al., 2014), pulsed laser deposition (Mannam et al., 2017), chemical vapor transport (Rezabeigy et al., 2015), chemical vapor deposition (Chu et al., 2012), chemical vapor synthesis (Reuge et al., 2009), chemical bath deposition (Poornajar et al., 2016), and thermal/hydrothermal synthesis (Baruah and Dutta, 2009; Muslim et al., 2012; Phromyothin et al., 2017) are just a few of the methods that have been used.
Several surfactants such as sodium dodecyl sulfate (SDS) (Sun et al., 2006), cetyltrimethylammonium bromide (CTAB) (Zhao et al., 2009), polyethylene glycol (PEG) (Feng et al., 2010), and polyethyleneimine (PEI) (Kevin et al., 2010; Lim et al., 2010) have been used to synthesize nanorod-ZnO (Ghayour et al., 2011). The influence of surfactants on the shape of ZnO crystals was largely examined individually in these investigations. SDS or CTAB have been used to make various structures such as nanowires, flowers, rods, hexagonal bipyramids, and microspheres. SDS and CTAB have also been used to prepare various morphological structured-ZnO (Choi et al., 2002; Tan et al., 2005, Usui, 2009; Lv et al., 2009; Ramimoghadam et al., 2012).
In this study, sol–gel as well as hydrothermal and thermal methods were used to synthesize nano-ZnO in order to use as catalysts to degrade organic dyes in industrial effluents and contaminated river water under solar light irradiation. In sol–gel method, surfactants including anionic SDS and cationic CTAB were used as capping agents in order to produce nanorod-ZnO. Rhodamine B (RB) was used as a model dye compound to optimize the experimental conditions so that nanorod-ZnO may be used as a photocatalyst to depollute industrial effluents and/or contaminated river water. To examine the catalytic efficiencies of the prepared nanorod-ZnO under various light sources, UV, fluorescence, and tungsten filament light sources were also used.
2 Experimental
2.1 Materials and methods
2.1.1 Reagents and materials
Zn(NO3).6H2O, ZnCO3, ZnSO4·7H2O, (NH4)2CO3, C2H5OH, (CH3)3COH, H2O2, CH3(CH₂)11OSO3Na (SDS), C19H42BrN (CTAB) were purchased from Merck, Germany; NaOH and HCl were purchased from BDH; commercial TiO2 was purchased from Scharlau, Spain; C28H31ClN2O3 (RB) was purchased from Sigma-Aldrich. The RB dye has a molecular mass of 479.02 g mol−1 and its structure and UV–Vis spectrum is shown in Fig. S1. The maximum absorption (λmax) of RB dye in aqueous solution was measured at 554 nm. All the samples were used without further purification.
2.2 Synthesis of nano-ZnO
2.2.1 Synthesis of nanorod-ZnO
In beakers, about 29.7 g of Zn(NO3)2·6H2O and 8.0 g of NaOH were dissolved separately in 250 mL of distilled water. A 1.0 M solution of NaOH was slowly added to the Zn(NO3)2 solution (0.5 M) with constant stirring at room temperature in the presence of 0.3 % SDS, anionic surfactant, and a mixture of SDS and CTAB, a cationic surfactant, (0.3 %, SDS, + 0.2 %, CTAB). A white precipitate deposited at the bottom of the beaker after 3 h of stirring. The precipitate was then filtered and washed with ethanol–water (50/50 v/v) for about 3–4 times. The powdered sample was dried in an oven at 105 °C for 6 h. The synthesized ZnO samples were kept in desiccators until they were to be characterized. All of the reagents were used without being purified further.
2.2.2 Synthesis of nano-ZnO
About 28.75 g of ZnSO4·7H2O and 9.60 g of anhydrous (NH4)2CO3 were dissolved in 500 mL and 250 mL of distilled water, respectively. After that, the (NH4)2CO3 solution was gradually added to the ZnSO4 solution, stirring constantly until complete ZnCO3 precipitation. After being stirred for 2 h, the product was kept at room temperature for 24 h. The residue was filtered and washed with deionized water to completely remove the SO42- ion. After that, the sample was dried in an oven for 6 h at 105 °C. The finished product was then calcined at 300 °C in a Muffle furnace (OSK, ISUZU SEISAKUSU Co., ltd., Japan) until it reached a constant weight. The prepared ZnO samples were stored in desiccators until they were to be characterized.
2.3 Characterization of the synthesized nanomaterials
The morphology of the synthesized ZnO and commercial TiO2 (anatase) were investigated using scanning electron microscopy (SEM) (Philips XL30, Holland). The elemental analysis of the nano-ZnO and commercial TiO2 was performed using energy-dispersive X-ray spectroscopy (EDS) (JED 2300 analysis station, JEOL, Japan). The crystallinity of the synthesized nano-ZnO and commercial TiO2 was investigated using an X-ray diffractometer (Bruker DB-Advance X-ray diffractometer, XRD, Germany). The analyses were carried out using Cu Kα radiation at 2ϴ with a range of 10 to 80° for a 1 g sample.
The crystallite size was determined by using Scherrer’s equation (SE) (1) (Valerio and Morelhão, 2019):
Therefore, crystallite size for nanorod-ZnO = (0.90 × 0.15418)/(0.0061111 × 0.949699) = 23.90 nm. For spherical nano-ZnO, the size was found to be 31.35 nm (κ = 1.18) (Valerio and Morelhão, 2019).
Estimation of band gap energy (Eg) of metal oxides has been done elsewhere (Morales et al., 2007; Morales et al., 2019). Briefly, about 1 g of the relevant metal oxide was taken in a polytetrafluoroethylene (PTFE) made cell and scanned using a UV–vis diffuse reflectance spectrophotometer (UV-1800, Shimadzu Corporation, Japan). A pre-packed PTFE cell was used as a reflectance standard (226-85611-20, Shimadzu). The diffuse reflectance spectra were recorded in triplicate and then averaged. Tangents were drawn along the top and bottom lines of the relevant spectral band. A straight line between the two tangents that intersected the band that corresponds to the Eg of a specific material.
The Brunauer- Emmet-Teller (BET) method was used to determine the specific surface area, pore size, pore volume, and pore diameter of the samples using a nitrogen-adsorption instrument (Brunauer et al., 1938). Prior to analysis, the samples were degassed at temperatures ranging from 200 to 300 °C for 5–8 h, depending on the melting point of each sample. The pore size distribution was calculated from the adsorption–desorption isotherms using the Barret-Joyner-Halenda (BJH) model (Barrett et al., 1951).
2.4 Preparation of stock solution of rhodamine b (RB)
A 1.0 × 10⁻⁴ M RB solution was prepared by dissolving about 0.0119 g of RB in 250 mL of distilled water. In order to investigate the photocatalytic activities of the synthesized nano-ZnO and commercial TiO2, 10 mL of the stock solution was placed in a photoreactor for each case. The photocatalytic activity of the synthesized nano-ZnO in the degradation of RB, industrial wastewater, and contaminated river water with textile effluents was compared to that of commercial TiO2 as a model photocatalyst.
2.5 Experimental procedure in solar light irradiation
The solar photocatalytic experiments were carried out in a photochemical batch reactor with a capacity of 100 mL and dimensions of 64.4 cm (height × diameter). All photochemical experiments were conducted on sunny days between 10 am and 2 pm from December to February on the roof of the Mukarram Hussain Khundker Biggyan Bhaban (MHKBB), University of Dhaka, Bangladesh, which is approximately 85 feet above the earth’s surface. A light meter was used to measure the intensity of light in each experiment. When photocatalytic experiments were carried out under various conditions (using H2O2, ethanol, NaCl, and so on), five catalytic batches were run simultaneously to compare their activity. To establish adsorption and desorption equilibrium, a sufficient amount of the nano-ZnO and commercial nano-TiO2 was suspended in the required volume of distilled water and stirred overnight in the dark. Just before running the photocatalysis reaction, additional reagents such as H2O2, ethanol, NaCl, and other required reagents were added to the RB solution.
Herein, different light sources were used to compare. When there was enough sunlight, the photocatalysis reactions were carried out on the roof of MHKBB; otherwise, the experiments were carried out in a homemade photoreactor chamber in the lab. Scheme 1 shows an experimental setup of photodegradation of RB (a) under solar light irradiation and (b) in a photoreactor made by wood under different light sources (e.g., UV, fluorescent and tungsten filament bulb).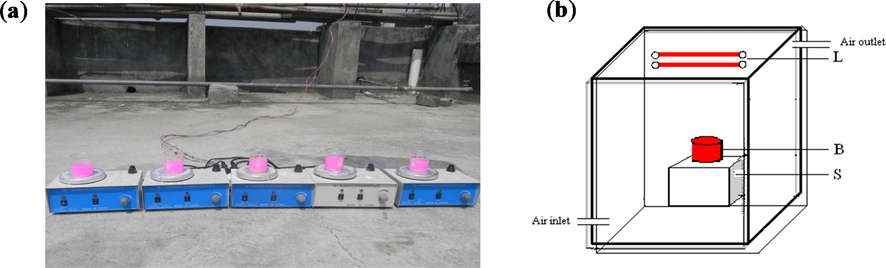
Experimental setup of photodegradation of RB (a) under solar light irradiation and (b) in a photoreactor under different light sources (e.g., UV, fluorescent and tungsten filament bulb).
The photoreactor is made of wood with 24 × 18 × 22″. It is used to monitor photocatalytic reactions in the presence of UV, fluorescence, and a tungsten bulb. In a laboratory experiment, one UV tube light (18–24 Watt, 380 nm), four tungsten (40 Watt), and four fluorescence bulbs (9 Watt) were used separately. The inner part of the box was wrapped in aluminum foil, and the box was covered with a thick black cloth when the photocatalytic experiment was running.
2.6 Percent degradation
Degradation of RB was calculated using equation (2):
An analytical calibration curve was constructed by plotting the absorbance of RB dye solution against various concentrations ranging from 1.2 × 10⁻⁵ to 2.2 × 10⁻⁵ mol/L in order to determine the molar absorptivity of RB in aqueous solution (Fig. S3). The molar absorptivity of the RB dye in aqueous solution was calculated using the slope of the straight line (1.014 × 10⁵) and was found to be 1.014 × 10⁵ L mol−1 cm−1 where l = 1 cm.
2.7 The initial rate of degradation
The first order kinetic method is used to estimate the photocatalytic degradation rates of organic dyes as follows:
2.8 Adsorption study of RB in presence of nanorod-ZnO
In four different beakers containing 0.01 g of nanorod-ZnO, 50 mL of 2 × 10⁻⁵ mol L-1 RB solution was taken. The experiment was carried out in a wooden box (covered with a thick black cloth) with constant stirring the content by magnetic stirrers. A 5 mL solution was pipette out from the beaker at different time intervals and centrifuged to determine absorbance. 5 mL solution was pipette from a nearby beaker and added to the experimental beaker to minimize the volume change. The adsorption test lasted 60 min.
2.9 Photodegradation kinetics of RB by nanorod-ZnO under solar light, UV light, visible light from tungsten and fluorescent bulb
50 mL of the experimental solution was taken in 6 separate beakers containing 2.00 × 10⁻⁵ M of RB and 0.01 g of nanorod-ZnO with continuous stirring by magnetic stirrers to investigate the degradation kinetics of RB under solar light irradiation. A 5 mL solution was pipette out from the beaker at different time intervals and centrifuged to determine absorbance. To minimize the volume change, a 5 mL solution was pipette from a nearby beaker and added to the experimental beaker. The kinetic study lasted 60 min.
The photodegradation kinetics of RB were studied in the photoreactor under UV and visible irradiation, such as fluorescent and tungsten light. 50 mL of the dye solution was taken in 6 separate beakers containing 2.00 × 10⁻⁵ mol L-1 of RB and 0.01 g of nanorod-ZnO and constant stirred by magnetic stirrers under the relevant light source, similar to solar light induced photodegradation. A 5 mL solution was pipette out from the beaker at different time intervals and centrifuged in order to determine absorbance. A 5 mL solution was pipette from a nearby beaker and added to the experimental beaker to minimize the volume change. The kinetic experiment lasted 60 min.
2.10 Photodegradation of industrial effluent and dye-polluted river water
The synthesized nanorod-ZnO has been used as a photocatalyst to degrade organic dyes in complex systems, accordingly industrial effluent from a nearby dyeing industry was collected. The dye-contaminated river water was also collected from the nearby rivers of many dying industries that do not have effluent treatment plants (ETP). The chemical oxygen demand (COD), dissolved oxygen (DO), pH, absorbance and conductivity of the collected river water were measured before and after photodegradation (Table S1) and kept in ambient conditions in order to investigate anaerobic degradation, and no degradation was found. Under the same experimental conditions as for RB, degradation was carried out in the presence of 0.20 g of nanorod-ZnO in 50 mL of industrial wastewater and/or river water under solar light irradiation for 60 min.
3 Results and discussion
3.1 Characterization of the as-prepared nano-ZnO
Fig. 1(a)-(d) show SEM images of nano-ZnO prepared using various methods. Fig. 1(a) and (b) show the morphology of nano-ZnO prepared by sol–gel method in the presence of 0.3 % SDS and 0.3 % SDS + 0.2 % CTAB, respectively, while Fig. 1(c) and (d) show the microstructure of nano-ZnO prepared by thermal decomposition of synthetic and commercial ZnCO3 at 300 °C. As shown in Fig. 1(b), using the sol–gel method with 0.3 % SDS with 0.2 % CTAB, the as-prepared nano-ZnO revealed clearly nanorod-like structure, but using the 0.3 % SDS-based sol–gel method exhibited just growing nanorod of ZnO (Fig. 1a). On the other hand, the thermal decomposition of both synthetic and commercial ZnCO3 at 300 °C revealed clusters of ZnO needles (Fig. 1c,d).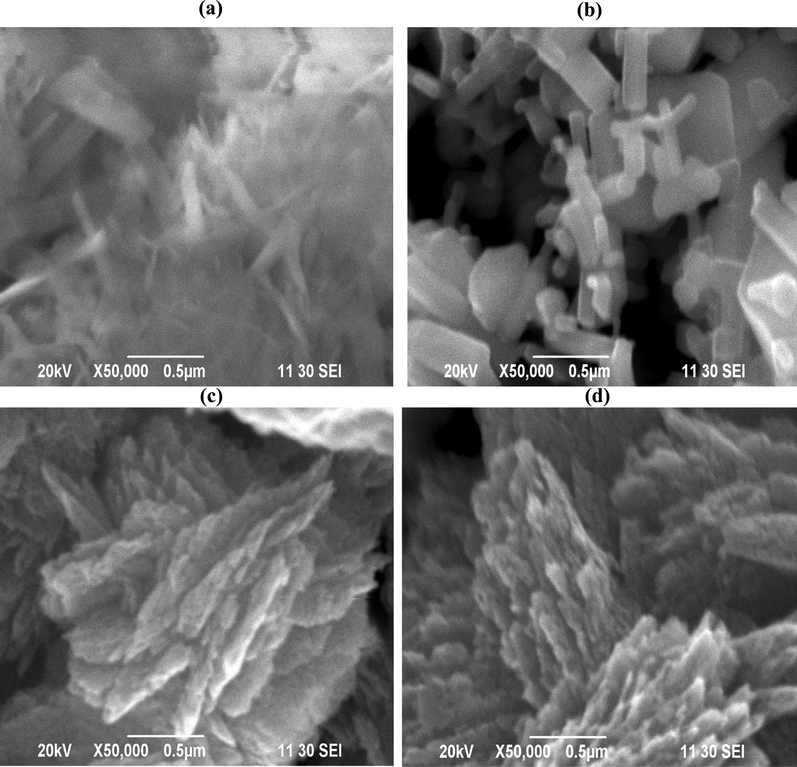
SEM images of (a) ZnO via sol–gel with 1 % SDS, (b) ZnO via sol–gel with 7 % Triton X-100, (c) ZnO from synthesized ZnCO3 at 300 °C and (d) ZnO from commercial ZnCO3 at 300 °C.
A minor amount of nano-ZnO produced in the presence of only SDS is nanorod-ZnO, whereas more than 50 % of nanorod-ZnO is formed in the presence of SDS with CTAB. The anionic SDS and the cationic CTAB play different roles in the formation of nanorod-ZnO. At increasing solution pH, the negatively charged anionic surfactant (SDS) ions assemble and form spherical micelles, which encapsulate the formed ZnO seeds. This encapsulation prevents zinc ions from reaching the ZnO seeds. This results in the formation of nucleation sites for additional ZnO rods that grow randomly along the micelle’s outside border. The cationic surfactant CTAB, when combined with SDS, may cap the ZnO nanorods, preventing further lateral growth. As a result, the presence of cationic CTAB molecules prevents lateral growth of nanorod-ZnO, resulting in the formation of nanorod-ZnO. Ramimoghadam et al. (2012) and Maiti et al. (2008) also reported that the anionic SDS and cationic CTAB surfactant molecules facilitate in the formation of nanorod-ZnO (Ramimoghadam et al., 2012; Maiti et al., 2008). The particles in commercial TiO2 (anatase) are rather spherical, as shown in Fig. S4.
Fig. 1(c) shows the SEM image of ZnO synthesized using hydrothermal technique (ZnCO3 generated by combining ZnSO4 and (NH4)2CO3) and thermally treated at 300 °C, as previously indicated. A cluster of needles of ZnO with agglomeration may be seen in the synthesized ZnO. Nano-ZnO produced from commercial ZnCO3 agglomerates into clusters of needles at 300 °C, as seen in Fig. 1(d).
The EDS spectra of nanorod-ZnO and commercial TiO2 (anatase) are shown in Fig. S5(a) and (b), respectively. The EDS spectrum shows only the peaks for oxygen and zinc, as shown in Fig. S5(a), confirming the formation of pure nanorod-ZnO using the TX-assisted sol–gel method. Fig. S5(b), like nanorod-ZnO, shows only the peaks for oxygen and titanium. Other nano-ZnO EDS spectra were not displayed.
Fig. 2 shows the XRD pattern of the as-prepared nano ZnO and commercial TiO2 (anatase). Results show that the prepared ZnO samples are crystalline and identical with wurtzite ZnO, and ZnO at 225 and 250 °C contains a minor amount of Zn(CO3). These results suggest that ZnCO3 completely decomposed at 300 °C. Interestingly, S-2 shows very high intensities of the different phases of ZnO compared to any other prepared ZnO. This result suggests that sample S2 contains maximum percentage of crystalline structure of ZnO. XRD data confirms that the prepared nanorod ZnO no other components.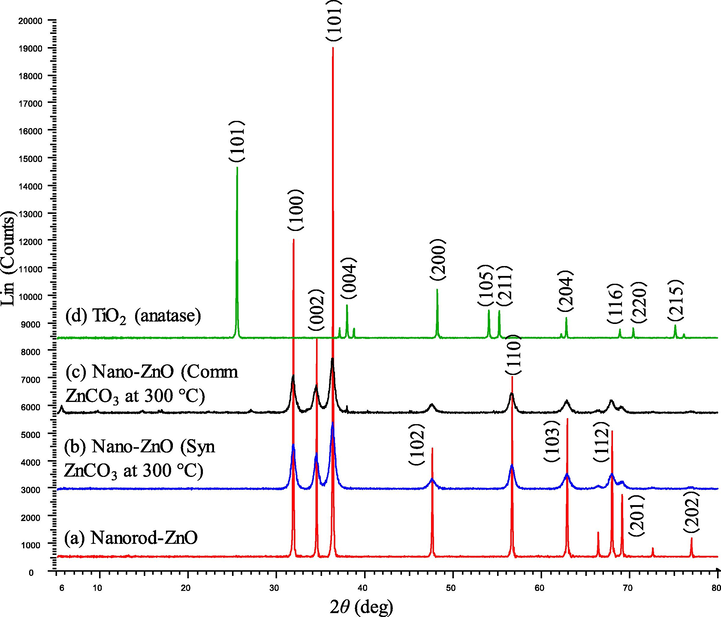
XRD spectral pattern of (a) nanorod-ZnO, (b) nano-ZnO (synthesized ZnCO3 at 300 °C), (c) nano-ZnO (commercial ZnCO3 at 300 °C) and (d) commercial TiO2 (anatase).
The Eg for nanorod-ZnO and TiO2 (anatase) were measured by using reflectance spectrometer. Fig. S5 shows the EDS spectra of (a) nanorod-ZnO and (b) TiO2 (anatase). The Eg for nanorod ZnO and commercial TiO2 were found to be ∼ 3.35 (corresponds to 376 nm) and 3.16 eV, respectively (Fig. S2). According to the Eg for nanorod-ZnO, it is speculated that the nanorod-ZnO supposed to be active in the UV region.
Figs. S6(a) and (b) show the spectral pattern of photodegradation of the RB dye in the presence of 0.01 g/50 mL of nanorod-ZnO and TiO2 suspension under solar light irradiation, respectively. The dye shows an absorption maximum, λmax, at 554 nm. The presence of non-azo chromophoric group, -C⚌N-, in fact, is responsible the absorption in the visible range. As seen from Fig. S6(a), the absorbance is disappeared within only 60 min. The formation of hydroxyl free radicals (•OH) in the presence of nanorod-ZnO and/or TiO2 under the solar light irradiation causes cleavage the -C⚌N- group of the RB dye molecules. In the succeeding section, the effect of ethanol and tert-butanol have been taken into account to explain photodegradation of the RB dye under the either ZnO/solar light and/or TiO2/solar light system. The formed hydroxyl free radicals consequently attack the bonds, thereby resulting in degradation of the dye molecules. In our previous studies, we also reported that ZnO and/or TiO2 causes generation of hydroxyl and oxygen anionic free radicals under UV and/or visible light irradiation (Habib et al., 2012a; Habib et al., 2012b; Muslim et al., 2012; Habib et al., 2013).
Fig. S7 shows percentage of photodegradation of the RB dye in the presence of 0.01 g/mL of nanorod-ZnO and TiO2. As seen from Fig. S7, nanorod-ZnO causes almost 100 % photodegradation of the dye molecules within 60 min while the same amount of the commercial TiO2 is responsible for ∼ 73 % degradation under solar light irradiation. However, the Eg of nanorod-ZnO is ∼ 3.35 eV but that for TiO2 is about 3.16 eV (Fig. S2). Thus, it is expected that TiO2 would exhibit better photocatalytic activity over the nanorod-ZnO under the solar irradiation. Moreover, BET data show contradictory information about the better photocatalytic activity of nanorod-ZnO. According BET isotherms, the BET and Langmuir surface areas of the nanorod-ZnO are 4 and 5.4 m2/g, respectively (BET: 4; Langmuir: 5.4 m2/g) while that for TiO2 are 9 and 13 m2/g, as shown in Table S2. The better catalytic activity by the nanorod-ZnO over TiO2 may be due to arising crystal defects in the nanorod-ZnO. Moreover, XRD data of the nanorod-ZnO shows higher crystalline structure of wurtzite ZnO, as shown in Fig. 2. Fujishima and Honda (1972) reported that changing the crystalline structure of TiO2 enhances the photocatalytic activity radically under solar light irradiation (Fujishima and Honda, 1972). The Scherrer equation was used to determine the crystallite sizes of the as-prepared nanorod- and spherical-ZnO, which were found to be approximately 23.90 and 31.35 nm, respectively.
3.2 Photocatalysis
3.2.1 Effect of photocatalysts on degradation and their kinetics
Degradation studies were carried out under solar light irradiation to determine the rate constant, k, for the degradation of the RB dye in the presence of 0.01 g/50 mL of nanorod-ZnO and TiO2, as shown in Fig. S7. The results show that nanorod-ZnO degraded to about 100 %, whereas TiO2 declined to about 73 % in 30 min under solar light irradiation, suggesting that nanorod-ZnO had superior photocatalytic activity than nano-TiO2. According to SEM images, SDS/CTAB-assisted synthetic approach produced nanorod-ZnO (Fig. 1b), whereas commercial anatase TiO2 exhibited spherical nanoparticles (Fig. S3). The Eg of nanorod-ZnO and TiO2 were found to be ∼ 3.35 and 3.16 eV, respectively. Both the Eg correspond to around 376–395 nm in the UV region, only 4–6 % UVA solar radiation cannot be responsible for the complete degradation of the RB dye (100 %). As a result of the structural change from spherical to rod-like, it is envisaged that nanorod-ZnO will develop an intermediate band gap due to crystal defect. A more detailed explanation will be provided in the following section.
Under UV and/or solar light irradiation, the surface area of photocatalysts is also important for degrading organic pollutants like RB. Since photodegradation is a surface-assisted reaction, greater surface area photocatalysts should be more effective, however the BET data contradicts this. The BET and Langmuir surface areas of nanorod-ZnO were 3.7182 and 5.424 m2/g, respectively, while TiO2 surface areas were 8.908 and 12.963 m2/g. The XRD data of nanorod-ZnO shows a higher crystalline structure of wurtzite ZnO (Fig. 2a), which could change the electronic properties of the nanorod-ZnO. Fujishima and Honda (1972) found that altering the crystalline structure of TiO2 exhibits extraordinary photocatalytic activity, resulting in the splitting of water molecules into hydrogen and oxygen under solar light irradiation (Fujishima and Honda, 1972). The high photocatalytic activity of nanorod-ZnO is thought to be due to a synergistic effect, according to our current findings. The development of an intermediate band gap and/or the acquisition of a particular attribute such as surface plasmon resonance cause changes in the electronic properties of nanorod-ZnO.
The rate constant, k, for the two catalysts under solar light irradiation was calculated using the degradation data of RB dye in the presence of nanorod-ZnO and TiO2. Fig. 3 shows the plots of lnC/C0 against time were used to determine the k values. As shown in Fig. 3, the rate constants, k, for nanorod-ZnO and TiO2 were found to be 0.138 and 0.035, respectively. As a result, the prepared nanorod-ZnO showed greater photocatalytic activity in the photodegradation of the RB dye under solar light irradiation than the commercial TiO2.![A plot of lnC/Co vs time for calculating rate constant (k) of degradation of RB in presence of nanorod-ZnO and commercial TiO2 under solar irradiation. [RB] = 2.00 × 10⁻⁵ M; Solution pH = 7.8.](/content/184/2022/15/10/img/10.1016_j.arabjc.2022.104144-fig4.png)
A plot of lnC/Co vs time for calculating rate constant (k) of degradation of RB in presence of nanorod-ZnO and commercial TiO2 under solar irradiation. [RB] = 2.00 × 10⁻⁵ M; Solution pH = 7.8.
3.2.2 Effect of solution pH
The influence of initial solution pH on RB degradation with nanorod-ZnO under solar light irradiation was investigated over a pH range from 6.0 to 10.5 and the results are presented in Fig. 4. This is due to the fact that under solar light irradiation, low solution pH (5.0) causes nano-ZnO to dissolve (Habib et al., 2012a, Muslim et al., 2012; Habib et al., 2013). As shown in Fig. 4, degradation of RB changes slightly as the solution pH rises from 6.0 to 10.5 after 5 min. Incredibly, the equilibrium condition was reached after only 15 min of reaction time. The enhanced degradation of RB at solution pH 10.5 during the catalytic reaction can be explained by variations in the degree of dissociation of RB molecules and the surface charge of nanorod-ZnO as a function of solution pH. The surface charge of nanorod-ZnO particles is positive until the pH of the solution reaches 8.9 (Habib et al., 2012a). Because the zero-point charge (zpc) of nano-ZnO is 8.9, as the pH of the solution rises over 8.9, the surface charge becomes negative (Habib et al., 2012a; Muslim et al., 2012; Habib et al., 2013). The cationic RB dye molecules do not adsorb on the positively charged nanorod-ZnO particles within the pH range of acidic to 8.9 because to the positive surface charge of the nanorod-ZnO particles, as illustrated in Fig. S8. At solution pH 7.8 under dark condition, RB dye molecules adsorb on the nanorod-ZnO with only 1.47 % (Fig. S8).![Effect of solution pH on degradation of RB with 0.01 g/50 mL nanorod-ZnO under solar light irradiation. [RB] = 2.00 × 10⁻⁵ M.](/content/184/2022/15/10/img/10.1016_j.arabjc.2022.104144-fig5.png)
Effect of solution pH on degradation of RB with 0.01 g/50 mL nanorod-ZnO under solar light irradiation. [RB] = 2.00 × 10⁻⁵ M.
It is reasonable to expect that increasing the pH of the solution will speed up the degradation of RB. The surface charge of the nanorod-ZnO should be negative at pH 10.5, allowing for increased adsorption of the RB dye molecules. Because the metal oxide-mediated catalytic process is a surface-assisted process, the maximum degradation of RB dye has been achieved at higher solution pHs, such as 10.5. Furthermore, during solar light irradiation, alkaline conditions induce the generation of hydroxyl free radical (•OH) to be enhanced (Natarajan et al., 2011). Under these experimental conditions, H2O2 is produced in in situ and generates •OH in an alkaline environment, which aids the degradation of dye molecules (Kuvarega et al., 2011). The excellent catalytic activity of nanorod-ZnO in degrading RB dye molecules at pH 10.5 indicates that it could be used as a stable photocatalyst.
3.2.3 Effect of various light sources on degradation of RB in presence of nanorod-ZnO
Fig. 5 illustrates the degradation of RB (%) in the presence of suspended nanorod-ZnO (0.01 g/50 mL) when exposed to solar, UV, fluorescent, and tungsten filament light. As shown in Fig. 5, solar light was more effective for RB degradation than UV and/or other light sources. About 100 % degradation was accomplished within 30 min, but UV, fluorescent, and tungsten filament light irradiation only achieved 65, 48, and 18 % degradation, respectively. Only 4–6 % of solar energy is UVA (315–400 nm), although the visible and infrared portions constitute 45–50 and 38–40 %, respectively. Of course, solar radiation has a higher light intensity (75000–78000 lx) than artificial UV (239–246 lx) or other light sources (tungsten: 2500 lx; fluorescent: 2800 lx), but the required energy for electronic transition from the highest occupied molecular orbital (HOMO) to the lowest unoccupied molecular orbital (LUMO) is quantized using a quantum mechanical approach.![Degradation (%) of RB in the presence of 0.01 g/50 mL nanorod ZnO under solar, UV, fluorescent and tungsten filament light irradiation. [RB] = 2.00 × 10⁻⁵ M; Solution pH = 7.8.](/content/184/2022/15/10/img/10.1016_j.arabjc.2022.104144-fig6.png)
Degradation (%) of RB in the presence of 0.01 g/50 mL nanorod ZnO under solar, UV, fluorescent and tungsten filament light irradiation. [RB] = 2.00 × 10⁻⁵ M; Solution pH = 7.8.
The Eg of the as-prepared nanorod-ZnO was measured using a reflectance spectrophotometer and found to be 3.35 eV (correspond to UV region) (Fig. S5). Surprisingly, during solar light irradiation, the nanorod-ZnO displayed exceptional photocatalytic activity in degrading the non-azo dye, RB. These findings imply that the nanorod-ZnO-solar light-assisted system promotes a novel degradation mechanism for organic pollutants such as RB. Previous research has shown that altering the structure of metal oxide semiconductors like TiO2 improves their catalytic activity in water splitting to hydrogen and oxygen using solar energy (Fujishima and Honda, 1972; Maeda and Domen, 2007; Maeda, 2011). This is due to structurally modified metal oxide semiconductors possessing decreased Eg. However, using a reflectance spectrophotometer, we determined the Eg of nanorod-ZnO, which was found to be 3.35 eV. The visible and even infrared portions of solar energy cannot stimulate electrons from the HOMO to LUMO states for nanorod-ZnO because 3.35 eV belongs to the UV region.
Metal nanoparticles such as gold, silver, and other metal nanoparticles exhibit surface plasmon resonance, which excite the free electrons from the metallic nanoparticles to the semiconductors’ LUMO and/or conduction band, resulting in excellent catalytic activity through generation of oxygen anionic free radicals, O2–• (Kaur and Pal, 2015). However, without doping any metallic particles such as Au, Ag, or Cu, the as-prepared nanorod-ZnO with Eg 3.35 eV should not display such photocatalytic activity by electronic transition from HOMO to LUMO. These findings imply that the nanorod-ZnO may achieve intermediate band gap levels by deforming the internal morphology, and that electronic transition happens as a result of the solar spectrum’s visible and infrared radiation being absorbed. In addition, coupling nanorod-ZnO with other semiconductors with different redox energy levels can lead to an increase in photocatalytic efficiency by the enhancement of the charge carrier separation process and thus an increase in the lifetime of the charge carriers. The proper selection of coupled semiconductors can also activate the heterojunction system towards a visible light response (Serpone et al., 1995; Bessekhouad et al., 2004). As a result, the extremely high intensity of solar light (75000–78000 lx) may be responsible for electronic excitation, resulting in the effective catalytic activity of nanorod-ZnO.
3.2.4 Effect of nanorod-ZnO dosage on photodegradation of RB
Fig. 6 shows how the degradation of RB rises as the amount of nanorod-ZnO increases. As shown in Fig. 6, the degradation began abruptly within 5 min, followed by a gradual slowing of the rate. The degradation of RB is not proportional to the concentration of nanorod-ZnO in the suspension, even after 5 min. After 5 min of irradiation, 0.01 g/50 mL nanorod-ZnO in the suspension, for example, degrades by roughly 45 %. After 5 min, degradation of 0.05 g/50 mL ZnO reaches around 72 %, and with 0.15 g nanorod-ZnO, it reaches nearly 99 %. There was no change in degradation as the amount of nanorod-ZnO was increased to 0.15 g, and it was found to be 99 %.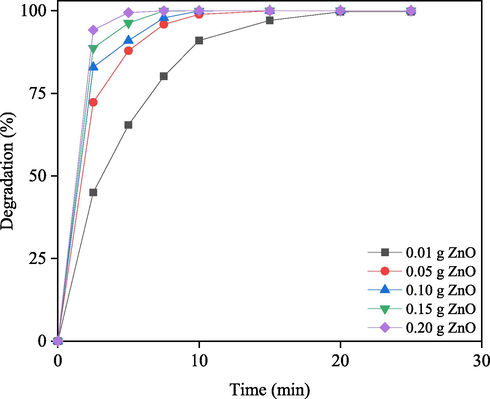
Comparison of photodegradation of RB at different doses of nano-rod ZnO in under solar irradiation. Solution pH: 7.50.
When the influence of irradiation duration is taken into account, the degradation of RB with 0.01 g/50 mL nanorod-ZnO after 15 min of irradiation is about 97 %, and the degradation with 0.05 g/50 mL is around 100 %. About 100 % degradation appears to be achieved using a minimum dose of suspended nanorod-ZnO (0.05 g/50 mL) and a minimum irradiation time (15 min). This is primarily due to the fact that the expected increase in adsorption due to the availability of extra active sites of the adsorbent (Hoffmann et al., 1995). When employing UV/TiO2 to photocatalyze the degradation of direct yellow 12 dye, it was found that the initial degradation rate began to reduce after a specific rise in TiO2 content in the suspension (Toor et al., 2006). The reduction of active sites due to particle agglomeration, as suggested for TiO2, may also be possible for ZnO at higher doses. Only 15 min of solar irradiation is required to completely degrade 2.00 × 10⁻⁵ M RB in a 0.050 g/50 mL nanorod-ZnO suspension. As a result, the use of 0.050 g nanorod-ZnO/50 mL for the current studies seems to be adequate in practical applications.
3.3 Degradation of industrial effluent and contaminated river water
The catalytic effectiveness of the synthesized nanorod-ZnO was also investigated in complex systems. Untreated effluent from local dyeing companies as well as contaminated river water near the dyeing industry were collected and treated with the as-synthesized nanorod-ZnO under solar light irradiation. Photos of industrial effluent and contaminated river water are shown in Fig. 7(a) and 8(a), respectively. Whatman 41 filter paper was used to remove debris and coarse particles from the collected effluent and contaminated river water. Fig. 7(b) depicts filtered effluent water, which is clear in contrast to river water, which is slightly cloudy (Fig. 8b). This is owing to the fact that river water receives contaminated wastewater from a variety of industries.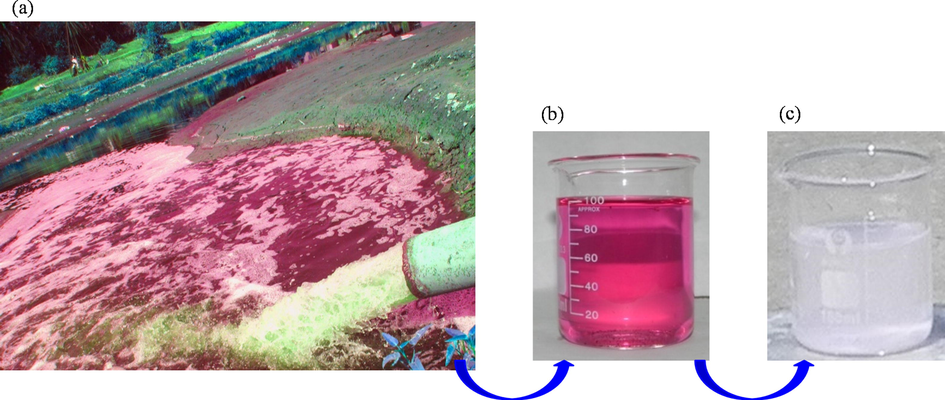
Photograph of untreated industrial effluent (a), filtered effluent (b) and after degradation in the presence of nanorod-ZnO under solar light irradiation for 60 min (c).
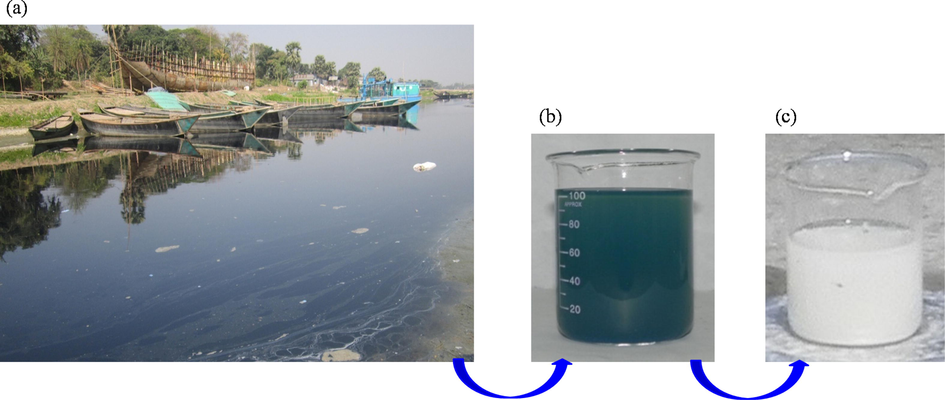
Photograph of contaminated river water (a), filtered contaminated river water (b) and after degradation in the presence of nanorod-ZnO under solar light irradiation for 60 min (c).
This phenomenon may also be explained using the initial spectra of the filtered effluent and river water, as shown in Figs. S10(a) and (b). As demonstrated in Figs. S10(a) and (b), both the industrial effluent and river water have two peaks, however the peaks for river water are broader (Fig. S10(b)). As a result, it is expected to consider that the river water contains various organic dye pollutants. The spectral pattern of the industrial effluent and contaminated river water during degradation also revealed that the composition of organic dyes in the industrial effluent and river water differs. In photodegradation process, the generated free radicals, such as •OH and O2–•, attack the chromophore groups of the dye molecules first, then cleave the -C—C- and/or -C—N-, C—S-, and other bonds, resulting in mineralization of the dye molecules. Fig. 10S(a) indicates a consistent depletion of the intensities of the two peaks centered at 543 and 511 nm for effluent, while the peak for river water centered at 669 nm (λmax) decreased faster than the second peak centered at 615 nm (Fig. S10(b)). The slow depletion of the peak centered at 615 nm with time indicates the existence of various organic dyes such azo-, non-azo etc in the contaminated river water.
Fig. 7(c) and 8(c) depict the effluent and contaminated river water at their final stages after 60 min of degradation in the presence of 0.2 g/50 mL nanorod-ZnO under solar light irradiation, respectively. The spectral pattern of photodegradation of effluent and river water is shown in Fig. S10(a) and (b), respectively. As shown in Fig. S10(a), the molar absorptivity (λmax) of filtered effluent is 543 nm, while that of filtered river water is 669 nm. Photodegradation of the effluent and river water was monitored by keeping the molar absorptivity constant at 543 and 669 nm, respectively.
Fig. 9 shows the degradation of industrial effluent and contaminated river water in the presence of solar light using 0.20 g/50 mL nanorod-ZnO, with 97.78 and 87.58 %, respectively. The initial rate of degradation for contaminated river water is much higher than that of effluent, as illustrated in Fig. 9. This is because, in comparison to the effluent, the presence of relatively high dosage nanorod-ZnO (0.2 g/50 mL) causes a rapid depletion of low concentration dyes present in the river water. As a result, the river water equilibrium time was 30 min, while that was for effluent 45 min. It is reasonable to assume that river water contains a variety of substances that could reduce the catalytic efficiency of nanorod-ZnO. The nanorod-ZnO was also effective at degrading RB in the presence of a 1–4 % sodium chloride solution, as shown in Fig. S11. This result also suggests that the synthesized nanorod-ZnO will be successful in degrading organic contaminants in a complex system.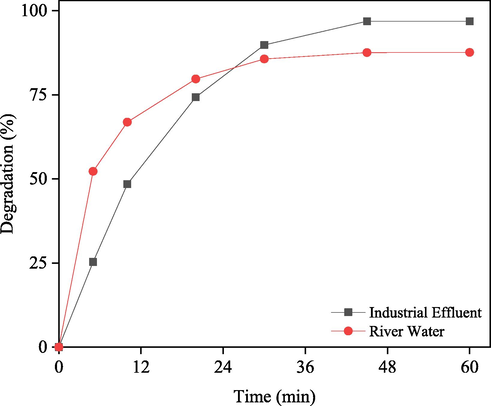
Degradation of industrial effluent and contaminated river water with 0.20 g/50 mL nanorod-ZnO under solar light irradiation.
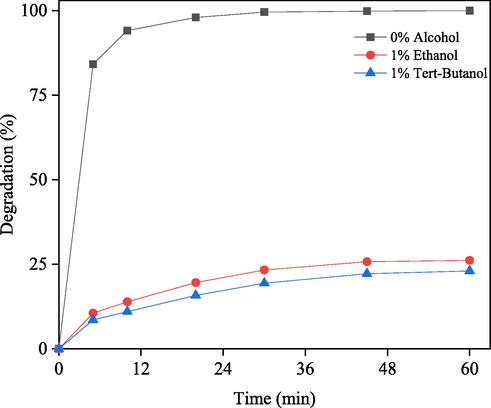
Photodegradation of RB with 0.01 g/50 mL nanorod-ZnO in presence (1 %) and absence of ethanol under solar irradiation. Solution pH: 7.50.
As shown in Table S1, after photodegradation, COD, DO, solution pH, and absorbance reduced, although conductivity increased slightly. Because the presence of dye molecules causes high levels of COD in industrial effluents and contaminated river water, mineralization of the dye molecules reduces COD to a reasonable degree, as observed in this work. The increase in conductivity of the final solution is caused by ions released during degradation and/or mineralization. The decrease in DO following degradation suggests that dissolved oxygen is involved in photocatalytic processes. As shown in Scheme 2, the excited electron is taken up by dissolved molecular oxygen, which creates the oxygen anionic free radical (O2–•), which either participates directly in dye molecule breakdown or transforms to H2O2. The generated H2O2 is subsequently degraded into another reactive oxygen species, such as the hydroxyl radical (•OH), which attacks the various bonds in the dye molecules, causing the organic dye compounds to mineralize.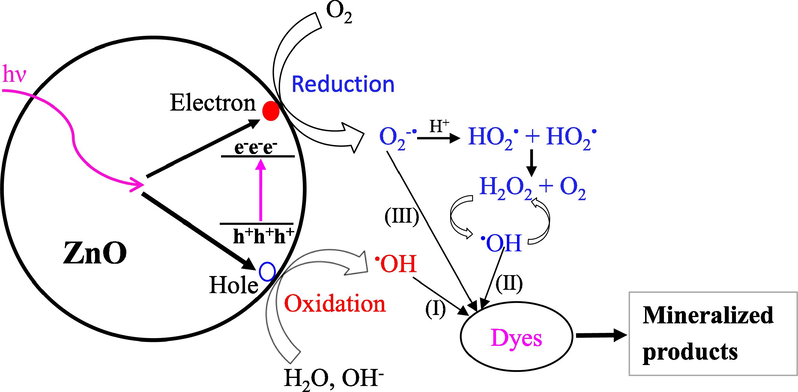
Mechanistic pathways of photodegradation of organic dyes in presence of nano-ZnO.
3.4 Mechanistic studies of the photodegradation process
Metal oxides such as ZnO, TiO2, and others produce free radicals such as •OH, O2–•, and H2O2 when exposed to UV and/or solar light. In the nanorod-ZnO/solar light system, the hydroxyl radical (•OH) is the dominant oxidizing species. The radicals (•OH) are predicted to attack carbon atoms with the chromophore azo-linkage and/or with a high electron density (-C—N) (Rivera-Utrilla et al., 2002). Aromatic substituents with electron-donor groups, such as –NH2, -N-R2, –CH3/-C2H5, are extremely reactive with •OH due to large electron densities on ortho and para carbons, whereas aromatic substituents with electron-withdrawing groups, for example, –COOH, –NO2, are very mildly reactive. Because RB dye’s molecular structure comprises both electron-donating (-N(C2H5)2) and electron-withdrawing (–COOH) groups, •OH-assisted reactions could occur on some favorable sites at first. Because hydroxyl radicals are nonselective, they can attack -C—C-, -C⚌C-, and other carbon atoms, causing mineralization.
Fig. 10 shows the photodegradation of RB with 0.01 g/50 mL nanorod-ZnO under solar light irradiation in the absence and presence of scavengers of hydroxyl free radical such as ethanol and tert-butanol. As shown in Fig. 10, in the absence of ethanol/tert-butanol, about 100 % degradation was achieved, whereas the presence of ethanol (1 %) and tert-butanol (2 %) significantly slowed the degradation of the dye molecules, with only 26 and 23 % degradation occurring in 60 min, respectively.
Scheme 2 depicts the mechanistic pathways for the generation of reactive oxygen species (ROS) in the presence of semiconducting metal oxides like ZnO, TiO2, and others in the presence of light sources such as UV, solar radiation etc. When the energy of the incident radiation is greater than or equal to the Eg of a semiconducting metal oxide like nanorod-ZnO, electrons are driven from the HOMO to LUMO, causing holes in the valence band, as shown in Scheme 2. Both holes and excited electrons move to the nanorod-ZnO surface, where they combine with adsorbed O2 and water molecules to form O2•- and •OH radicals, respectively. The O2•- radical is protonated quickly, forming hydroperoxyl radical (HO2•), which react to generate H2O2 and O2. After then, H2O2 decomposes into •OH radicals, which react with dye molecules like RB to begin the degradation process. The •OH (steps I and II) and O2•- (step III) radicals attack -C—C-, -C—N- etc bonds of RB molecules non-selectively, resulting in the formation of mineralized products like as CO2 and NO3–.
3.5 Reusable nature of the nanorod-ZnO
The synthesized nanorod-ZnO showed excellent recyclability as a catalyst for degrading RB in aqueous system under solar light irradiation, as shown in Fig. 11. The results show that there is no significant difference in RB photodegradation when the as-prepared nanorod-ZnO is used multiple times. After 10 min, photodegradation was found to be 93, 91, 88, and 88 % for as-prepared, 1st re-used, 2nd re-used, and 3rd re-used, respectively. The findings suggest that the synthesized nanorod-ZnO can be used as an effective catalyst in the development of a cost-effective method for depolluting industrial effluents containing organic dyes.![Degradation of RB with 0.01 g/50 mL nanorod-ZnO as-prepared, 1st reused, 2nd reused and 3rd reused under solar light irradiation. [RB] = 2 × 10⁻⁵ M; Solution pH = 7.8.](/content/184/2022/15/10/img/10.1016_j.arabjc.2022.104144-fig13.png)
Degradation of RB with 0.01 g/50 mL nanorod-ZnO as-prepared, 1st reused, 2nd reused and 3rd reused under solar light irradiation. [RB] = 2 × 10⁻⁵ M; Solution pH = 7.8.
4 Conclusions
The surfactant-assisted sol–gel method was shown to be suitable for the synthesis of nanorod-ZnO, whereas the thermal and/or hydrothermal methods mainly produced needle type ZnO clusters. Under solar light irradiation, the synthesized nanorod-ZnO shown excellent photocatalytic activity in the degradation of rhodamine B in aqueous solution. The origin of the intermediate band gap due to crystal defects in nanorod-ZnO could be the main cause of the super photocatalytic activity of the nanorod-ZnO. The significant inhibition of RB dye degradation in the presence of ethanol and/or tert-butanol indicates the generation of hydroxyl free radicals (•OH) during solar light irradiation, which causes the organic dye molecules to degrade. In the presence of 1–4 % NaCl solution, the nanorod-ZnO was also effective at degrading RB. The nanorod-ZnO exhibited reproducible photocatalytic activity as well. The excellent photocatalytic activity of nanorod-ZnO in degrading industrial wastewater and polluted river water showed its promise as a photocatalyst for depolluting industrial wastewater.
CRediT authorship contribution statement
Md. Shahidullah Mahmud: Formal analysis, Data curation. Md. Jahir Raihan: Formal analysis, Data curation. Md. Nazrul Islam: Formal analysis, Data curation. Deepro Sanjid Qais: Formal analysis, Data curation. Nilofar Asim: . Wan Azelee Wan Abu Bakar: Conceptualization. Md. Emran Quayum: Conceptualization. Md. Anwarul Islam: Conceptualization, Supervision. Iqbal Mohammad Ibrahim Ismail: Conceptualization. Ahsan Habib: Conceptualization, Methodology, Investigation, Writing – original draft, Writing – review & editing, Supervision.
Acknowledgement
The authors are greatly acknowledged for financial support to carry out this work for the occasion of 100 years’ centennial of the University of Dhaka, Bangladesh (Development of visible light driven nanoparticles as versatile photocatalysts: an approach to fabricate reusable self-cleaning face masks against COVID-19).
Declaration of Competing Interest
The authors declare that they have no known competing financial interests or personal relationships that could have appeared to influence the work reported in this paper.
References
- Removal of methylene blue on zinc oxide nanoparticles: nonlinear and linear adsorption isotherms and kinetics study. Sigma J. Eng. Nat. Sci.. 2020;38(1):289-303.
- [Google Scholar]
- Acid Dye Removal from Aqueous Solution by Using Neodymium(III) Oxide Nanoadsorbents. Nanomaterials (Basel, Switzerland). 2020;10(3):556.
- [CrossRef] [Google Scholar]
- Enhanced photocatalytic activity of ZnO nanorods grown on Ga doped seed layer. Superlattices Microstruct.. 2015;83:422-430.
- [CrossRef] [Google Scholar]
- Adsorption of Acid Blue 92 Dye from Aqueous Solutions by Single-Walled Carbon Nanotubes: Isothermal, Kinetic, and Thermodynamic Studies. Environ. Process.. 2021;8:869-888.
- [CrossRef] [Google Scholar]
- The determination of pore volume and area distributions in porous substances. I. Computations from nitrogen isotherms. J. Am. Chem. Soc.. 1951;73:373-380.
- [CrossRef] [Google Scholar]
- Hydrothermal growth of ZnO nanostructures. Sci. Technol. Adv. Mater.. 2009;10:013001
- [CrossRef] [Google Scholar]
- Classifications, properties and applications of textile dyes: a review. Appl. J. Environ. Eng. Sci.. 2017;3
- [CrossRef] [Google Scholar]
- Classifications, properties, recent synthesis and applications of azo dyes. Heliyon.. 2020;6(1):e03271.
- [Google Scholar]
- Bi2S3/TiO2 and CdS/TiO2 heterojunctions as an available configuration for photocatalytic degradation of organic pollutant. J. Photochem. Photobiol. A Chem.. 2004;163:569-580.
- [CrossRef] [Google Scholar]
- Adsorption of gases in multimolecular layers. J. Am. Chem. Soc.. 1938;60:309-319.
- [CrossRef] [Google Scholar]
- Azo dyes in clothing textiles can be cleaved into a series of mutagenicaromatic amines which are not regulated yet. Regul. Toxicol. Pharmacol.. 2017;88:214-226.
- [CrossRef] [Google Scholar]
- Electrochemical synthesis of nanostructured ZnO films utilizing self-assembly of surfactant molecules at solid-liquid interfaces. J. Am. Chem. Soc.. 2002;124:12402-12403.
- [CrossRef] [Google Scholar]
- Well-aligned ZnO nanowires with excellent field emission and photo-catalytic properties. Nanoscale. 2012;4:1471-1475.
- [CrossRef] [Google Scholar]
- Band gap engineered zinc oxide nanostructures via a sol–gel synthesis of solvent driven shape-controlled crystal growth. RSC Adv.. 2019;9:14638-14648.
- [CrossRef] [Google Scholar]
- Department of Environment (DoE), Guide for Assessment of Effluent Treatment Plants. Department of Environment, Ministry of Environment and Forest, Bangladesh, 2008, http://old.doe.gov.bd/publication_images/15_etp_assessment_guide.pdf.
- Surfactant-assisted route to synthe-size well-aligned ZnO nanorod arrays on sol gel-derived ZnO thin films. J. Phys. Chem. B. 2006;110:14266-14272.
- [CrossRef] [Google Scholar]
- Low-temperature seeding and hydrothermal growth of ZnO nanorod on poly(3,4-ethylene dioxythiophene):poly(styrene sulfonic acid) Mater. Lett.. 2016;183:197-201.
- [CrossRef] [Google Scholar]
- Recent progress in TiO2-based photocatalysts for hydrogen evolution reaction: A review. Arab. J. Chem.. 2020;13:3653-3671.
- [CrossRef] [Google Scholar]
- Adsorption of Direct Red 80 dye from aqueous solution onto almond shells: efect of pH, initial concentration and shell type. J. Hazard. Mater.. 2008;151:730-737.
- [CrossRef] [Google Scholar]
- Removal of COD and color from Direct Blue 71 azo dye wastewater by Fenton’s oxidation: Kinetic study. Arab. J. Chem.. 2017;10:S1158-S1163.
- [CrossRef] [Google Scholar]
- Enhanced photocatalytic activity of hierarchical flower-like CeO2/TiO2 heterostructures. Mater. Lett.. 2016;175:36-39.
- [CrossRef] [Google Scholar]
- Solvothermal synthesis of hierarchical TiO2 nanostructures with tunable morphology and enhanced photocatalytic activity. Appl. Surf. Sci.. 2016;360:298-305.
- [CrossRef] [Google Scholar]
- Studies on the PEG-assisted hydrothermal synthesis and growth mechanism of ZnO microrod and mesoporous microsphere arrays on the substrate. Cryst. Growth Des.. 2010;2010(10):1500-1507.
- [CrossRef] [Google Scholar]
- Electrochemical Photolysis of Water at a Semiconductor Electrode. Nature. 1972;238:37-38.
- [CrossRef] [Google Scholar]
- ZnO/spiral-shaped glass for solar photocatalytic oxidation of Reactive Red 120. Arab. J. Chem.. 2017;10:S3501-S3507.
- [CrossRef] [Google Scholar]
- The effect of seed layer thickness on alignment and morphology of ZnO nano-rods. Vacuum. 2011;86:101-105.
- [CrossRef] [Google Scholar]
- Laser-enhanced photocatalytic degradation of organic pollutants from water using ZnO semiconductor catalyst. J. Environ. Sci. Health A. 2007;43:70-77.
- [CrossRef] [Google Scholar]
- Tuberose Sticks as an Adsorbent in the Removal of Methylene Blue from Aqueous Solution. Pak. J. Anal. Environ. Chem.. 2006;7:112-115.
- [Google Scholar]
- Photocatalytic decolorization of brilliant golden yellow over TiO2 and ZnO suspensions. J. Saudi Chem. Soc.. 2012;16:423-429.
- [CrossRef] [Google Scholar]
- Decolorization and mineralization of Brilliant Golden Yellow (BGY) by Fenton and photo-Fenton processes. Afr. J. Pure Appl. Chem.. 2012;6:153-158.
- [CrossRef] [Google Scholar]
- Synthesis and characterization of ZnO-TiO2 nanocomposites and their application as photocatalysts. Int Nano Lett. 2013;3:5.
- [CrossRef] [Google Scholar]
- Use of rice husk for the adsorption of congo red from aqueous solution in column mode. Bioresour. Technol.. 2008;99:2938-2946.
- [CrossRef] [Google Scholar]
- Kinetic and equilibrium studies on the removal of acid dyes fromaqueous solutions by adsorption onto activated carbon cloth. J. Hazard. Mater.. 2006;137:344-351.
- [CrossRef] [Google Scholar]
- Environmental Applications of Semiconductor Photocatalysis. Chem. Rev.. 1995;95:69-96.
- [CrossRef] [Google Scholar]
- Kinetics of degradation of Eosin Y by one of the advanced oxidation processes (AOPs)-Fenton’s process. Am. J. Anal. Chem.. 2016;7:863-879.
- [CrossRef] [Google Scholar]
- Adsorption of cationic dyes on dacryodesedulis seeds activated carbon modifed using phosphoric acid and sodium chloride. Environ. Process. 2020;7(4):1151-1171.
- [CrossRef] [Google Scholar]
- Synthesis of Ag and TiO2 modified polycaprolactone electrospun nanofibers (PCL/TiO2-Ag NFs) as a multifunctional material for SERS, photocatalysis and antibacterial applications. Ecotoxicol. Environ. Saf.. 2020;188:109856
- [CrossRef] [Google Scholar]
- Antibacterial, Antiviral, and Self-Cleaning Mats with Sensing Capabilities Based on Electrospun Nanofibers Decorated with ZnO Nanorods and Ag Nanoparticles for Protective Clothing Applications. ACS Appl. Mater. Interfaces. 2021;13:5678-5690.
- [CrossRef] [Google Scholar]
- Plasmonic coinage metal—TiO2 hybrid nanocatalysts for highly efficient photocatalytic oxidation under sunlight irradiation. New J. Chem.. 2015;39:5966-5976.
- [CrossRef] [Google Scholar]
- A novel maskless approach towards aligned, density modulated and multi-junction ZnO nanowires for enhanced surface area and light trapping solar cells. Nanotechnology. 2010;2010(21):315602
- [CrossRef] [Google Scholar]
- Zno/NiO coated multi-walled carbon nanotubes for textile dyes degradation. Arab. J. Chem.. 2017;11:880-896.
- [CrossRef] [Google Scholar]
- Nitrogen/Palladium-Co-doped TiO2 for Efficient Visible Light Photocatalytic Dye Degradation. J. Phys. Chem. C. 2011;115:22110-22120.
- [CrossRef] [Google Scholar]
- Textile chemicals: environmental data and facts. Berlin: Springer; 2004.
- Degradation of wastewaters containing organic dyes photocatalysed by zinc oxide: A review. Desalin. Water Treat.. 2012;41:131-169.
- [CrossRef] [Google Scholar]
- Synthesis and luminescence properties of ZnO nanostructures produced by the sol-gel method. J. Cryst. Growth. 2008;310:599-603.
- [CrossRef] [Google Scholar]
- A facile approach towards ZnO nanorods conductive textile for room temperature multifunctional sensors. Sens. Actuators B: Chem.. 2010;151:121-126.
- [CrossRef] [Google Scholar]
- Green synthesis of tin dioxide nanoparticles using Camellia sinensis and its application in photocatalytic degradation of textile dyes. Optik. 2021;166259
- [CrossRef] [Google Scholar]
- In situ synthesis of ZnO nanostructures on a zinc substrate assisted with mixed cationic/anionic surfactants. J. Alloys Compd.. 2009;2009(477):364-369.
- [Google Scholar]
- Photocatalytic water splitting using semiconductor particles: History and recent developments. J. Photochem. Photobiol. C. 2011;12:237-268.
- [CrossRef] [Google Scholar]
- New Non-Oxide Photocatalysts Designed for Overall Water Splitting under Visible Light. J. Phys. Chem. C. 2007;111:7851-7861.
- [CrossRef] [Google Scholar]
- Enhanced optical and field emission properties of CTAB-assisted hydrothermal grown ZnO nanorods. Appl. Surf. Sci.. 2008;254:7266-7271.
- [CrossRef] [Google Scholar]
- Enhanced photoluminescence and hetero-junction characteristics of pulsed laser deposited ZnO nanostructures. Appl. Surf. Sci.. 2017;418:335-339.
- [CrossRef] [Google Scholar]
- ZnO for application in photocatalysis: From thin films to nanostructures. Mater. Sci. Semicond. Process.. 2017;69:44-51.
- [CrossRef] [Google Scholar]
- A mechanism for enhanced hydrophilicity of silver nanoparticles modified TiO2 thin films deposited by RF magnetron sputtering. Appl. Surf. Sci.. 2009;255:6715-6720.
- [CrossRef] [Google Scholar]
- Morphology-Controlled Synthesis of CeO2 Microstructures and Their Room Temperature Ferromagnetism. J. Mater. Sci. Technol.. 2017;33:444-451.
- [CrossRef] [Google Scholar]
- Use of diffuse reflectance spectroscopy for optical characterization of un-supported nanostructures. Rev. Mexic. Fisica. 2007;53:18-22.
- [Google Scholar]
- Automated method for the determination of the band gap energy of pure and mixed powder samples using diffuse reflectance spectroscopy. Heliyon. 2019;5(4):e01505.
- [Google Scholar]
- Removal of azo and anthraquinone reactive dyes from industrial wastewaters using MgO nanoparticles. J. Hazard. Mater.. 2009;168:806-812.
- [CrossRef] [Google Scholar]
- Zinc oxide-mediated photocatalytic decolorization of Ponceau S in aqueous suspension by visible light. Int. Nano Lett.. 2012;2:30.
- [CrossRef] [Google Scholar]
- Decolorization of Diazo Dye Ponceau S by Fenton Process. Pak. J. Anal. Environ. Chem.. 2013;14:44-50.
- [Google Scholar]
- Energy Efficient UV-LED Source and TiO2 Nanotube Array-Based Reactor for Photocatalytic Application. Ind. Eng. Chem. Res.. 2011;50:7753-7762.
- [CrossRef] [Google Scholar]
- Characterization and optimization of spectrophotometric colour removal from dye containing wastewater by coagulation-focculation. Pol. J. Chem. Technol.. 2018;20:49-59.
- [CrossRef] [Google Scholar]
- Ultrasonic sensing device with ZnO piezoelectric nano-rods by selectively electrospraying method. Sens. Actuator A Phys.. 2014;216:318-327.
- [CrossRef] [Google Scholar]
- Effect of pyrolysis temperature on structural, microstruc-tural and optical properties of nanocrystalline ZnO powders synthesised by ultrasonic spray pyrolysis technique. J. Exp. Nanosci.. 2011;6:311-323.
- [CrossRef] [Google Scholar]
- Growth of ZnO nanorods via low temperature hydrothermal method and their application for Hydrogen production. Mater. Today: Proc.. 2017;4:6326-6330.
- [CrossRef] [Google Scholar]
- Synthesis of ZnO nano-rods via chemical bath deposition method: The effects of physicochemical factors. Ceram. Int.. 2016;42:173-184.
- [CrossRef] [Google Scholar]
- The effect of sodium dodecyl sulfate (SDS) and cetyltrimethylammonium bromide (CTAB) on the Properties of ZnO synthesized by hydrothermal method. Int. J. Mol. Sci.. 2012;13(10):13275-13293.
- [CrossRef] [Google Scholar]
- Detoxification of azo dyes in the context of environmental processes. Chemosphere. 2016;155:591-605.
- [CrossRef] [Google Scholar]
- Chemical Vapor Synthesis of Zinc Oxide Nanoparticles: Experimental and Preliminary. J. Phys. Chem. C. 2009;113:19845-19852.
- [CrossRef] [Google Scholar]
- Growth of ZnO nanorods on glass substrate by chemical bath deposition. Proc. Mater. Sci.. 2015;11:364-369.
- [CrossRef] [Google Scholar]
- Sol-gel synthesis and characterization of nanocrystalline ZnO powders. J. Alloys Compd.. 2005;397:L1-L4.
- [CrossRef] [Google Scholar]
- Degradation of naphthalenesulfonic acids by oxidation with ozone in aqueous phase. Phys. Chem. Chem. Phys.. 2002;4:1129-1134.
- [CrossRef] [Google Scholar]
- Enhanced photocatalytic activity of ZnO/CuO nano-composite for the degradation of textile dye on visible light illumination. Mater. Sci. Eng. C. 2013;33:91-98.
- [CrossRef] [Google Scholar]
- Visible light degradation of textile efuent using novel catalyst ZnO/γ-Mn2O3. J. Taiwan Inst. Chem. Eng.. 2014;45:1910-1917.
- [CrossRef] [Google Scholar]
- Exploiting the interparticle electron transfer process in the photocatalysed oxidation of phenol, 2-chlorophenol and pentachlorophenol: Chemical evidence for electron and hole transfer between coupled semiconductors. J. Photochem. Photobiol. A Chem.. 1995;85:247-255.
- [CrossRef] [Google Scholar]
- Biosynthesis of ZrO2 nanoparticles from Ficus benghalensis leaf extract for photocatalytic activity. J. Mater. Sci: Mater. Electron.. 2018;29:14055-14064.
- [CrossRef] [Google Scholar]
- One-dimensional ZnO nanorods doped with neodymium for enhanced resorcinol degradation under sunlight irradiation. Chem. Eng. Commun.. 2018;205:311-324.
- [CrossRef] [Google Scholar]
- Investigation of the flocculation of colloidal suspensions by controlling adsorbed layer microstructure and population balance modeling. Chem. Eng. Res. Des.. 2005;83:905-914.
- [CrossRef] [Google Scholar]
- Anionic surfactant-assisted hydrothermal synthesis of high-aspect-ratio ZnO nanowires and their photoluminescence property. Mater. Lett.. 2006;60:2777-2782.
- [CrossRef] [Google Scholar]
- Electrochemical tailoring of lamellar-structured ZnO films by interfacial surfactant templating. Langmuir. 2005;21:9618-9624.
- [CrossRef] [Google Scholar]
- Photocatalytic degradation of direct yellow 12 dye using UV/ TiO2 in shallow pond slurry reactor. Dyes Pigm.. 2006;68:56-60.
- [CrossRef] [Google Scholar]
- The effect of surfactants on the morphology and optical properties of precipitated wurtzite ZnO. Mater. Lett.. 2009;63:1489-1492.
- [CrossRef] [Google Scholar]
- Valerio, A., Morelhão, S.L., 2019. Usage of Scherrer’s formula in X-ray diffraction analysis of size distribution in systems of monocrystalline nanoparticles. 10.13140/RG.2.2.19196.08327.
- Zinc oxide nanostructures: Growth, properties and applications. J. Phys. Condens. Matter. 2004;16:R829.
- [CrossRef] [Google Scholar]
- Crystallographic, optical and magnetic properties of Co-doped ZnO thin films synthesized by sol gel route. Cryst. Res. Technol.. 2012;47:423-428.
- [CrossRef] [Google Scholar]
- Formation of hierarchical Bi2MoO6/ln2S3 S-scheme heterojunction with rich oxygen vacancies for boosting photocatalytic CO2 reduction. Chem. Eng. J.. 2022;429:132456
- [CrossRef] [Google Scholar]
- Photocatalytic performances of ZnO nanoparticle film and vertically aligned nanorods in chamber-based micro-fluidic reactors: Reaction kinetics and flow effects. Appl. Catal. B Environ.. 2017;209:468-475.
- [CrossRef] [Google Scholar]
- Synthesis of cup-like ZnO microcrystals via a CTAB-assisted hydrothermal route. Mater. Chem. Phys.. 2009;117:422-424.
- [CrossRef] [Google Scholar]
Appendix A
Supplementary data
Supplementary data to this article can be found online at https://doi.org/10.1016/j.arabjc.2022.104144.
Appendix A
Supplementary data
The following are the Supplementary data to this article:Supplementary data 1
Supplementary data 1


