

Systematic investigation of MAX phase (Ti3AlC2) modified polyethersulfone membrane performance for forward osmosis applications in desalination
⁎Corresponding author. qusay.f.abdulhameed@uotechnology.edu.iq (Qusay F. Alsalhy)
-
Received: ,
Accepted: ,
This article was originally published by Elsevier and was migrated to Scientific Scholar after the change of Publisher.
Abstract
The current work presented an in-depth investigation of the design and fabrication of thin film membranes for desalination applications by forward osmosis (FO). This includes manipulating the substrate membrane structure aiming to optimize the final thin film composite membrane characteristics. In this context, the MAX phase (Ti3AlC2) as a 2D material has been harnessed to impart novel desirable traits on the prepared membrane. MAX phase has been impregnated in two disparate concentrations and three different scenarios including the substrate membrane and the polyamide layer in both the aqueous and organic phases during the interfacial polymerization. Membranes were comprehensively characterized by a series of experimental tools and methodologies including Atomic Force Microscopy, Scanning Electron Microscopy, Contact Angle, Fourier-transform infrared spectroscopy, pore size and porosity. Results disclosed that substrate membrane structure has a pivotal impact on final TFC/TFN membrane performance. Besides, the MAX phase (Ti3AlC2) could significantly enhance the morphological characteristics of the membrane and ultimately the performance in terms of water flux and reverse salt flux based on the content and the way impregnated. The permeation properties of the composite membranes were significantly superior to the pure PES membrane and the mean pore size also increased with the addition amount of MAX phase (Ti3AlC2) increased.
Keywords
Forward osmosis
Thin film composite
MAX phase Ti3AlC2
Membrane modification
Desalination

1 Introduction
The rapid growth of the world's population, coupled with ongoing human contamination of water resources and climate change, poses an existential threat to the world's water environment. Potable water is one of the most valuable resources for supporting human life on Earth. Even though water makes up about 75 % of the surface area of the planet, only 1 % of the water is fresh; as the majority of the water is salty or frozen (Al-Musawy et al., 2023). In this context, over the past half-century, seawater desalination and water treatment technologies have made enormous strides. Diverse water treatment and desalination methods have proven to be highly qualified to bestow workable solutions to the aforementioned issues. The two major seawater desalination techniques being used to meet the enormous demand for freshwater are distillation and membrane separation (Alayan et al., 2021). However the thermal techniques' overstrain costs increase the need for process identification, control, and optimization. It is requisite to harness cutting-edge strategies for controlling and optimizing the prevailing desalination systems since the nature of the desalination system is complicated in terms of factors that determine the cost of building a plant and performance instability (Huang et al., 2021). Meanwhile, membrane separation technique has emerged as a competitive candidate based on their high efficiency, low footprint, reasonable cost, and low chemical usage. However, the main obstacle facing membrane technology, on the other hand, is membrane fouling, which cuts down membrane flux and life span (Jhaveri and Murthy, 2016).
Reverse osmosis (RO) is a liquid-based membrane technology that is primarily harnessed to desalinate seawater (Kalash et al., 2020). to produce purified water, the RO process utilizes hydraulic pressure to overcome the osmotic pressure of saline water (Kadhom et al., 2019). The forward osmosis (FO) process, on the other contrary, harnesses natural osmotic pressure as the driving force to carry out the mass transfer. The fact that FO operates under virtually no pressure is the major potential benefit. Particularly, FO necessitates a highly concentrated draw solution to generate the necessary osmotic pressure to drive pure water from the feed solution to the draw solution side of the membrane The FO process has additional benefits over other filtration process types, including high rejection for salty waters and other complicated water resources, low fouling, and the use of relatively simple equipment (Al-Furaiji et al., 2018). Furthermore, FO has been recognized as a potentially efficient and affordable substitute for wastewater treatment technology or as a relatively advanced pretreatment (Al-Musawy et al., 2023). Based on the outstanding potential of the FO process, it has easily split the path in wide-spectrum applications. The existence of an appropriate FO membrane has a significant impact on the expansion of FO activities. These appropriate membranes ought to have high water flux, low reverse salt flux, controlled concentration polarization, and low fouling (Alihemati et al., 2020; Aljumaily et al., 2020). Although the FO process itself does not require energy, another step is required to separate the freshwater from the draw solution, which normally requires energy (Shaffer et al., 2015).
Parallel to that, since the first thin film (TFC) was developed, a substantial amount of work has been directed at improving TFC membranes in an effort to accomplish a milestone in industrial membrane expansion for desalination applications. TFC membrane is constructed by interfacial polymerization (IP) of an organic phase-liquid phase system to form a thin (100–1000 nm) selective polyamide layer (PA) rendered on a microporous support substrate membrane. This standard polymeric membrane provides excellent solute rejection and high water permeability making it the topic of intensive research in recent years. The active and support layers and the support layer of TFC membranes can be produced separately using a wide selection of materials and techniques, which can enhance the TFC membrane's performance. Only a few of the factors that could influence the formation of the support layer include the selection of an appropriate polymer material with varying concentrations, an appropriate solvent (for making the dope solution), the medium of precipitation, and the use of various additives (Alihemati et al., 2020; Kadhum et al., 2022; Song et al., 2021). TFC membranes are typically susceptible to fouling by numerous contaminants due to their hydrophobic nature.
Innovative materials and surface modification techniques were harnessed to design what is thought to be the next generation of TFC membranes. One of the most recent pragmatic approaches in this research field is to revise the performance characteristics of TFC by integrating the desirable features of nanomaterials (NMs) into the thin PA layer. The term “Thin Film Nanocomposite (TFN)” refers to the incorporation of nanostructured materials within or on the top surface of a PA layer and was first coined in 2007 (Darabi et al., 2017). Since then, a variety of NMs have been documented in the literature, all of which demonstrate an advancement in TFN membrane features. The enhancement was not only aimed at improving the antifouling characteristics of membranes but also demonstrated an exceptional capacity to cope with the trade-off relationship between selectivity and permeability (Al-Ani et al., 2020). These materials could be dispersed within the aqueous or organic phases during the PA layer fabrication reaction, or attached to the TFC surface through chemical bonding agents. However, gathering between a stable PA layer and defect-free is vital for the continued reliability and selectivity of any 2D materials membrane.
Concerning the nanomaterials used in membrane research, the exceptional electrical, optical, and mechanical properties of 2D materials have attracted attention. Due to their advantages in processing efficiency, adjustable aperture, and physicochemical stability, 2D materials have a significant impact on the semiconductor, electrochemistry, environmental, and energy industries (Yang et al., 2020). Due to its appealing properties, Ti3C2Tx in particular has been used frequently to modify polymeric membranes for wastewater treatment, desalination, and gas separation (Wang et al., 2018; Rasool et al., 2019; Shen et al., 2019). High hydrophilicity, metallic conductivity, adsorption capability, chemical resistance, high strength, and rigidity are some of these attractive features (Alfahel et al.., 2020; Salim et al., 2019; Sadidi et al., 2023).
In this investigation, Max Phase (Ti3AlC2) was individually dispersed in the support polymeric membrane matrix as well as in each of the aqueous and the organic phases of the IP process, to integrate them in the constructed PA layer.
In this work, PES membranes was fabricated at various polymer concentrations using the phase inversion method. The manufactured PES served as a support for the preparation of TFC-FO in the desalination of water where a polyamide selective layer was synthesized on the fabricated PES using the IP reaction. The performance of the TFC membranes was examined in the FO process in a lab-scale setup. Also, the impact of adding MAX phase (Ti3AlC2) to the substrates, MPD solution, and TMC was studied. The substrate and the composite membranes were characterized using atomic force microscopy (AFM), Fourier transform infrared (FTIR), and scanning electron microscopy (SEM) techniques. To the best of our knowledge, this is the first attempt to study the effect of adding MAX phase (Ti3AlC2) particles on the FO membranes. Max Phase (Ti3AlC2) was individually dispersed in the support polymeric membrane matrix as well as in each of the aqueous and the organic phases of the IP process, to integrate them in the constructed PA layer.
2 Materials and methods
2.1 Materials
Polyether sulfone (PES) (MW = 58000 g/mol) was obtained from Solvay Advanced Polymer, (Belgium). Hexane (n-Hexane, 95 %) was obtained from Gain land Chemical Co. Ltd (UK). N,N-Di methyl acet amide (DMAc) (MW = 87.12 g/mol), MAX phase (Ti3AlC2) (Particle size 0.7 µm), Sodium Chloride, M-phenylene diamine monomer (MPD, >98 %), trimesoyl chloride monomer (TMC, >99.85 %) were all purchased from Sigma‐Aldrich (Shanghai, China). All chemicals were analytical grades and no further purification was required.
2.1.1 Fabrication of PES support layer
Three concentrations of polyether sulfone (PES) membranes were synthesised by the classical non induced phase separation method (NIPS). PES polymer (16, 17, and 18) wt% were individually dissolved in di methyl acetamide (DMAC) solvent in 25 °C and vigorously mixed overnight by a magnetic stirrer (Heidolph, Germany) with 60 kHz to achieve a complete dissociation. The polymeric casting solution was degassed under a vacuum and cast on a clean glass substrate using an automatic thin film applicator. The casting was conducted with a clearance gap of 200 µm and at room temperature. The thin film was then directly placed in a water bath for coagulation. After about one minute, the membrane detached from the glass substrate refereeing to phase separation completion. The membranes were then thoroughly rinsed with DI water, inspected under light for defects and stored in DI water containers ready for characterization.
A series of performance characterization was conducted and based on results, and the 16 wt% PES membrane (M1) was chosen for the subsequent TFC membrane fabrication (Table S1). Herein, four different concentrations (0.025, 0.05, 0.075, and 0.1) wt% of the MAX phase (Ti3AlC2) were impregnated within the PES membrane matrix as follows; 16 wt% PES was initially dissolved in DMAc and vigorously mixed overnight with 60 kHz and the MAX phase (Ti3AlC2) was then added to the casting solution and further mixed with 60 kHz for another hour. The casting solution was ultrasonicated for an hour, then degassed, casted, coagulated and stored in DI water containers, exactly as illustrated earlier for control PES membrane fabrication. The composition of all membranes prepared (M7, M8, M9 and M10) were given in Table S1.
2.1.2 Synthesis of TFC and addition of MAX phase to the membranes
TFC membranes (M4–M6) and (M11–M22) were synthesized by rendering a polyamide (PA) layer on the top surface of the 16 wt% PES membrane (M1). The PA was constructed by the interfacial polymerisation (IP) of two monomers; m-phenylene diamine (MPD) and trimesoyl chloride (TMC). The substrate membranes were initially soaked for 2 min in a 2 wt% MPD aqueous solution. Then, the membrane was taken out and the top surface was wiped with a clean filter paper to remove the excessive aqueous solution drops. Following that, the membrane was taped on a glass substrate and soaked in a container having 0.15 wt% of TMC-hexane solution for 30 s. At this stage, the IP process has occurred between the two monomer solutions and forms the TFC membrane (Table S2). The TFC membrane was then rinsed with n-hexane to eliminate any unreacted monomers. TFC Flat sheet membranes were then dried for 5 min at room temperature and stored in DI water.
Meanwhile, three types of TFC membranes were prepared in the current work. In the first type, as shown in Table S3 the MAX phase was added to the substrate as described earlier, and PA without any MAX phase was constructed on the surface. In the second and third types, the MAX phase was individually added to the aqueous phase and organic phases during the formation of the PA layer. Briefly, an appropriate amount (0.025, 0.05, 0.075, and 0.1 g) of MAX phase was dispersed in the MPD aqueous solution for 2 min. The membrane is then soaked, dried and reacted with TMC organic phase as described in the TFC membrane preparation, as shown in Table S4. Similarly, for the third type, the same procedure was adopted to prepare the TFC membranes but here, the MAX phase was dispersed in the organic phase instead of the aqueous phase as shown in Table S5.
2.2 Membrane characterization
The morphological changes on the surface and cross-section of all membranes have been visualized by scanning electron microscopy (SEM) (Mira-3 FEG SEM, Tescan Orsay Italy, ITM CNR). Initially, the specimens were fractured in liquid nitrogen and sputter coated with a thin layer of gold.
An atomic force microscope (AFM, Bruker multimode 8 with Nanoscope V controller, Model TAP150, Burker) was harnessed to scan the surface topography of the samples.
The composition and functional groups of the membrane samples were identified by Fourier-transform infrared spectroscopy (FTIR) (PerkinElmer, universal ATR sampling). Wide range (4000–400 cm−1) spectra were recorded.
The hydrophilicity of the membranes was conducted using the sessile drop method. 3 µl of DI water drops were placed on a flat membrane surface and the contact angle between the membrane surface and the drop was captured. For each sample, at least 10 drops at different locations were measured and the average value was recorded.
The gravimetric technique was utilized to determine the membrane's porosity. 2 cm * 2 cm samples of the membranes were cut and their dry weight was measured. The membranes were then soaked in DI water for 1 hr and excessive water drops were removed by a tissue and their weights were recorded. The porosity (ε) is the volume of the pores divided by the sum of the membrane's volumes. The porosity of the sheets was calculated using the following Eq. (1) (Ursino et al., 2020; Al-Ani et al., 2020):
The mean pore radius (rp, nm) of membrane substrates was calculated using the Guerout-Elford-Ferry Equation (Kadhim et al., 2020).
2.2.1 FO testing rig
A lab-scale filtration setup was used to test the intrinsic permeability parameters of the membranes, which identify how water and salt move across this layer. These parameters are water permeability, salt permeability, and salt rejection. The water flux refers to the water molecules that pass through a membrane from the feed side to the draw side. A larger water flux denotes a membrane's better permeability. Similarly, the reverse salt flux (RSF) is the amount of draw solute that will pass through a membrane backwards from the draw side to the feed side during a FO operation. A low RSF implies a high membrane interception capability. The schematic diagram of the FO system is illustrated in Fig. 1. The system comprises a FO membrane cell with external dimensions of 110 × 55 × 100 mm, internal dimensions of 46 × 92 mm, and 2.3 mm for the slot depth. The feed and draw solutions are separated by the cell's internal membrane. Two 1 L stainless steel tanks were used for the feed solution (FS) and draw solutions (DS). The feed and draw solutions were circulated throughout the system using two gear pumps (DP-75). The flow rates of the FS and DS were determined using two flow meters while the water flux in the FO system was measured using a digital balance. The same tanks were used to recycle the permeate from the FO cell. Each experiment lasted for about 120 min. Flowmeters were used to regulate the feed and draw solution flow rates. When the feed solution's volume changes (v) are divided by the module's effective membrane area (A) and a certain experimentation time (t), the result is the water flux Jw, which is determined by the following equation (Wang, 2022):
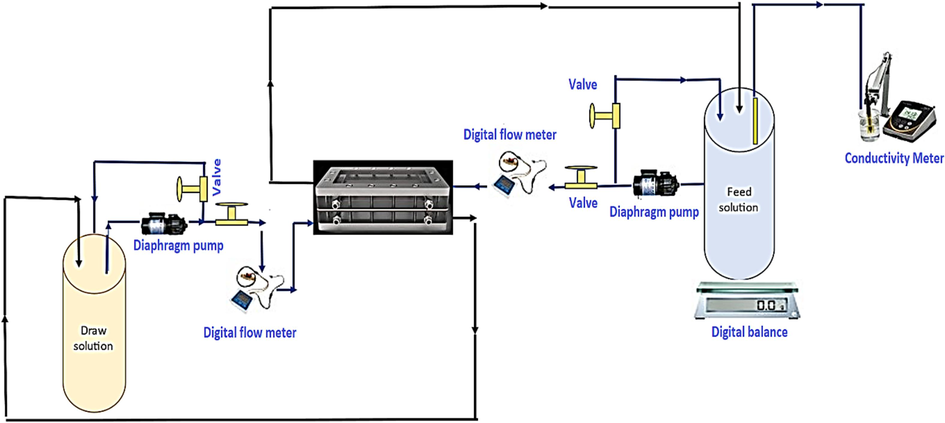
- Schematic diagram of the FO test unit.
Reverse salt flux (Js) was estimated according to the following equation:
3 Results and discussion
3.1 Scanning electron microscope (SEM) of the substrate membrane
The morphological changes in the surface and cross-section of the substrate, TFC membranes have been observed by SEM and depicted in Figs. 2 and 3. Fig. 2A and B displayed the cross-sectional and surface images of the control substrate membrane (M1), respectively. As could be seen, a typical structure of the PES membrane was observed in the cross-section image where a thin active layer and small thin micropores are supported on huge interconnected macrovoids. Meanwhile, a smooth top surface with some small pores could be detected. Adding the MAX phase to the PES polymeric matrix has induced several morphological changes in the cross-section. The number of micropores has significantly increased while smaller macrovoids were formed at the bottom surrounded by a spongey structure (Fig. 2D). Likewise, the number of pores has significantly increased as could be seen in Figs. 2E and S4 explain the surface section of B, E and H. This could be induced by the enhanced hydrophilicity associated with MAX phase incorporation in the PES polymeric matrix. Triplicating the content of the MAX phase (0.075 g) in the PES membrane substrate produced a denser membrane structure where much thinner micropores and sponge-like structures were formed (Fig. 2F). This agreed with the preceding literature and attributed that to the enhanced casting solution viscosity due to the presence of 2D MAX phase (Salehi et al., 2020). Increasing the casting solution induces a delayed mixing-demixing process during the NIPS and produces a dense membrane structure with a more sponge-like structure at the bottom of the membrane (Amini et al., 2019). Meanwhile, constructing the polyamide layer on the surface of the membranes was confirmed by the typical leaf-like structure as observed in Fig. 2C, F and I. The PA was uniform and homogenously rendered on the PES substrate with a defect-free structure for all samples. Fig. S3 explain the cross section of C, F and I.
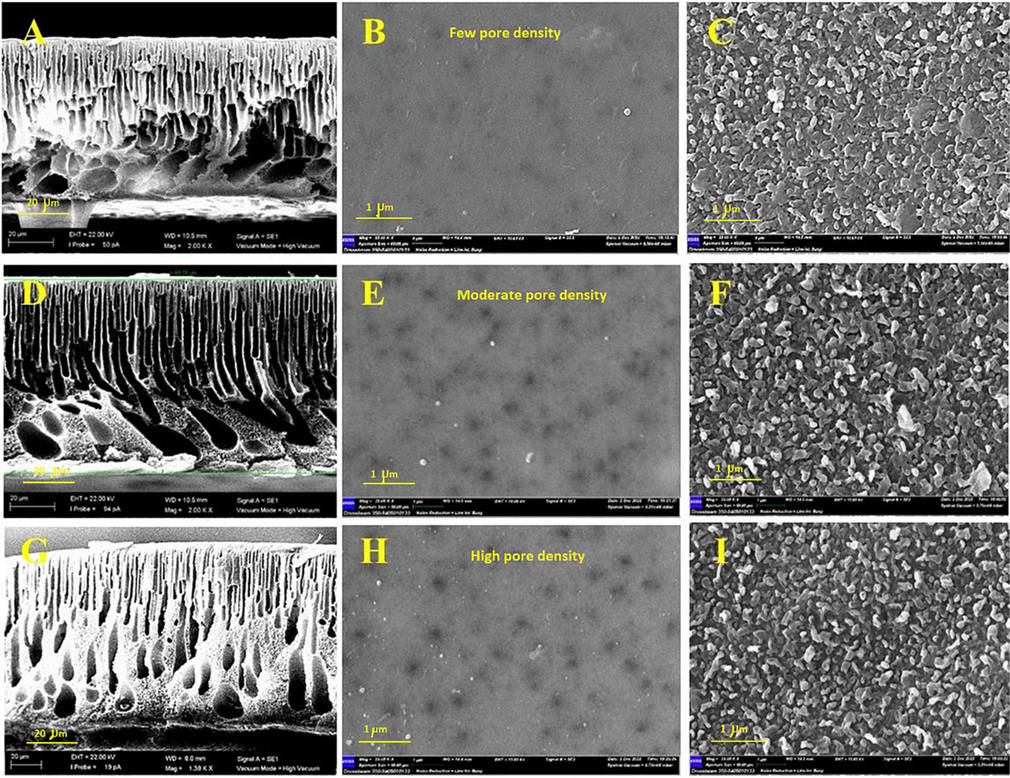
- SEM surface and cross-sectional images of (A) M1 cross-section, (B) M1 surface, (C) M4 surface, (D) M7 cross-section, (E) M7 surface, (F) M11 surface, (G) M9 cross-section, (h) (M9) surface, (I) M13 surface.
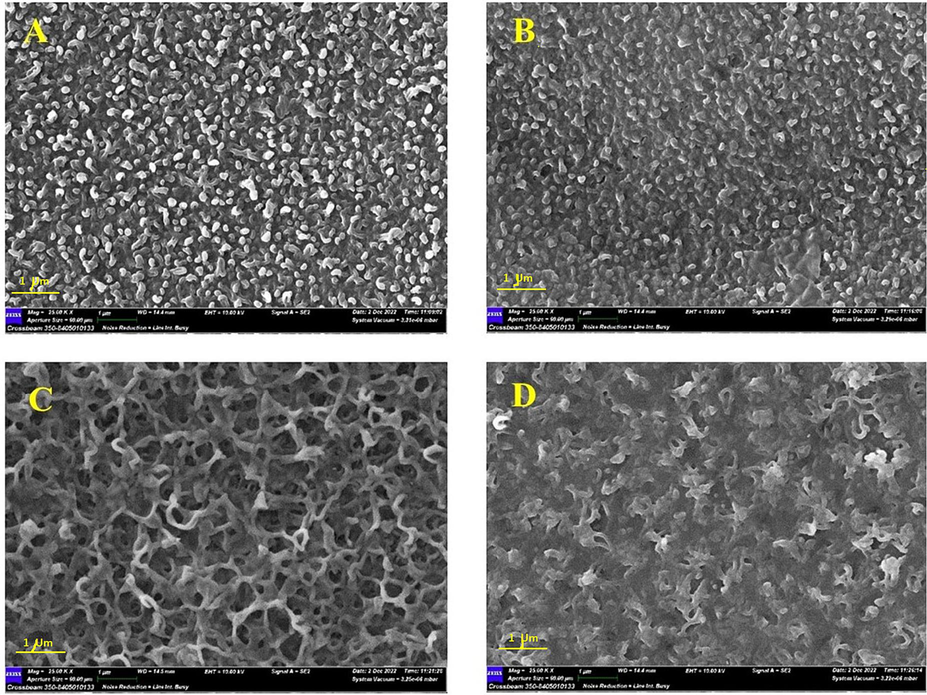
- SEM surface images showing the impact of MAX phase addition in the aqueous and organic phase during the PA formation: (a) M15, (b) M17, (c) M19 and (d) M21.
In the meantime, incorporating of MAX phase within the PA layer during the IP process manifested a distinguished variation in their appearance depending on whether the material were added to the aqueous or organic phase. Fig. 3A and B depicted the SEM surface images after adding the MAX phase to the aqueous phase at 0.025 and 0.075 g, respectively. As could be seen, the structure of PA was still displaying the leaf-like structure but slightly was denser and more compacted at higher MAX phase content. However, adding the MAX phase into the organic phase manifested an apparent discrepancy in the PA structure (Fig. 3). The PA structure had a sponge-like appearance with a non-uniform porous structure at a low (0.025 g) MAX phase (Fig. 3C). This observed structure turned to a more dense spongy structure upon increasing the content to 0.075 g in the aqueous phase (Fig. 3D). The reason for this is attributed to the interaction that took place during the IP process. The addition of the MAX phase to the aqueous phase (MPD) stimulated the reaction between MPD and TMC, and ultimately, increased the strength and thickness of the PA layer. In contrast, when they were added to the organic phase, it could be concluded that these interactions were inhibited by the addition of the MAX phase. The quantity of fillers in the aqueous phase and membranes with a high loading % of the MAX phase, which had a thinner PA layer, both influenced how quickly MPD monomers diffused into the organic phase (Bagherzadeh et al., 2020).
3.2 Chemical functional groups of membranes (Fourier-transform infrared (FT-IR) spectroscopy)
Fourier-transform infrared (FT-IR) spectroscopy has been devoted to examining membrane composition following the 2D MAX phase incorporation. The amount of infrared light radiation (IR) that will be absorbed by a sample of materials is calculated using this technique. The materials’ wavelengths and the chemical bonds and functional groups of their molecular components have all been recognized as each functional group is represented by a wavelength. Herein, the FTIR was used to compare the chemical characteristics of the PES membrane before and after MAX phase were added, and before and after IP reaction occurred. The FT-IR spectra of the neat PES, polyamide layer (TFC) and PES/MAX phase membranes, have been detected within the spectrum 4000–650 cm−1 (Fig. S1). For the 16 % PES flat sheet membranes, it is noticeable that the PES polymer characteristics produced peaks which starts with the peak at 701.751 cm−1 attributed to phenyl groups and ends with the peak (3365.97 cm−1) that represents the root (O—H) stretching alcohol intermolecular bonded (Sadidi et al., 2023). Additionally, it contains many roots between them such as (1578.69 cm−1) which represents (C⚌O) stretching peak. The peak (1407.94 cm−1) was attributed to C⚌C aromatic ring stretching (Abbas et al., 2022). The peaks at1322.81 cm−1,1298.78 cm−1, 1241.54 cm−1, 1150.43 cm−1 were ascribed to O—H bending phenol, nitro compound, C—O stretching alkyl aryl ether and S⚌O stretching sulfone, respectively (Abbas et al., 2022). The peaks (1105.57 cm−1) and (1072.84 cm−1) are characterized by the symmetric and asymmetric stretching vibrations unique to the sulfone group (Sadidi et al., 2023). Also, the spectra at (872.77 cm−1) are C—H bending 1,2 disubstituted, while (836.80 cm−1), (797.93 cm−1) and (718.08 cm−1) are C⚌C bending alkene trisubstituted. In comparison between the PES substrate spectrum and the TFC membrane spectrum, two roots absorption peaks at 1611.85 cm−1 and 1543.83 cm−1 associated with the polyamide skin layer are observed in the spectra of all TFC membranes as shown in Fig. S1(b), which can correspond to the amide I band (C⚌O stretching), aromatic ring breathing, and the amide II band (C—H stretching), respectively (Darabi et al., 2017). So, this establishes the NH2 amide layer's existence. Also, it can be noted when adding the MAX phase to the polymer, in the case of concentration (0.025), the radical appears (3430.96 cm−1) instead of the peak (3365.97 cm−1) that represents the apparent presence of —OH with solid hydrogen bonding on the surface of (Ti3AlC2) membrane (Sadidi et al., 2023). And when the concentration of the MAX phase is increased, the peak (3430.96 cm−1) disappears, as the range is limited between (1578.87–701.72) cm−1. In the case of adding MAX phase (Ti3AlC2) (0.025) to the MPD concentration, the peak (1611.86 cm−1) appears and it is representing the amide I band (C⚌O stretching) (Darabi et al., 2017). Finally, the peak (627 cm−1) appears and it representing the bond (Ti—C) (Abood et al., 2023).
3.3 Atomic force microscopy AFM
Surface roughness parameters have a critical impact on the entire performance of any membrane. The rougher surface is expected to endow a higher fouling tendency on the membrane surface and vice versa. The vertical distance between valleys and nodules is what referred to as roughness. The rough surface can stop some impurities from getting through the membrane, but it can also cause more fouling (Li et al., 2017; Alsalhy et al., 2013). The surface topography parameters of the PES support layer, and polyamide layer (PES-TFC), were determined by AFM. The 0.5 µm × 0.5 µm 3D images were captured by the AFM where the dark region referred to the lowest points (valleys) and light regions referred to the highest points (peaks) (Fig. 4). As shown in the figure and Table 1, the PES-TF membrane manifested the lowest average roughness (Ra = 6 nm) amongst all other samples whereas Ra was around 9 nm for pristine PES membrane and at other higher MAX phase content. Apparently, the surface was not regular as there were high roughness peaks, related to surface defects and dirt. The tip of the microscope risks sticking to the sample. There are filaments which, from a qualitative analysis, do not appear to be made of a material of a different nature. TFC membranes revealed slightly higher roughness parameters, 9.6 nm for M7 while recorded 14.6 nm upon increasing the MAX phase content in the PES polymeric matrix (M9). Incorporating the MAX phase within the PA layer to prepare TFC membranes disclosed much higher roughness parameters compared to the aforementioned membranes. Upon adding only a few content of MAX phase (0.025 g) within the aqueous phase, the Ra value reached up to 60 nm for M11, while this value noticeably dropped to 42 nm at higher content of MAX phase (M13). In the meantime, incorporating 0.025 g MAX phase in the organic phase resulted in the highest average roughness value (71.4 nm) compared to 41 nm when adding higher MAX phase content which showed only 41 nm average roughness. The results then revealed that the membranes modified with 0.025 wt% MAX phase introduced to the organic solution (TMC) were rougher than those added to the aqueous solution (MPD). The improvement in roughness occurred as a result of the deposition of the material on the surface of the membrane and because the MAX phase is hydrophilic material so the contact angle decreases (Abood et al., 2023).
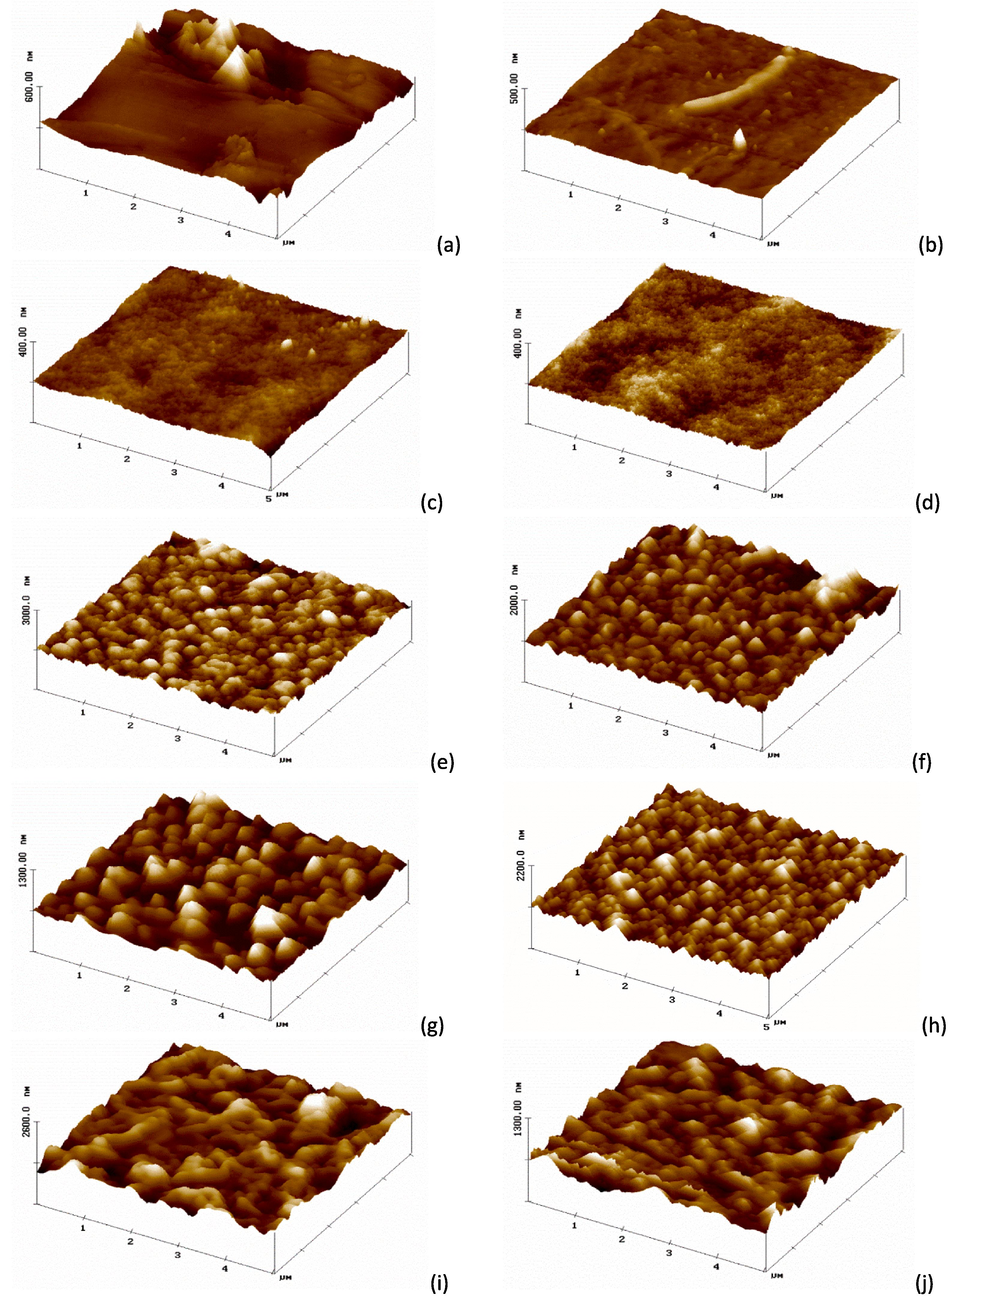
- AFM analysis in 3D was used to investigate the surface properties of the support layer and polyamide layer (PES-TFC), for (a) M1, (b) M4, (c) M7, (d) M9, (e) M11, (f) M13, (g) M15, (h) M17, (i) M19, (j) M21.
| Membrane | Average roughness (nm) (Ra) | Rq (nm) | R max (nm) |
|---|---|---|---|
| M1 | 9.63 | 12.67 | 406.41 |
| M4 | 6.09 | 8.09 | 122.79 |
| M7 | 9.60 | 12.49 | 535.77 |
| M9 | 14.66 | 15.87 | 541.53 |
| M11 | 60.31 | 74.79 | 902.27 |
| M13 | 42.96 | 53.50 | 755.65 |
| M15 | 59.64 | 74.13 | 751.20 |
| M17 | 56.92 | 70.21 | 627.06 |
| M19 | 71.46 | 87.04 | 990.94 |
| M21 | 40.16 | 49.52 | 722.03 |
3.4 Membranes hydrophilicity
Membrane hydrophilicity is a critical characteristic that gives a deep insight into membrane ageing and performance. Contact angle measurements can be used to examine the membrane's hydrophilicity and link the results to how well the membrane performs. Lower contact angles denote higher hydrophilicity and vice versa. Fig. S2 illustrates the analysis of the water contact angle of all membranes, including various ratios of pristine PES, and TFC membranes. As shown, the pristine PES membranes manifested higher CA values compared to other samples. The average contact angle of M1 was 64.914° and this value increased slightly upon increasing the PES wt.%. This could be interpreted due to the denser membrane formed at 17 and 18 wt% where CA relies on many other characteristics of the membrane such as roughness, pore size and porosity and not only on the membrane’s material nature. On the other hand, TFC exhibited lower CA values (48.2°) as shown for the M4 membrane whereas the CA was 58.4° for the M9 membrane. Besides that, the CA measurements of the M13 membrane manifested 44.8° which confirmed the potential of the MAX phase to enhance the surface hydrophilicity by decreasing the water CA at high loading content (0.075 g). Particularly, incorporating a hydrophilic group is a well-established technique to impart that hydrophilicity to the designated membrane (Sadidi et al., 2023). The addition of the TFC and MAX phase as an embedded material had a favorable effect on the hydrophilic nature of the PES/ MAX/ TFC membrane surface, as confirmed by the witnessed decline in the value of the CA of almost 20°.
3.5 Effect of MAX phase wt.% content on the porosity, pore size and thickness
The permeation flux of the membrane is known to be influenced by the interplay of many variables, including the pore size and porosity of the membrane's surface, roughness, the active layer thickness and hydrophilicity. Therefore, the impregnation of the MAX phase is expected to bestow desirable traits on the permeation characteristics of the membranes. Table 2 listed the values of the porosity, pore size and active layer thickness of the produced membranes. Unsurprisingly, as the PES wt.% increased from 16 to 17 and then 18 %, the porosity of the membranes decreased from 79.9 to 71 and 65.7 for M1, M2 and M3, respectively. Similarly, the mean pore radius revealed a gradual decline in size as the dope casting solution increased and showcased 10.3, 9.2 and 8.7 nm for M1, M2 and M3, respectively. The membrane thickness has shown a significant increase upon increasing the PES wt.% and was two-fifths (125 µm) higher for M3 compared to M1. This could be attributed to the higher casting solution viscosity induced by high polymer wt.%. Higher casting solution viscosity diminishes the exchange rate between solvent and non-solvent during the NIPS process. Ultimately, produces lower porosity, smaller pore size and higher thickness (Abood et al., 2023). On the other hand, increasing the MAX content from 0.025 to 0.075 wt% has only imparted a trivial influence on the porosity values as could be seen in the table. However, the pore size displayed a significant increase in both mean pore size and thickness as the MAX phase increased and reached 17.6 nm and 123.1 µm, respectively. The porosity effect on the membrane hydrophilicity, when the concentration of polymer PES increased, the porosity decreased and the hydrophilicity decreased because the contact angle increased (Ibraheem et al., 2023).
| Membrane | Porosity (%) | rp (nm) | Thickness (µm) |
R max (nm) |
|---|---|---|---|---|
| 16 % | 79.975 | 10.328 | 79.71 | 406.41 |
| 17 % | 71.232 | 9.236 | 104.6 | – |
| 18 % | 65.754 | 8.749 | 125 | – |
| MAX content (wt%) | ||||
| 0.025 | 79.725 | 11.62 | 86.82 | 535.77 |
| 0.075 | 78.92 | 17.685 | 123.1 | 541.53 |
The pore size effects the flow, water flux and reverse salt flux increased when the pore size increase according to the attached results.
3.6 FO performance of TFC membranes
3.6.1 Effect of substrate PES membrane concentration on the TFC membrane
The concentration of PES and PA has a substantial impact on the water flux (Jw) and the reverse salt flux (Js) of the FO system. Performance tests of the FO process were carried out at a flow rate of 300 mL/min with DI water and 1 M NaCl as the feed and draw solutions, respectively. As shown in Fig. 5, both water flux and reverse salt flux diminish as the concentration of the TFC membrane substrate increases from 16 to 18 wt%. With a water flux of 6.03 L/m2h and a reverse salt flux of 2.85 g/m2h, the M4 membrane seems to disclose the best-performing membrane Fig. 5a. Compared to the M4 membrane (6.03 L/m2h), M5 and M6 membranes revealed water flux magnitudes of 5.74 L/m2h and 4.71 L/m2h.
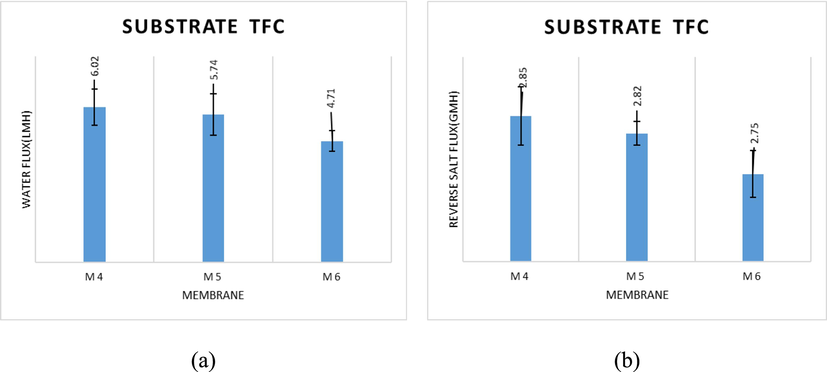
- (a) water flux and (b) reverse salt flux of TFC membranes prepared with different PES concentrations (1 M NaCl as DS, DI water as FS, 300 mL/min).
In Fig. 5(b), the reverse salt flux (RSF) decreased when the PES concentration increased from 16 % to 18 %. This could be due to two factors: (i) Water flux normally declines when RSF declines because RSF was moving in the opposite direction to water flux, and (ii) an increase in the salt rejection value of the TFC membranes caused RSF to decline. Therefore, a lower PES concentration result was found to display a better permeability in the structure of the TFC membrane, which led to a favorable performance in the FO process. This also agrees with other studies (Saeedi-Jurkuyeh and Jafari, 2019; Al-Musawy et al., 2021; Tiraferri et al., 2011)). They believed that FO performance would be enhanced by the substrate membrane having a low polymer concentration (porous structure).
3.6.2 Effect of MAX phase concentration on water flux and reverse salt flux of membrane
Fig. 6 displayed the impact of MAX phase content in the membrane on the water flux and the reverse salt flux. As shown in Fig. 6a, the M14 membrane, which comprises a 0.1 wt% MAX phase, manifested the highest water flux compared to the M11 membrane (0.025 wt% MAX phase). The water flux duplicated from 7.57 to 14.17 L/m2h when the concentration of the MAX phase increased from 0.025 to 0.1 wt%. In the meantime, the M14 membrane revealed the highest reverse salt flux compared to the M11 membrane. The reverse salt flux showcased an increase from 0.88 to 3.60 g/m2h, as shown in Fig. 6b. This resulted from the fact that at the higher concentration of MAX phase, more salt ions and water molecules were rejected at once due to an increase in cross-linking and layer thickness of polyamide on the top side of the M7 (16 wt% PES + 0.025 wt% MAX phase) membrane, which is consistent with the findings of preceding studies (Rastgar et al., 2019). Yet, M11 has the best performance as a FO membrane due to the best-compromised value between water permeability and reverse salt rejection, resulting in the highest performance of the FO membrane.
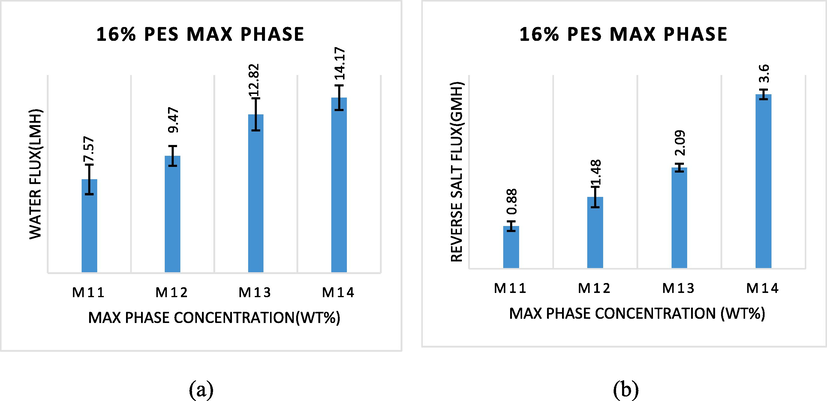
- (a) water flux and (b) reverse salt flux of TFC membranes prepared with different MAX phase concentrations (1 M NaCl as DS, DI water as FS, 300 mL/min).
3.6.3 Effect of MAX phase concentration change on MPD and TMC performance
Fig. 7 illustrates how the MAX phase concentration affects the water flux and the reverse salt flux through FO membranes. According to the experimental findings, the water flux substantially enhanced from 6.83 to 12.55 L/m2h when the MAX phase content increased from 0.025 to 0.1 wt%, as shown in Fig. 7a, while the reverse salt flux increased from 2.49 to 5.77 g/m2h, as shown in Fig. 7b. This resulted from the fact that a higher amount of MAX phase causes the M18 (16 wt% PES) membrane top side to reject more salt ions and water molecules at the same time due to an increase in cross-linking and layer thickness of polyamide, which is in keeping with the results of other (Rastgar et al., 2019).
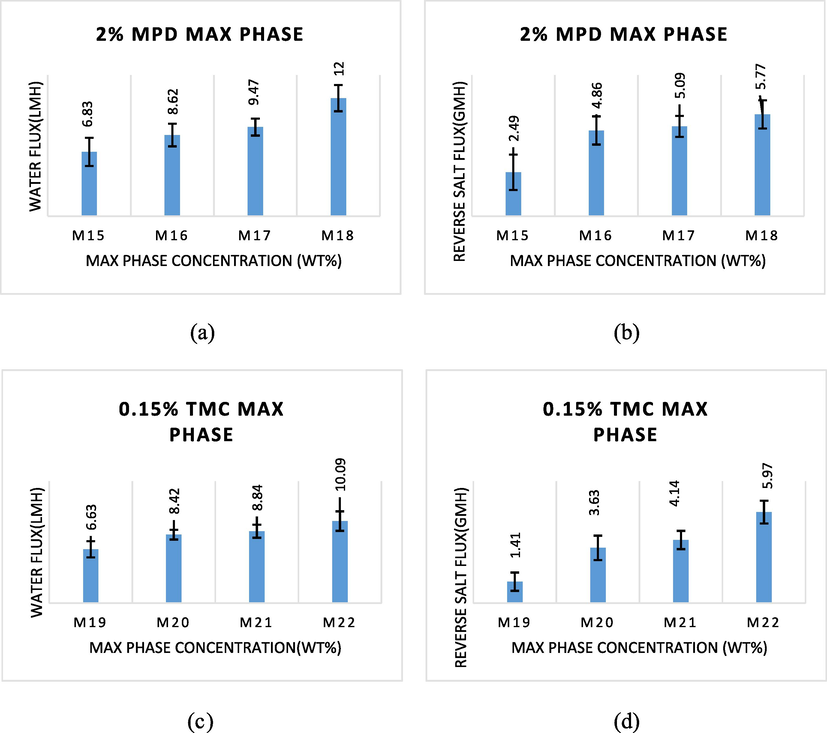
- The water flux and reverse salt flux when adding the MAX phase to aqueous solution MPD and to the organic phase (TMC).
Relevantly, compared to the M15 membrane, which has 0.025 wt% MAX phase, and the M16 membrane, which has 0.05 wt% MAX phase, the M18 membrane, which has 0.1 wt% MAX phase, has a high water flux and a high back-salt flow, respectively. Because M15 has the appropriate balance of polyamide film thickness, it provides an optimal balance of reverse salt rejection and water permeability, which ultimately leads to the high performance of the FO membrane when compared to M16, M17, and M18.
The water flux and the reverse salt flux as measured by the TFC membrane are shown in Fig. 7. By varying the amount of MAX phase added to the organic phase TMC during the IP process, the PA layer was produced on the surface of the M1 (16 wt% PES) substrate. The MAX phase was raised from 0.025 wt% to 0.1 wt%, which resulted in an increase in the water flux and reverse salt flux of TFC membranes from 6.63 L/m2h and 1.41 g/m2h to 10.09 L/m2h and 5.97 g/m2h, respectively. These findings demonstrate that the functionality of the FO membrane is more significantly influenced by the thickness of the PA layer. Additionally, with the MAX phase, cross-linking intensity also increases (Kadhom and Denga, 2019; Zhou et al., 2014). The substrate M19, in particular, produced the best outcomes in terms of water penetration and reduced draw solution losses. The TMC molecules must therefore be evenly distributed and absorbed over the support layer in order to achieve the best cross-linking when interacting with the MPD. The FO membrane with the best performance will ultimately result from this.
3.6.4 Comparison study
The performance of the (M4 and M11) membranes constructed in the current work is compared to several flat sheet TFC-FO membranes disclosed in the literature (Table 3). The comparison is based on their osmotic-driven (FO) experiment, which includes water flux (Jw) and reverse salt flux (Js) under different feed/draw solution conditions. A hydrophilic polymer was used to create high-performance FO membranes among other techniques (Bin et al., 2019), the MAX phase being incorporated into the substrate (Wang et al., 2022; Tharayil and Manaf, 2022; Darabi et al., 2017; Zhang et al., 2019) or active layer (Wang et al., 2022; Emadzadeh et al., 2014). A different drawing solution is being used (Tharayil and Manaf, 2022). These comparison findings suggest that when measured against other FO membranes, the (M4 and M11) membrane exhibits acceptable FO performance.
| Membrane type | Polymer | FS | DS | Jw (L/m2h) | Js (g/m2h) | Js/Jw | Reference |
|---|---|---|---|---|---|---|---|
| TFC | PES | DI water | 1 M NaCl | 6.02 | 2.85 | 0.473 | This study |
| TFC (0.025 MAX phase) | PES | DI water | 1 M NaCl | 7.57 | 0.88 | 0.116 | This study |
| TFC | PSF | Pure water | 1 M NaCl | 5.56 | 4.33 | 0.778 | Wang et al., 2022 |
| TFN (0.007 % MXene nanosheet) | PSF | Pure water | 1 M NaCl | 10.49 | 7.34 | 0.699 | Wang et al., 2022 |
| TFN (0.01 % MXene nanosheet) | PSF | Pure water | 1 M NaCl | 10.45 | 6.83 | 0.653 | Wang et al., 2022 |
| TFC | PES | DI water | 0.6 M NaCl | 2.85 | 4.56 | 1.6 | Bin et al., 2019 |
| TFC | PPSU | DI water | 0.6 M NaCl | 3.04 | 4.95 | 1.62 | Bin et al., 2019 |
| TFC | PSF | DI water | 0.6 M NaCl | 3.59 | 5.33 | 1.48 | Bin et al., 2019 |
| TFC | PES | DI water | 2 M NaCl | 15.22 | 11.45 | 0.752 | Tharayil and Manaf, 2022 |
| TFN (0.005 % Silica NP) | PES | DI water | 1 M KCl | 10 | 8.2 | 0.82 | Tharayil and Manaf, 2022 |
| TFN (0.005 % Silica NP) | PES | DI water | 2 M NaCl | 2.17 | 7.53 | 3.47 | Tharayil and Manaf, 2022 |
| TFC | PES | 10 mM NaCl | 2 M NaCl | 10.4 | 2.1 | 0.201 | Darabi et al., 2017 |
| TFN (0.2 % Fe3O4 NP) |
PES | 10 mM NaCl | 2 M NaCl | 28.8 | 14.7 | 0.51 | Darabi et al., 2017 |
| TFC | PSF | 10 mM NaCl | 2 M NaCl | 15.8 | 3.8 | 0.24 | Emadzadeh et al., 2014 |
| TFN (0.5 % TiO2 NP) |
PSF | 10 mM NaCl | 2 M NaCl | 29.7 | 7.3 | 0.245 | Emadzadeh et al., 2014 |
| TFC | PVDF | DI water | 1 M NaCl | 8.9 | 7.5 | 0.842 | Zhang et al., 2019 |
| TFN (0.9 % p-TiO2 NP) | PVDF | DI water | 1 M NaCl | 18.3 | 4.5 | 0.245 | Zhang et al., 2019 |
| TFC | PSU | DI water | 1 M NaCl | 36.58 | 6.8 | 0.185 | Kadhom et al., 2021 |
4 Conclusions
This work presented a methodical effort to build a high-performance TFC-FO membrane for desalination applications. By improving both the design and fabrication parameters, the environmental and economic costs could be dramatically reduced. Herein, substrate membranes having different polymer concentration was created using phase inversion to probe the impact of the substrate membrane structure on the final TFC performance. Also, the MAX phase was added to the substrate once and during both the organic and aqueous phases to form the thin PA layer. The membrane was systematically tested in terms of water flux and reverse salt flux. According to the SEM investigation, the M1 (16 wt%) substrate had a thinner skin layer, larger channels with a thinner wall, and less finger-like structure compared to M2 and M3 which showed a more dense structure. The substrate membranes' porosity, hydrophilicity, and water permeation all seemed to be higher for M1 (16 wt% PES), with values of 79.972 %, 64.914, and 6.03 LMH/bar, respectively. Additionally, we discovered that M1′s water contact angle was reduced following the formation of the PA layer, reaching 42.206° for M4. The FTIR spectra confirmed that the PA layer successfully formed on the top surface of the PES substrate and the functional groups have been identified for all membrane samples. The performance of FO increased as substrate membrane concentration was decreased, and the M11 membrane (16 wt% PES + 0.025 wt% MAX phase) showed the maximum efficiency in terms of water flux (7.57 LMH) and reverse salt flux (0.88 gMH). The addition of the MAX phase to the neat PES decreased the contact angle from 64.914 to 58.409. The roughness parameters increased following the addition of the MAX phase. Besides, pore size and porosity decreased upon increasing the PES concentration and MAX phase content in the casting solution. However, there was no significant change in the porosity when varying the MAX content. While a dramatic change was witnessed in the pore size when increasing the MAX phase content from 0.025 to 0.075 wt%.
Acknowledgments
This research was financially supported by the Membrane Technology Research Unit, Department of Chemical Engineering, University of Technology-Iraq, Alsinaa Street 52, Baghdad 10066, Iraq, and the Environment and Water Directorate, Ministry of Science and Technology, Baghdad, Iraq. The authors would also like to thank the Institute of Membrane Technology, National Research Council, (ITM-CNR), Via P. Bucci 17c, 87030 Rende, CS, Italy).
Declaration of Competing Interest
The authors declare that they have no known competing financial interests or personal relationships that could have appeared to influence the work reported in this paper.
References
- NaY zeolite-polyethersulfone-modified membranes for the removal of cesium-137 from liquid radioactive waste. Chem. Eng. Res. Des.. 2022;179:535-548.
- [CrossRef] [Google Scholar]
- Effect of MAX Phase Ti3ALC2 on the Ultrafiltration Membrane Properties and Performance. In: Drugs and the Future. Elsevier; 2023. p. :7-10.
- [CrossRef] [Google Scholar]
- Effect of MAX Phase Ti3ALC2 on the ultrafiltration membrane properties and performance. Membranes (Basel). 2023;13(5):pp.
- [CrossRef] [Google Scholar]
- Experimental investigation of the effect of implanting tio2-nps on pvc for long-term uf membrane performance to treat refinery wastewater. Membranes. 2020;10(4):pp.
- [CrossRef] [Google Scholar]
- A review exploring the adsorptive removal of organic micropollutants on tailored hierarchical carbon nanotubes. Toxicol. Environ. Chem.. 2021;103(4):295-338.
- [CrossRef] [Google Scholar]
- Fabrication of fouling resistant Ti3C2Tx (MXene)/cellulose acetate nanocomposite membrane for forward osmosis application. J. Water Process Eng.. 2020;38:101551
- [CrossRef] [Google Scholar]
- Use of forward osmosis in treatment of hyper-saline water. Desalin. Water Treat.. 2018;133:1-9.
- [CrossRef] [Google Scholar]
- Current status and challenges of fabricating thin film composite forward osmosis membrane: A comprehensive roadmap. Desalination. 2020;491(May):114557
- [CrossRef] [Google Scholar]
- Superhydrophobic nanocarbon-based membrane with antibacterial characteristics. Biotechnol. Prog.. 2020;36(3)
- [CrossRef] [Google Scholar]
- A mini-review on thin-film composite hollow fiber membranes for forward osmosis applications. Ecol. Eng. Environ. Technol.. 2023;24(1):287-301.
- [CrossRef] [Google Scholar]
- Synthesis and characterization of PVC-TFC hollow fibers for forward osmosis application. J. Appl. Polym. Sci.. 2021;138(35):50871.
- [CrossRef] [Google Scholar]
- Preparation and characterization of poly(vinyl chloride)/polystyrene/ poly(ethylene glycol) hollow-fiber ultrafiltration membranes. J. Appl. Polym. Sci.. 2013;130(2):989-1004.
- [CrossRef] [Google Scholar]
- Preparation and Characterization of Thin-Film Nanocomposite Membrane Incorporated with MoO3 Nanoparticles with High Flux Performance for Forward Osmosis. ChemistrySelect. 2019;4(27):7832-7837.
- [CrossRef] [Google Scholar]
- Enhancing forward osmosis (FO) performance of polyethersulfone/polyamide (PES/PA) thin-film composite membrane via the incorporation of GQDs@UiO-66-NH particles. J. Water Process Eng.. 2020;33:101107
- [CrossRef] [Google Scholar]
- Effect of lithium chloride additive on forward osmosis membranes performance. J. Water Process Eng.. 2020;33(September 2019)
- [CrossRef] [Google Scholar]
- Decreasing ICP of forward osmosis (TFN-FO) membrane through modifying PES-Fe3O4 nanocomposite substrate. Korean J. Chem. Eng.. 2017;34(8):2311-2324.
- [CrossRef] [Google Scholar]
- A novel thin film composite forward osmosis membrane prepared from PSf-TiO2 nanocomposite substrate for water desalination. Chem. Eng. J.. 2014;237:70-80.
- [CrossRef] [Google Scholar]
- Enhanced permeability and antifouling performance of polyether sulfone (PES) membrane via elevating magnetic Ni@MXene nanoparticles to upper layer in phase inversion process. J. Membr. Sci.. 2021;623
- [CrossRef] [Google Scholar]
- Forward osmosis membrane: Review of fabrication, modification, challenges and potential. Membranes (Basel). 2023;13(4):1-54.
- [CrossRef] [Google Scholar]
- A comprehensive review on anti-fouling nanocomposite membranes for pressure driven membrane separation processes. Desalination. 2016;379:137-154.
- [CrossRef] [Google Scholar]
- Removal of dyes using graphene oxide (Go) mixed matrix membranes. Membranes. 2020;10(12):1-24.
- [CrossRef] [Google Scholar]
- Role of cellulose micro and nano crystals in thin film and support layer of nanocomposite membranes for brackish water desalination. Membranes. 2019;9(8)
- [CrossRef] [Google Scholar]
- Evaluation of thin film composite forward osmosis membranes: Effect of polyamide preparation conditions. Drinking Water Eng. Sci.. 2021;14(1):45-52.
- [CrossRef] [Google Scholar]
- Synthesis of high-performance thin film composite (TFC) membranes by controlling the preparation conditions: Technical notes. J. Water Process Eng.. 2019;38
- [Google Scholar]
- Evaluation of thin film composite forward osmosis membranes: Effect of polymer type. J. Eng. Sustain. Dev.. 2022;25(6):65-73.
- [CrossRef] [Google Scholar]
- Thin film nanocomposite membranes filled with MCM-41 and SBA-15 nanoparticles for brackish water desalination via reverse osmosis. Environ. Technol. Innov.. 2020;20
- [CrossRef] [Google Scholar]
- Improved separation and antifouling properties of thin-film composite nanofiltration membrane by the incorporation of cGO. Appl. Surf. Sci.. 2017;407:260-275.
- [CrossRef] [Google Scholar]
- Polyvinyl chloride and layered double hydroxide composite as a novel substrate material for the forward osmosis membrane. Desalination. 2017;421:149-159.
- [CrossRef] [Google Scholar]
- Water treatment and environmental remediation applications of two-dimensional metal carbides (MXenes) Mater. Today. 2019;30:80-102.
- [CrossRef] [Google Scholar]
- Study of polyamide thin film characteristics impact on permeability/selectivity performance and fouling behavior of forward osmosis membrane. Environ. Sci. Pollut. Res.. 2019;26(2):1181-1191.
- [CrossRef] [Google Scholar]
- Fabrication of a new composite membrane consisting of MXene/PES /PEI for biofuel dehydration via pervaporation. Results Eng.. 2023;18(March)
- [CrossRef] [Google Scholar]
- Synthesis of thin-film composite forward osmosis membranes for removing organic micro-pollutants from aqueous solutions. Water Sci. Technol. Water Supply. 2019;19(4):1160-1166.
- [CrossRef] [Google Scholar]
- Improved performance of thin-film composite forward osmosis membrane with click modified polysulfone substrate. Desalination. 2020;496
- [CrossRef] [Google Scholar]
- Introduction to MXenes: synthesis and characteristics. Mater. Today Chem.. 2019;14
- [CrossRef] [Google Scholar]
- Fabrication of a novel antifouling polysulfone membrane with in situ embedment of Mxene nanosheets. Int. J. Environ. Res. Public Health. 2019;16(23):4659.
- [CrossRef] [Google Scholar]
- Polyamide membrane with an ultrathin GO interlayer on macroporous substrate for minimizing internal concentration polarization in forward osmosis. Chem. Eng. J.. 2021;412
- [CrossRef] [Google Scholar]
- Effect of different inorganic draw solutes on SiNPs-TFN membrane for forward osmosis desalination. Int. J. Environ. Sci. Technol.. 2022;19(1):289-298.
- [CrossRef] [Google Scholar]
- Relating performance of thin-film composite forward osmosis membranes to support layer formation and structure. J. Memb. Sci.. 2011;367(1–2):340-352.
- [CrossRef] [Google Scholar]
- Polyethersulfone hollow fiber membranes prepared with Polarclean® as a more sustainable solvent. J. Memb. Sci.. 2020;608:118216
- [CrossRef] [Google Scholar]
- Confined self-assembly in two-dimensional interlayer space: Monolayered mesoporous carbon nanosheets with in-plane orderly arranged mesopores and a highly graphitized framework. Angew. Chem. Int. Ed.. 2018;57(11):2894-2898.
- [CrossRef] [Google Scholar]
- Preparation and characterization of a thin-film composite membrane modified by MXene nano-sheets. Membranes (Basel). 2022;12(4)
- [CrossRef] [Google Scholar]
- Emerging 2D materials produced via electrochemistry. Adv. Mater.. 2020;32(10)
- [CrossRef] [Google Scholar]
- Confining migration of amine monomer during interfacial polymerization for constructing thin-film composite forward osmosis membrane with low fouling propensity. Chem. Eng. Sci.. 2019;207:54-68.
- [CrossRef] [Google Scholar]
- Thin film composite forward-osmosis membranes with enhanced internal osmotic pressure for internal concentration polarization reduction. Chem. Eng. J.. 2014;249:236-245.
- [CrossRef] [Google Scholar]
Appendix A
Supplementary material
Supplementary material to this article can be found online at https://doi.org/10.1016/j.arabjc.2023.105475.
Appendix A
Supplementary material
The following are the Supplementary material to this article:


