

Translate this page into:
Tailored functionalized polymer nanoparticles using gamma radiation for selected adsorption of barium and strontium in oilfield wastewater
⁎Corresponding authors at: Analysis and Evaluation Department, Egyptian Petroleum Research Institute, Nasr City P.O. Box 11727, Cairo, Egypt (S.A. Younis). Chemistry Department, Faculty of Engineering, Ain Shams University, P. O. Box 11517, Cairo, Egypt (G. Bassioni). sherifali@epri.sci.eg (Sherif A. Younis), sherifali_r@yahoo.com (Sherif A. Younis), bassioni@umd.edu (Ghada Bassioni) ghada_bassioni@eng.asu.edu.eg (Ghada Bassioni)
-
Received: ,
Accepted: ,
This article was originally published by Elsevier and was migrated to Scientific Scholar after the change of Publisher.
Peer review under responsibility of King Saud University.
Abstract
Two novel polymeric sorbents (SAB and SASB) are synthesized using γ-radiation as selective inorganic oilfield scale inhibitors. SASB shows higher sorption selectivity towards Ba2+ and Sr2+ than SAB. Adsorption responses are simulated using Plackett-Burman factorial design at 95% confidence limits. Modeling of sorption data are statistically analyzed by analysis of variance (ANOVA) combined with multiple regression analysis. The complexation, ion exchange, and partition mechanisms best describe the Ba2+ and Sr2+ sorption behavior onto SASB surface.
Abstract
To improve oil recovery from oilfield wells mineral scales derived by insoluble BaSO4 and SrSO4 salts during oil extraction should be diminished. In this work, adsorption selectivity of Barium (Ba2+) and Strontium (Sr2+) ions associated with saline formation waters was examined for the first time using nano-sized bi-functional polymer blend synthesized by Cobalt-60 (60Co) γ-rays, as green technology. A bifunctional polymer formed from poly(acrylonitrile)/(styrene-butadiene rubber) homogenous blend is functionalized by -SO3H and -COOH terminal groups (termed as SASB). Those functional groups were selected based on systematic calcium (Ca2+) ions adsorption studies of carboxylate containing molecules. Main and binary interactive effects of solution pH (3–9), adsorbents dose (1-3 g/L), total dissolved salts (TDS, up to 30 g/L), initial Ba2+ and Sr2+ concentrations (10-500 mg/L) and temperature (20–50 oC) on the adsorption selectivity were examined and optimized using Plackett-Burman factorial design (PBD) combined with multiple regression analysis. The regression statistics revealed the significance of quadratic polynomial model to optimize interactive sorption conditions from salty waters with high accuracy level ( ≈ 0.99) rather than linear and two-way interactive models at 95% confidence level. Interestingly finding, the regression and experimental data proved that the presence of up to 10 g/L TDS from alkali metal ions had a significant effect on the enhancement sorption capacity of Ba2+ and Sr2+ when using the prepared sorbent. The SASB adsorbent showed higher sorption selectivity with maximum equilibrium capacity ( ) of 175.3 mg Ba+2 and 210.5 mg Sr+2 per each gram sorbent used in kinetic study. Adsorption kinetics of Ba2+ and Sr2+ sorption by both adsorbents obey pseudo-first and pseudo-second order kinetics, respectively. In sum, the adsorptive power of SASB sorbent is found to be in reverse order of the electronegativity and the hydration radii of the metal ions.
Keywords
γ-radiation
Acrylonitrile/styrene-butadiene copolymer
Oilfield scale
Adsorption kinetics
Plackett-Burman factorial design (PBD) optimization

1 Introduction
Water flooding is the most widely used technique for enhanced oil recovery from oil wells. In this process, seawater is injected to displace the remaining oil in reservoirs from an offshore structure. The naturally present formation water usually contains significant amounts of divalent cations such as Ca2+, Mg2+, Ba2+ and Sr2+. These cations can react with anions, such as sulfate and carbonate, in the injected brine to yield insoluble scales. Radium behaves chemically similar to barium, strontium and calcium so that the accumulation of these scales enhances radium co-precipitation with these mineral scales to cause risk to both the human health and the environment (Bassioni et al., 2012). Continuous accumulation of scale can also lead to complete blockage of the oil flow pathways, damage the production system, and consequently decrease productivity (Fink, 2012; Jordan and Mackay, 2016).
The severity of the complications and the necessity to develop novel solutions that were highly reliant on the field operational conditions often pose significant scaling issues. The most favorable and cost-effective method to combat scale formation is from the use of chemical scale inhibitors. Scale inhibitors have the ability to prevent or slow down the nucleation and crystal growth of the formed mineral scale. Commercial scale inhibitors were viewed efficient at low dosages for a wide range of pH values and temperatures. Laboratory scale screening tests have often been used to select appropriate scale inhibitors and conditions before using in practical oilfields.
For example, phosphonate-based scale inhibitors have been widely used; however, their environmental impact is questionable (Kelland, 2014). In our previous studies (Bassioni, 2010) we provided an understanding on how small molecules as well as polymeric inhibitors bearing carboxylic groups may interact with CaCO3 surface. However, the presented treatment of polyelectrolyte behavior was incomplete and some fundamentally new views were needed to gain further insights on understanding adsorption behavior of electrolytes on divalent metal ions.
In this study, based on the previously reported systematic approach on the adsorption of Ca2+ (Bassioni, 2010), polymeric nanoparticles as a novel scale inhibitor for Ba2+ and Sr2+ removal were designed and developed. The nano-polymer described here was cross-linked by γ-irradiation since that class was shown to be a suitable sorbent to remove various metal ions from different environmental waters (Khalil et al., 2017). Key factors determining successful application of polymeric nanoparticles for metal ions removal were surface modification and functionalization (Bin Merdhah and Yassin, 2007; Ebrahimzadeh and Behbahani, 2017). Therefore, it was extremely beneficial to have a simplified synthetic route to obtain multi-functional polymeric nanoparticles with tailored-to-the-purpose physiochemical properties (Ebrahimzadeh and Behbahani, 2017). Because synergistic effects can occur when chemical additives are used in admixtures in the petroleum industry, this study provides an introduction of sulphonic (-SO3H) and/or carboxylic (-COOH) groups for ions removal (Shannon et al., 2008; Wang et al., 2002) to a novel nanopolymer blend. Such effects can enhance or diminish the performance of each functional group. A novel method of preparing blend polymers on a nano-scale using γ-irradiation to induce the polymerization reaction is demonstrated. The selective adsorption of Ba2+ and Sr2+ ions from simulated saline wastewater is presented based on experiments and modeling results that provide insights on the adsorption kinetics for the synthesized polymeric blends.
2 Experimental methods
2.1 Materials
Styrene-butadiene rubber (SBR) (Synaprene-1502, Styrene content 25%) and acrylonitrile monomer (AN) were obtained from Sigma-Aldrich (USA). All other chemical reagents of analytical grade were obtained from Fluka Company. Sodium salts of sulfate, sulfite, phosphite, hydrogen phosphate dihydrate and hydroxide (all from Merck) were used without further purification.
2.2 Methods
2.2.1 γ-Radiation source
The samples were irradiated with 60Co γ-source. The dose rate of γ-radiation was 1.86 kGy/h. The irradiation facility was supplied by Canada and was constructed by the National Center for Radiation Research and Technology (NCRRT), Atomic Energy Authority of Egypt (AEAE) in Cairo.
2.2.2 Synthesis of nanopolymers SAB and SASB
The nanopolymer blend of SBR/AN was prepared by mixing the two rubber/monomer solutions in a ratio of 50:50 vol%. The total solid loading was adjusted to 20–35 vol%. The obtained blend was mixed for 5 min at ambient conditions. After homogenization, the blend was exposed to γ-radiation at a dose of 20 kGy in order to crosslink the two polymers (Ghobashy and Abdeen, 2016). Back bone nano-sized white powder of SAB structure was obtained, see Fig. 1A.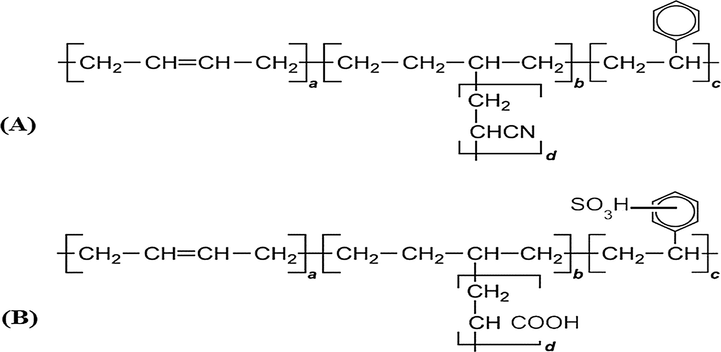
(A) The back-bone structure of styrene butadiene blended with acrylonitrile (SAB) where (a) is buta-1,3-diene, (b) (acrylonitrile) is added to the double bond on the butadiene unit, (c) poly styrene, and (d) polyacrylonitrile (B) The back-bone structure of modified styrene butadiene blended with acrylonitrile (SASB) (c) sulphonated polystyrene (d) modified COOH groups from CN groups.
Carboxylation: The carboxylic group was introduced by suspending 15 g of SAB (1 equiv) in 50 ml (Methanol: H2O = 5:1) for 1 h. The suspended solution was allowed to reflux and then mixed with sodium hydroxide (5 equiv) drop-wise while stirring for 30 min. The mixture was then kept at 90 °C for 9 h to convert the nitrile (CN) groups into sod salt of carboxylate (COONa). Upon completion, the mixture was acidified with 2 N HCl to obtaine carboxylic acid groups. The product was extracted and purified with ethyl acetate. A pale yellow powder of nanosized [(SBR/AN-COOH)] was formed and separated by filtration. The obtained product was dried at 40 °C for 24 h.
Sulphonation: in the first step, a stoichiometric ratio of 98% sulphuric acid was carefully added to 15 ml acetic anhydride pre-cooled at 0 oC (adjusted by ice- crystals). The mixture was stirred for 10 min until the reaction mixture became yellowish viscous solution, resulting from the formed acetyl sulphate, as sulphonation agent (CH3COOSO3H). In the second step, 13 g of dry blend [(SBR/AN-COOH)] was added into a jacketed glass reactor containing 100 ml of dichloromethane and equipped with a condenser and mechanical stirring. Under nitrogen protection, the sulphonation agent (CH3COOSO3H) was add dropwise to the suspension [(SBR/AN-COOH) in dichloromethan] and stirred vigorously (200 rpm) with reflux condensation at temperature of 40 oC for 40 min. The desired theoretical amount of sulphonation agent (CH3COOSO3H) was introduced to the reaction mixture and stirred for further 30 min. The reaction was stopped by addition of cold distilled water. The sulfonated blend [SASB] was obtained as a dark yellow powder and washed several times with distilled water. The structure of SASB is illustrated in Fig. 1B.
2.2.3 Characterization of SAB and SASB
The particle size distribution of SASB was measured using a transmission electron microscope; model JEOL JEM-2100 TEM at 80 kV. The surface functional groups of the unmodified SAB and the modified SASB nanopolymers were determined using attenuated total reflection Fourier transform infrared ATR-FTIR spectrometer, model Vertex 70 FTIR equipped with a HYPERION™ microscope, BrukerOptik GmbH, Ettlingen, Germany. Software OPUS 6.0 (BRUKER) was used for the FTIR data processing, which provided baseline corrected by rubber band method with CO2 bands excluded. The BET surface area was determined using Nova 3200Autosorbanalyzer (Quantachrome, USA) depending on N2 adsorption/desorption isotherm at 77 K. The hydrodynamic diameter and zeta potential of the prepared materials in aqueous solution were evaluated using dynamic light scattering (DLS) Zeta-sizer Nano (Malvern Ltd., UK) and the Malvern Dispersion Software (V5.10). Thermogravimetric analysis (TGA) was performed by the use of a SDT Q600 simultaneous DSC/TGA analyzer (USA) in the temperature range of 20–600 °C at a heating ramp of 10 °C/min under atmosphere. Using an automatic CHNS/O Analyzer (model 2400, PerkinElmer), the total content of carbon, hydrogen, oxygen, nitrogen, and sulfur in the solid sorbents were determined.
2.3 Adsorption of Ba2+ and Sr2+
A stock aqueous solution of 1000 mg/L of selected metal ions Ba2+ and Sr2+ were prepared in deionized water. Different concentrations of total dissolved solids (TDS), up to 30 g/L, were added to simulate the real composition of sea water with composition ratios of 40% Na+ + K+, 10% Ca2+ + Mg2+, 45% Cl− and 5% (HCO3− and SO42−). All batch adsorption runs were conducted in 125 ml closed shaking flasks that were agitated for 24 h at 150 rpm fixed shaking speed. Five independent variables (pH of solution (
= 3 − 9), adsorbent dose ((
= 1 − 3 g/L), initial metal ions’ concentrations (
= 10 − 500 mg/L), TDS (
= 0 − 30 g/L) and solution temperature (
= 20 − 50°C) were examined to determine optimum conditions for the adsorption experiments. The Plackett–Burman factorial design (PBD) for the selected variables (Table 1) in conjunction with software MINITAB 17 (USA) was used to investigate the significant effect of each variable on adsorption responses (removal percentages and adsorption capacities, mg/g). Duplicate repeatability for central and factorial points of each variable in the PBD design were introduced to calculate the systematic error affecting optimization. Kinetic and thermodynamic studies were conducted at optimum conditions obtained from the Plackett–Burman design (PBD). These studies were carried out at
500 mg/L initial metals concentrations and temperatures of 20 − 50 °C for every 10 min time intervals up to 24 h. Note: for each variable two concentration ranges (high (+) and low (−) are tested with duplicate repeatability at the central point (0).
Adsorption variables
Experimental responses
Predicted responses
Run
SAB
SASB
SAB
SASB
1
+1
−1
+1
−1
+1
33.3
3.3
74.7
7.5
34.2
5.4
75.9
12.9
2
+1
+1
+1
−1
−1
42.7
1.4
80.2
2.7
41.4
0.9
79.6
2.0
3
+1
−1
+1
+1
+1
16.1
1.6
55.4
5.5
15.3
0.2
54.7
4.8
4
+1
+1
+1
−1
+1
38.6
64.4
96.9
161.4
38.1
66.5
95.4
162.4
5
−1
−1
+1
+1
+1
5.6
28.1
70.3
351.3
7.4
31.8
72.4
355.0
6
+1
+1
+1
−1
+1
38.6
64.4
95.9
159.8
38.1
66.5
95.4
162.4
7
+1
+1
+1
+1
+1
18.3
30.4
77.5
129.2
18.6
24.5
78.6
129.1
8
+1
1
+1
−1
−1
17.3
86.7
73.1
365.3
17.1
90.7
72.8
370.9
9
+1
+1
+1
−1
−1
32.4
54.1
84.0
140.0
33.7
60.4
87.7
144.0
10
−1
−1
−1
+1
+1
19.2
1.9
62.4
6.2
18.6
1.6
61.5
3.5
11
0
0
0
0
0
23.1
29.4
76.1
97.0
23.1
29.4
76.6
97.6
12
−1
+1
−1
+1
−1
26.4
0.9
63.9
2.1
25.8
11.4
63.6
8.3
13
+1
−1
+1
−1
−1
16.8
83.9
72.7
363.5
17.1
90.7
72.8
370.9
14
+1
+1
−1
+1
−1
20.7
0.7
55.8
1.9
22.2
4.3
57.4
7.2
15
−1
+1
−1
−1
−1
44.1
1.5
89.3
3.0
43.1
1.5
85.9
3.7
16
0
0
0
0
0
23. 5
30.2
77.1
98.2
23.1
29.4
76.6
97.6
17
−1
−1
+1
−1
−1
21.4
107.2
78.8
393.8
21.1
102.9
77.6
384.6
18
+1
+1
−1
+1
+1
27.4
0.9
68.7
2.3
27.5
7.6
68.7
3.1
19
−1
−1
+1
−1
−1
21.4
107.2
77.8
388.8
21.1
101.9
77.6
384.6
20
+1
−1
+1
−1
+1
24.1
120.4
83.5
417.7
24.5
112.6
84.1
407.7
21
+1
+1
−1
+1
−1
22.9
0.8
57.8
1.9
22.2
4.3
57.4
7.2
22
−1
+1
−1
−1
+1
43.7
1.5
96.1
3.2
44.4
0.9
96.4
0.7
23
+1
−1
−1
+1
−1
7.2
0.7
37.5
3.8
7.0
0.4
39.9
2.6
24
−1
+1
+1
−1
+1
38.4
64.0
98.9
164.9
38.4
67.9
98.0
174.9
25
−1
+1
−1
−1
+1
43.7
1.5
99.1
3.3
44.4
1.9
96.4
1.7
26
−1
−1
−1
−1
+1
37.9
3.8
84.8
8.5
35.5
11.2
82.8
10.2
27
+1
−1
+1
+1
+1
4.2
21.2
68.2
340.9
3.4
31.5
68.4
349.7
28
−1
−1
−1
−1
−1
29.0
2.9
63.9
6.4
31.1
10.9
68.6
11.1
29
−1
+1
+1
+1
−1
16.2
26.9
72.7
121.2
16.7
24.2
74.2
119.9
30
−1
+1
+1
+1
+1
22.4
37.3
82.6
137.6
20.9
31.3
81.1
135.0
31
+1
−1
−1
+1
+1
14.5
1.5
55.4
5.5
15.3
0.2
54.7
4.8
32
−1
+1
+1
+1
−1
16.2
26.9
72.7
121.2
16.7
24.2
74.2
119.9
33
+1
−1
−1
−1
−1
28.1
2.8
63.9
6.4
27.8
5.7
61.0
4.1
34
+1
+1
+1
+1
−1
12.6
21.0
74.7
124.4
12.3
14.0
71.0
116.2
35
−1
+1
−1
−1
+1
43.7
1.5
91.1
3.0
44.4
0.9
96.4
1.7
36
−1
−1
−1
+1
−1
11.9
1.2
48.6
4.9
12.4
0.3
47.5
2.1
37
−1
−1
+1
+1
+1
6.7
33.5
72.3
361.3
7.4
31.8
72.4
355.0
38
−1
−1
+1
+1
−1
1.6
8.0
63.4
317.0
0.2
9.9
61.9
328.4
2.4 Analytical procedure and statistical analysis
After the adsorption processes, the residual metal ions’ concentrations (Ba2+ and Sr2+) were determined by Ion Exchange Chromatography (IC, model Dionex ICS-2100 Series, USA) and checked by atomic absorption spectroscopy (AAS, model ZEEnit 700P Series, Analytica, Jena, Germany). The removal percentage (Y%) and metals adsorption capacities (mg/g) were calculated using equations (1) and (2).
Analysis of variance (ANOVA) and error statistics were used to evaluate the adequacy of the developed models by the PBD factorial design to simulate the adsorption experimental responses by both the nano-sorbents. The validation was also assessed using a parametric t-test at a probability level of 0.05 in accordance with the average absolute value of relative error, AARE (Eq. (3)), so to compare the predicted results with the experimental data (Ghaemi et al., 2011). The statistical validation and error studies were checked by using the solver add-in with Microsoft Excel@2013, MINITAB (v.17) and IBM-SPSS (v. 21) statistical package for verification of the results obtained.
3 Results and discussion
The chemistry of barite (BaSO4) and celestite (SrSO4) can be compared to calcite (CaCO3) in terms of solubility, temperature and pH dependency. In contrast to calcite, the solubility of barite and celestite was pH independent for almost the entire range of pH. While the solubility of barite increases with temperature, celestite -like calcite decreases with temperature (Ferguson and Ferguson, 2010). The solubility products Ksp at 25 °C of CaCO3 was 6.84 mg/L, of BaSO4 2.2 mg/L and of SrSO4 89.6 mg/L. Our previous study (Plank and Bassioni, 2007) shows that at room temperature the molar amount of Ca2+ decreases with increase in temperature. Such adsorption behavior of Ca2+ ions by polycarboxylates in a salty environment provided a fundamental understanding that helped to support the design of necessary experiment for Ba2+ and Sr2+ adsorption. The criteria for selecting the mentioned salts were based on the occurrence and solubility of these salts in brine and valency of the respective ions (Frenier and ZiauddinM., 2008). It was found that the adsorption of inorganic anions inverted the sign of the surface potential of the calcite particles from positive to negative. Competitive adsorption revealed the limitations of the carboxylate group as a functional adsorption site.
Most optimum design for selective adsorption of Ba2+ and Sr2+ in an aqueous environment lead to tackling of a totally new class of nanopolymer blends. The nanoparticles were chosen to (a) be nontoxic, (b) have relatively high adsorption capacities and selectivity to low concentrations of metal ions, and (c) allow metal ions to be easily removed from their surface for re-use and recycling.
3.1 Tailored-to-the-purpose polymer blend
By γ-irradiation at dose 20 kGy, an aqueous dispersion containing blend nano-polymer of AN/SBR was prepared, coded as (SAB) where S and A refer to Styrene and Acrylonitrile moieties, respectively and B refers to Blank sample. The obtained blend nano-polymer was chemically modified by introducing the functional groups (-SO3H and -COOH) to investigate the adsorption selectivity for Sr2+ and Ba2+ ions from highly salty aqueous solutions and was coded as (SASB) where the additional S and B letters refer to Surface modified Bulk solids for selective adsorption of metal (Ba + Sr) ions from aqueous solutions. The resultant nano-blend [(SBR-SO3H/AN-COOH)] was a dark yellow powder (SASB) (Fig. 1).
3.2 Structure characterization of the SAB and SASB nano-adsorbent
The results from the ATR-FTIR of acrylonitrile /styrene-butadiene rubber copolymer and its chemically modified SASB are presented in Fig. 2. The FTIR spectrum of functional SASB nano-adsorbent rubber/polymer blend (curve (b) in Fig. 2) showed similar characteristic features to curve (a) in Fig. 2 for the acrylonitrile /styrene-butadiene rubber copolymer (SAB), but with a slight shift and the presence of additional new peaks at lower wavenumbers. The FTIR bands corresponding to the trans >C=CH– (969 cm−1) and the vinyl >C=CH2 (916 cm−1) were assigned to the trans-2-butene-1,4-diyl, 1607 cm−1 (styrene) and 2240 cm−1 (nitrile group) fragments of the SAB co-polymer (Peydro Rasero et al., 2013). The vibrations at 1448 and 1491 cm−1 corresponding to the presence of an aromatic ring were observed. In Fig. 2b, the chemically modified copolymer blend SASB showed a minor FTIR peak at 851 cm−1, suggesting bonding of -SO3H groups to the aromatic ring of polystyrene. In addition, the band at 1027 cm−1 was a result of the symmetric stretching vibration of -SO3H groups, and the FTIR at 1159 cm−1 results from a sulfonate anion attached to a phenyl ring (Lebovka, 2012). This depicts the appearance of a broad stretching band found between 1560 and 1815 cm−1. Moreover, the FTIR peak at 1762 cm−1 was due to carbonyl stretching characteristic for the carbonyl (–C⚌O) groups. A complete analytical picture of the spectra confirms that (SASB) contains -SO3H and -COOH groups.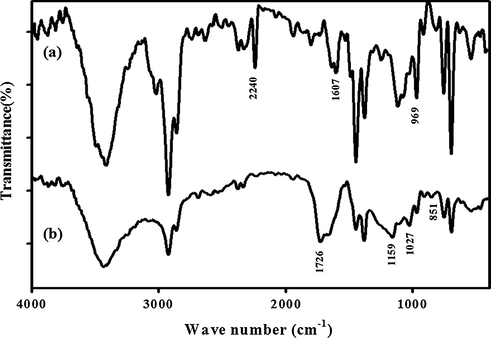
FTIR spectra for (a) SAB and (b) SASB nano-adsorbents based on acrylonitrile /styrene-butadiene rubber copolymer blend.
Fig. 3(a) shows the TEM image of SASB. Obviously, TEM image indicates the successful formation of spherical shape nanoparticle of SASB sorbent with average diameter of 40 nm. In contrast, the charged ions or polyelectrolytes with the new functional groups (-COOH and -SO3H) introduced by chemical modification were able to bridge the particles by electrostatic attraction causing coalescence (Sperling and Parak, 2010). Some coalescence of neighboring SASB nanoparticles can be seen in Fig. 3. Based on experimental DLS analysis (inset Fig. 3), the hydrated nanoparticles diameters of the SAB co-polymer are in the range of ≈24.4 to 55.7 nm, which are lower than the calculated diameters for functionalized SASB co-polymer (≈43.8 to 58.7 nm). Comparable to the unmodified SAB, it is also seen that SASB polymer showed extended increase in the diameter size up to 295 nm but it represents minor distribution (<22%) of total count particles. The increase of hydrated SASB particle sizes further confirms the coalescence effect of the functionalized surface with negative carboxylic and sulphonic charge groups. The Zeta-potential analysis verify that the functionalized SASB have higher negative surface charge of −12.8 mV relative to 4.0 mV of SAB (unmodified), which results from the SO3H and -COOH -based functionalities as confirmed earlier by ATR-FTIR. CHNS(O) elemental composition is also used to confirm the successful functionalization of SASB sorbent with the bifunctional groups. Accordingly, the measured (calc.) percentage ratio of S content was found to be 1.8 wt% with increased of an oxygen content from 9.8% (in pristine SAB blend) to 24.2% in SASB sorbent, confirming successful functionalization process. Furthermore, the calculated C/N ratio was also to be reduced from 3.76 in SAB to 1.57 wt% in SASB.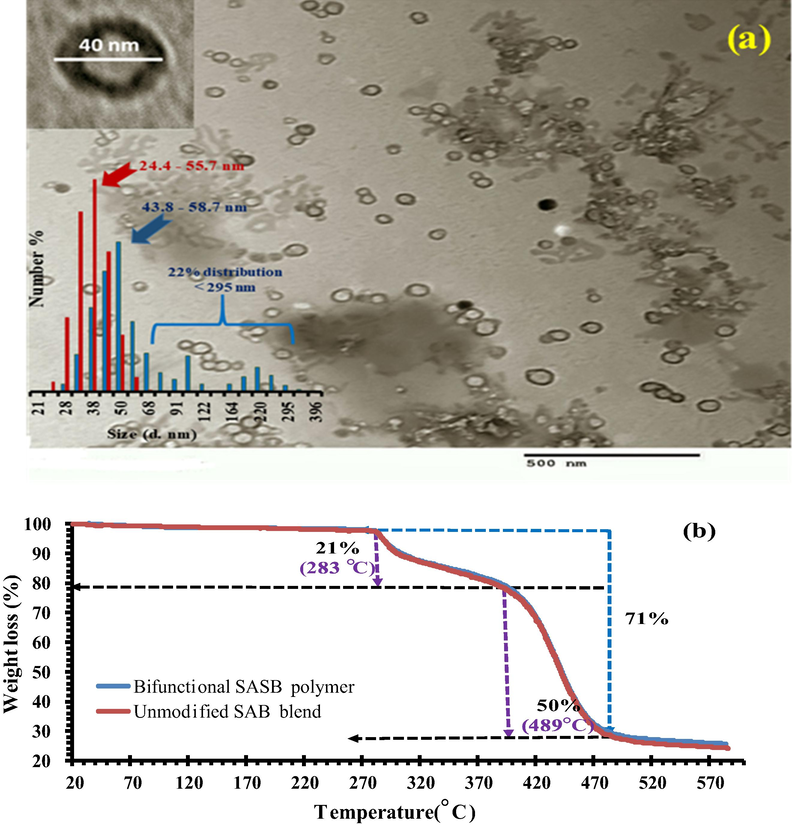
(a) TEM image of SASB nanopolymer blend (inset histogram is the distriburted size diameters by DLS for the SASB (blue) vs. SAB (red) sorbents in nanoscale); (b) TGA curvatures of SAB and SASB polymer blends.
Interestingly, their TGA results in Fig. 3b showed approximately similar thermal decomposition patterns with higher stability up to 283 °C for both SAB and SASB materials. As seen, both polymer blends were gradual decomposed after with increasing temperature over 283 °C and recording 21% weight loss at 402 °C. With increasing the temperature up to 489 oC, both blends were fastly decomposed to achieve a total 71% weight loss due to the carbonization of polymer chains into carbonaceous chare. The N2 adsorption isotherm estimated that both of the prepared polymer blends have mesoporous surfaces with pore diameters around 4.61 nm and 3.92 nm for SAB and SASB sorbents, respectively. Results are consistent with the decrease in total pore volume from 0.015 cc/g SAB to 0.01 cc/g SASB at relative sorption pressure of p/po = 0.987. The decreased pore diameter in SASB may resulted from the lateral functionalized groups in the SASB blend polymer, which may talk part for the pore size (i.e., filling on phenomena). In contrast, the calculated Langmuir surface area were respectively recorded 38.2 m2/g and 20.7 m2/g for SASB and SAB polymer relative to multipoint BET specific area (SBET) of 4.28 m2/g and 5.86 m2/g, respectively.
3.3 Screening of adsorption variables by Plackett–Burman design (PBD)
Barium and strontium metal ions are often found together with basic alkaline/earth metal ions in water environments. Hence, a 38 full factorial two-level PBD matrix was conducted in this application to evaluate the potential variables that significantly affect the adsorption of total Ba2+ and Sr2+ ions from water solutions. In addition, effect of different concentration of alkaline/earth metal ions with TDS ranging from zero to 30 g/L in solution on the adsorption responses were studied. Table 1 outlines the input variable levels in PBD and their corresponding adsorption responses by both SAB and SASB nano-adsorbents. The adsorption results showed a wide efficiency (sorption capacities) variation from 1.6% to 43.7% (0.7 to 120.4 mg/g) and from 55.4% to 99.1% (1.9 to 417.7 mg/g) when using SAB and SASB nano-sorbents, respectively.
3.3.1 Main and interaction effects of the adsorption variables on the adsorption performances
For better optimization of the adsorption process, it was important to investigate and optimize the adsorption capacity rather than adsorption percentages response (Behbahani et al., 2018; Younis et al., 2016). Because the adsorption capacity data (Eq. (2)) depend amount on both adsorbent dose and initial adsorbate concentration, and thus reduce comparison errors by using percentage values. Graphical representations of the polynomial regression models by MINITAB 17 software are presented in Fig. 4 and Fig A1 (Appendix A).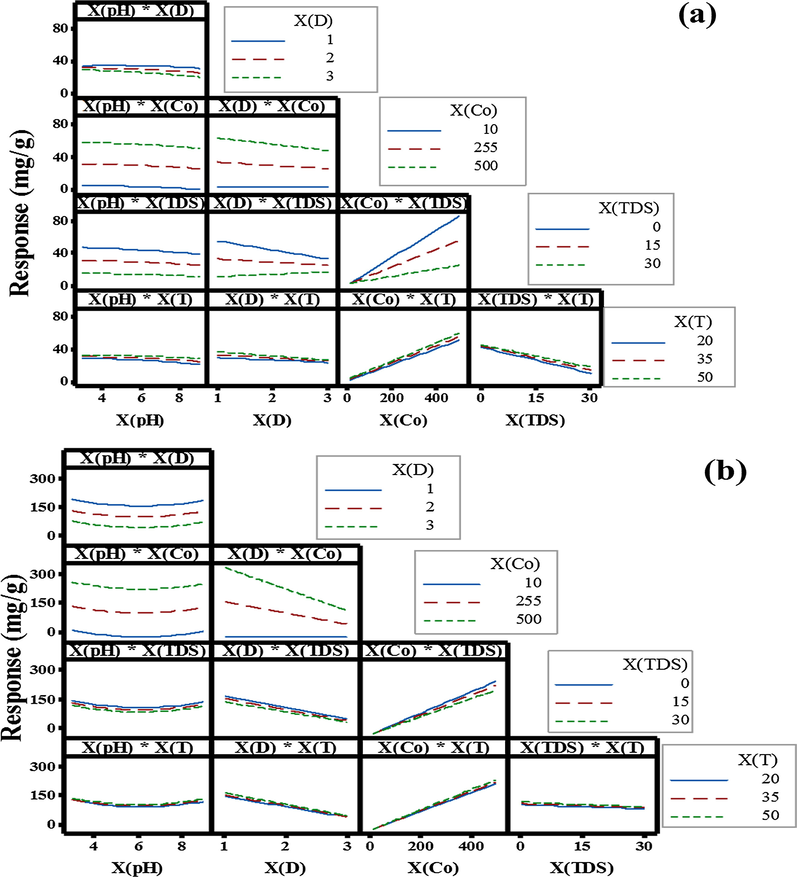
Interactive effects of adsorption parameters on the total Ba2+ + Sr2+ adsorption responses (mg/g) using (a) SAB and (b) SASB nano-sorbents.
The described nanoscale blend polymer possesses a number of different properties such as high electron density and high metal ions adsorption. There are various possible interactions between different ions in aqueous solutions (adsorbate) and the surface of functionalized polymer (adsorbent) depending on the removal mechanism. Factors that affect the preferences for an adsorbate may be related to characteristics of the binding sites (e.g. functional groups, structure, surface properties) and properties of the adsorbent (e.g. concentration, ionic size, ionic weight, ionic charge, molecular structure, ionic nature or standard redox potential) and solution specifications (e.g. pH, ionic strength) (Ho, 2003; Saeed et al., 2005). As shown, Fig. A1 (Appendix A) presents the main effects of each variables and their corresponding interaction plots on the total Ba2+ and Sr2+ adsorption capacity (mg/g) responses by SAB and SASB nano-adsorbents. Interestingly, from Fig. A1 it can be seen that the maximum adsorption capacity (mg/g) by both nano-adsorbents were obtained at high levels of
at 500 mg/L and
at 45°C, and 1 g/L
of adsorbents and zero
level. For instance, both SAB and SASB nanosorbents can be effectively used to capture almost all Ba2+ and Sr2+ metal cations efficiently from deionized water even over a high initial concentration (
) range for both Ba2+ and Sr2+ ions and low adsorbent dose (
). In addition, variable in term of XTDS at its zero level, along with XT and X pH variables are at median to high levels, were attributed to low competitive effect between alkaline earth metal ions and the enhancement of Ba2+ and Sr2+ ions diffusion rate in the bulk solution, and this is directly proportional to the temperature effect on the adsorption performances (Appendix A for details). In multi-components solutions of Ba2+ and Sr2+ along with alkaline/earth metal ions, low Ba2+ and Sr2+ adsorption capacities were recorded. However, the regression results showed lower significant effect of alkaline earth metals (i.e., Na+, K+, Ca2+, Mg2+) on the sorption performance of SASB compared to the original SAB blend even at highest
of 30 g/L (details are given in Appendix A). Interestingly it is evident that the presence of low alkali ions up to 10 g/L has no apparent (negligible) effect on the sorption of Ba2+ and Sr2+ onto SASB. Results were confirmed by statistical regression analysis in Table 2, which showed lower significance effect of TDS on Ba2+ and Sr2+ adsorption capacities by SASB compared to SAB sorbent (F-values of 4.21 and 7.61 at p ≈ 0.05 and 0.01 with the percent contribution (PC%) of 1.09 and 17.12 and 1.09, respectively). However, sorption deviations at higher TDS of > 10 g/L seem to be attributed to: (1) cation complexation due to larger volume specie(s), which decreases the diffusion rate towards the adsorbent surface, and/or (2) competitive adsorption between Ba2+ and Sr2+ ions and alkaline earth metal species (TDS) present in solution (Visa et al., 2010).
Response
Effect on Percentage removal response
Effect on Adsorption capacity response
Term
Effect
t-value
F-value
Effect
t-value
F-value
SAB
SASB
SAB
SASB
SAB
SASB
SAB
SASB
SAB
SASB
SAB
SASB
−1.86
−6.268
−2.93
−5.99
8.57a
35.87a
5.81
−8.8
0.94
−0.44
0.89b
0.19b
12.927
13.969
20.34
13.35
413.64a
178.14a
−11.99
−115.1
−1.95
−5.74
3.79b
32.93a
−8.875
9.297
−13.96
8.88
194.97a
78.92a
53.07
249
8.62
12.42
74.29a
154.19a
−18.082
−19.158
−28.45
−18.31
809.23a
335.09a
−29.8
−31.2
−4.77
−1.55
22.77a
2.42b
4.86
11.273
7.65
10.77
58.55a
116.01a
−2.99
−5.5
−0.49
−0.27
0.24b
0.08b
Using SASB blend nano-sorbent showed favorable Ba2+ and Sr2+ adsorption capacities for acidic or alkaline pH solutions with insignificant statistical response difference (PC% = 0.09%) compared to SAB that attained the highest adsorption at acidic pH ( , PC % = 0.67%) only. As such observations might be because of the displacement of the Ba2+ and Sr2+ ions from their salts in both alkali and acidic solutions. Accordingly, it is suggested that both Ba2+ and Sr2+ should have a considerably prominent affinity for the -SO3H group containing SASB adsorbent through a complexation mechanism (Ba-SO3H and Sr-SO3H)) rather than other alkali metal ions (Holmes, 1962). These observations were confirmed by statistical regression results in Table 2 which showed that can be ignored when adsorption proceed by SASB compared to SAB adsorbent with F-values of 0.19 and 1.88, respectively, at p > 0.05 (Table 2). Furthermore, the analytical results showed that the affinity and adsorption capacity of SASB adsorbent were following the order of Ba2+ (210.5 mg/g) > Sr2+ (175.3 mg/g) (See Table 1). This can be explained based on the ionic radii of hydrated Br2+ and Sr2+ ions and their stability order of complexes formation (Malati and Estefan, 1966).
In this work it was found that the SASB adsorption capacity decreased in the reverse order of the hydration radii of the metal ions. The calculated hydration radii for Sr2+ and Ba2+ were found to be 2.77 Å and 2.69 Å, respectively (Tewari, 1981), and therefore Ba2+ ions with lower hydrated ionic radii have higher adsorptive power.
A comparison between interactive effects of adsorption variables on adsorption capacity responses (mg/g) by SAB and SASB nano-adsorbents was investigated and shown in Fig. 4. Fig. 4a shows that there were high interactions between either sorbent amount or initial metals concentrations with TDS (
and
) on the adsorption performance (mg/g) by SAB sorbent. Comparatively, three interaction effects were found between the studied parameters in terms of (
), (
) and (
) that had the highest significant effect on Ba2+ and Sr2+ adsorption (
) responses using SASB blend nano-sorbent (Fig. 4b). As such, a weak to insignificant interactions effects were observed by other studied combinations between variables on Br2+ and Sr2+ adsorption responses when using SAB or SASB sorbents, and such observations were confirmed by ANOVA results (Table 3 and details are given in Appendix A).
Model components
Model terms
Estimated coefficient
t-value
PC%
Removal %
Sorption performance
Removal %
Sorption performance
Removal %
Sorption performance
SAB
SASB
SAB
SASB
SAB
SASB
SAB
SASB
SAB
SASB
SAB
SASB
Intercept
27.170
45.940
14.00
94.30
0.000
6.320
0.88
4.050
–
–
–
–
−2.220
1.900
−0.69
−42.93
0.086
0.740
−0.37
−5.220
0.56
4.62
0.67
0.09
6.513
9.490
−1.31
2.50
0.000
5.800
−0.220
0.480
27.28
22.95
2.85
14.88
−0.024
0.024
0.188
0.964
0.000
3.320
7.080
41.570
12.86
10.17
55.86
69.67
−0.656
−0.690
−1.206
−0.785
0.000
−5.780
−2.760
−2.050
53.36
43.17
17.12
1.09
0.160
0.521
0.031
0.380
0.004
5.090
0.080
1.160
3.86
14.94
0.18
0.03
0.142
0.119
−0.540
−0.051
0.063
0.790
−0.980
−0.110
0.14
0.01
0.004
0.01
0.0002
0.001
−0.001
−0.002
0.442
1.540
−0.450
−1.090
0.02
0.19
0.09
0.04
−0.011
0.0001
0.026
0.037
0.043
0.030
0.640
1.050
0.25
0.003
0.36
0.30
0.012
0.004
0.019
0.01
0.025
0.420
0.510
0.310
0.28
0.01
0.54
0.07
0.003
−0.004
−0.015
−0.223
0.002
−2.080
−2.180
−37.600
0.24
0.37
1.35
12.87
0.025
−0.018
0.468
0.296
0.112
−0.580
4.000
2.900
0.05
0.003
1.91
0.03
−0.050
−0.060
−0.08
−0.191
0.004
−1.840
−0.670
−1.850
0.22
0.56
0.16
0.00
0.0001
0.0001
−0.004
−0.003
0.032
2.820
−8.560
−6.920
0.12
0.65
14.39
0.39
0.0002
0.0004
0.0005
0.001
0.271
−1.980
1.080
3.610
0.04
0.35
0.24
0.11
0.002
0.000
0.005
−0.002
0.059
−0.040
0.620
−0.240
0.11
0.002
0.08
0.004
3.3.2 Multiple Regression modeling and optimization of adsorption processes
Based on the probability experiments, the PBD coupled with the design of experiment (DOE) analysis suggests the nonlinear polynomial regression model (Eq. (4)) as the best-fitted expression between the response function (adsorption % and capacity mg/g) and the coded variables (
) using SAB and SASB nano-adsorbents. The regression coefficients of each model (
term) is listed in Table 3. A second nonlinear polynomial model was simulated considering the linear and interaction effect of the five variables.
The experimental and statistical analyses allowed simulated mathematical quadratic model (Eq. (4)) to be employed for maximizing Ba2+ and Sr2+ ions adsorption capacities ( ) by both SAB and SASB nano-adsorbents.
The linear effects reflected the strongest influence by a total PC % of 97.9%–95.9% and 76.68%–85.8%. However, the interaction terms show the lowest contribution of 1.5%–2.1% and 19.1%–13.8% for the adsorption performances (as % and mg/g) when using SAB and SASB nano-sorbents, respectively. The interaction terms have least effect on the studied responses except for (PC % = 14.39%, t-value = -8.56 and F-value = 73.31) and (PC % = 12.87%, t-value = −37.6 and F-value = 1413.61) on adsorption capacity (mg/g) responses using SAB and SASB nano-adsorbents, respectively. In spite of the lower influence of interaction terms on responses, the present polynomial model equation enhances the model fit adequately. Adequacy of the polynomial model (Eq. (4)) was checked using analysis of variance (ANOVA) (Appendix A). The F-values of the models were 220.77, 69.48, 29.99 and 721.66 with the value of p < 0.0001 for adsorption % and capacity (mg/g) using SAB and SASB nano-adsorbents, respectively, suggesting that the model was highly accurate. The quality of the polynomial equation (Eq. (4)) was further confirmed by the high accuracy of approximation ( = 0.994, 0.982, 0.958 and 0.998 near to = 0.989, 0.967, 0.926, and 0.997), which were close to unity. The low coefficient of variation (C.V.) of 1.6%–8.32% with higher adequate precision ratios (PRESS) of 122.5–492.5 (greater than 4), indicating an adequate signal for the polynomial equation (Eq. (4)) to predict all the response data by both adsorbents as shown in Figs. A2 and A3 (Appendix A).
The above screening and modeling analyses made the simulated mathematical quadratic models (Eq. (4)) useful for maximizing Ba2+ and Sr2+ ions adsorption capacities (Y mg/g) of both SAB and SASB nano-adsorbents (Details are given in Section S2 in Appendix A). As such, the simulated polynomial models along with their estimated coefficient terms for each response function can be efficiently used to optimize total Ba2+ and Sr2+ ions adsorption by SAB and SASB nano-adsorbents. For this criteria, the desirable variables combination to achieve optimum response by either SAB or SASB nano-adsorbents was found to be: solution 8.0 , 1 g/L , 500 mg/L total Ba2+ and Sr2+ ions , 1 g/L total alkaline/earth dissolved metal salts and temperature of 50°C. At these combined conditions, the predicted responses of 102.7 mg/g SAB and 385.6 mg/g SASB was obtained with a desirable value of 0.907. Experimental validation showed good agreement with predicted response using SAB and SASB adsorbents; experimental results provided 100.87 mg/g (for SAB) and 381.9 mg/g (for SASB) at the same optimum conditions. This support suitability of the model to predict total Ba2+ and Sr2+ ions adsorption capacity by the fabricated SAB and SASB nano-polymeric adsorbents (i.e., standard deviation of ±3.68% − 3.51% and Chi-square errors of ±0.39% −0.67% at 95% confidence). The optimization data indicates that the better Ba2+ and Sr2+ uptake to prevent scales formation is shown at the basic pH when using the SASB NPs, as scale inhibitor, attributed to the stronger ionization and higher electrostatic repulsion of both sulfonate and carboxylate functionalities.
3.4 Adsorption kinetic mechanism
The kinetic studies at optimum operating conditions were carried out to identify a possible mechanism involved in the Ba2+ and Sr2+ adsorption uptake. Two non-linear kinetic models namely; pseudo-first (PFOM) and pseudo-second (PSOM) kinetic regression models (Younis and Moustafa, 2017; Matouq et al., 2015) were tested using IBM SPSS 21 software incorporating 200 iterations. A non-linear form of the kinetic equation and their corresponding calculated kinetic constants are given in Table 4.
Models
Parameters
SAB
SASB
Ba
Sr
Ba
Sr
Experimental
(mg/g)
57.7
45.27
210.4
175.27
PFOM
Cal.
(mg/g)
58.16
48.69
221.204
183.69
(
)
0.576
0.151
0.247
0.213
0.98
0.967
0.927
0.972
AARE
0.03
0.23
0.13
0.07
PSOM
Cal.
(mg/g)
64.13
65.17
269.69
228.16
(g/(mg h))
0.013
0.002
0.001
0.001
mg/(g h)
53.46
8.49
72.73
52.06
0. 91
0.947
0.902
0.947
AARE
0.07
0.27
0.17
0.11
WMM
(mg/ (g
))
32.37
19.725
114.9
75.525
(mg/ (g
))
0.474
1.863
1.5614
1.139
0.993
0.985
0.941
0.9887
0.933
0.868
0.92
0.969
AARE
0.01
0.11
0.10
0.04
KD=
KD (mg/ml)
300.05
221.12
5308.35
2345.38
The relationship between adsorption time and ions uptake by the SAB and SASB is presented in Fig. 5 at
of 500 mg/L for equal concentrations of Ba2+ and Sr2+. The adsorption equilibrium was divided into two regimes characterized by fast adsorption stage (exponential stage) of Ba2+ and Sr2+ ions to the functional adsorbent surfaces followed by a second slower stage indicating equilibrium.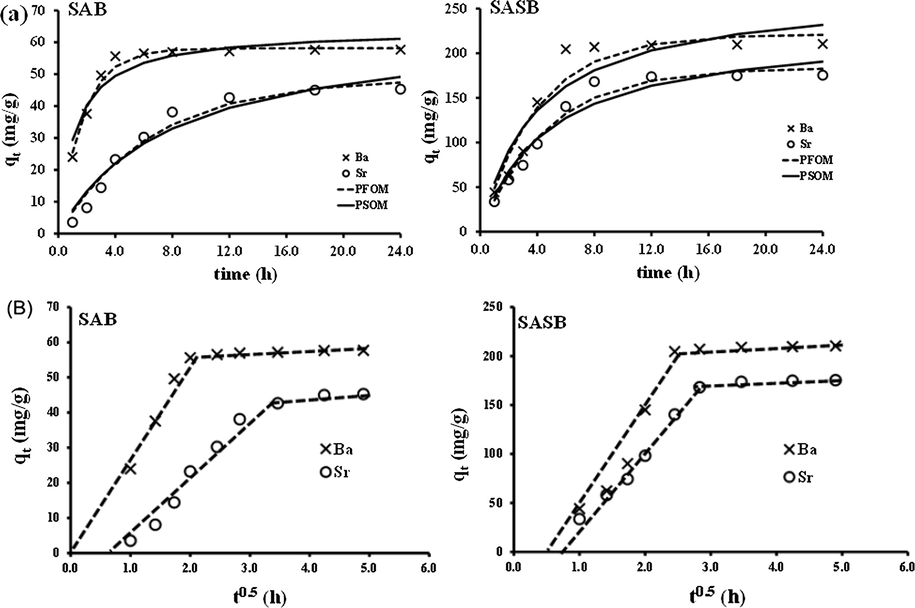
Effect of contact time on the adsorption of Ba+2 and Sr+2 by SAB and SASB sorbents and kinetic fitting by (a) PFOM and PSOM, and (b) WMM theories.
The second equilibrium stage evolved after approx. 8 h and 6 h for the SAB and SASB nanoparticles, respectively. The diffusion rate and adsorption uptake were slower due to the maximum saturation level of adsorbent surface functional vacant sites with adsorbates ions. Thereafter, the remaining unoccupied sites were difficult to attach by the metal ions due to steric hindrance that results between the adsorbed solute ions and solute in the bulk aqueous environment (Jin et al., 2011).
Experimental kinetic results depict a higher affinity of SASB NPs sorbent with a rapid of Ba+2 uptake ( ≈ 210.4 mg/g) compared to Sr+2 ions ( ≈ 175.3 mg/g) (Fig. 5a). Table 4 depicts also a rapid Ba+2 uptake over a considerably lower period of time compared to Sr+2 with the value of initial sorption rate values of ‘ ’ of 53.46 and 72.73 mg/(g h), and 8.49 and 52.06 mg/(g h) by both SAB and SASB adsorbents, respectively. To mathematically and quantitatively demonstrate the Ba+2 or Sr+2 selectivity, the KD distribution coefficient (Behbahani et al., 2017) was calculated to indicate the selectivity of metal ions adsorption onto the fabricated sorbents. As listed in Table 4, the KD sequence was in the order of Ba (II) > Sr (II) with the highest selectivity of the SASB NPs for barium than strontium uptake (KD ≈ 5308.35 and 2345.38 mg/mL), which is in a good agreement with the optimized data obtained above. This can be explained based on (1) The lower ionic radii of hydrated Br2+ (2.69 Å) than Sr2+ (2.77 Å) ions; (2) The higher SASB [(HSO3-SBR/AN-COOH)] negativity charges that promote affinity and selectivity to adsorb Ba ions with lower electronegativity (0.97) comparable to Sr ions of higher electronegativity (0.99) (Fard et al., 2017); and (3) The higher tendency of Ba (II) than Sr (II) for SASB functional groups to form stable complexes formation [(Ba-SO3-SBR/AN-COO-Ba)], which plays a role too (Malati and Estefan, 1966; Tewari, 1981). The present work thus proves that the SASB NPs preferences the accumulation of Ba (II) ions on their surface functionalities, leading to electrostatic neutrality as well as the adsorptive power decreased in the reverse order of electronegativity and the hydration radii of the metal ions.
The overall kinetic results in Table 4 revealed that the sorption of Ba2+ and Sr2+ ions by SAB and SASB nano-adsorbents were likely represented by both PFOM and PSOM as confirmed from Fig. 5a. Comparing the results of the correlation coefficients (
) and AARE error values in Table 4, PFOM was found to be the superior model for Ba2+ and Sr2+ ions adsorption by SAB and SASB sorbents with high
value and very low AARE error statistics. Such adsorption behavior of Ba+2 and Sr+2 by SAB and SASB adsorbents was in agreement with physical and chemical adsorption processes. Thus, the prevalent mechanism was the PFOM sorption and the overall rate constant of each adsorbent seem to be governed by the predominant physical sorption mechanism assisted by chemisorption process (Sajih et al., 2014). The kinetic data was further tested by Weber and Morris (WMM) theory (Weber and Morris, 1962) in order to quantify the pore diffusion rate-controlling step involved in adsorption (Table 4). According to the WMM theory, the Ba+2 and Sr+2 uptake varies with
and
(mg/ (g.
)), which was the rate constant of stage i. From the results shown in Table 4, it can be seen that the
values were in the order of Ba+2 > Sr+2 and their values increased with SASB adsorbent rather than with SAB sorbent. The Ba+2 diffusion mechanism on SAB sites depended on one of the rate-controlling adsorption mechanisms until reaching equilibrium, see Fig. 5b. The deviation from zero origin or near saturation on SASB adsorbent might be due to the high desirability of chemical adsorption mechanism located between the surface functionalities (i.e., complexation and/or electrostatic chelation with (N≡C-SAB) and SASB [(HSO3-SBR /AN-COOH) functional group) and Ba+2 and Sr+2 metal ions rather than the pre-diffusion mechanism. With time, almost of the surface active sites are exhausted with Ba+2 and Sr+2 ions, and thus the multilayer coverage take place followed by a lower uptake rate until it ultimately reaches an equilibrium plateau. As such, the physical sorption involving valence forces for sharing or exchanging electrons without formation of complexity due to complete surface active sites occupation, forming a chemical bond. Hence, one can assume that the tailored-to-purpose of co-existence of -COOH and -SO3H groups on the functionalized surface of SASB might be a promising tool to promote selectively removed of divalent barium and strontium ions compared to other reported sorbents (Table 5) from a complex oilfield water sample or produced formation water to prevent scale formation.
Adsorbents
Adsorbate ions
Sorption experiment
Max. sorption capacity (mg/g)
References
2-D MXene nanosheet
Ba2+
Batch
9.3
Fard et al. (2017)
maghemite and titania (γ-Fe2O3/ TiO2) in alginate beads nanocomposite
Ba2+
Batch
20
Majidnia et al.(2015)
dolomite powder
Ba2+
Batch
0.312
Ghaemi et al. (2011)
Sr2+
0.399
Surfactant-modified clinoptilolite-rich tuff
Ba2+
Batch
1.2
Baeza-Alvarado and Olguín, (2011)
Synthetic Hydroxyapatite nanoparticles
Sr2+
Batch
2.66
Nishiyama et al. (2016)
moss
Sr2+
Batch
120
Pettengill and Levy, (2016)
Saccharomyces cerevisiae
Sr2+
Batch biosorption
1.549
Qiu et al. (2019)
Dowex 50 W-X Resins
Sr2+
Batch
125
Hafizi et al. (2011)
antimony silicate
Sr2+
Batch
12.5
Zhang et al. (2015)
clay
Sr2+
Batch
39.683
Abdel-Karim et al. (2016)
Hydrous ceric oxide
Sr2+
Batch
0.106
Mishra and Singh, (1995)
Ba2+
Batch
0.0517
Bacillus cereus cells
Sr2+
Batch biosorption
58.79
Long et al. (2017)
pecan shell based activated carbon
Ba2+
Batch
3.33
Sudha and Premkumar, (2018)
Sr2+
8.8
SAB
Ba2+
Batch
57.7
This work
Sr2+
45.27
This work
SASB
Ba2+
210.4
This work
Sr2+
175.27
This work
4 Conclusions
A novel inorganic oilfield scale inhibitor is provided based on systematic Ca2+ ion adsorption studies using carboxylate containing compounds. Homogenous blend nanopolymer of poly(acrylonitrile)/(styrene-butadiene rubber) (SAB) was fabricated using γ-radiation at dose 20 kGy. The resultant SAB product was then chemically converted into two subsequent reactions to produce -SO3H and -COOH terminally functional ion exchange resins (SASB), with confirmed chemical structure. Adsorption selectivity of SASB nano-adsorbent towards barium (Ba2+) and strontium (Sr2+) ions from highly salt aqueous solution of 30 mg/L total dissolved solids (TDS) was evaluated and optimized using Plackett-Burman factorial design (PBD) combined with multiple regression analysis. Simulation of adsorption efficiency and capacity responses using SAB and SASB adsorbents were established using two model structures (first-order and polynomial models), and tested for their adequacy. Interaction effect of five adsorption variables including; solution pH, adsorbents dose, total dissolved salts (TDS), initial Ba2+ and Sr2+ concentrations and temperature on the adsorption responses were investigated and optimized using ANOVA and regression coefficient statistical analyses at 95% confidence limits. Examination of Ba2+ and Sr2+adsorption selectivity and their kinetics provide comparative insights between SASB ion exchange adsorbent and SAB copolymer. Overall, SASB nano-adsorbent show higher degree of selectivity towards Ba2+ and Sr2+ adsorption from high TDS salty water compared to SAB sorbent. In addition, SASB adsorbent has 1.2 times higher Ba2+ adsorption capacity than Sr2+. This work has direct applications in the oil and gas industry for improved oil and gas recovery.
References
- Experimental and modeling investigations of cesium and strontium adsorption onto clay of radioactive waste disposal. Appl. Clay Sci.. 2016;132–133:391-401.
- [Google Scholar]
- Surfactant-modified clinoptilolite-rich tuff to remove barium (Ba 2+) and fulvic acid from mono- and bi-component aqueous media. Microporous Mesoporous Mater.. 2011;139:81-86.
- [Google Scholar]
- Mechanistic aspects on the influence of inorganic anion adsorption on oilfield scale inhibition by citrate. J. Petrol. Sci. Eng.. 2010;70(3):298-301.
- [Google Scholar]
- Evaluation of naturally occurring radioactive materials (NORM) in inorganic and organic oilfield scales from the Middle East. Archives Environ. Contam. Toxicol.. 2012;62(3):361-368.
- [Google Scholar]
- Selective and sensitive determination of silver ions at trace levels based on ultrasonic-assisted dispersive solid-phase extraction using ion-imprinted polymer nanoparticles. Appl. Organomet. Chem.. 2017;27(31):1-9.
- [Google Scholar]
- Application of a dispersive micro-solid-phase extraction method for pre-concentration and ultra-trace determination of cadmium ions in water and biological samples. Appl. Organomet. Chem.. 2018;32:1-10.
- [Google Scholar]
- Barium sulfate scale formation in oil reservoir during water injection at high –barium formation water. J. Appl. Sci.. 2007;7(17):2393-2403.
- [Google Scholar]
- A novel lead imprinted polymer as the selective solid phase for extraction and trace detection of lead ions by flame atomic absorption spectrophotometry: Synthesis, characterization and analytical application. Arab. J. Chem.. 2017;10:S2499-S2508.
- [Google Scholar]
- Barium removal from synthetic natural and produced water using MXene as two dimensional (2-D) nanosheet adsorbent. Chem. Eng. J.. 2017;317:331-342.
- [Google Scholar]
- Ferguson R.J., Ferguson B.R., 2010. The Chemistry of Strontium and Barium Scales, Assoc Water Technol. 1–17. (French Creek Software, Inc., Kimberton, PA 19442).
- Petroleum Engineer’s Guide to Oil Field Chemicals and Fluids. Waltham, MA: Gulf Professional Publishing; 2012.
- Formation, removal, and inhibition of inorganic scale in the oilfield environment. Richardson, TX: SPE; 2008.
- Characterizations of strontium(II) and barium(II) adsorption from aqueous solutions using dolomite powder. J. Hazard. Mater.. 2011;190:916-921.
- [Google Scholar]
- Radiation crosslinking of polyurethanes: characterization by FTIR, TGA, SEM, XRD, and Raman spectroscopy. J. Polymers 2016:9.
- [Google Scholar]
- Strontium adsorption from sulfuric acid solution by dowex 50W-X resins. Chinese J. Chem. Eng.. 2011;19:267-272.
- [Google Scholar]
- Removal of copper ions from aqueous solution by tree fern. Water Res.. 2003;37:2323-2330.
- [Google Scholar]
- From elective affinities to chemical equilibria: Berthollet’s law of mass action. Chymia.. 1962;8:105-145.
- [Google Scholar]
- Preparation of novel nano-adadsorbent based on organic-inorganic hybrid and their adsorption for heavy metals and organic pollutants presented in water environment. J. Hazard. Mater.. 2011;186:1672-1680.
- [Google Scholar]
- Jordan M, Mackay E, SPE 179886, A etrospective review of 10 years of scale management in a Deepwater Field: From Capex to Plateau Production. In: SPE International Oilfield Scale Conference and Exhibition, Aberdeen, U.K., 2016.
- Production Chemicals for the Oil and Gas Industry (second ed.). Boca Raton, FL: CRC Press; 2014.
- Advanced nanomaterials in oil and gas industry: design, application and challenges. Appl. Energy.. 2017;191:287-310.
- [Google Scholar]
- Lebovka N.I., 2012. Aggregation of charged colloidal particles. In: Polyelectrolyte Complexes in the Dispersed and Solid State I, Springer, pp. 57–96.
- Biosorption of strontium(II) from aqueous solutions by Bacillus cereus isolated from strontium hyperaccumulator Andropogon gayanus. Process Saf. Environ. Prot.. 2017;111:23-30.
- [Google Scholar]
- Efficiency of barium removal from radioactive waste water using the combination of maghemite and titania nanoparticles in PVA and alginate beads. Appl. Radiat. Isot.. 2015;105:105-113.
- [Google Scholar]
- The role of hydration in the adsorption of alkaline earth ions onto quarts. J. Colloid Interface Sci.. 1966;22:306-307.
- [Google Scholar]
- The adsorption kinetics and modeling for heavy metals removal from wastewater by Moringa pods. J. Environ. Chem. Eng.. 2015;3:775-784.
- [Google Scholar]
- Radiotracer technique in adsorption study-XI. adsorption of barium and strontium ions on hydrous ceric oxide. Appl. Radiat. Isot.. 1995;46:75-81.
- [Google Scholar]
- Adsorption and removal of strontium in aqueous solution by synthetic hydroxyapatite. J. Radioanal. Nucl. Chem.. 2016;307:1279-1285.
- [Google Scholar]
- Circulating human neonatal naïve B cells are deficient in CD73 impairing purine salvage. Front. Immunol.. 2016;7:27-36.
- [Google Scholar]
- Peydro Rasero MA, Varón DJ, Caballero SS, Parres F. Study of the thermal properties of NiStyrene. In: Ann. Univ. Oradea, Editura Universitatii din Oradea. 2013: 273–276.
- Adsorption of carboxylate anions on a CaCO3 surface. Zeitschrift für Naturforschung B.. 2007;62(10):1277-1284.
- [Google Scholar]
- Mechanisms of strontium’s adsorption by Saccharomyces cerevisiae: contribution of surface and intracellular uptakes. Chemosphere. 2019;215:15-24.
- [Google Scholar]
- Removal and recovery of lead (II) from single and multimetal (Cd, Cu, Ni, Zn) solutions by crop milling waste (black gram husk) J. Hazard Mater. B.. 2005;117:65-73.
- [Google Scholar]
- Adsorption of radium and barium on goethite and ferrihydrite: A kinetic and surface complexation modelling study. Geochim. Cosmochim. Acta.. 2014;146:150-163.
- [Google Scholar]
- Science and technology for water purification in the coming decades. Nature. 2008;452(7185):301-310.
- [Google Scholar]
- Surface modification, functionalization and bioconjugation of colloidal inorganic nanoparticles. Philos Trans A Math Phys Eng Sci. 2010;368:1333-1383.
- [CrossRef] [Google Scholar]
- Comparative studies on the removal of chromium(VI) from aqueous solutions using raw and modified Citrus Limettioides peel. Indian J. Chem. Technol.. 2018;25:255-265.
- [Google Scholar]
- Adsorption from Aqueous Solutions. Springer Verlag; 1981.
- Simultaneous adsorption of dyes and heavy metals from multicomponent solutions using fly ash. Appl. Surf. Sci.. 2010;256:5486-5491.
- [Google Scholar]
- Direct polymerization of sulfonated poly (arylene ether sulfone) random (statistical) copolymers: candidates for new proton exchange membranes. J. Membrane Sci.. 2002;197(1):231-242.
- [Google Scholar]
- Advances in water pollution research: removal of biologically resistant pollutant from waste water by adsorption. In: Proc. Int. Conf. Water Pollution Symposium. Oxford, UK: Pergamon Press; 1962. p. :231-266.
- [Google Scholar]
- Synthesis of urea-modified MnFe2O4 for aromatic micro- pollutants adsorption from wastewater : Mechanism and modeling. Clean Technol. Environ. Policy. 2017;19:527-540.
- [Google Scholar]
- Utilization of a pyrrole derivative based antimicrobial functionality impregnated onto CaO/g-C3N4 for dyes adsorption. RSC Adv.. 2016;6:89367-89379.
- [Google Scholar]
- Adsorption characteristics of strontium on synthesized antimony silicate. Chem. Eng. J.. 2015;277:378-387.
- [Google Scholar]
Appendix A
Supplementary material
Supplementary data to this article can be found online at https://doi.org/10.1016/j.arabjc.2018.12.010.
Appendix A
Supplementary material
The following are the Supplementary data to this article:Supplementary data 1
Supplementary data 1


