

Translate this page into:
The analysis of new higher operative bioactive compounds and chemical functional group from herbal plants through UF-HPLC-DAD and Fourier transform infrared spectroscopy methods and their biological activity with antioxidant potential process as future green chemical assay
⁎Corresponding author. dr.waseemahmed@uoh.edu.pk (Waseem Ahmed)
-
Received: ,
Accepted: ,
This article was originally published by Elsevier and was migrated to Scientific Scholar after the change of Publisher.
Abstract
The two herbal plants of Adhatoda vasica and Calotropis procera, commonly available in worldwide, were selected to explore their medicinal significance. The isolation and quantitative analysis of ten important bioactive compounds such as P-hydroxy-benzoic, Stictic acid, Usnic acid, Epigallocatechin gallate, Quercetin, Epigallocatechin, Catechin, Morin, Epicatechin and Naringenin, isolated from various parts was performed by using UF-HPLC-DAD and FTIR techniques. The antioxidant potentials of isolated bioactive compounds were evaluated through six methods including Electron spin resonance spectrometry, ABTS Assay, Diphenyl picrylhydrazyl (DPPH) radical scavenging assay, total radical-trapping, ORAC, and phycoerythrin assay on various plant parts. The advanced ESR method along with five other methods was applied for the first time on these species to evaluate the antioxidant potential of both species. The results showed that the flowers of Adhatoda vasica prove to be a rich source of important compounds in which Naringenin (15 ± 0.41) was higher in the flowers. The similar trend observed in twigs and seeds of Adhatoda vasica, the Epicatechin was higher in seeds of Calotropis procera. Results showed that the electron spin resonance spectrometry and ABTS radical scavenging assay methods showed higher antioxidant potential in Adhatoda vasica and Calotropis procera as compared to Diphenyl picrylhydrazyl (DPPH) radical scavenging assay.
Keywords
Herbal plants
UF-HPLC-DAD
ESR
FTIR
Bioactive compounds
DPPH
ABTS

1 Introduction
Herbal plants contained a massive range of different phenolic compounds, and their derivatives which are important components as potent antioxidants, used in perfumes, synthetic dyes, and in the prevention of various oxidative stresses and pharmaceuticals uses as the manufacture of a drug for curing of the human body (Altemimi et al., 2017; Rice-Evans et al., 1996). Plant-derived antioxidants like polyphenolics compounds are recognized as vital constituents related to their probable valuable properties (Tiwari and Mishra, 2011). In herbal medicine different plants, parts such as root, bark, leaves, fruits, and seeds may use for treatments of many diseases of the human body (Schmitz et al., 2005). The Antioxidants are accomplished by stabilizing or deactivating, free radicals; formerly they attack cells and damages the cellular component during the oxidative process (Madhavi et al., 1995). Herbal plants are the precise resource of antioxidants due to their vital role in preventing the damaging of the cells and controlling the oxidative stress of the human body (Antolovich et al., 2002). The infrared spectroscopy is a powerful tool for analytical techniques to analyze any sample in any state, FT and IR was measured the vibration of a molecule excited with infrared radiation, used for the identification of organic, inorganic, and polymeric materials under infrared light for scanning the samples. The current study reported the various phenolic acids with their mode of action for the first time from Adhatoda vasica and Calotropis procera through high-performance liquid chromatography diode array detection (HPLC-DAD). Furthermore, the solvent extraction method was also employed for the determination of the quantity of these important bioactive compounds, and their Ferric ion reducing antioxidant potential (FRAP) assay was tested using standard methods. During the last decade, several analytical methods were applied to measure free radical activity in herbal plants (Rice-Evans et al., 1995; Corbo et al., 2000; Ahmed et al., 2018a). The free radical activity in tea plants and fruits detected by the Spin resolution techniques found more suitable and advanced for the extraction process (Ahmed et al., 2018b; Debrot et al., 1999). Electron spin resonance spectrometry is a direct and reliable method to identify and quantify the detection of free radicals and the antioxidant potential of plant extracts. Most radicals were damaged and replaced during the analytical process (Rice-Evans and Miller, 1994; Miyake et al., 2000; Wayner et al., 1987). Therefore the planned study used suitable dyes or compounds of (like 5;5-dimethylpyrroline-N-oxide (DMPO), (tNB), ter-butylnitrosobenzene (BNB), 3,5-dibromo-4-nitrosobenzene sulfonic acid (DBNBS) in extraction process to get better results (Corbo et al., 2000).
Adhatoda vasica belongs to the family Acanthaceae that are commonly known as Malabar Nut plants (Ahmed et al., 2018b) Calotropis procera is a species of flowering plant which belongs to the family Asclepiadaceae (lima). It is widely distributed in Asia and subcontinents as well as in West Africa and other parts of the tropics Irvine. Antioxidants bioactive compounds were widely distributed in plants that have been reported to excess multiple biological effects, including antioxidant, free radicals scavenging abilities, anti-inflammatory, anti-carcinogenic (Debrot et al., 1999). This research article discloses the isolation often essential bioactive compounds from Adhatoda vasica and Calotropis procera using UF-HPLC-DAD and Fourier transform infrared spectroscopy (FTIR) analysis of a various class of compounds and several methods including ESR were used to evaluate the antioxidant potentials in these compounds as future green resolution, new synthetic methods compounds as used in various pharmacy and pharmaceutical industries.
2 Material and methods
2.1 Pure sample preparation and extracts
The plant extract was prepared by taking 1 g of powdered dry sample and 10 ml of distilled water added to it. The sample was then mixed with the help of a mechanical shaker and filtered through filter paper. The plant sample then transferred to the separate bottle and the pure solution was kept in the refrigerator as described by (Ivanišová et al., 2020).
2.2 Sample elution
The pure solution of both plants samples was run in the ultra action process through UF-HPLC was used with linked of filtering membrane (Size 0.22 µm), of samples further the samples were diluted into a 1:10 V/V of the buffer with 12 mM of ABS solution was used and adjusted the pH 7.5 before running of the sample. The bioactive compound was eluted from the bioactive receptor complex on the dried filter plates over which MS binding samples were harvested. One hundred microliters of eluent (50% methanol, 50% ammonium formate buffer [final concentration 5 mM at pH 7, spiked with 2 mM [2H] DPCPX or [2H] ZM-241385 as internal standard, all HPLC grade) was applied to the filter plates which were then centrifuged for 1 min at 800g (2000 rpm) in a 5810 plate centrifuge (Eppendorf, Hamburg, Germany), while filter eluates were collected in 1.1 ml polystyrene deep 96-well plates (Brand Tech Scientific, Essex, CT, USA). This procedure was performed twice resulting in a total of 200 μL eluate for each sample. For standard curve samples, the same procedure was followed but for the presence of increasing concentrations (1–100 pM) of DPCPX or ZM-241385 in the eluent. After elution, 96-deep-well plates were sealed with rapid easy pierce film (Nacalai, San Diego, CA, USA) and stored at −20 °C before LC-MS-MS quantification (Hou et al., 2020).
2.3 New and innovative methods of UF-HPLC-MS apparatus used
The identification of mass spectrometers with (6530 UF-HPLC ALO, CA, USA) with chromatographic separation was employed on a new advanced column of ZORBAX ST C18 column the eddulent of HPLC mobile phase attached with electrospray ionization (ESI) source. The parametric conditions were capillary voltage 3600 V; nozzle voltage 1000v, the flow rate of drying gas “ 7L/Min” Skimmer voltage 66 V; RFOCT2 750, fragmentor voltage 136 V, The spectra data were obtained in full-scan MS mode was attached in the system, the data was observed with a diverse collision energy source of (19–46 eV) (Ahmed et al., 2018b).
2.4 Assay based binding of UF-HPLC-MS
The proper isolation screening of bioactive compounds was based on three steps of samples preparation washing, incubation, dissociation process was done on both herbal plants. Both samples were incubated with 20 mins in buffer solution at 38 °C the solution was boiled in a water bath. The auto ultrafiltration device (Millipore Crop, MA, USA) was attached to HPLC-MS. The millipore amicon ultra −0.6 ml, item UFC, 503207). The bioactive compounds were further evaluated with 1000 L of 50% methanol directly (Hou et al., 2020).
2.5 UF-HPLC- producer accuracy and method
The procedure of screening was manipulated according to the approach of previous research and consisted of three steps: incubation, washing, and dissociation. Briefly, 100 µL of tested SMD solution was incubated with 200 µL HSA (600 µM) and 200 µL buffer solution for 20 min at 37 °C. Meanwhile, denatured HSA solution (boiled for 15 min in a water bath) was used as the negative control in the same manner. The incubated solutions were then filtered through ultrafiltration devices (Millipore Corp., Billerica, MA, USA) with a 30 kDa molecule weight cut-off membrane (Millipore AmiconUltra-0.5 ml, item: UFC 503096) and centrifuged at 14,000g to separate the non-specific ingredients from the HSA-ligand complexes for 15 min at room temperature. The residues were then washed with 200 µL of buffer solution by centrifugation to remove the unbound components three times. The ligands showing specific binding to HSA were then released from the mixtures by elution with 400 µL 50% methanol (pH = 3) for 20 min, and then centrifuged at 14,000g for 15 mins at room temperature, a process which was repeated twice. The dissociated filtrates were combined and added to 1000 µL by 50% methanol and then directly analyzed (Li et al., 2020).
2.6 Fourier transform infrared spectroscopy (FTIR) analysis for compounds
The FTIR (Model/ Make 25 Germany) with the attached auto software for data and operational processes. The small amount of all leaves twigs flower and seed of both plants were made into a pellets KBr for FTIR analysis and thin film for pressure. All the samples were analyzed in triplicates with plain KBr pellets as blank. The spectral data were compared with a reference to identify the functional groups existing in the samples (Ahuchaogu et al., 2020).
2.7 DPPH radical scavenging assay
The scavenging activity was estimated using the method described by Ahmed et al. (2018a). 0.5 ml of various concentrations of the extracts (0.1–0.5 mg ml−1) in methanol were added to 3 ml of DPPH (2,2-diphenyl-2-picrylhydrazyl) solution (0.004%) in methanol. After the mixture was incubated in darkness at room temperature for 30 min, the absorbance was recorded at 517 nm by UV spectrophotometer (Shimadzu Corporation, Kyoto, Japan). Inhibition of the free radical by DPPH (I) was calculated from the Eq. (3) described by (Chen et al., 2020) I = [(Ablank − A sample)/Ablank] × 100, (3) where A blank is the absorbance of the blank (containing all reagents except the extract or standard), and A sample is the absorbance of the extract or standard. The value of IC50 was determined from the plot of scavenging activity, drawn according to the concentration of the extract, which is defined as the total antioxidant activity necessary to decrease by 50% the initial DPPH radical concentration. The experiments were carried out in triplicate. Butylated hydroxytoluene (BHT) and butylated hydroxyanisole (BHA) were used as standard antioxidants (Loucif et al., 2020).
2.8 Ferric reducing (FRAP) assay
The ferric reducing antioxidant power of the extract was investigated by the method developed by Jones et al. (2020). Different amounts of the extracts (0.025–0.4 mg ml−1) in methanol were mixed with 2.5 ml of phosphate buffer (0.2 M, pH 6.6) and 2.5 ml of potassium ferricyanide (1%) [K3 Fe(CN)6]. The mixture was incubated at 50 ◦C for 20 min. The mixture was added to an aliquot of trichloroacetic acid (10%). Then, this mixture was centrifuged for 10 min. The obtained upper layer (2.5 ml) was transferred to another tube with 5 ml of distilled water and then 1 ml of ferric chloride (0.1%) was added to the obtained mixture. The absorbance was measured at 700 nm. The tests were run in triplicate.
2.9 ESR measurements from herbal plants
The measurements were performed using an ESR spectrometer (X-Band Bruker EMX 081, Rheinstetten, Germany) in Saraykoy Laboratory of TAEK (Turkish Atomic Energy Authority). The measurements were set as follows: the microwave power was 2 mW, the modulation frequency was 100 kHz, and the modulation amplitude was 0.5 G (Ahmed et al., 2018a).
2.10 ABTS radical scavenging assay by spectrophotometry
In this assay, the radical scavenging activities of extracts were determined by using the ferryl myoglobin/ABTS protocol (Fernández-Poyatos et al., 2020). The stock solutions of 500 mM ABTS diammonium salt, 400 mM myoglobin, 740 mM potassium ferricyanide, and 450 mM H2O2 were prepared in phosphate-buffered saline (PBS) (pH 7.4). Metmyoglobin (MbIII) was prepared by mixing equal amounts of myoglobin and potassium ferricyanide solutions. The reaction mixture (total volume 2 ml) contained the following substances (final concentrations in the reaction mixture): ABTS (150 mM), MbIII (2.5 mM), 16.8 ml of the sample, and 978 ml PBS. The reaction was initiated by adding 75 mM H2O2 (330 ml) and the lag time in seconds, before the absorbance of ABTS+ at 734 nm began to increase was recorded. The calibration curve was plotted with lag time in seconds versus the concentration of the standard antioxidants (L-ascorbic acid or Trolox).
2.11 Oxygen radical absorbance capacity assay
In the oxygen radical absorbance capacity (ORAC) assay, oxygen radical absorbance capacity was measured on the detection of chemical damage to b-phycoerythrin through the decrease in the fluorescence emission. The fluorescence was recorded every 5 min until the last reading was less than 5% of the 0 min reading. ORAC values were calculated in terms of mmol/g of fresh weight (Amirah et al., 2020).
2.12 Total phenolic contents
The amount of TP was calculated using Folin–Ciocalteu reagent. 0.5 ml of essential oil was mixed with 2.5 ml of 10% Folin–Ciocalteu reagent. The mixture was kept at room temperature for 10 min and then 2.0 ml of 75% sodium carbonate (w/v) was added. The mixture was vortexes for 15 s heated in a water bath at 40 °C for 30 min and then cooled in an ice-bath; finally, absorbance was taken at 765 nm. The amount of TP was calculated using a calibration curve for Gallic acid (20–100 ppm). The results were expressed as Gallic acid equivalents (GAE) per dry matter (Loucif et al., 2020; Barbouchi et al., 2020; Sengun et al., 2020).
2.13 Total antioxidant activity determination by ferric thiocyanate method (FTC)
The antioxidant activity of Adhatoda vasica and Calotropis procera was determined according to the ferric thiocyanate method (FTC) as described by Besbas et al. (2020). Then, the solution which contains different concentrations of plants extracts (from 15 to 45 μL/mL) solution in 2.5 ml of sodium phosphate buffer (0.04 M, pH 7.0) was added to 2.5 ml of linoleic acid emulsion in sodium phosphate buffer (0.04 M, pH 7.0). For this, 5 ml of the linoleic acid emulsion was prepared by mixing and homogenizing 15.5 μL of linoleic acid, 17.5 mg of tween-20 as an emulsifier, and 5 ml phosphate buffer (pH 7.0). On the other hand, 5 ml of control composed of 2.5 ml of linoleic acid emulsion, and 2.5 ml, 0.04 M sodium phosphate buffer (pH 7.0). The mixed solution (5 ml) was incubated at 37 °C in a polyethylene flask. The peroxide levels were determined by reading the absorbance at 500 nm in a spectrophotometer (Shimadzu, UV-1208 UV–VIS Spectrophotometer, Japan) after reaction with FeCl2 and thiocyanate at intervals during incubation. In the FTC method, during the linoleic acid peroxidation, peroxides are formed and this leads to oxidation of Fe+2 to Fe+3. The latter ions form a complex with thiocyanate and this complex has a maximum absorbance at 500 nm. The absorbance of the red color was measured at 500 nm until it reached a maximum value (Elmastaş et al., 2006). This step was repeated every 5 h. The percentage inhibition values were calculated at this point (30 h). High absorbance indicates high linoleic acid emulsion peroxidation. The solutions without oil were used as blank samples. The inhibition percentage of lipid peroxidation in the linoleic acid emulsion was calculated by the following equation: where Ac is the absorbance of control reaction which contains only linoleic acid emulsion and sodium phosphate buffer and As is the absorbance in the presence of plant samples (Gülçin, 2006a,b).
2.14 Statistical analysis
The couple markers of all compounds confirmed after extractions process of each sample which prepared through software of graph Pad Prism 7.04. The developed methods are confirmed and aureate the measurement of all bioactive compounds confirmed through standards digital library. The data of HPLC-DAD was measured by the help of Chrom Gate v 3.31 Knauer software was used (Ahmed et al., 2018b).
3 Results
In this study, various bioactive compounds isolated in the leaves, flowers, twigs, and seeds of the two herbaceous species of Adhatoda vasica and Calotropis procera showed the precious resource of antioxidant and antimicrobial agents (Ahmed et al., 2018b) which can be used in place of many existing species for their bioactive compounds.
3.1 UF-HPLC-MS methods for isolation of bioactive compounds from herbal plant
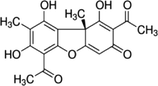
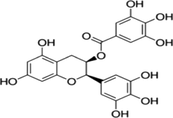
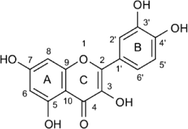
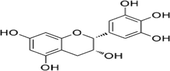
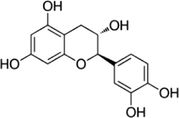
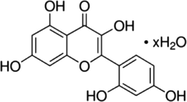
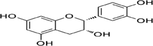
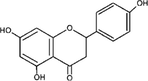
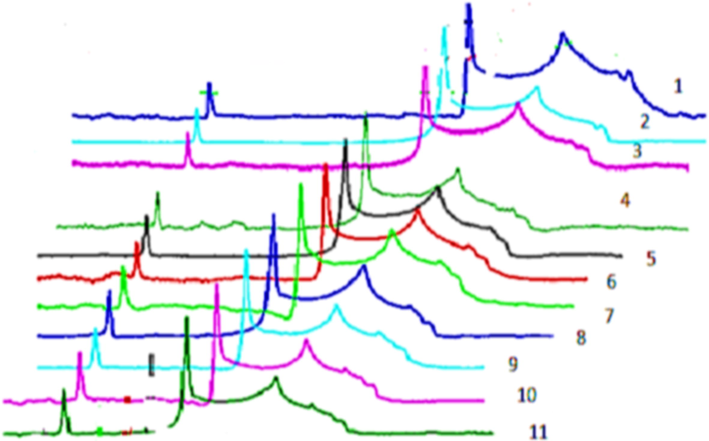
The ten critical bioactive compounds isolated from various parts of (leaves, flower, twigs, and seeds) both herbal plants are shown in Table1. The isolation of ten crucial bioactive compounds such as P-hydroxy-benzoic, Stictic acid, Usnic acid, Epigallocatechin gallate, Quercetin, Epigallocatechin, Catechin, Morin, Epicatechin, Naringenin measured in various parts of Adhatoda vasica and Calotropis procera. The higher range of Naringenin was measured (16 ± 0.41) in the leaves of Adhatoda vasica while the Quercetin and Epicatechin are showing the same value of (14 ± 0.02). The higher value of Quercetin, Stictic acid, Catechin Morin, Naringenin also displayed the same values in leaves extracts of Calotropis procera. The results showed that the flowers of Adhatoda vasica prove to be a rich source of important compounds in which Naringenin (15 ± 0.41) was in higher in the flowers. Similarly the Quercetin, Epigallocatechin contents were higher in leaves' extracts of Calotropis procera. The similar trend observed in twigs and seeds of Adhatoda vasica, however, the Epicatechin was higher in seeds of Calotropis procera. The chromatogram of ten important bioactive compounds isolated from the UF-HPLC-MS method is shown in Figs. 1 and 2. Ten essential compounds isolated in herbal plants while the determinations of ±SD of species were calculated.
Active compounds mg/100 g
Leaves
Flowers
Twigs
Seeds
Adhatoda vasica
Calotropis procera
Adhatoda vasica
Calotropis procera
Adhatoda vasica
Calotropis procera
Adhatoda vasica
Calotropis procera
P-hydroxy-benzoic
12 ± 0.40
12 ± 0.40
11 ± 0.40
11 ± 0.40
10 ± 0.40
10 ± 0.40
9 ± 0.40
9 ± 0.32
Stictic acid
10 ± 0.41
10 ± 0.41
9 ± 0.41
9 ± 0.41
8 ± 0.41
8 ± 0.41
8 ± 0.41
8 ± 0.31
Usnic acid
9 ± 0.44
9 ± 0.44
8 ± 0.44
8 ± 0.44
7 ± 0.44
9 ± 0.44
6 ± 0.44
9 ± 0.
Epigallocatechingallate
7 ± 0.01
7 ± 0.01
11 ± 0.01
6 ± 0.01
10 ± 0.01
5 ± 0.01
7 ± 0.01
5 ± 0.01
Quercetin
14 ± 0.02
14 ± 0.02
13 ± 0.02
13 ± 0.02
11 ± 0.02
13 ± 0.02
12 ± 0.02
12 ± 0.02
Epigallocatechin
13 ± 0.03
13 ± 0.03
12 ± 0.03
12 ± 0.03
11 ± 0.03
11 ± 0.03
10 ± 0.03
10 ± 0.03
Catechin
11 ± 0.13
10 ± 0.13
10 ± 0.13
9 ± 0.13
9 ± 0.13
9 ± 0.13
9 ± 0.13
8 ± 0.13
Morin
12 ± 0.12
10 ± 0.12
11 ± 0.12
9 ± 0.12
10 ± 0.12
9 ± 0.12
9 ± 0.12
7 ± 0.12
Epicatechin
14 ± 0.40
12 ± 0.40
13 ± 0.40
11 ± 0.40
11 ± 0.40
10 ± 0.40
10 ± 0.40
11 ± 0.40
Naringenin
16 ± 0.41
10 ± 0.41
15 ± 0.41
9 ± 0.41
14 ± 0.41
8 ± 0.41
12 ± 0.41
7 ± 0.41
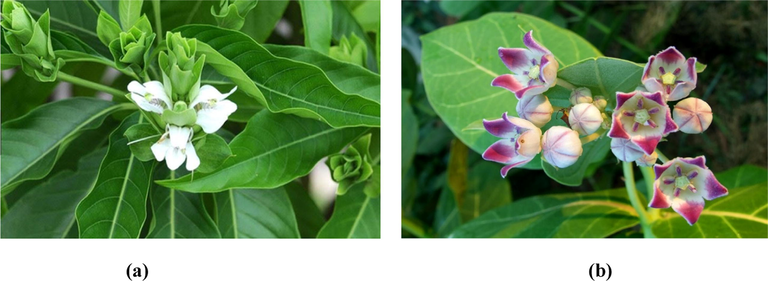
Adhatoda vasica (a) and Calotropis procera (b) plants.
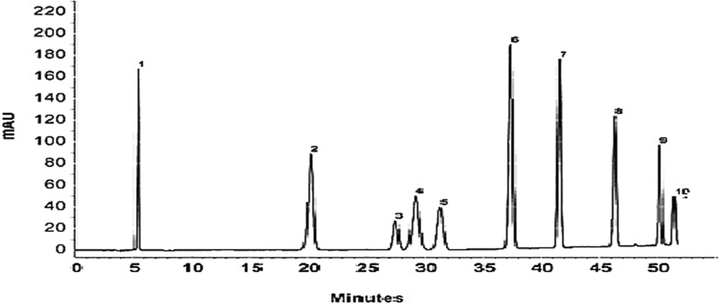
UF-HPLC method of various bioactive compounds isolated from (1) P-hydroxy-benzoic, (2) Stictic acid (3) Usnic acid (4) Epigallocatechingallate (5) Quercetin (6) Epigallocatechin (7) Catechin (8) Morin (9) Epicatechin (10) Naringenin.
3.2 Functional groups analysis of bioactive compounds by Fourier transform infrared spectroscopy (FTIR)
The important functional group analysis of various parts of both herbal plants was studied with their properties presented in Tables 2 and 3. Free alcohol O—H Stretching and Intermolecular bonded alcohol O—H Stretching 3985.14 ± 5.51. 3285.14 ± 5.51 in leaves of Adhatoda vasica while lower values of the same parameter shown in the seed of Calotropis procera. The Intermolecular bonded alcohol O—H Stretching and Intramolecular bonded alcohol O—H Stretching 3285.14 ± 5.51 in leave of 51 in leaves of Adhatoda vasica while lower values of the same parameter shown in the seed of Calotropis procera. The higher ranges of C—H stretching alkane, C—H bending aromatic compounds overtone 3285.14 ± 5.51 in leaves of Adhatoda vasica however the flower and twigs showed second and third ranges of values. To C⚌N stretching imine/oxime or C⚌O stretching conjugated ketone or alkenes 3915.14 ± 5.51, O—H bending phenol 3915.14 ± 5.51 C—N stretching amine 3935.14 ± 5.51 in leaves of Adhatoda vasica followed by the flower twigs and least values of all three functional group properties were lower in the seed of Calotropis procera.
Sr.no
Name of compounds
Molecular formula
Molecular weight
% Peaks
Structure
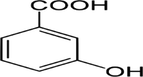
1
P-hydroxy-benzoic
C7H6O3
138.12 g/mol
170
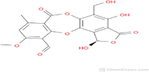
2
Stictic acid
C19H14O9
386.3 g/mol
90
3
Usnic acid
C18H16O7
344.315 g/mol
21
4
Epigallocatechingallate
–
458.372 g/mol
55
5
Quercetin
C15H10O7
302.236 g/mol
40
6
Epigallocatechin
C22H18O11
458.372 g/mol
180
7
Catechin
C15H14O6
290.26 g/mol
160
8
Morin
C15H10O7
302.2357 g/mol
130
9
Epicatechin
C15H14O6
290.27 g/mol
92
10
Naringenin
C15H12O5
: 272.25 g/mol
55
Functional groups
Leaves
Flowers
Twigs
Seeds
Adhatoda vasica
Calotropis procera
Adhatoda vasica
Calotropis procera
Free alcohol O—H Stretching cm−1
3985.14 ± 5.51
3685.14 ± 4.51
3185.14 ± 4.51
3085.14 ± 4.51
Intermolecular bonded alcohol O—H Stretching cm−1
3285.14 ± 5.51
3185.14 ± 4.3 1
3085.14 ± 5.51
2985.14 ± 5.51
Intramolecular bonded alcohol O—H Stretching cm−1
3185.14 ± 5.51
2985.14 ± 4.21
2785.14 ± 5.51
2685.14 ± 5.51
C—H stretching alkane cm−1
3285.14 ± 5.51
2885.14 ± 4.51
2385.14 ± 5.51
2285.14 ± 5.51
C—H bending aromatic compounds overtone cm−1
3385.14 ± 5.51
3085.14 ± 4.21
2885.14 ± 5.51
2785.14 ± 5.51
C⚌N stretching imine/oxime or C⚌O stretching conjugated ketone or alkenes cm−1
3915.14 ± 5.51
3415.14 ± 4.31
3115.14 ± 5.51
3015.14 ± 5.51
O—H bending phenol cm−1
3915.14 ± 5.51
3315.14 ± 4.31
2915.14 ± 5.51
2815.14 ± 5.51
C—N stretching amine cm−1
3935.14 ± 5.51
3135.14 ± 5.51
2835.14 ± 5.51
2735.14 ± 5.51
3.3 Structural and molecular response of bioactive compounds
In the present study, the FRIR analysis was conducted in both herbal plants to identify the active functional group, the extracted samples were analyzed through IR on base of its peak, the results indicated the presences of groups explained in Table 3. The ten essential compounds were found in both herbal plants with their structural, Molecular formula Molecular weight, and % peaks. All ten compounds have varies their molecular formula and weight were shown in Table 5. The structural formula also varies for all ten compounds with their peaks values.
3.4 Various methods of antioxidants potential determination of bioactive isolated in various parts of Adhatoda vasica and Calotropis procera
The antioxidant potentials of various bioactive compounds like Epigallocatechin gallate (EGCG), Quercetin (QR), Epigallocatechin (EGC), Catechin (CT), Morin (MR), Epicatechin (EC), Naringenin (NG), and Epicatechin gallate (ECG) isolated from the leaves of Adhatoda vasica were presented in Tables 4 and 5. Modern and updated methods for determination of antioxidant activity were used like Electron spin resonance spectrometry, ABTS Assay and Diphenyl picrylhydrazyl (DPPH) radical scavenging methods (see Fig. 3). Determinations of ±SD of compounds were calculated. Rolex equivalent per g dry weight (mg, TEAC/g dw), gauss (G), Trolox Equivalent Antioxidant Capacity, Trolox equivalents (TE)/g dry matter. Determinations of ±SD of compounds were calculated.
Bioactive compounds
Adhatoda vasica (leaves)
Antioxidants Activity of compounds
Electron spin resonance spectrometry gauss (G)
ABTS Assay mg/gdw
%age DPPH• scavenging mg/gdw
FRAP assay Fe2 + equivalents (µM)
Total radical-trapping antioxidant TEAC in mmol
Phycoerythyrin assay μmol TE g.
ORAC-FL assay µmol TE/100 g Fw)
Epigallocatechingallate (EGCG)
12 ± 0.40
13 ± 0.01
10 ± 0.47
7 ± 0.41
8 ± 0.01
9 ± 0.41
9 ± 0.41
Quercetin (QR)
10 ± 0.41
9 ± 0.021
13 ± 0.41
10 ± 0.43
11 ± 0.02
12 ± 0.44
11 ± 0.44
Epigallocatechin (EGC)
9 ± 0.44
10 ± 0.42
11 ± 0.42
7 ± 0.44
8 ± 0.014
9 ± 0.41
9 ± 0.41
Catechin (CT)
7 ± 0.01
8 ± 0.12
9 ± 0.41
9 ± 0.46
10 ± 0.012
11 ± 0.42
11 ± 0.42
Morin (MR)
14 ± 0.02
13 ± 0.13
12 ± 0.43
5 ± 0.47
6 ± 0.015
7 ± 0.44
6 ± 0.44
Epicatechin (EC)
13 ± 0.03
12 ± 0.49
11 ± 0.41
8 ± 0.41
9 ± 0.42
10 ± 0.46
12 ± 0.46
Naringenin (NG)
10 ± 0.13
9 ± 0.41
8 ± 0.46
11 ± 0.41
12 ± 0.48
13 ± 0.43
11 ± 0.43
Epicatechin gallate (ECG)
10 ± 0.12
11 ± 0.45
12 ± 0.012
12 ± 0.42
13 ± 0.41
14 ± 0.42
12 ± 0.42
Bioactive compounds
Calotropis procera (Leaves)
Antioxidants Activity of Compounds
Electron spin resonance spectrometry gauss (G)
ABTS Assay mg/gdw
%age DPPH• scavenging mg/gdw
FRAP assay Fe2 + equivalents (µM)
Total radical-trapping antioxidant TEAC in mmol
Phycoerythyrin assay μmol TE g.
ORAC-FL assay µmol TE/100 g Fw)
Epigallocatechingallate (EGCG)
13 ± 0.41
12 ± 0.02
11 ± 0.47
8 ± 0.41
10 ± 0.01
11 ± 0.40
11 ± 0.40
Quercetin (QR)
11 ± 0.40
10 ± 0.03
12 ± 0.41
11 ± 0.43
12 ± 0.02
13 ± 0.44
13 ± 0.44
Epigallocatechin (EGC)
10 ± 0.45
11 ± 0.43
13 ± 0.42
12 ± 0.44
13 ± 0.014
14 ± 0.40
14 ± 0.40
Catechin (CT)
8 ± 0.02
9 ± 0.13
14 ± 0.40
10 ± 0.46
10 ± 0.012
11 ± 0.41
11 ± 0.41
Morin (MR)
13 ± 0.03
14 ± 0.14
11 ± 0.41
13 ± 0.47
12 ± 0.015
14 ± 0.45
14 ± 0.45
Epicatechin (EC)
12 ± 0.04
11 ± 0.49
12 ± 0.41
10 ± 0.41
11 ± 0.42
12 ± 0.45
12 ± 0.45
Naringenin (NG)
14 ± 0.15
10 ± 0.42
13 ± 0.46
12 ± 0.41
13 ± 0.48
14 ± 0.42
14 ± 0.42
Epicatechin gallate (ECG)
15 ± 0.13
12 ± 0.47
14 ± 0.012
13 ± 0.42
14 ± 0.41
15 ± 0.41
15 ± 0.41
Spectra obtained from ESR method of antioxidants.
The ABTS Assay showed the higher antioxidant potential of Epigallocatechin gallate (EGCG) (13 ± 0.01) and Morin (MR) 13 ± 0.13 measured in Adhatoda vasica leaves followed by Epicatechin (EC) 12 ± 0.49 > Epicatechin gallate (ECG)11 ± 0.45 > Epigallocatechin (EGC) 10 ± 0.42 > Quercetin (QR) 9 ± 0.021 and Naringenin (NG) 9 ± 0.41 > Catechin (CT)8 ± 0.12. Similarly higher antioxidant potential of bioactive compounds isolated from leaves of Calotropis procera is shown in Table 4. A similar trend was found in both the plants when bioactive compounds were analyzed through ABTS radical scavenging assay. Morin (MR), Epigallocatechingallate (EGCG), and Epicatechin gallate (ECG) showed higher free radical scavenging potential 14 ± 0.14,12 ± 0.02 and 12 ± 0.47 respectively in µ/mol followed by Epigallocatechin (EGC) 11 ± 0.43 and Epicatechin (EC) 11 ± 0.49 which were > Naringenin (NG) 10 ± 0.42, Quercetin (QR)10 ± 0.03 and Catechin (CT) 9 ± 0.13. Spectra obtained from ESR method of free radicals measurement of bioactive compounds obtained from Seeds, Twigs, and Flowers of Adhatoda vasica and Calotropis procera is shown in Fig. 4, and results are summarized in Tables 4 and 5. The data shows that bioactive compounds isolated from C. procera and A. vasica leave like Morin (MR), Epigallocatechingallate (EGCG), and Epicatechin (EC) exhibited higher radical scavenging capability values of 14 ± 0.02, 12 ± 0.40, 13 ± 0.03 and 14 ± 0.02,12 ± 0.40, 13 ± 0.03 µg/mol respectively. The following order was observed from strongest to the weakest antioxidant potential of isolated antioxidant compounds from leaves of both the plants based on values obtained from ESR experimentation Morin > Epicatechin (EC) > Epigallocatechingallate (EGCG) > Quercetin (QR) = Naringenin (NG) = Epicatechin gallate (ECG) > Epigallocatechin (EGC) > Catechin (CT). The maximum radical scavenging ability was showed by Morin and minimum by Catechin (CT) both natural antioxidants present abundantly in many plants.Fig 5.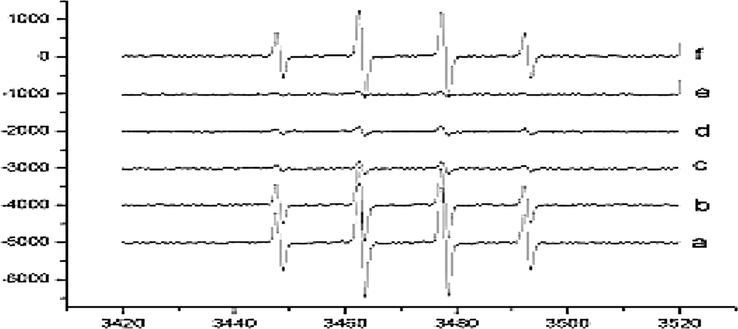
Flow of Spectra obtained from ESR method of free radicals measurement of both herbal plants (a) Seed (b) Twigs (c) Flowers of Adhatoda vasica (d) Seeds (e) Twigs (f) Flowers of Calotropis procera.
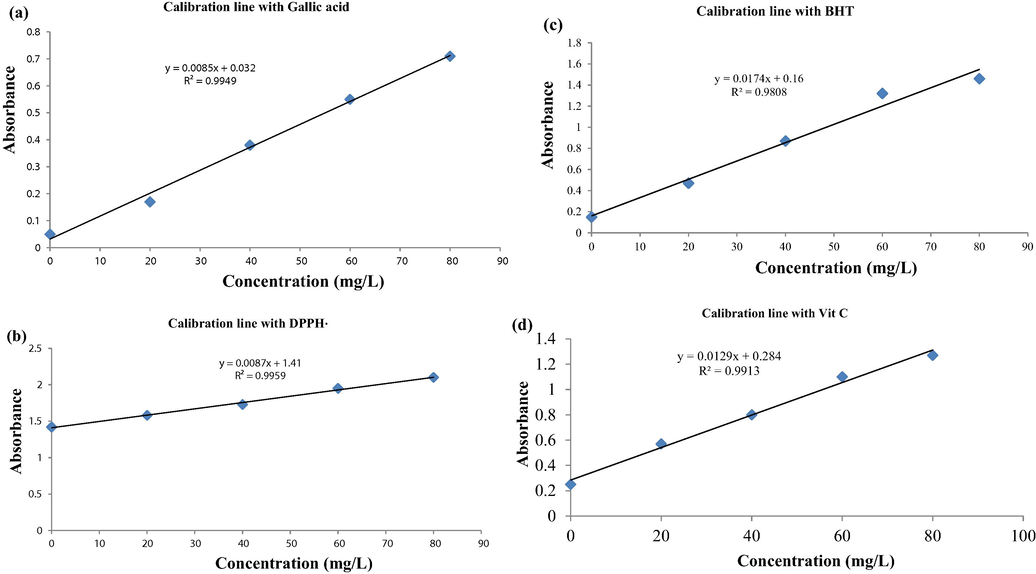
Scatter plot of antioxdants response data versus concentrations with calibration lines with standards (a) Gallic acid (b) DPPH• (c) BHT (d) Ascorbic acid.
We proceeded to further analyze the antioxidant potential of isolated compounds by performing Diphenyl picrylhydrazyl (DPPH) radical scavenging assay, FRAP assay, Total radical-trapping antioxidant assay, Phycoerythyrin assay, and ORAC-FL Oxygen radical absorbance capacity assay. The values obtained in all these environments are summarized in Tables 4 and 5.
Micellar ORACFL values have the following high to the low antioxidant capacity trend of bioactive compounds from A.vesica leaves: Epicatechin (EC) = Epicatechin gallate (ECG) > Quercetin (QR) = Catechin (CT) = Naringenin (NG) > Epigallocatechingallate (EGCG) = Epigallocatechin (EGC) > Morin (MR). In the case of C. procera bioactive compounds antioxidant potential following trend was found: Epicatechin gallate (ECG) > Epigallocatechin (EGC = Morin (MR) = Naringenin (NG) > Epicatechin (EC) > Epigallocatechingallate (EGCG). To explain these results in heterogeneous media (specifically we used triton X-100 micelle) we calculated free fluorescein concentration [FL].
The capacity of the studied compounds to quench the DPPH radical reactivity using a non-catalytic method was also determined. Tables 4 and 5 summarizes the values expressed as a percentage of decrease concerning a blank solution. For the bioactive compounds of plant, A. vasica Quercetin (QR) showed the highest radical quenching potential which was 13 ± 0.41 followed by Morin (MR) and Epicatechin gallate (ECG) which was 12 ± 0.43 and 12 ± 0.012 respectively. The order of decreasing DPPH radical scavenging ability was found as Quercetin (QR) > Morin (MR) = Epicatechin gallate (ECG) > Epigallocatechin (EGC) = Epicatechin (EC) > Epigallocatechin gallate (EGCG) > Catechin (CT) > Naringenin (NG). Bioactive compounds of C.procera showed the following trend in percentage reduction of DPPH induced radical: Catechin (CT) = Epicatechin gallate (ECG) > Epigallocatechin (EGC) = Naringenin (NG) > Epicatechin (EC) = Quercetin (QR) > Epigallocatechin gallate (EGCG) = Morin (MR).
The Diphenyl picrylhydrazyl (DPPH) radical scavenging method showed higher activity of Quercetin, Epigallocatechin (EGC) and Catechins (CT) isolated from leaves extract of both the plants as compared to antioxidant potential measured by ABTS assay and electron spin resonance spectrometry. The electron spin resonance spectrometry showed a higher potential of Morin (MR) 14 ± 0.02 and Epicatechin (EC) in leaves extract of Adhatoda vasica and Calotropis procera as compared to other methods. Epicatechin gallate (ECG) isolated from the leaves of Adhatoda vasica and Calotropis procera showed a higher percentage of DPPH radical scavenging values. The Phycoerythrin assay showed higher contents of Epigallocate cingulate (EGCG) 9 ± 0.41 and Quercetin (QR) 12 ± 0.44 in leaves of Adhatoda vasica. Epicatechin gallate (ECG) showed higher antioxidant activity estimated through the method of ORAC-FL while lower activity was showed in Morin (MR) 6 ± 0.44.
The antioxidants activity of different bioactive compounds isolated from the leaves of Calotropis procera is presented in Table 5. The Epigallocatechin gallate (EGCG) 11 ± 0.40 showed higher antioxidant contents through the Phycoerythrin assay method then estimated total radical-trapping method while it showed lower activity in FRAP assay. Epigallocatechin (EGC), Catechin (CT), Morin (MR), Epicatechin (EC), Naringenin (NG), Epicatechin gallate (ECG) all these essential compounds showed higher antioxidant potential measured through the Phycoerythrin antioxidants assay method.
In this study, the antioxidants activity was measured by the Ferric thiocyanate (FTC) method and the concentration of total phenolics was measured by the Folin-Ciocalteau method. The total antioxidant potential and total phenolic contents of both plants C. procera and A. vasica showed in Table 5. The higher antioxidant activity and total phenolic 3085.14 ± 8.51 and 3025.14 ± 8.56 showed by the leaves of Adhatoda vasica followed by the flower and twigs while lower values 1285.14 ± 3.56 1188.14 ± 3.55 were noted in the seed of Calotropis procera as presented in Table 5.
4 Discussion
Today the world facing many infectious diseases and having the problem of health due to excess production of free radicals in the human body which required a proper method to detect these radicals and medication by the diction of these radicals (Frankel and Meyer, 2000). Medicinal chemists are always in the high interest to search for new active molecules in important plants as a source of medicine to prevent these diseases and oxidative stress in the human body (Shahidi, 2002). The current investigation first time reports the diction, of antioxidants activity in these herbals plants through advanced methods of antioxidants activity (Krishna et al., 1991).
As a suitable producer and method for measuring the antioxidant activity in the food system are time demanded. Approaches have developed for measuring the antioxidant activity scavenges free radicals in lipophilic and aqueous phases in foodstuffs while the oxidation process has been widely documented (Antolovich et al., 2002; MacDonald-Wicks et al., 2006). Oxidative changes in cells are recognized but the quiet need for a method of standardization and measurement of free radicals and their activity (Rani et al., 2015). The oxidative damages at the cellular level are related to the production of free radicals and reactive oxygen species which damages the membrane and cellular components and causes many chronic and health issues (Machlin and Bendich, 1987; Pham-Huy et al., 2008). In the human body spilled and missing enzymes caused oxidative stress and became problematic to humans. Different methods developed for the determination of antioxidants in various fields’ including crops as well as herbal plants in vitro, but still, the problem is standardization and proper protocol in these activities of antioxidants (Mukherjee, 2019). Current results are following the previous reports on the antioxidants activity in red wine (Mukherjee, 2019) several juices and fruits (Wang and Gao, 2013). The scavenging abilities of citrus and essential oils have been studied and reported the TEAC of apple and orange juices of individual phenolic antioxidants (Sharma et al., 2012; Ramful et al., 2011). The results of p-hydroxybenzoic; stictic acid usnic acid by different six methods antioxidants activity showed in (Tables 2–4). Maximum activity was noted in these methods due to its proper extraction and suitable formulation applied in these methods for the first time. The advanced and reliable method of ESR exposed those radicals which trap and display both antioxidants and oxidants exploit (Amorati and Valgimigli, 2015). The investigation suggests that the applied methods produce the best measurement of free radicals and antioxidants activities which were similar to the reports of literature for the antioxidants activity in different citrus juices (grapefruit and orange) and measured in different wavelength respectively (Proteggente et al., 2002). The current results are also similar to that of the antioxidants activity for the juice of pomegranate which was evaluated by ABTS and DPPH and compare with the tea and red wine infusions exaction methods (Amic et al., 2007). ORAC values presented an important relationship with the correlation value of 246 with electrochemical data obtained by the HPLC method (Frankel and Meyer, 2000; Ariffin et al., 2011). The antioxidant activity of four different standards (uric acid, gallic acid, Trolox and ascorbic acid) is compared by two different methods like TRAP and TEAC oxidation in tea and other plants (Wang and Gao, 2013).
Similar studies revealed that the bark extracts of four Rhamnus species from Croatia communities, namely Rhamnus alaternus, Rhamnus flax, Rhamnus intermedia, and Rhamnus pumila, displayed relatively lower DPPH values of 78.7 ± 3.16, 22.3 ± 0.54, 72.2 ± 4.00, and 53.1 ± 1.57 µg/mL (Elmastaş et al., 2006) respectively and also the bark extracts of Rhamnus catharticus and Rhamnus orbiculatus from Dedin and Mt. Sniježnica with the efficient concentration (EC50) values of 64 ± 5 and 89 ± 2 µg/mL (Gülçin, 2006a), respectively. Hence, the obtained antioxidant activities for the above extracts might be a result of the high TPC and TFC levels quantified in the extracts. Phenolic compounds are commonly closely correlated with antioxidant activities, which might be due to their hydrogen- donating properties as free radical scavengers. Particularly, lots of well-known flavonoids such as quercetin, kaempferol, isorhamnetin, rhamnetin, and their glycosides identified in the present study, might be attributed to those results (Besbas et al., 2020).
As the active part, the H atoms in the hydroxyl groups of polyphenols can combine with the free radicals to form the polyphenol-radicals, and then react with other radicals, thus terminating the radical chain reaction (Gülçin, 2006b). In this current assay, it was assumed that the DPPH•· and ABTS+ free radicals in the solution turned into the non-radicals of the DPPH-H and ABTS, once encountering the H atom donors of hydroxyl groups of polyphenols in R. prinoides. That is to say, the active H atom donors, polyphenols, in R. prinoides possess strong antioxidant activity by capturing the DPPH and ABTS+ free radicals. To this end, the SPRE was thus applied logically into the following assays.
Our result showed that the two methods were standardized for free radicals and antioxidants activity of herbal plants. It was observed that all methods of free radicals and antioxidants activity showed maximum activity in both herbal plants. The various antioxidant methods were noted to provide support for bioactive properties and thus they are responsible in highly antioxidant properties for pure collection of these compounds (see Table 6). Determinations of ±SD of compounds were calculated.
Phytochemicals mg/100 g
Leaves
Flowers
Twigs
Seeds
Adhatoda vasica
Calotropis procera
Adhatoda vasica
Calotropis procera
Total phenolic compounds
3085.14 ± 8.51
2985.14 ± 5.51
2585.14 ± 4.56
1285.14 ± 3.56
Total antioxdants activity
3025.14 ± 8.56
2905.14 ± 5.55
24875.13 ± 4.46
1188.14 ± 3.55
5 Conclusions
The study was completed to prove the chemical classification with functional group analysis of bioactive compounds by Fourier transform infrared spectroscopy (FTIR) with seven potential methods of antioxidants quantitative determination including new and advanced methods like electron spin resonance spectrometry (ESR). The ten essential compounds were isolated in herbal plants after extraction the antioxidants activity was checked by these seven methods. Every method showed diverse activity in these compounds. The compounds were isolated in UF-HPLC. The four herbal plant parts were a rich source of the ten most bioactive and essential compounds that were discovered in this study. The electron spin resonance spectrometry (ESR) method proved the higher activity of antioxidants in all essential compounds with their spectral ranges. A current investigation based on an advanced analytical method revealed that Adhatoda vasica and Calotropis procera are rich resources of different metabolites which can be used as a source of active compounds for different drug formulation and preparation. The isolation of bioactive compounds compound in the UL-HPLC method and their antioxidants activities showed the significance of both plants, in these compounds as future green resolution, new synthetic methods compounds as used in various pharmacy and pharmaceutical industries.
Acknowledgements
The Authors highly appreciate Department of Horticulture, The University of Haripur, Department of Chemistry, University of Karachi, Pakistan and HEC, for providing Funds to complete this project.
Declaration of Competing Interest
The authors declare that they have no known competing financial interests or personal relationships that could have appeared to influence the work reported in this paper.
References
- The role of chitosan to prolonged the fresh fruit quality during storage of grapefruit cv. ray ruby. Pak. J. Bot.. 2018;50(1):151-159.
- [Google Scholar]
- Pharmacological studies of Adhatoda vasica and Calotropis procera as resource of bio-active compounds for various diseases. Pak. J. Pharm. Sci.. 2018;31(5)
- [Google Scholar]
- Gas chromatography mass spectrometry and fourier transform infrared spectroscopy analysis of methanolic extract of Mimosa pudica L. leaves. J. Drugs Pharm. Sci.. 2020;4(1):1-9.
- [Google Scholar]
- Phytochemicals: Extraction, isolation, and identification of bioactive compounds from plant extracts. Plants. 2017;6(4):42.
- [Google Scholar]
- SAR and QSAR of the antioxidant activity of flavonoids. Curr. Med. Chem.. 2007;14(7):827-845.
- [Google Scholar]
- In vitro Antioxidant Capacity of Peperomia pellucida (L.) Kunth Plant from two different locations in Malaysia using different Solvents Extraction. Res. J. Pharm. Technol.. 2020;13(4):1767-1773.
- [Google Scholar]
- Advantages and limitations of common testing methods for antioxidants. Free Radical Res.. 2015;49(5):633-649.
- [Google Scholar]
- Antioxidant capacity and phenolic composition of fermented Centella asiatica herbal teas. J. Sci. Food Agric.. 2011;91(15):2731-2739.
- [Google Scholar]
- A comparative study on phytochemical screening, quantification of phenolic contents and antioxidant properties of different solvent extracts from various parts of Pistacia lentiscus L. J. King Saud Univ.-Sci.. 2020;32(1):302-306.
- [Google Scholar]
- Chemical composition, antioxidant, antihemolytic and anti-inflammatory activities of Ononis mitissima L. Phytochem. Lett.. 2020;37:63-69.
- [Google Scholar]
- Borate suppresses the scavenging activity of gallic acid and plant polyphenol extracts on DPPH radical: A potential interference to DPPH assay. LWT. 2020;131:109769.
- [Google Scholar]
- Effects of hexanal, trans-2-hexenal, and storage temperature on shelf life of fresh sliced apples. J. Agric. Food. Chem.. 2000;48(6):2401-2408.
- [Google Scholar]
- The butterfly fauna of Curaçao, West Indies: 1996 status and long-term species turnover. Carib. J. Sci.. 1999;35(3/4):184-194.
- [Google Scholar]
- A study on the in vitro antioxidant activity of juniper (Juniperus communis L.) fruit extracts. Anal. Lett.. 2006;39(1):47-65.
- [Google Scholar]
- Spectrophotometric determination of the antioxidant properties and characterization of the phenolic content by high-performance liquid chromatography–diode array detection–tandem mass spectrometry (HPLC–DAD–MS/MS) of Berberis hispanica Boiss. & Reut. leaves. Anal. Let. 2020:1-12.
- [Google Scholar]
- The problems of using one-dimensional methods to evaluate multifunctional food and biological antioxidants. J. Sci. Food Agric.. 2000;80(13):1925-1941.
- [Google Scholar]
- Antioxidant and antiradical activities of L-carnitine. Life Sci.. 2006;78(8):803-811.
- [Google Scholar]
- Antioxidant activity of caffeic acid (3,4-dihydroxycinnamic acid) Toxicology. 2006;217(2):213-220.
- [Google Scholar]
- Recent advances in screening active components from natural products based on bioaffinity techniques. Acta Pharm. Sin. B 2020
- [Google Scholar]
- Antioxidant activity of selected plant products. J. Microbiol. Biotechnol. Food Sci.. 2020;9(5):1692-1703.
- [Google Scholar]
- Total Antioxidant capacity with peak specificity via reaction flow chromatography and the ferric reducing antioxidant power assay. Food Anal. Methods. 2020;13(3):608-616.
- [Google Scholar]
- Mechanisms of hypoxic and aerobic cytotoxicity of mitomycin C in Chinese hamster V79 cells. Cancer Res.. 1991;51(24):6622-6628.
- [Google Scholar]
- Screening immunoactive compounds of ganoderma lucidum spores by mass spectrometry molecular networking combined with in vivo zebrafish assays. Front. Pharmacol.. 2020;11:287.
- [Google Scholar]
- Total phenolic contents, DPPH radical scavenging and β-carotene bleaching activities of aqueous extract from Ammoides atlantica. J. Drug Deliv. Therapeut.. 2020;10(3-s):196-198.
- [Google Scholar]
- Methodology for the determination of biological antioxidant capacity in vitro: a review. J. Sci. Food Agric.. 2006;86(13):2046-2056.
- [Google Scholar]
- Free radical tissue damage: protective role of antioxidant nutrients 1. FASEB J.. 1987;1(6):441-445.
- [Google Scholar]
- Food Antioxidants: Technological: Toxicological and Health Perspectives. CRC Press; 1995.
- Identification and antioxidant activity of flavonoid metabolites in plasma and urine of eriocitrin-treated rats. J. Agric. Food. Chem.. 2000;48(8):3217-3224.
- [Google Scholar]
- Quality Control and Evaluation of Herbal Drugs: Evaluating Natural Products and Traditional Medicine. Elsevier; 2019.
- Free radicals, antioxidants in disease and health. Int. J. Biomed. Sci.: IJBS. 2008;4(2):89.
- [Google Scholar]
- The antioxidant activity of regularly consumed fruit and vegetables reflects their phenolic and vitamin C composition. Free Radical Res.. 2002;36(2):217-233.
- [Google Scholar]
- Polyphenol composition, vitamin C content and antioxidant capacity of Mauritian citrus fruit pulps. Food Res. Int.. 2011;44(7):2088-2099.
- [Google Scholar]
- Tools and Techniques to measure oxidative stress. In: Free Radicals in Human Health and Disease. Springer; 2015. p. :43-56.
- [Google Scholar]
- The relative antioxidant activities of plant-derived polyphenolic flavonoids. Free Radical Res.. 1995;22(4):375-383.
- [Google Scholar]
- [241 Total antioxidant status in plasma and body fluids. In: Methods in Enzymology. Elsevier; 1994. p. :279-293.
- [Google Scholar]
- Structure-antioxidant activity relationships of flavonoids and phenolic acids. Free Radical Biol. Med.. 1996;20(7):933-956.
- [Google Scholar]
- Controlled physical activity trials in cancer survivors: a systematic review and meta-analysis. Cancer Epidemiol. Prevent. Biomark.. 2005;14(7):1588-1595.
- [Google Scholar]
- Chemical compositions, total phenolic contents, antimicrobial and antioxidant activities of the extract and essential oil of Thymbra spicata L. growing wild in Turkey. J. Food Meas. Charact. 2020:1-8.
- [Google Scholar]
- Antioxidants in Plants and Oleaginous Seeds. ACS Publications; 2002.
- Assessment of antimicrobial activity of extracts of few common lichens of Darjeeling hills. Ind. J. Fund Appl. Life Sci.. 2012;2:120-126.
- [Google Scholar]
- Opportunity, Challenge and Scope of Natural Products in Medicinal Chemistry. Research Signpost; 2011.
- Effect of chitosan-based edible coating on antioxidants, antioxidant enzyme system, and postharvest fruit quality of strawberries (Fragaria x aranassa Duch.) LWT – Food Sci. Technol.. 2013;52(2):71-79.
- [Google Scholar]
- The relative contributions of vitamin E, urate, ascorbate and proteins to the total peroxyl radical-trapping antioxidant activity of human blood plasma. Biochimica et Biophysica Acta (BBA) – Gen. Subj.. 1987;924(3):408-419.
- [Google Scholar]


