Translate this page into:
The effect of honey as an excipient in the processing of traditional chinese medicine based on chemical profiling, artificial neural network, and virtual screening: Cortex Mori as an example
⁎Corresponding authors at: School of Chinese Materia Medica, Tianjin University of Traditional Chinese Medicine, Tianjin 301617, China (Lili Sun). sunlili0114@tjutcm.edu.cn (Lili Sun), mengwangr@163.com (Meng Wang)
-
Received: ,
Accepted: ,
This article was originally published by Elsevier and was migrated to Scientific Scholar after the change of Publisher.
Abstract
Honey is a natural food often used as an auxiliary material in Traditional Chinese Medicine (TCM). Cortex Mori (CM) is a commonly used Chinese medicinal material that requires honey preparation before use. Our research discovered that various factors including honey temperature, color intensity, moisture content, viscosity, TPC, 5-HMF content, and FRAP all increased over time during the honey refining process. To systematically study the excipients that play a unique role in TCM processing, this study focuses on honey as the representative and CM as the model drug. The overall components of honey-processed CM, stir-fried CM, and raw CM were determined using the fingerprint method, resulting in 36 chromatographic peaks with significant differences. The principal component analysis (PCA) results showed significant differences among honey-fried, stir-fried, and raw CM. Orthogonal partial least squares-discriminant analysis (OPLS-DA) and artificial neural network (ANN) were used to screen the important differential components. Network pharmacology and molecular docking technology were used to correlate the efficacy of the marker components. Oxyresveratrol, kuwanon G, and morusin were identified as potential markers. This study proved that the addition of honey as an excipient can affect the chemical composition of the drug itself, thereby impacting its efficacy.
Keywords
Honey
Cortex Mori
Processed products
Chemical profiling
Artificial neural network
1 Introduction
Honey is a natural food, mainly composed of sugars and other constituents such as amino acids, enzymes, carotenoids, and vitamins (Silva-PM et al., 2016). It has also enjoyed increasing recognition for its bioactivities and potential medicinal applications (Muresan et al., 2022). Honey has antibacterial, anti-inflammatory antioxidant, and other activities, used in the digestive system, respiratory system, and other diseases treatment clinically (Bartkiene et al., 2020; Martinello et al., 2021; Goslinski et al., 2020; Azman et al., 2019). The use of honey as an internal and external health agent is much older than the history of medicine itself. It is used as an auxiliary material in Traditional Chinese Medicine (TCM), herbs are usually fried with honey to improve their Qi-nourishing and lung-moistening effects (Chen et al., 2018). The honey refining process refers to the use of honey in a certain way to make Chinese medicine concoctions. However, the science of honey refining and the role of mixing honey in the honey roasting process still need to be demonstrated. Honey-frying is used to process other lung-moistening and antitussive herbs, Cortex Mori (CM) is one of the common drugs. Modern research shows that the addition of honey increased the concentrations of active compounds and their oral bioavailability, protected acetylation, and consequently increased their bioactivity (Dai et al., 2020). Research shows that it promotes the conversion of saponins or flavonoids in refined medicinal materials, and increases the solubility of aglycones in certain medicinal materials (Ota et al., 2018).
Cortex Mori, one of the well-known traditional Chinese herbal medicines, is derived from the root bark of Morus alba L., which is widely used in oriental medicine for the treatment of cough (Piao et al., 2011; Lian et al., 2017). CM has been reported to have various beneficial effects such as possess antipyretic, anti-tussive, preventing asthma, hypoglycemic, antitumor, antibacterial, antioxidative, and anti-depression (Bayazid et al., 2020; Li et al., 2022; Lee et al., 2012). Chinese medical classics describe several processing methods for CM, including carbonized CM, stir-fried CM, honey-processed CM, and wine-processed CM. Among these methods, stir-fried and honey-processed CM are the most commonly used, with honey-processed being the preferred method in modern times.
The chemical composition of TCM is complex, the target and biological activity are complex, and it is difficult to evaluate and analyze it comprehensively by using a single method and technology (Li et al., 2022). Constructing an overall quality evaluation system for TCM using a variety of modern analytical techniques and scientific approaches, such as artificial intelligence, has become a focus and trend in the standardization research of TCM. Chromatographic fingerprint analysis is an effective and comprehensive technique for the quality assessment of TCM (Liang et al., 2021). Chemometrics, as a statistical tool, can overview complex data from chromatographic profiles with strong autonomous learning ability (Sabir et al., 2016). The artificial neural network (ANN) method has been proposed as an important engineering tool for pattern recognition (Chen et al., 2020). Network pharmacology, based on bioinformatics and systems biology, combines nodes in a biological network. Molecular docking techniques can be used to validate the results of network pharmacology by linking active ingredients in the network to target macromolecular proteins (Zhao et al., 2018; Liu et al., 2022).
To systematically study the unique role of traditional Chinese medicine excipients in the processing of TCM, this study focuses on honey as a representative and uses CM as the model drug. By considering drug factors and the influence of honey processing, along with various modern analytical techniques and methods, it uncover the impact of honey on the overall composition of CM during the honey processing process and identify significant markers. This research aims to reveal the mechanism of honey frying in Chinese materia medica and provide a reference for the study of the material basis of Chinese materia medica.
2 Materials and methods
2.1 Materials and reagents
A batch of the CM pieces was planted from Anhui with the batch number (200400099), which were identified as the root bark of Morus alba L. plants by Professor Li Tianxiang of the Tianjin University of Traditional Chinese Medicine (Tianjin, China). Locust honey (Yanghuai, YH) and jujube honey (Zaohua, ZH) were purchased from Beijing Baihua Honey Co., LTD (Beijing, China). Honey-processed CM was made according to the method specified in the Chinese Pharmacopoeia (2020 edition). HPLC-grade Phosphoric acid and methanol were obtained from Tianjin Kemiou Chemical Reagent Co., Ltd. (Tianjin, China); HPLC-grade acetonitrile was purchased from Sigma-Aldrich (St. Louis, MO, USA); distilled water for the HPLC analyses was purchased from Watson Group Ltd. (Hong Kong, China). All standards (purity > 98 %), including mulberroside A, chlorogenic acid, oxyresveratrol, morusin, kuwanon G, and sanggenon C were all purchased from Shanghai Yuanye Biotechnology Co., Ltd. (Shanghai, China). 5-HMF (purity > 98 %), purchased from Shanghai McLean Biotechnology Co., Ltd.
2.2 Refining process of honey before application
2.2.1 Honey milling
Take a certain amount of locust honey and jujube honey and place it in a beaker. Heated it constantly at a temperature of 125℃ in an oil bath. Took measurements of the internal temperature of the honey every 5 min. Took about 25 mL of the sample and placed it in a 50 mL centrifuge tube, then rapidly cooled it in ice water and stored it in a refrigerator at 4℃.
2.2.2 Determination of physical and chemical properties
Color intensity: Took samples of honey at different time points during the refining process with a density of 0.2 g/mL. Measured the absorbance of these samples at wavelengths of 450 nm and 720 nm. The color intensity was determined by calculating the difference in absorbance between these two wavelengths. pH measurement: Dissolved 2.0 g of honey sample in 10 mL of distilled water. Used a pH meter that has been calibrated with pH 4.00 and 6.86 calibration solutions to measure the pH value of the solution (Chinese Pharmacopoeia, 2020). Viscosity measurement: Took a specific amount of honey and placed it in a beaker. Heated the beaker in a water bath at a constant temperature of 30℃, making sure to maintain the temperature stability. Selected an appropriate rotor to measure the viscosity (Nur-Hanis-Izzati and Sarbon, 2020).
2.2.3 Determination of moisture content
According to the requirements for the determination of moisture content (MC) in honey in the 2020 edition of the Chinese Pharmacopoeia, the Abbe refractometer was connected to the thermostatic water bath and adjusted to 40 ± 0.1℃. The refractive index was calibrated to 1.3305 using distilled water. A suitable amount of refined honey sample was melted in a water bath at 40℃and 1–2 drops were taken and placed on the prism for measurement. The refractive index was read, and the moisture content was calculated using formula (1). X represented the moisture content in the sample (%), and n represented the refraction index of the sample at 40℃.
2.2.4 Total phenol content determination
To estimate the concentration of total phenolic content (TPC), the Folin-Ciocalteu method (Shamsudin et al., 2019) was used with slight modification. 100 μL of 0.1 mg/L honey sample solution or gallic acid standard solution was accurately measured and added to 100 μL of Folin-Ciocalteu reagent.The mixture was well mixed and left to react in the dark for 5 min. 500 μL of 1 mol/L Na2CO3 solution and 300 μL of distilled water were then added. After incubating for one hour at room temperature, the absorbance of the reaction mixture was measured at 760 nm. The gallic acid standard curve was y = 5.6578x + 0.0847 (R2 = 0.9981), and the linear range was 0.01–0.16 mg/mL. The results were expressed as mg gallic acid equivalents per 100 g of honey (mg GAE/100 g).
2.2.5 Determination of 5-Hydroxymethylfurfural (5-HMF) content
A 0.1 g/mL honey solution was filtered through a 0.22 μm filter membrane and used as the test solution. The HPLC chromatographic conditions were as follows: chromatographic column: Agilent Zorbax SB-C18 (4.6 mm × 250 mm, 5.0 μm). Mobile phase: Phase A: pure water, Phase B: methanol, using a 90 % A and 10 % B isocratic elution; detection wavelength 284 nm, column temperature 30℃, injection volume 10 μL, flow rate 1 mL/min.
For methodological investigation, the refined honey test solution was subjected to 6 consecutive injections under the above chromatographic conditions. Additionally, injections were performed with the refined honey test solution at different time points (0 h, 2 h, 4 h, 6 h, 8 h, 10 h, and 24 h) under the above chromatographic conditions. Honey samples were also taken and 6 parallel samples were prepared following the test solution preparation method. Injections were performed under the above chromatographic conditions, and the retention time and peak area were recorded. The RSD value was then calculated.
Linearity and recovery rate were determined by weighing 2.83 mg of the 5-HMF reference product and placing it in a 10 mL volumetric bottle with a constant volume of pure water. The solution was diluted step by step to obtain a series of concentrations of the reference product solution. The sample was determined under the above chromatographic conditions, and the peak area was recorded. 6 parallel samples of honey with a known concentration were taken, and test solutions with a concentration of 0.1 g/mL were prepared. A 4.42 μg/mL 5-HMF reference solution was added to each sample, and the peak area was measured. The corresponding concentration and recovery rate were calculated using the standard curve.
2.2.6 Analysis of antioxidant activity
The ferric-reducing antioxidant power (FRAP) was determined using the method described previously (Dzugan et al., 2018). 0.1 g/mL honey sample was accurately absorbed into a 96-well plate with 20 μL FeSO4 reference solution of different concentrations, mixed with 180 μL FRAP reagent, incubated at 37℃ for 20 min, and absorbance value was determined at 593 nm with three multiple Wells for each sample.
2.2.7 Dynamic simulation and correlation analysis
Conducted a kinetic study on the changes in temperature, color, moisture, viscosity, pH, total phenols, 5-HMF content, and total antioxidant capacity during the honey refining process. Fitted the data using formulas (2, 3, 4) and determined the appropriate kinetic model to simulate the changes in these indicators. Obtained the kinetic equations, fitting coefficients, and other relevant parameters. C was the measured value of any time index, C0 was the starting value, and t represented time /min. The correlation of 8 indexes of honey temperature, color intensity, moisture content, viscosity, pH, TPC, 5-HMF content, and FRAP were analyzed.
2.2.8 Effect of refining temperature on main indexes of ZH
A certain amount of jujube honey was refined in a constant temperature oil bath at 80℃ and 125℃, and the appropriate amount of samples were taken every 20 min, and sampled at 0 min, 20 min, 40 min, 60 min, 80 min, and 100 min, respectively. The water content, TPC, and 5-HMF contents of samples at different time points were measured according to the above method, and the relevant parameters of the kinetic equation were calculated to describe the influence of temperature on them.
2.3 Sample preparation of honey processing CM
2.3.1 Preparation of processed products of CM
Refined honey (A TCM product made of honey with a certain processing method): A certain amount of jujube honey was placed in a beaker and heated at a constant temperature of 80℃ in an oil bath. The internal temperature of the honey was measured every 5 min. About 25 mL of samples were taken into a 50 mL centrifuge tube placed in ice water for rapid cooling and stored in a refrigerator at 4℃.
Preparation of stir-frying CM: 20.0 g of each of the three raw CM was placed in a pre-heated container, heated by an induction cooker, fried to a slightly yellow color on the surface of the medicinal material, and removed when the focal spot was slightly visible.
Preparation of honey-fried CM: 20.0 g of raw CM, 5.0 g of refined honey, diluted with an appropriate amount of boiling water, poured on CM, and moistened for 1 h. The moistened medicinal materials were placed in a preheated container, heated in an induction cooker, and fried until the surface of the medicinal materials was yellow without sticking hands.
2.3.2 Sample preparation of liquid phase analysis
All CM samples and two processed products from the various batches were finely powdered and passed through a 50-mesh sieve. For samples, subsequently, 200 mg of the powdered sample was dissolved in 10 mL of methanol and sonicated for 70 min (150 W, 40 kHz) and then made up for weightlessness. Each solution was filtered through a 0.22-μm nylon membrane. For 5-HMF, mulberryside A, chlorogenic acid, oxyresveratrol, kuwanon G, sanggenon C, and morusin, 5.0 mg was separately added to methanol in a 5 mL brown volumetric flask to obtain the reference solution.
2.4 Chromatography analysis
2.4.1 Chromatographic and mass spectrometry conditions
Waters 2695 was used to determine the chemical information of each sample. Chromatographic separation was performed on a Chromatographic Column Symmetry® C18 (4.6 mm × 150 mm, 5.0 μm) operated at 35℃. The mobile phase was a mixture of solvent A (acetonitrile) and solvent B (0.1 % Phosphoric acid in water, v/v) at a flow rate of 1 mL·min−1 with a linear elution gradient as follows: 0–5 min (5–15 % A), 5–15 min (15–35 % A), 15–25 min (35–55 % A), and 25–55 min (55–80 % A). The detection wavelength was set at 320 nm with a volume of 10 μL.
The UPLC-Mass Spectrometry (UPLC-MS) analysis was performed using a Waters UPLC equipped with an I-Class/Xevo TQ-S Triple Quad liquid chromatography/mass spectrometer instrument (Waters). The chromatographic separation was performed on an ACQUITY UPLC BEH shield RP18 column (100 mm × 2.1 mm, 1.7 mm), operated at 35℃. The mobile phase comprised water containing acetonitrile (Solvent A) and 0.2 % formic acid (Solvent B). A gradient elution program was employed as follows: 0–5 min (5–15 % A), 5–15 min (15–35 % A), 15–25 min (35–55 % A), and 25–55 min (55–80 % A), with a mobile phase flow rate of 0.2 mL/min. The injection volume was 2 μL. The MS analyses were performed using an electrospray ionization ion source under a negative ion mode with the full scan mass from 100 to 1000 m/z. The desolvation temperature was 350℃ and desolvation was 800 L/h. The nebulizer was maintained at 7.0 bar.
2.4.2 Methodological evaluation
For the precision test, the same raw CM (S15) sample solution was injected 6 times according to the chromatographic conditions under item “2.4.1″, and the retention time and peak area values were recorded. For the stability test, the same CM sample (S15) was placed at room temperature, and the samples were injected and analyzed at 0, 2, 4, 6, 8, and 12 h according to the chromatographic conditions under item “2.4.1”. The retention time and peak area values were recorded. For the repeatability test, the same CM sample (S15) was taken, and 6 samples of sample solution were prepared in parallel according to the preparation method of sample solution under ”2.3.2“, and the retention time and peak area values were recorded. The relative retention time and relative peak area of each common peak were calculated using Kuwanon G as the reference peak.
2.5 Analysis of the influence of honey on CM composition
2.5.1 Calculation of yield after processing
To study the effect of honey on the processing of CM, 3 copies of each processed product were prepared in parallel to calculate the yield.
2.5.2 Determination of total flavonoids
Accurately weigh 0.2 g each of the raw CM and two processed product powders and add 8 mL of methanol. It was then sonicated for 60 min and the resulting supernatant was diluted 20-fold with methanol. Each solution was filtered through a 0.22 μm nylon membrane. For Sanggenone C, 5.0 mg to methanol in a 25 mL brown volumetric flask to obtain a reference solution. Using blank water as the control, the three concoctions solution and Sangenone C standard solution were scanned at full wavelength at 200–800 nm, and 280 nm was determined as the detection wavelength. Determine the total flavonoid content of the samples by taking the appropriate amount of test solution or control solution in the colorimetric bath and detecting the absorbance at 280 nm. The content was determined by HPLC. (Radojkovic., 2012).
2.5.3 The effect of honey roasting on the thermal stability of medicinal materials
Accurately weighed 2.0 g each of raw CM and honey-processed CM powder, and placed them at room temperature, 100℃, and 120℃ for 2.5 h, respectively. Set aside after cooling to room temperature.
2.5.4 Comparison of chemical composition between raw CM and two processed products
Accurately weighed 0.2 g each of the raw CM and the two processed product powders and added 10 mL of methanol. It was then sonicated for 45 min. For 5-HMF, mulberryside A, chlorogenic acid, oxyresveratrol, kuwanon G, sanggenon C, and morusin, 5.0 mg each in methanol in a 5 mL brown volumetric flask to obtain a control stock solution. HPLC chromatography under “2.4.1″ was used for sample injection analysis to obtain and record chromatographic peak areas of the corresponding components.
2.6 Multivariate chemometric analysis
Waters Empower workstation data management software was used to obtain chromatographic data on samples of CM and processed products, including peak area, retention time, and other information used to establish fingerprints. Multivariate chemometric classification methods, including HCA, PCA, and PLS-DA, were applied to classify the new matrix data and determine the similarities and differences, using SIMCA-P11.5 (Sartorius Scientific Instrument Co., Ltd., Germany). The BP-ANN was applied using SPSS version 23.0 (IBM Corp., Armonk, NY, USA). CP-ANN was used based on Matlab R2018b (MathWorks, Natick, MA, USA).
2.7 Target network analysis
2.7.1 Screening and target prediction of effective components of CM
Chemical markers screened based on OPLS-DA and ANN were selected as potential active ingredients and further used using the TCMSP database (TCMSP, https://tcmspw.com/) for screening. Screening conditions were set based on oral bioavailability (OB) and bioactivity (DL), with OB ≥ 30 % and DL ≥ 0.18. The active ingredients and target of CM were obtained, and the protein target after CM standardized matching was obtained by the Uniport protein database (https://www.uniprot.org/).
2.7.2 Inflammatory target prediction
The GeneCards database (https://www.genecards.org/) and OMIM database (https://www.omim.org/https://www.omim.org/) were searched with “inflammation” as the keyword, and the search results of the two databases were combined, screened, and deleted to obtain the inflammation-related targets. The intersection of CM-active ingredient targets and inflammatory targets was used to draw the Venn plot (diagramhttp://bioinformatics.psb. ugent. be/web tools/Venn/).
2.7.3 Construction and analysis of the “CM-active ingredient-anti-inflammatory target” network
The intersection targets of the two components were mapped to the corresponding active components, and the anti-inflammatory target database of CM active components was established. The regulatory network diagram of active components and disease targets was mapped using Cytoscape software (version 3.7.1). The network analyzer uses the network analysis function to analyze network topology correlation. Based on the STRING database (https://string-db.org/), the intersection targets obtained above were uploaded, the core target proteins of CM anti-inflammatory were screened out with count values, and the PPI protein interaction network diagram was made.
2.8 Molecular docking
AutoDock software (version 4.2) was used for molecular docking simulation. The crystal structures of key proteins were obtained from the protein database (https://rcsb.org). Both proteins were edited using Pymol to remove the inhibitor, water molecules, nonbonded co-crystalized compounds, and the addition of hydrogens. The geometry of the ligand optimized using Chem3D was saved as PDB files. From the obtained results, the solutions reaching the minimum docking score were taken as the top-scoring modes. The visualizations were done by Heat map.
3 Results
3.1 Refining process of honey before application
3.1.1 Melting temperature
Under the condition of constant temperature heating, the internal temperature of honey changes with the processing time, as shown in Fig. 1a. In the first 40 min, the internal temperature of the two kinds of honey increased rapidly, from the initial 26℃ to 102℃, and from the initial 20℃ to 104℃. In the later period, the temperature rise of the two was slow, the locust honey rose 19℃ in 75 min, and the jujube honey rose 17℃ in 85 min, and both of them were heated to 121℃ at last.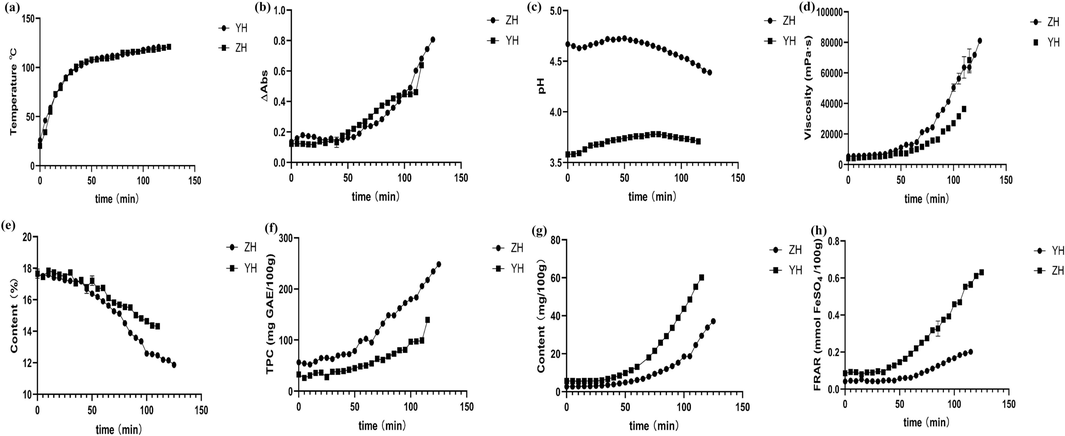
Change curve of each index in the honey refining process. (a) Temperature, (b) Color, (c) pH, (d) Viscosity, (e) MC, (f) TPC, (g) 5-HMF, (h) FRAP.
3.1.2 Physical and chemical properties
The color change rule was shown in Fig. 1b. The larger the absorbance difference measured, the darker the color. In the process of honey processing, the color gradually deepened, and the two honey samples showed the same trend. The absorbance difference of ZH and YH was 0.5166 and 0.6710, respectively. A dynamic model was used to describe the color change of jujube and locust honey during processing,
The pH value changes during the processing of honey were shown in Fig. 1c, and the results showed that the pH value changes during the processing of ZH and YH show a trend of first increasing and then decreasing, which is consistent with the results reported in the literature. The pH of ZH increased from 4.67 to 4.72 and then decreased to 4.39. The pH of YH increased from 3.58 to 3.78 and then decreased to 3.71. The acidity of honey changes during heat treatment due to the chemical reaction between sugars and organic acids, which reduces the acidity of honey and thus increases the pH of honey (Nur-Hanis-Izzati and Sarbon, 2020).
The results of the honey viscosity measurement showed that, as shown in Fig. 1d, the viscosity of jujube honey and locust honey increased during processing. The viscosity of ZH increased from 5382 mPa·s to 81097 mPa·s. The viscosity of YH increased from 4116 mPa·s to 31353 mPa·s. Overall, the viscosity of the two kinds of honey increased exponentially with time, and the dynamic equation of the two kinds of honey was shown in Tab. S1.
3.1.3 Moisture content
The change of water content in the refining process of the two kinds of honey was shown in Fig. 1e, and the results showed that the water content in the two kinds of honey decreased sharply during the processing process. The water content of ZH decreased from 17.65 % to 14.31 %. The water content of YH decreased from 17.65 % to 11.87 %. The dynamic model was used to describe the water change of jujube honey and locust honey during processing, and the zero-order dynamic change was the best description for both (equation in Tab. S1).
3.1.4 TPC
During honey preparation, the total phenolic content varied, as depicted in Fig. 1f. The TPC in ZH and YH consistently increased throughout the process. In ZH, the phenolic component content rose from an initial concentration of 56.61 mg GAE/100 g to 248.32 mg GAE/100 g. In YH, the total phenolic content increased from an initial concentration of 32.93 mg GAE/100 g to 139.57 mg GAE/100 g. These changes were observed to follow a first-order kinetic model, as outlined in Tab. S1.
3.1.5 5-HMF
The methodological investigation met the requirements (RSD<2%). The regression equation was y = 6 × 10⁷X-2933.4 (R2 = 1.0000), with a linear range of 1.1 μg/mL ∼ 141.5 μg/mL. The average recovery rate was 95.68 %, with an RSD value of 2.03 %. The results of the variation of 5-HMF content during the processing were shown in Fig. 1g. In the process of jujube honey and locust honey production, the 5-HMF content significantly increased, from 2.67 mg/100 g to 37.16 mg/100 g for ZH, and from 5.66 mg/100 g to 60.24 mg/100 g for YH. They were best simulated by a first-order kinetic model for the variation of 5-HMF, as shown in Table S1.
3.1.6 FRAP
The total antioxidant capacity during the process of honey preparation is shown in Fig. 1h, with the content of phenolic compounds in jujube honey and locust honey continuously increasing. The FRAP of jujube honey increased from the initial 0.09 mol FeSO4/100 g to 0.63 mol FeSO4/100 g; the FRAP of locust honey increased from the initial 0.05 mol FeSO4/100 g to 0.2 mol FeSO4/100 g. Both ZH and YH were best simulated by a first-order kinetic model for the changes in FRAP (equation in Table S1). The enhancement of the overall antioxidant capacity of honey indicates the scientific nature of honey refining, and its trend of change is closely related to the changes in its inherent components.
3.1.7 Correlation analysis
Except for weak correlations between honey temperature and pH, there were significant correlations among the other indicators, as shown in Table 1. The color intensity of honey exhibited significant correlations with moisture content, viscosity, TPC, 5-HMF content, and FRAP. This suggested that color changes in honey were closely linked to fluctuations in its internal chemical composition. Additionally, these color variations visually manifest alterations in chemical composition and activity to some extent. Moisture content was significantly and inversely correlated with color intensity, viscosity, TPC, and FRAP. This indicated that the water content in honey directly impacts its physicochemical properties, highlighting the importance of scientific honey refining methods that aim to eliminate water. TPC showed a significant correlation with antioxidant activity during the heating process, revealing the significant influence of phenolic compounds on changes in antioxidant activity.
T
Color
MC
Viscosity
pH
TPC
HMF
FRAP
T
1
Color
0.584**
1
MC
−0.666**
−0.924**
1
Viscosity
0.533**
0.941**
−0.947**
1
pH
0.028
0.008
−0.190*
0.172*
1
TPC
0.539**
0.838**
−0.933**
0.929**
0.449**
1
5-HMF
0.536**
0.816**
−0.683**
0.678**
−0.354**
0.460**
1
FRAP
0.474**
0.809**
−0.906**
0.907**
0.417**
0.986**
0.390**
1
3.1.8 Effect of refining temperature on main indexes of ZH
As shown in Table S2, the content of 5-HMF in honey refined at 125℃ for 60 min exceeded the limit value (0.004 %), while the content of water in honey refined at 80℃ for 100 min was close to the content of water in honey refined at 14 %-16 %, the content of total phenol was significantly increased, and the content of 5-HMF was less than the limit value. The results showed that compared with the process at 125℃, the process at 80℃ for a long time is more suitable. The kinetic parameters and curves of the three indexes at 80℃ and 125℃ were shown in Table S3 and Fig. 2. The results showed that the three indexes of honey all conform to first-order kinetic changes and were significantly affected by temperature. Under high-temperature conditions, the reaction rate constant was larger and the reaction was more intense, and the degree of change of each index was more obvious.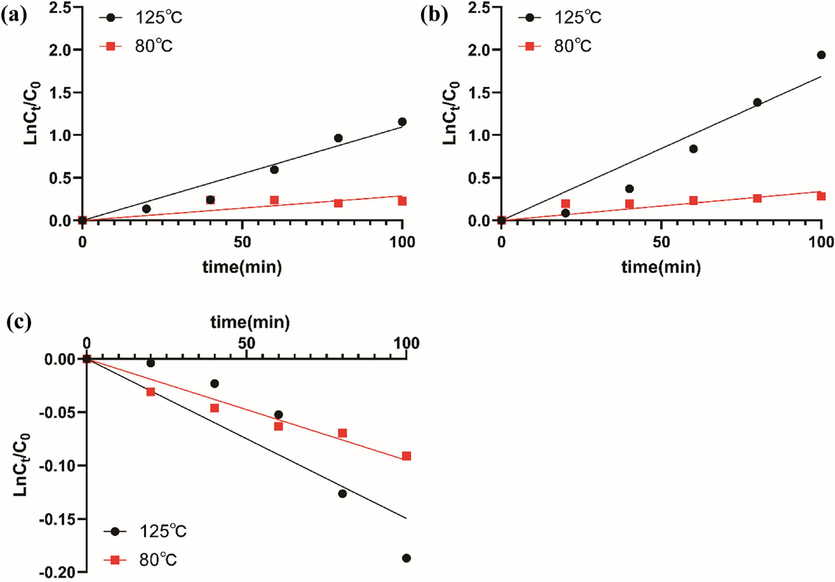
Dynamic change curves of three indexes of ZH at 80℃ and 120℃. (a) TPC, (b) 5-HMF, (c) MC.
3.2 Chromatography analysis
The results of the precision test, stability test, and repeatability test were calculated respectively. The relative retention time RSD of each common peak was less than 1.0 %, and the relative peak area RSD of the main chromatographic peak was less than 5.0 %, indicating that the method had good repeatability, the sample was stable for 12 h, and the instrument had good precision under the established chromatographic conditions, the HPLC fingerprints of the raw, honey-fried, and fried products of CM are shown in Fig. S1. A total of 36 chromatographic peaks with good resolution were identified for subsequent analysis. A total of 14 components were identified by LC-MS identification results (Table S4) and retention time of chromatographic peaks in reference and test solutions.
Comparing the chromatograms of the raw product CM and the honey-processed CM, it was observed that two new components, peak 1 and peak 2 were detected in the honey-processed CM, and these two chromatographic peaks were detected in the refined honey (Fig. S1), and the peak 2 was identified as the 5-HMF furfural. However, these two components are also present in the chromatogram of stir-fried CM. Sugars will generate 5-HMF and sugar derivatives after being heated and dehydrated. The above results indicate that the formation of new components during the processing of the honey-processed product is the combined effect of heating and auxiliary materials.
3.3 Analysis of the influence of honey on CM composition
3.3.1 Calculation of yield after processing
The raw, stir-fried products, honey fried samples of CM were shown in Fig S2. The calculation of yield after processing was shown in Table 2. It showed that the yield increased after honey broiling, but decreased after stir-frying.
Sample
Before concocting
After concocting
Yield
Raw CM(S)
20.0 g
20.0 g ± 0.00
100.00 %
Stir-fried CM (C)
20.0 g
18.3 g ± 0.25
91.67 %
Honey-processed CM(M)
20.0 g
25.8 g ± 0.26
129.00 %
3.3.2 Determination result of total flavonoids
Taking the concentration of Sanggenon C as the abscissa and the measured absorbance A as the ordinate, the standard curve y = 30.268x + 0.0006 (R2 = 0.9999) was obtained by linear regression, and the linear range was 0.0015–0.05 mg·mL−1. As can be seen from Fig. 3, the total flavonoid content of CM after processing changed significantly. The content of total flavonoids in the stir-fried CM decreased, and the total flavonoid content of the CM after honey roasting increased significantly. During the processing of CM, the quality difference between the processed products and the raw product before and after processing was paid attention to, and it was found that the total flavonoid content of CM after honey roasting was increased.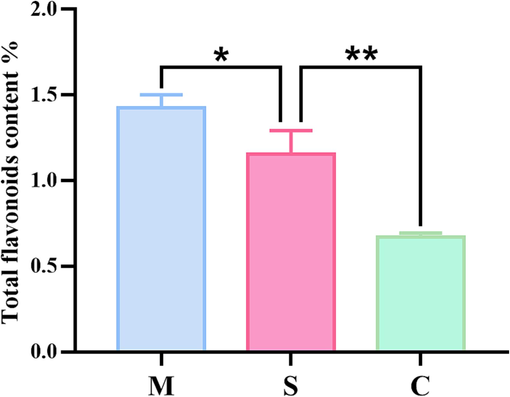
Determination result of total flavonoids. (Honey-processed CM (M), raw CM (S), stir-fried CM (C)).
3.3.3 The effect of honey roasting on the thermal stability of medicinal materials
Through the comparison of different processed products of CM, it was found that the components in the stir-fried products were significantly lower than those of honey-processed products, it was speculated that honey may protect the stability of the components in the medicinal materials. Therefore, the thermal stability of the decoction pieces was investigated from the perspectives of the raw products and the honey-processed products, and the room temperature was used as a reference to analyze the changes in the content of the CM under different temperature conditions. The results are shown in Fig. 4. The contents of mulberry side A, chlorogenic acid, oxyresveratrol, kuwanon G, sanggenon C, and morusin all decreased with the increase in temperature, and the changes of honey-processed products and raw products were consistent. Among them, Mulberryside A had a significant temperature change, indicating that it was unstable under heat.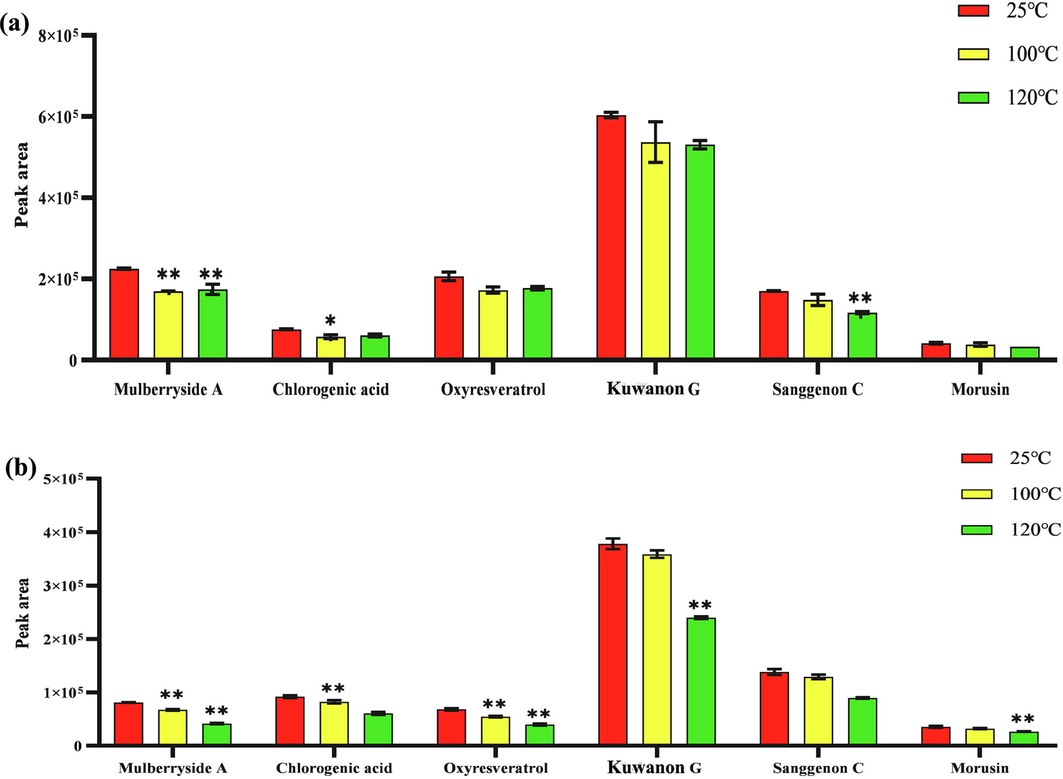
Changes in the content of CM. (a) Changes of components in raw CM with temperature; (b) Changes of components in honey-processed CM with temperature.
3.3.4 Comparison of chemical composition between raw and processed CM products
Compared to raw and stir-fried products, honey-processed products primarily exhibit changes in ingredient content. The peak area of each chromatographic peak was measured, and 36 chromatographic peaks with obvious changes were selected. After a one-way analysis of variance and pairwise tests, there were significant differences. In comparison to raw products, the peak areas of these chromatographic peaks in processed products increased by over 1.5 times or decreased by less than 0.67 times, as calculated by the average value of the samples. These results were shown in Table 3. Out of these peaks, 26 exhibited higher peak areas in raw products compared to honey-processed products and stir-fried products. This indicated that honey plays a vital role in the CM honey-roasting process.
Peak No.
Stir-fried/Raw
Honey-processed /Raw
Stir-fried/Honey-processed
1
12.10*
1.53
1.53
2
30.73*
0.22*
0.22*
3
0.45*
0.96
0.96
4
1.04
0.46*
0.46*
5
1.74*
0.21*
0.21*
6
0.95
0.40*
0.40*
7
0.43*
0.46*
0.46*
8
0.78*
0.79*
0.79*
9
1.40*
0.31*
0.31*
10
0.62*
0.55*
0.55*
11
0.50*
0.82*
0.82*
12
0.84*
0.50*
0.50*
13
0.85
0.45*
0.45*
14
0.41*
0.95
0.95
15
0.60*
0.78*
0.78*
16
0.98
0.36*
0.36*
17
0.60*
0.64*
0.64*
18
0.64*
0.51*
0.51*
19
0.73*
0.63*
0.63*
20
0.77*
0.46*
0.46*
21
1.39
4.03*
4.03*
22
0.96
0.46*
0.46*
23
0.74*
0.61*
0.61*
24
0.73*
0.81*
0.81*
25
0.77*
0.41*
0.41*
26
0.87
0.47*
0.47*
27
0.89
0.46*
0.46*
28
0.71*
0.66*
0.66*
29
1.04
0.38*
0.38*
30
0.34*
0.74
0.74
31
0.88
0.44*
0.44*
32
0.79*
0.37*
0.37*
33
1.23
0.21*
0.21*
34
0.88
0.49*
0.49*
35
0.98
0.00*
0.00*
36
2.77
0.37*
0.37*
3.4 Multivariate chemometric analysis
3.4.1 Heat map and hierarchical cluster analysis (HCA)
Heat maps and clusters were frequently used in expression analysis studies for data visualization and quality control. The 36 chromatographic peak area data of the tested samples were subjected to Z-Score normalization processing, and Ward's method was used to perform cluster analysis on the samples with Euclidean distance as the measurement interval. The results of the heat map and HCA were shown in Fig. 5. Raw products, honey-processed products, and stir-fried products can be grouped into one category. The visual map analysis can clearly show the difference between 36 chemical components. Compared with the raw products, the content of most of the components in the processed product was reduced, which reflected the chemical factors that can alleviate the medicinal properties of the CM after processing. Compared with the stir-fried products, the reduction degree of honey-processed products was milder, indicating that the addition of honey may prevent the excessive loss of ingredients in medicinal materials to a certain extent.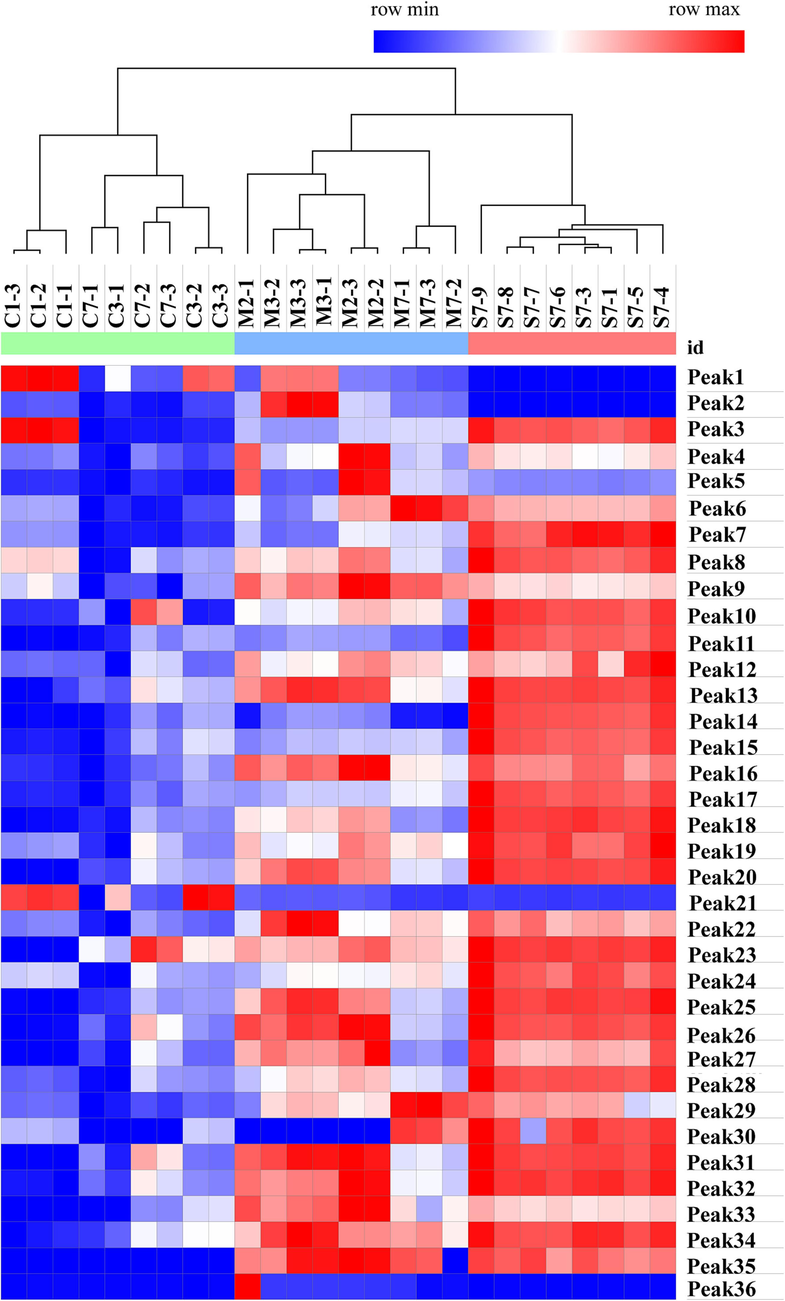
Heat map analysis and HCA results. Honey-processed products (M), raw products (S), stir-fried products (C).
3.4.2 Principal component analysis (PCA)
PCA was the most extensive multidimensional data analysis method to date (Liu et al., 2019). PCA applications cover all topics in pharmacology and biomedical sciences, including quantitative structure–activity relationships (Martins et al., 2019). Fig. 6 showed the PCA scores of raw and processed products. The results indicated that the raw products, honey-processed products, and stir-fried products were clustered in 3 different areas, and can be well differentiated. The class analysis results were consistent. The distribution distance of the samples between the honey-processed products was relatively large, indicating that they were more sensitive to the processing parameters and affected by the temperature and processing endpoint during the honey-processed process. The stir-fried products were distributed in the fourth quadrant and were close to each other, indicating that there were both commonalities and differences between the honey-processed products and the stir-fried products. The raw products were located in the third quadrant and had a clear boundary from the two groups of processed products.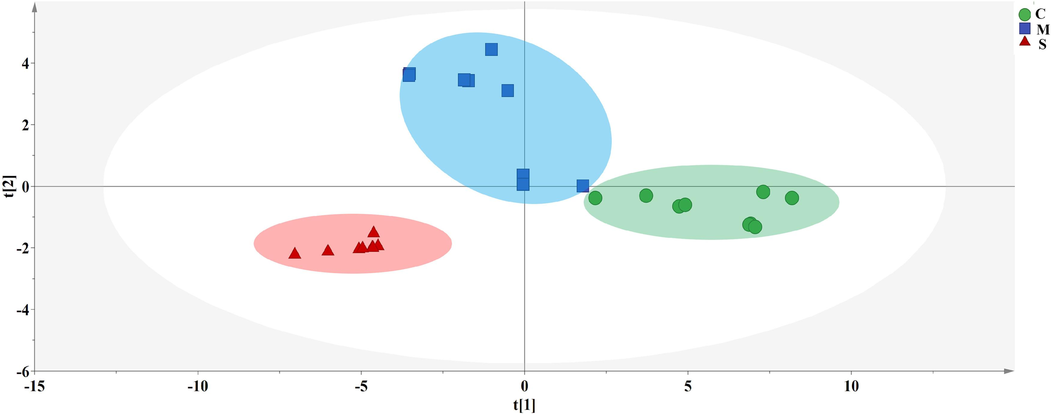
PCA score of raw and processed products. Honey-processed products (M), raw products (S), stir-fried products (C).
3.4.3 Orthogonal partial least squares discriminant analysis (OPLS-DA)
The OPLS-DA has proven to be a powerful tool for qualitative data structure analysis, with prediction results comparable to classification using standard PLS-DA (Bylesjo et al., 2006). To further search for the quality difference markers of stir-fried products and honey-processed products, and to compare the main components affected by the addition of honey, the two groups of samples were analyzed by OPLS-DA. Within the 95 % confidence interval, VIP value > 1 was used as the screening condition to identify potential quality markers. As shown in Fig. 7a-7c, the figure showed that variables 11, 15, 17, 3, 14, 24, 7, 28, 10, 23, 18, 16, 19, and 20 had VIP values greater than one, indicating that these variables played an important role in distinguishing raw and honey-fried products. Variables 28, 18, 25, 17, 11, 14, 20, 32, 16, 19, 15, 13, 35, 22, 5, 26, 27, 34, 31, 4, 24, 7, and 29 could be used as important markers to distinguish stir-fried products and raw products. Variables 9, 16, 35, 12, 25, 33, 13, 34, 20, 29, 28, 32, 19, 18, 22, 31, 26, 17, 7, 6, 27, and 4 could be used as an important marker to distinguish stir-fried products and honey-fried products.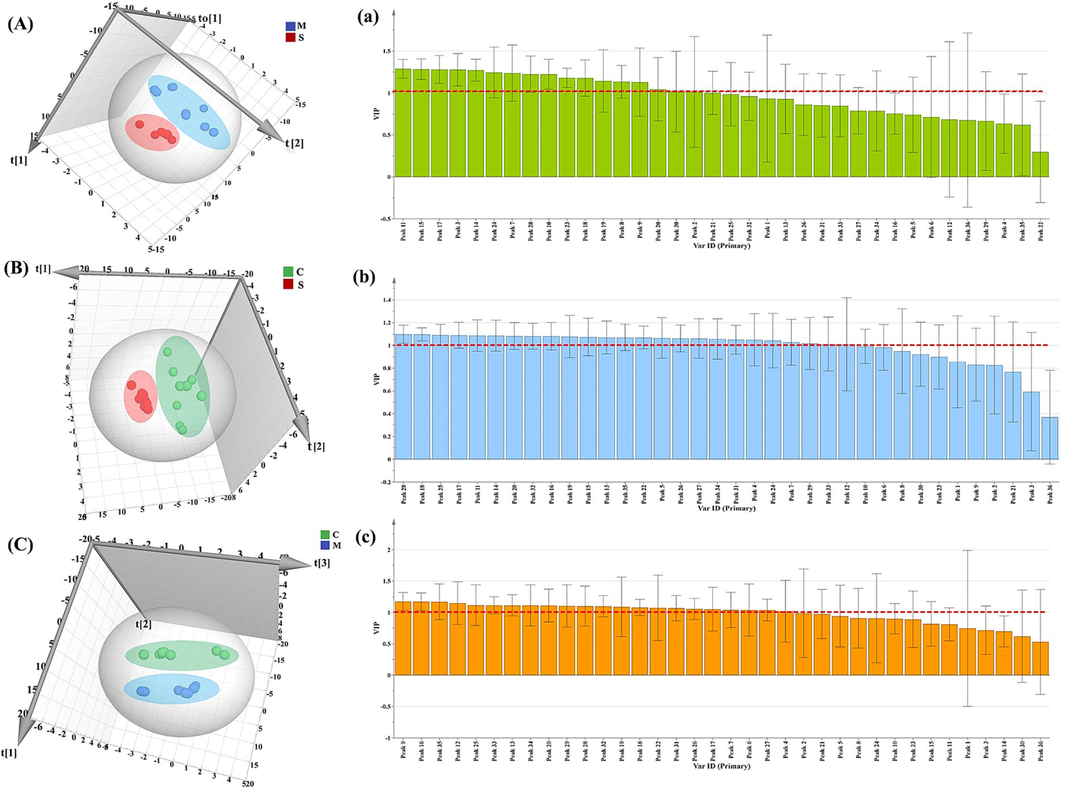
OPLS-DA of raw and processed products. OPLS-DA score map of honey-processed and raw products (A) and VIP plot (a); OPLS-DA score map of stir-fried products and raw products (B) and VIP plot (b); OPLS-DA score map of honey-processed and stir-fried products (C) and VIP plot (c).
3.4.4 Artificial neural network (ANN)
CP-ANN is an artificial neural network based on Kohonen's artificial neural network (Ballabio and Vasighi, 2012). The supervised CP-ANN was used to validate the PCA and HCA classification results, and the importance of these markers in classification was analyzed by weight. The genetic algorithm was used to optimize the composition and iteration times of CP-ANN neurons. It consisted of 36 neurons (6 × 6) and iterates 300 times. The CP-ANN model was established using the optimal parameters. Fig. 8a and 8b showed the distribution of samples and their categories in the Kohonen map. It can be seen that the nerves occupied by the three samples did not cross, confirming the accuracy of the model cross-validation.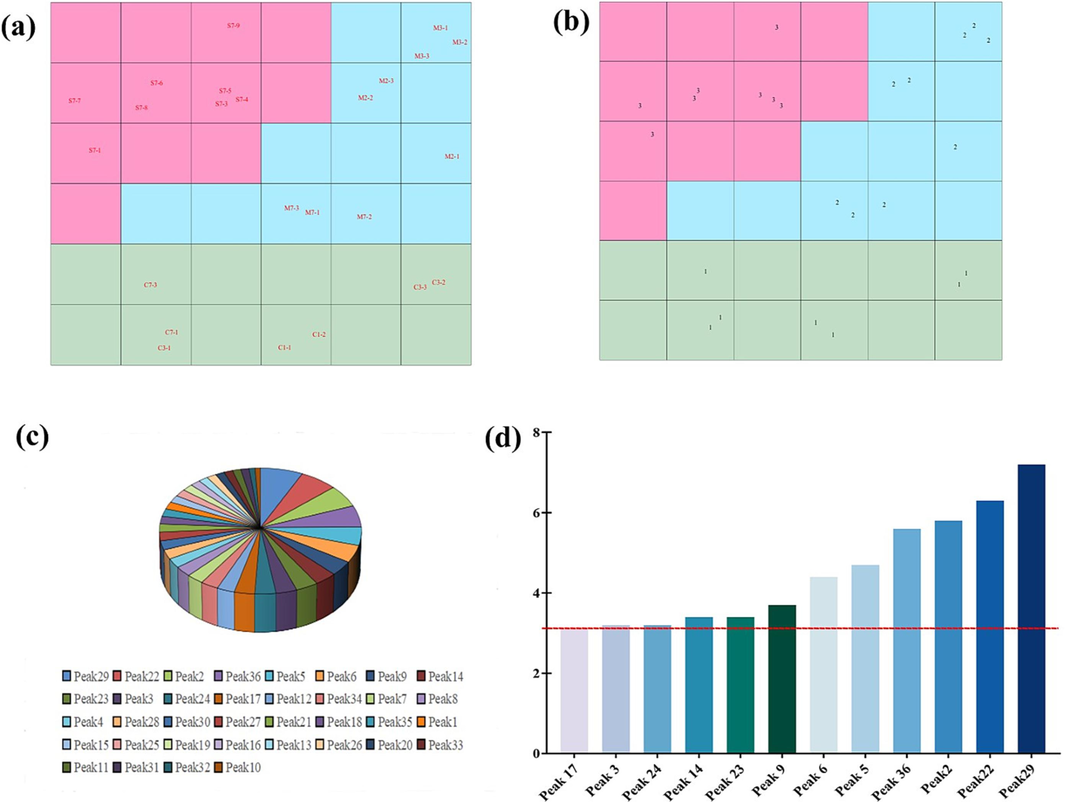
The ANN model of raw and processed products of CM. (a) Distribution of samples in Kohonen map; (b) Distribution of sample classes in Kohonen map; (c) BP-ANN model variable importance results; (d) Top 12 important variables filtered by BP-ANN.
The BP-ANN model was used to further improve the accuracy of recognition of the model (Sun et al., 2019). A three-layer BP-ANN model was established and used to distinguish between raw and processed product samples of CM. To predict the classification of the samples, 30 % of them were randomly selected as the training set and the remaining as the test set. The results showed that all samples were successfully divided into three groups, the predicted and the test values fitted well, and the accuracy was 100 %. As shown in Fig. 8c and 8d, the most important variables (importance > 3 %) in the model were 17, 3, 24, 14, 23, 9, 6, 5, 36, 2, 22, and 29.
3.5 Target network analysis
3.5.1 Screening and target prediction of effective components of CM
Based on the results of OPLS-DA and ANN, compounds 3, 6, 7, 14, 17, 22, 23, 24, and 29 were selected as chemical markers for distinguishing honey-prepared products from raw products and fried products. Among these compounds, variable 3 was identified as mulberroside A, variable 7 as oxyresveratrol, variable 17 as kuwanon G, variable 24 as sanggenon C, and variable 29 as morusin. These compounds were considered candidate active ingredients for potential quality markers. Furthermore, a search of the TCMSP database with specified parameters “Ingredients” identified oxyresveratrol, kuwanon G, and morusin as the main active ingredients, and gene targets were obtained (Table S5).
3.5.2 Inflammatory target prediction
After combining the data from the GeneCards database and OMIM database and removing duplicate and false positive genes, a total of 1454 targets were obtained for inflammation research. By mapping the targets of the active ingredients from CM, VennPainter software revealed that there were 44 common targets between the active ingredients and inflammation. (Fig. 9a and Fig. 9b).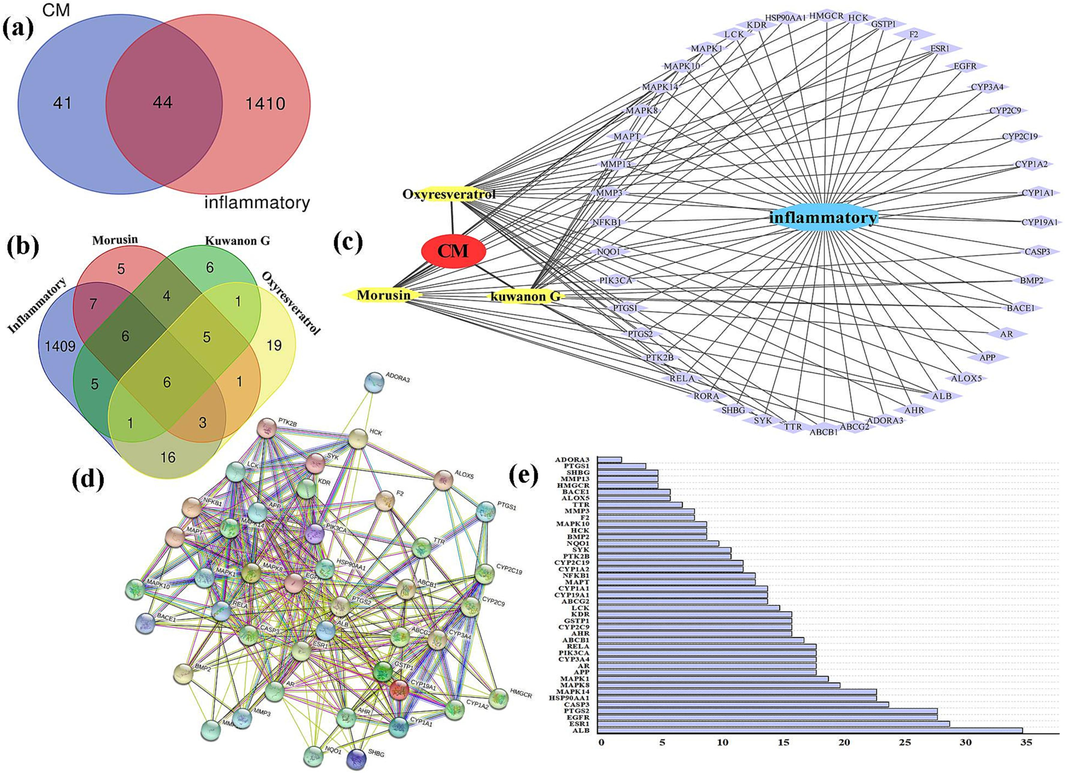
The target network of CM. (a) Venn Diagram of drugs and disease; (b) Venn diagram of active component and disease; (c) Network diagram of “CM-active component-target”; (d) The PPI network; (e) Sequencing results of protein levels of important targets in PPI.
3.5.3 Construction and analysis of the “CM-active ingredient-anti-inflammatory target” network
The data of the active ingredients and target genes from CM were imported into Cytoscape software to construct the “CM - active ingredient - target - anti-inflammatory” relationship network, as shown in Fig. 9c. The network consisted of 49 nodes and 113 edges, including one drug node (red), one disease node (blue), three active ingredient nodes (yellow), and the remaining nodes (purple) representing targets. These genes were used to establish the PPI network (Fig. 9d), and ALB, ESR1, EGFR, PTGS2, and CASP3 were identified as the primary targets (Fig. 9e).
3.6 Molecular docking verification
The five essential target proteins (ALB, ESR1, EGFR, PTGS2, and CASP3) were scored by docking with the active ingredients in CM. The docking results are shown in Table 4, and the thermal mapping software was used for visual analysis of the molecular docking results, as shown in Fig. 10a. The Affinity (kcal/mol) value represents the binding ability of the two molecules. A binding energy < 0 indicates that the molecules can freely bind. The three active ingredients with the lowest binding energy were further analyzed and observed for their binding results with the target proteins using Pymol software, as shown in Fig. 10b-10d. The results showed that morusin had the best affinity. PTGS2 showed better docking results with each component, indicating its potentially more important role in the active components of CM.
Composition
target
PDB ID
Affinity (kcal/mol)
Oxyresveratrol
ALB
6HSC
−8.9
ESR1
5GS4
−7
EGFR
1mox
−6.8
PTGS2
5IKQ
−8.2
CASP3
4PS0
−7.1
Kuwanon G
ALB
6HSC
−7.9
ESR1
5GS4
−7.7
EGFR
1mox
−7.8
PTGS2
5IKQ
−10.2
CASP3
4PS0
−7.8
Morusin
ALB
6HSC
−9.1
ESR1
5GS4
−7.3
EGFR
1mox
−8.1
PTGS2
5IKQ
−9.1
CASP3
4PS0
−9.4
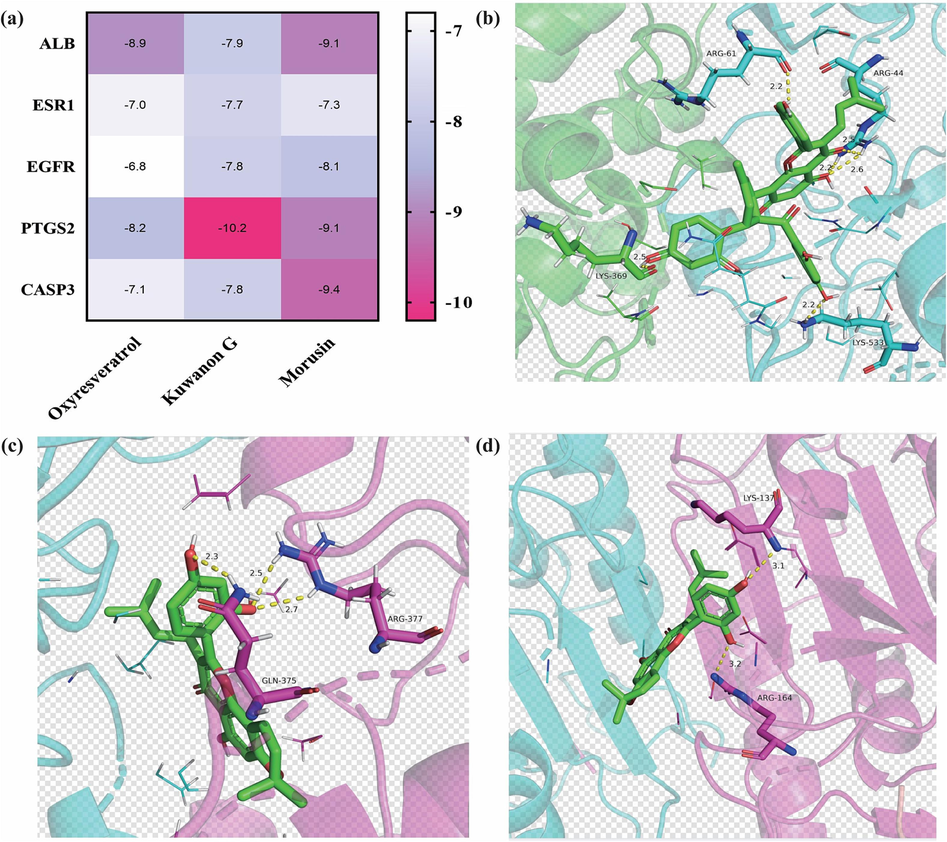
Molecular docking results. (a) Heat maps of molecular docking results; (b) Kuwanon G - PTGS2; (c) Morusin- CASP3; (d) Morusin-PTGS2.
4 Discussion
This study investigated the effect of honey-roasting on the main components of CM and highlighted the significant role of honey in the honey-roasting process. The addition of honey and the processing method influenced the results. The study systematically described the variations in physicochemical parameters of ZH and YH during the constant temperature refining process, including color, moisture, pH value, 5-HMF, TPC, and antioxidant activity. The changes in these parameters during the refining process were analyzed using a first-order kinetic model. The refining process resulted in increasing trends in honey temperature, color intensity, moisture content, viscosity, TPC, 5-HMF content, and FRAP over time. The pH value initially increased and then decreased, primarily due to the Maillard reaction. The variations in the refining process of the two honeys demonstrated the scientific nature of honey refining. The most suitable honey refining process was determined to be low temperature and long time refining (80℃, 100 min).
Using CM as an example, a strategy integrating chemical profiling, artificial neural network, network pharmacology, and molecular docking was developed for the comprehensive analysis and comparison of raw CM and its processed products. The overall composition of honey-roasted CM, stir-fried CM, and raw CM was determined, and 36 chromatographic peaks with significant differences were identified. In terms of component content, honey-roasted CM > stir-fried CM > raw CM. The honey-roasting process helped moderate the pharmacological effects and prevent significant loss of components in herbal medicine. HCA and PCA analysis showed obvious differences between honey-roasted CM, stir-fried CM, and raw CM. Orthogonal partial least squares discriminant analysis and artificial neural network were used to identify the main differentiating components, which were mulberroside A, oxyresveratrol, kuwanon G, sanggenon C, and morusin.
Oxyresveratrol, kuwanon G, and morusin were identified as important quality markers for the anti-inflammatory effect of CM through network pharmacology and molecular docking. Previous studies have shown that oxyresveratrol has anti-inflammatory effects by inhibiting the production of tumor necrosis factor alpha (TNF-α) and interleukin-1β (IL-1β) (He et al., 2021). Kuwanon G can inhibit the secretion of inflammatory factors (IL-1β and TNF-α), resist oxidative stress, and up-regulate the expression of cell junction proteins ZO-1, Occludin, and intercellular adhesion molecule (ICAM-1). It has a significant protective effect on the intestinal barrier by increasing Transendothelial electrical resistance (TEER) (Guo et al., 2016). Morusin has anti-inflammatory effects and may play a role in protecting acute lung injury by regulating the signaling expression of NF-κB (Rollinger et al., 2005). The anti-inflammatory activity of these active ingredients aligns with the antitussive and anti-inflammatory efficacy of CM in the treatment of lung diseases.
5 Conclusions
In conclusion, it has been proven that the inclusion of honey as an excipient can have an impact on the chemical composition of the drug itself, subsequently affecting its effectiveness. This approach differentiates the compounds found in raw and honey-processed CM samples, offering a comprehensive means of comparing the chemical constituents of Chinese herbal medicines prior to and following processing. Additionally, it is vital to consider the characteristics of the honey refining process, processing techniques, preparation methods, and clinical effects. This will allow for the selection of reasonable and reliable indicators, the formulation of standardized testing procedures and methods, and the enhancement of quality standards for honey refining.
CRediT authorship contribution statement
Meiqi Liu: Conceptualization, Methodology, Investigation, Visualization, Funding acquisition. Zijie Yang: Methodology, Software, Formal analysis. Jinli Wen: Formal analysis, Investigation. Zicheng Ma: Methodology, Software, Formal analysis. Lili Sun: Formal analysis, Investigation. Meng Wang: Software, Resources, Funding acquisition. Xiaoliang Ren: Investigation, Conceptualization, Investigation, Funding acquisition.
Acknowledgement
This work was financially supported by the Science & Technology Development Fund of Tianjin Education Commission for Higher Education (grant No. 2021KJ124).
Declaration of Competing Interest
The authors declare that they have no known competing financial interests or personal relationships that could have appeared to influence the work reported in this paper.
References
- Honey as an antioxidant therapy to reduce cognitive ageing. Iran. J. Basic. Med. Sci.. 2019;22:1368-1377.
- [CrossRef] [Google Scholar]
- A MATLAB toolbox for Self Organizing Maps and supervised neural network learning strategies. Chemometr. Intell. Lab.. 2012;118:24-32.
- [CrossRef] [Google Scholar]
- Variations of the antimicrobial, antioxidant, sensory attributes and biogenic amines content in Lithuania-derived bee products. LWT-Food. Sci. Technol.. 2020;118:108793
- [CrossRef] [Google Scholar]
- Antioxidant, Anti-inflammatory, and Antiproliferative Activity of Mori Cortex Radicis Extracts. Nat. Prod. Commun.. 2020;2020:15.
- [CrossRef] [Google Scholar]
- OPLS discriminant analysis: combining the strengths of PLS-DA and SIMCA classification. J. Chemometr.. 2006;20:341-351.
- [CrossRef] [Google Scholar]
- Topographic property of backpropagation artificial neural network: From human functional connectivity network to artificial neural network. Neurocomputing.. 2020;418:200-210.
- [CrossRef] [Google Scholar]
- Effects of processing adjuvants on traditional Chinese herbs. J. Food. Drug. Anal.. 2018;26:S96-S114.
- [CrossRef] [Google Scholar]
- Chinese Pharmacopoeia Committee Pharmacopoeia of the People’s Republic of China, 2020. China Chemical Industry Press, 374-375.
- Natural deep eutectic characteristics of honey improve the bioactivity and safety of traditional medicines. J. Ethnopharmacol.. 2020;250:112460
- [CrossRef] [Google Scholar]
- Antioxidant activity as biomarker of honey variety. Molecules.. 2018;23(8):2069.
- [CrossRef] [Google Scholar]
- Antioxidant properties and antimicrobial activity of manuka honey versus Polish honeys. J. Food. Sci. Tech. Mys.. 2020;57:1269-1277. 110.1007/s13197-019-04159-w
- [Google Scholar]
- Kuwanon G preserves LPS-induced disruotion of gut epithelial barrier in vitro. Molecules.. 2016;21:2111159. 1.3390/molecules21111597
- [Google Scholar]
- Resveratrol protects against myocardial ischemic injury via the inhibition of NF-κB dependent inflammation and the enhaement of antioxidant defenses. Int. J. Mol. Med.. 2021;3:29.
- [CrossRef] [Google Scholar]
- Unraveling the mystery of efficacy in Chinese medicine formula: New approaches and technologies for research on pharmacodynamic substances. Arab. J. Chem.. 2022;15:104302
- [CrossRef] [Google Scholar]
- Antioxidant, anti-lipidemic, hypoglycemic and antiproliferative effects of phenolics from Cortex Mori Radicis. Arab. J. Chem.. 2022;15
- [CrossRef] [Google Scholar]
- Cortex Mori Radicis extract attenuates myocardial damages in diabetic rats by regulating ERS. Biomed. Pharmacother.. 2017;90:777-785.
- [CrossRef] [Google Scholar]
- Comparison of Murraya exotica and Murraya paniculata by fingerprint analysis coupled with chemometrics and network pharmacology methods. Chin. J. Nat. Med.. 2021;19:713-720.
- [CrossRef] [Google Scholar]
- Adaptive robust principal component analysis. Neural Networks. 2019;119:85-92.
- [CrossRef] [Google Scholar]
- Discovery of potential Q-marker of traditional chinese medidine based on chemical profiling, chemometrics, network pharmacology, and molecular docking: Centipeda minima as an example. Phytocheml. Analysis.. 2022;8:1225-1234.
- [CrossRef] [Google Scholar]
- Antioxidant Activity in Bee Products: A Review. Antioxidants (basel).. 2021;10:71.
- [CrossRef] [Google Scholar]
- Martins, T. D., Annichino-Bizzacchi, J. M., Romano, A. V. C., et al., 2019. Principal Component Analysis on Recurrent Venous Thromboembolism. Clin. Appl. Thromb-Hem. 25, 1076029619895323. 10.1177/1076029619895323.
- Muresan, CI., Cornea-Cipcigan, M., Suharoschi, R., et al., 2022. Honey botanical origin and honey-specific protein pattern: Characterization of some European honeys. LWT-Food. Sci. Technol. 154, 112883. 10.1016/j.lwt.2021.112883.
- Physicochemical, antioxidant and antimicrobial properties of selected Malaysian honey as treated at different temperature: A comparative study. J. Apicult. Res.. 2020;61(4):567-575.
- [CrossRef] [Google Scholar]
- Ota, M., Xu, F., Li, Y. L., et al., 2018. Comparison of chemical constituents among licorice, roasted licorice, and roasted licorice with honey. J. Nat. Med-Tokyo. 2018;72:80-95. 10.1007/s11418-017-1115-4.
- Simultaneous Determination of Five Characteristic Stilbene Glycosides in Root Bark of Morus albus L. (Cortex Mori) Using High-Performance Liquid Chromatography. Phytocheml. Analysis.. 2011;22:230-235.
- [CrossRef] [Google Scholar]
- Discovering CoX-inhibiting constituents of Morus root bark.activity-guided versus computer-aided methods. Planta. Med.. 2005;71:399-405.
- [CrossRef] [Google Scholar]
- A comparative characterization of physicochemical and antioxidants properties of processed heterotrigona itama honey from diferent origins and classifcation by chemometrics analysis. Molecules.. 2019;24(21):3898.
- [CrossRef] [Google Scholar]
- Honey: Chemical composition, stability and authenticity. Food. Chem.. 2016;196:309-323.
- [CrossRef] [Google Scholar]
- Combination of LF-NMR and BP-ANN to monitor water states of typical fruits and vegetables during microwave vacuum drying. LWT-Food. Sci. Technol.. 2019;116:108548
- [CrossRef] [Google Scholar]
- Anti-inflammatory effects of Zhishi and Zhiqiao revealed by network pharmacology integrated with molecular mechanism and metabolomics studies. Phytomedicine.. 2018;50:61-72.
- [CrossRef] [Google Scholar]
Appendix A
Supplementary data
Supplementary data to this article can be found online at https://doi.org/10.1016/j.arabjc.2023.105519.
Appendix A
Supplementary data
The following are the Supplementary data to this article:Supplementary data 1
Supplementary data 1


