

Translate this page into:
The variation in essential oils composition, phenolic acids and flavonoids is correlated with changes in antioxidant activity during Cinnamomum loureirii bark growth
⁎Corresponding author. kdx@scau.edu.cn (Dexin Kong), wh@scau.edu.cn (Hong Wu)
-
Received: ,
Accepted: ,
This article was originally published by Elsevier and was migrated to Scientific Scholar after the change of Publisher.
Abstract
Cinnamomum loureirii is one of the most important medicinal and aromatic plants. It is used by the food, perfumery, cosmetic, and pharmaceutical industries. The objective of this study was to examine the relationships between the chemical composition and antioxidant activity of essential oil (EOs) and ethanol extracts from 10 samples of the bark from C. loureirii trees (6–15 years old). Obtained results showed that C. loureirii bark EO content at 12–15 years old had high oil yields (4.52–5.48%). The major components in the EOs were trans-cinnamaldehyde (50.2–92.9%) and α-copaene (0.5–21.3%). The highest content of trans-cinnamaldehyde in bark EOs was obtained from 10 to 12-year-old trees, while the highest content of α-copaene was obtained at 13–15 years. The highest total phenolic (429.85 and 474.45 mg TAE /g DW) and total flavonoid contents (85.54 and 102.80 mg RE /g e DW) were obtained from the 13- to 14-year-old trees. Our results indicated that the EO and ethanol extract of 13- to 14-year-old bark showed the strongest antioxidant properties. Moreover, GC–MS, PCA and correlation analysis indicated that the changes in α-copaene, beta-caryophyllene, τ-muurolene, γ-muurolene, δ-cadinene and τ-muurolol were positively correlated with the changes in antioxidant activity in oils. Meanwhile, procyanidin B2 and hyperoside were the main contributors to the antioxidant activity of the ethanol extract from C. loureirii bark. This study is the first one that report the antioxidant potential and phenolic profile of C. loureirii plant. These results provide reference information for the rational utilization of C. loureirii resources and the harvest of C. loureirii bark as medicinal materials during the optimal period.
Keywords
Cinnamomum loureirii
Essential oil
Antioxidant
GC–MS
Composition analysis

1 Introduction
Cinnamon belongs to the Lauraceae family and is widely distributed in China, Vietnam, Sri Lanka, Madagascar, Seychelles and India. As an important traditional herbal medicine, cinnamon has been identified to possess excellent anti-inflammatory, anti-hyperglycemic, anti-arthritic and anti-oxidant properties and it is commonly used in pharmaceutical preparations, cosmetics, food and beverages with great commercial value because its bark contains abundant essential oils (EOs), phenolic acids and flavonoids (Lee et al., 2018; Wang et al., 2018; Elamrani et al., 2019; Moreno et al., 2019; Tepe & Ozaslan, 2020). The antioxidant activity of plant EO and ethanol extracts is the basis of many applications, such as pharmaceuticals, food preservation, natural therapies and alternative medicine (Šiler et al., 2014; León et al., 2014).
Cinnamomum cassia Presl., Cinnamomum verum J. Presl and Cinnamomum loureirii Nees L. can be used as spices and medicines (Ravindran et al., 2004). Among them, C. loureirii EO content are 30% higher than those in other varieties, including C. cassia (Jiang et al., 2007; Wang, 2011). Moreover, the cinnamaldehyde content accounting for its distinct taste and scent in C. loureirii is higher than in C. cassia (Gao et al., 2020). Recently, C. loureirii was recommended as one of the high application value species in the Lauraceae family based on metabolome data (Gao et al., 2020). Moreover, the variation in antioxidant activity is mainly correlated with changes in EOs and other phenolic substances in cinnamon plants (Jain et al., 2014; Abdelwahab et al., 2017). However, the dynamic accumulation of EOs, phenolic acids and flavonoids, and the changes in how these compounds affect antioxidant activity in different growth ages of C. loureirii bark remain unknown.
The biosynthesis of secondary metabolites (SMs) largely depends on cell type, developmental stage and environmental cues (Patra et al., 2013). Plant age (Geng et al., 2011; Vazquez-Leon et al., 2017), harvesting season (Gomes et al., 2019) and growth stage (Li et al., 2016; Li et al., 2020) all affect the content of SMs in medicinal plants. To determine the appropriate tree age for cinnamon bark collection to obtain high levels of phytochemical compounds with favorable qualities for the pharmaceutical or food industries, we studied the dynamic changes in EOs, phenolic acids and flavonoids of C. loureirii bark at different growth ages and determined how their dynamic variation affected their antioxidant activity. The present study provides reference information for the rational utilization of C. loureirii resources and to determine the optimal harvesting period of C. loureirii bark as medicinal materials for antioxidant development.
2 Materials and methods
2.1 Plant material
C. loureirii bark at different growth ages (6–15 years old) were collected in Maoming city, Guangdong, China, in September 2017. The samples from each specimen were collected from 3 individual plants. The age of the trees was determined by the growth rings and the farmer’s records. The C. loureirii bark samples were collected from the plants at a height of 1.0–1.2 m above the ground. These plants for collecting samples were authenticated by Dr. Rongjing Zhang (South China Agricultural University, Guangzhou, China).
2.2 Essential oil extraction yield
The sample preparation and EO extraction were determined by the method of Li et al. (2013b). In brief, fresh bark samples from each specimen were randomly collected from 3 individual plants representing the local population. The volatile oils of the C. loureirii bark were obtained by hydrodistillation in accordance with the method in the Pharmacopoeia of the People’s Republic of China (China Pharmacopeia Commission, 2020). Then, methylene dichloride was used to extract the volatile compounds from the water phase 3 times, and the distillate was removed by heating (steam bath) in a fume hood. The yellow volatile oils were obtained and weighed, and the extract yield was then calculated and expressed as the percentage of the weight of the crude extract to the raw material (15 g). Finally, the collected volatile extract was kept at 4 °C for further analysis.
2.3 Analysis of the essential oil (EO)
GC–MS analysis was performed on a gas chromatograph 7890A (Agilent, USA) interfaced with a 5975C Plus mass spectrometer (Agilent, USA). A fused silica capillary Agilent Technology HP-5 ms (5% phenyl methyl siloxane) column (30 m × 0.25 mm i.d., GC column film thickness 0.1 m) was used for the separation. The injector temperature was 200 °C, and the detector temperature was 250 °C. The initial temperature was 45 °C, and the temperature was gradually increased to 80 °C at a rate of 5 °C/min and was then held for 3 min. Then, the temperature was increased to 170 °C at 8 °C/min (then held for 10 min at the final temperature). The interface was kept at 200 °C. The linear velocity of the helium carrier gas was 1.0 ml min−1 at a split ratio of 60:1. EI was used as the ion source, mass spectra were obtained at 70 eV, and the ion source temperature was 230 °C. A quadrupole mass analyzer was set to scan from 30 to 550 amu, scan time, 1 s. Diluted samples (0.8 g/ml) were prepared using methylene dichloride, and 1.0 μl of sample was injected for analysis.
The identification of the components was performed by matching their recorded mass spectra with the standard mass spectra from the National Institute of Standards and Technology (NIST05. LIB) library data provided by the software of the GC–MS system, literature data (Adams, 2007) and standards of the main components. The results were also based on a comparison of the retention indices (RIs) obtained using a homologous series of normal alkanes (Sigma, St. Louis, MO, USA) as a reference on an HP-5 ms capillary column. Quantitative analyses of each EO component (expressed as area percentage was calculated from the total ion chromatogram TIC) were carried out by a peak area normalization measurement, calculated as the mean values of three injections from each sample.
2.4 Preparation of ethanolic extracts
One gram of powder obtained from C. loureirii bark at different growth ages (6–15 years) was dissolved in 70% ethanol. The pulverized plant material was mixed with ethanol at a ratio of 1:50 (w/v). Extraction was performed according to Baskan et al. (2007). The crude extract was obtained upon filtering and concentrating, and then the extracts were filtered and stored at 4 °C until analysis.
2.5 Total phenolic content (TPC)
TPC was determined using the Folin–Ciocalteu reagent according to the method of Abdelwahab et al. (2017), using tannic acid as a standard.
The solution thus obtained was filtered, 0.1 ml of the ethanol extract was mixed with 0.6 ml of Foline-Ciocalteu’s reagent (1:5 diluted with distilled water), and the flask was thoroughly shaken. The mixture was allowed to react for 6 min, and then 1.25 ml of 7% (w/v) sodium carbonate solution was added in a tube test and shaken well. At the end of incubation for 1.5 h at room temperature, the absorbance of each mixture was measured at 760 nm. The same procedure was also applied to the standard solutions of tannic acid, and a standard curve was obtained. The tannic acid standard curve was established by plotting the concentration (mg/ml) versus absorbance (nm) (y = 0.0997x + 0.1255; R2 = 0.9975), where y is absorbance and x is concentration in GAE (n = 3). Total phenol values were expressed in terms of tannic acid equivalents (mg TAE/g DW).
2.6 Determination of total flavonoid content (TFC)
TFC was determined using the method of Ku et al. (2011) with minor modifications. In brief, 0.3 ml of 5% sodium nitrite was mixed with 10 ml of C. loureirii extract and it was incubated for 6 min. Then, 0.3 ml of 10% aluminum nitrate was added and it was incubated for 6 min. Then, 4.0 ml of 4% sodium hydroxide solution was added, and the volume was finally adjusted to 10 ml. The absorbance of each mixture was measured at 508 nm (UV-2802, Unico Co Ltd., Shanghai, China). Rutin was applied as a standard, and the outcomes were expressed as mg of rutin equivalents per gram of the plant dry weight.
2.7 Identification of extracted compounds
High-performance liquid chromatography-mass spectrometry/mass spectrometry (HPLC-MS/MS) was used to analyze the compounds extracted from the C. loureirii samples using a separation module equipped with a C18 column (2.1 × 50 mm, 1.8 μm, Agilent) and a diode array detector (Rheodyne, USA). The samples were eluted using a gradient system of solvent A (2% formic acid, v/v) and solvent B (acetonitrile: methanol, 10:15, v/v) as the mobile phase at a flow rate of 0.4 ml/min. The temperature of the column was maintained at 30 °C, and the injection volume was 5 μl. The gradient system started from 70% A and 30% at 0–7 min, 10% A and 90% B at 8 min, and 10% A and 90% B at 8–10 min. The identification of compounds of the C. loureirii species was achieved in comparison with the retention time of the standards. The compounds were quantified on the basis of their peak areas and the calibration curves of the corresponding standards and then expressed as μg/g DW.
Preparation of the standard substances and calibration curves: The standard compounds epicatechin (490–46-0), hyperoside (482–36-0), procyanidins B2 (29106–49-8), protocatechualdehyde (139–85-5), rutin (153–18-4) and ellagic acid (476–66-4) were purchased from Chengdu Must Bio-Technology Co., Ltd. To determine the linearity of the chromatographic techniques, calibration plots were constructed for the six standards on the basis of peak areas (y) using five different concentration solutions (x) (epicatechin: 1.25 μg/ml, 3.00 μg/ml, 6.25 μg/ml, 12.50 μg/ml, 25.00 μg/ml; hyperoside: 0.0125 μg/ml, 0.125 μg/ml, 0.25 μg/ml, 0.50 μg/ml, 1.25 μg/ml; procyanidins B2: 1.25 μg/ml, 3.00 μg/ml, 6.25 μg/ml, 12.50 μg/ml, 25.00 μg/ml; protocatechualdehyde: 0.0125 μg/ml, 0.125 μg/ml, 0.25 μg/ml, 0.50 μg/ml, 1.25 μg/ml; rutin: 0.125 μg/ml, 1.25 μg/ml, 3.00 μg/ml, 6.25 μg/ml, 12.50 μg/ml and ellagic acid: 1.25 μg/ml, 3.00 μg/ml, 6.25 μg/ml, 12.50 μg/ml, 25.00 μg/ml). All plots are linear in the examined ranges, and the linear ranges are shown at different concentrations for the standard compounds (mg). All of the standard compounds showed good linearity (r2 ≥ 0.999) in a relatively wide concentration range: epicatechin (r2 = 0.998), hyperoside (r2 = 0.999), procyanidins B2 (r2 = 0.999), protocatechualdehyde (r2 = 0.999), rutin (r2 = 0.999), and ellagic acid (r2 = 0.999).
2.8 DPPH radical scavenging assay
DPPH radical scavenging activity was determined using the procedure reported in Lin et al. (2007) with little modification. Briefly, 0.2 ml of the sample of each EO blended at 100 μg/ml in 80% methanol was mixed with 1 ml of 0.2 mM ethanol DPPH solution. A concentration of 100 μg/ml was prepared for ethanolic extract. The reaction mixtures were shaken vigorously and then kept in the dark for 1 h. The reduction of DPPH radicals was measured by reading the absorbance at 517 nm against the blank without DPPH. The ethanol were used as a negative control, while gallic acid was used as a positive control. The percentage of inhibition of DPPH was calculated using the following formula: where Aa and Ab are the absorbance values of the DPPH radical in the presence of the plant extract sample and the control, respectively. The inhibition percentage was plotted versus the sample concentration, and 50% of the inhibitory concentration (IC50) of the DPPH values was calculated from the regression equation. These values were recalculated to the reciprocal of IC50 (1/IC50) which is defined as antiradical power (ARP). The higher the value of antiradical power the higher the antioxidant activity (Roby et al., 2013).
2.9 Ferric reducing/antioxidant power (FRAP) assay
The ability to reduce ferric ions was measured using commercial kits (Beyotime Institute of Biotechnology, Shanghai City, PR China) to assay the antioxidant capacity. In the reaction mixture, ferric-tripyridyltriazine (Fe3+-TPTZ) was reduced by antioxidant reducing agents, and the blue complex Fe2+-TPTZ was produced. Next, EO (10 µl, 10 mg/ml), the extracts (10 µl, 10 mg/ml) or FeSO4·7H2O standard (10 µl, 0.15–1.5 mM) were dissolved in methanol and adjusted to 190 µl with FRAP reagent. The absorbance was evaluated at 593 nm after 30 min incubation in the dark at 37 °C. The concentration of Fe2+-TPTZ (reducing capacity) was calculated by comparing the absorbance at 593 nm with the standard curve of the Fe(II) standard solutions (ferrous sulfate heptahydrate).
2.10 ABTS radical scavenging activity assay
The total antioxidant capacity of the EO was evaluated using the ABTS method (Beyotime Institute of Biotechnology, Shanghai City, PR China). A solution of 7 mM ABTS [2,2-azino-bis(3-ethylbenzothiazoline-6-sulphonic acid)] and 2.45 mM potassium persulphate was incubated in the dark for 12–16 h, after which the solution was diluted with ethanol until the absorbance reached 0.7 ± 0.02 at 734 nm. Then, ABTS. + . solution was diluted with ethanol (80%). Next, EO (10 µl, 10 mg/ml), extracts (10 µl, 10 mg/ml) or Trolox standard (10 µl, 0.5–1.5 mM) were allowed to react with 200 µl of the ABTS solution, and the absorbance was evaluated at 734 nm after 10 min in the dark at room temperature. Trolox, a water-soluble analog of vitamin E, was used as a reference standard for the preparation of the calibration curve.
2.11 Statistical analysis
Data were expressed as means ± standard deviations (SD) of three replicate determinations and then analyzed by SPSS V.16 (SPSS Inc., Chicago, IL, USA). Analysis of variation (ANOVA) and plotting were uesd to deteimine the differences among the means with Origin 8.0 software. The results were considered statistically significant at p < 0.05. The eleven main components of the oils (expressed as an area percentage), the six ethanol extract compound contents, and antioxidant activity value were used to build the principal component analysis (PCA), and spearman correlation coefficients by using the SPSS statistical package, version 16.0 for Windows (SPSS Inc., Chicago, IL, USA) to determine the relationships among the phytochemical traits.
3 Results
3.1 Essential oil yield
EOs yield from 6 to 15 years of growth bark are shown in Fig. 1, and the distilled EOs had high yields ranging from 1.42 to 5.48% of the ten samples. The contents of oil depended on the age of the tree and it seems to increase with the tree growth stages. The bark with 12–15 years of growth had the highest oil yield, which varied within 4.52–5.48%, while the oil yields were low, varying within 1.42–0.70% for the 6–11 years of growth.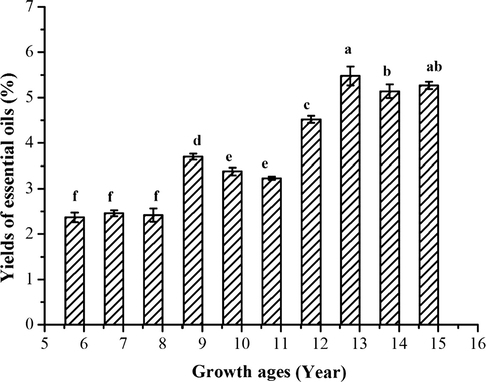
Yields (% w/w) of EO from bark of C. loureirii. The columns with different lowercase letters are significantly different (p < 0.05).
3.2 Chemical composition of the essential oils
To explore the variations in the chemical composition of the oils during C. loureirii bark growth, the oil compositions were analyzed using GC–MS. The chemical compositions of EOs from C. loureirii bark obtained from ten growth ages is shown in Table 1. The most abundant components of the bark oils were trans-cinnamaldehyde (50.2–92.9%), α-copaene (0.5–21.3%), γ-muurolene (0.2–3.7%), and δ-cadinene (0.2–8.1%). The present study revealed that the C. loureirii bark oils contained high amounts of trans-cinnamaldehyde (50.2–92.9%) in all of the samples. The contents of trans-cinnamaldehyde increased with the age of the tree, reaching a peak in the 10–12-year-old trees (90.2–92.9%) and then it decreased. The contents of α-copaene (18.1–21.3%), γ-muurolene (3.2–3.7%), and δ-cadinene (4.9–8.1%) from the older trees (13–15 years old) were consistently higher than those of the other seven samples (0.5–4.5%, 0.2–0.7% and 0.2–1.6%, respectively). It is notable that aldehydes (50.2–92.9%), monoterpenoid (0.5–21.3%) and sesquiterpene (1.8–18.4%) were the dominant compounds in the EOs (Table 1). The aldehydes of C. loureirii were found at the highest content in 10- to 12-year-old trees. The highest ratio of monoterpenoid (represented by α-copaene), sesquiterpene (represented by γ-muurolene, τ-muurolene and δ-cadinene) and oxygenated sesquiterpenoid contents were observed in 13- to 15-year-old trees (18.2–21.3%, 12.1–18.4% and 1.8–2.3%, respectively). a Retention indices (R.I.) based on a homologous series of normal alkanes. b Retention time. b Data is expressed as mean ± SD. Bars sharing the same small letter within a line did not share signifificant differences at P < 0.05; –, not detected; Tr (trace), relative content < 0.1%.
No.
Compount
RIa
Relative content (%)b
6 years
7 years
8 years
9 years
10 years
11 years
12 years
13 years
14 years
15 years
1
p-Xylene
907
–
–
0.5 ± 0.02a
–
–
–
–
–
–
–
2
α-Pinene
938
Tr
–
0.3 ± 0.02a
0.2 ± 0.01b
0.2 ± 0.01c
0.1 ± 0.01d
0.2 ± 0.02b
0.2 ± 0.01b
0.1 ± 0.01d
Tr
3
trans-Cinnamaldehde
1227
85.1 ± 0.34b
77.4 ± 0.64c
62.2 ± 0.35e
75.3 ± 0.46d
90.2 ± 0.95a
91.3 ± 0.12a
92.9 ± 0.68a
60.5 ± 0.84f
55.7 ± 0.86 g
50.2 ± 0.46 h
4
alpha-Ylangene
1376
–
–
–
0.10 ± 0.01a
–
–
Tr
Tr
Tr
Tr
5
α-Copaene
1379
0.7 ± 0.64e
0.5 ± 0.05f
2.4 ± 0.86e
2.9 ± 0.34e
4.5 ± 0.46d
1.5 ± 0.24ef
2.8 ± 0.26ef
19.4 ± 1.12b
18.1 ± 1.09c
21.3 ± 1.34a
6
β-Elemene
1387
–
–
–
0.1 ± 0.01d
Tr
0.2 ± 0.02c
0.1 ± 0.01d
0.4 ± 0.04a
0.3 ± 0.02b
0.4 ± 0.03a
7
Sativene
1396
–
Tr
–
–
Tr
0.2 ± 0.02c
Tr
0.4 ± 0.02b
0.4 ± 0.01a
0.4 ± 0.03a
8
Isosativene
1406
–
–
–
Tr
–
Tr
Tr
0.3 ± 0.01a
0.1 ± 0.01b
Tr
9
beta-Caryophyllene
1420
–
Tr
0.2 ± 0.01b
0.1 ± 0.01c
Tr
0.3 ± 0.01a
0.1 ± 0.02c
0.3 ± 0.01a
0.3 ± 0.01a
0.3 ± 0.03a
10
trans-α-Bergamotene
1433
0.1 ± 0.01c
–
–
0.2 ± 0.02b
Tr
Tr
0.1 ± 0.01d
0.2 ± 0.01b
0.2 ± 0.01c
0.5 ± 0.02a
11
Humulene
1454
–
–
–
Tr
Tr
0.3 ± 0.03b
–
0.4 ± 0.02a
0.3 ± 0.01b
0.5 ± 0.02a
12
γ-Muurolene
1471
0.3 ± 0.02 g
0.2 ± 0.01 h
0.3 ± 0.01f
1.1 ± 0.04d
0.2 ± 0.01 g
0.9 ± 0.05f
0.3 ± 0.02f
1.6 ± 0.03a
1.3 ± 0.05c
1.5 ± 0.09b
13
α-Selinene
1486
–
–
–
0.1 ± 0.01d
–
0.1 ± 0.01d
Tr
0.2 ± 0.01b
0.2 ± 0.02c
0.3 ± 0.01a
14
τ-Muurolene
1494
0.3 ± 0.02 g
0.2 ± 0.01 h
0.6 ± 0.02d
0.7 ± 0.02c
0.4 ± 0.01f
0.7 ± 0.03c
0.4 ± 0.04f
3.2 ± 0.45b
3.3 ± 0.84b
3.7 ± 0.68a
15
β-Bisabolene
1500
0.2 ± 0.01d
–
Tr
0.4 ± 0.02c
Tr
0.2 ± 0.01d
0.2 ± 0.02d
0.5 ± 0.02b
0.2 ± 0.01d
0.8 ± 0.04a
16
γ-Cadinene
1507
0.2 ± 0.01e
–
–
0.6 ± 0.03a
Tr
0.3 ± 0.01d
0.1 ± 0.01f
0.5 ± 0.02b
0.3 ± 0.01d
0.4 ± 0.02c
17
δ-Cadinene
1513
0.9 ± 0.04de
0.2 ± 0.01e
0.7 ± 0.04e
1.6 ± 0.06d
0.9 ± 0.03de
0.3 ± 0.01e
0.7 ± 0.02e
5.8 ± 0.41b
4.9 ± 0.35c
8.1 ± 0.75a
18
α-Calacorene
1539
–
1.4 ± 0.14a
0.4 ± 0.01 cd
0.5 ± 0.03c
0.3 ± 0.01 cd
0.8 ± 0.04b
0.2 ± 0.04d
0.5 ± 0.02c
0.3 ± 0.02 cd
1.5 ± 0.11a
19
Caryophyllene oxide
1575
–
Tr
–
0.4 ± 0.02a
Tr
0.1 ± 0.01d
–
Tr
0.2 ± 0.02c
0.3 ± 0.01b
20
Isoaromadendrene epoxide
1582
–
–
Tr
0.3 ± 0.04a
Tr
0.3 ± 0.02ab
–
0.2 ± 0.01bc
Tr
0.1 ± 0.02c
21
Cubenol
1585
–
–
–
0.4 ± 0.02c
Tr
0.2 ± 0.02d
0.1 ± 0.01e
0.5 ± 0.02b
0.4 ± 0.03c
0.9 ± 0.03a
22
2-Hexyl-1-octanol
1591
0.3 ± 0.04b
–
2.3 ± 0.57a
0.2 ± 0.02bc
–
–
–
0.2 ± 0.01c
–
–
23
τ-Muurolol
1618
–
–
–
0.3 ± 0.01d
Tr
0.3 ± 0.01d
0.1 ± 0.01e
0.7 ± 0.03b
0.6 ± 0.03c
0.8 ± 0.05a
24
δ-Cadinol
1626
–
–
–
0.1 ± 0.01
–
0.2 ± 0.01c
Tr
0.4 ± 0.02b
0.4 ± 0.01b
0.5 ± 0.02a
25
Longiverbenone
1646
–
–
–
–
–
–
Tr
0.9 ± 0.05a
0.4 ± 0.02b
0.2 ± 0.01c
26
α-bisabolol
1675
–
–
–
0.2 ± 0.01b
–
0.1 ± 0.01c
Tr
0.1 ± 0.01c
0.2 ± 0.01b
Tr
27
Heptacosane
2700
1.4 ± 0.54b
0.2 ± 0.01d
5.1 ± 0.64a
0.6 ± 0.03c
Tr
Tr
–
0.5 ± 0.02c
Tr
–
28
Octacosane
2800
0.7 ± 0.03b
–
5.0 ± 0.23a
0.5 ± 0.02b
Tr
–
–
0.5 ± 0.03b
–
–
Aldehydes
85.1
77.4
62.2
75.3
90.2
91.3
92.9
60.5
55.7
50.2
Monoterpenoids
0.7
0.5
3.2
3.1
4.7
1.6
3.0
19.6
18.2
21.3
Oxygenated monoterpenoids
0.3
–
2.3
0.6
–
0.2
0.1
0.7
0.4
0.9
Sesquiterpenoids
2.0
2.0
2.2
5.5
1.8
4.3
2.2
14.3
12.1
18.4
Oxygenated sesquiterpenoids
–
–
–
1.3
–
1.0
0.1
2.3
1.8
1.9
Hydrocarbon
2.1
0.2
10.1
1.1
–
–
–
0.9
–
–
Total
90.2
80.1
80.0
86.9
96.7
98.4
98.3
98.3
88.2
92.7
3.3 Antioxidant properties of the essential oils
The principle of antioxidant activity is based on the availability of electrons to neutralize free radicals. In this study, the antioxidant activity of EOs from C. loureirii at different growth ages was evaluated by DPPH radical scavenging, FRAP and ABTS assays using Trolox and gallic acid (GAE) as references or positive controls. A lower IC50 value indicates a stronger ability of the EO to act as a DPPH scavenger, while the higher IC50 value indicates a lower scavenging activity of the scavengers. Another parameter is the antiradical power (ARP) which is calculated by dividing 1 by EC50. The higher the value of antiradical power (ARP), the higher is the free radical scavenging activity.
As shown in Table 2, The DPPH, ARP, FRAP and ABTS values of the 6- to 15-year-old C. loureirii bark oils are 0.012–0.065 mg/ml, 15.38–83.33, 0.17–0.55 mg (Fe2+)/g and 1.09–1.27 mg Trolox/g, respectively. In all methods, the antioxidant activities showed that the IC50 value (0.012–0.022 mg/ml), ARP value (45.45–83.33), FRAP (0.40–0.55 mg(Fe2+)/g), and ABTS (1.14–1.27 mg Trolox/g) in 10–15-year-old C. loureirii bark oils were higher than those of 6–9-year-olds (0.024–0.065 mg/ml for IC50 value; 15.38–44.67 for ARP value, 0.17–0.23 mg(Fe2+)/g for FRAP and 1.09–1.13 mg Trolox/g for ABTS). In particular, the antioxidant activity of 13- and 14-year-olds had a lower IC50 value than that of GAE (positive control), indicating that oils from 13- and 14-year-olds act as an effective DPPH. Values in the same column with different subscripts are significantly different for each assay at P < 0.05.
Different ages
DPPH IC50 (mg/ml)
ARP
FRAP (mg Fe2+/g)
ABTS (mg Trolox/g)
6
0.031 ± 0.0042c
31.90 ± 2.76f
0.19 ± 0.03de
1.09 ± 0.00f
7
0.033 ± 0.0032b
30.30 ± 5.25f
0.17 ± 0.04e
1.13 ± 0.02e
8
0.065 ± 0.0052a
15.38 ± 2.98 g
0.20 ± 0.01de
1.13 ± 0.01de
9
0.024 ± 0.0067e
44.67 ± 4.34e
0.23 ± 0.01d
1.13 ± 0.01e
10
0.022 ± 0.0039d
45.45 ± 6.01e
0.40 ± 0.05c
1.14 ± 0.00de
11
0.017 ± 0.0041f
58.82 ± 4.72c
0.47 ± 0.04b
1.17 ± 0.02c
12
0.020 ± 0.0074 g
50.00 ± 2.78d
0.41 ± 0.03c
1.15 ± 0.01d
13
0.014 ± 0.0026e
71.42 ± 7.34b
0.53 ± 0.01a
1.21 ± 0.02b
14
0.012 ± 0.0057 g
83.33 ± 5.32a
0.51 ± 0.05ab
1.26 ± 0.01a
15
0.018 ± 0.0014f
55.56 ± 1.34c
0.55 ± 0.05a
1.27 ± 0.05a
TROLOX
–
0.71
1.53
Gallic acid
0.014 ± 0.0032
–
–
3.4 Correlations between the main essential oil components and antioxidant activity
Principal component analysis (PCA) was performed to understand the interrelationships among the measured antioxidant activity and EO constituents. The results of the PCA are shown in Fig. 2. Two principal components (PC1 and PC2) explaining 93.02% of the total data variance were chosen on the basis of their eigenvalues. The PC1 and PC2 results indicated that the antioxidant activity of C. loureirii bark oils had positive correlations with α-copaene, beta-caryophyllene, τ-muurolene, γ-muurolene, δ-cadinene, a-calacorene and τ-muurolol and negative correlations with trans-cinnamaldehde, 2-hexyl-1-octanol, heptacosane and octacosane (Fig. 2).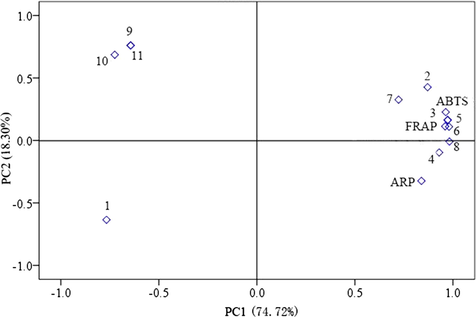
Principal component analysis loading plot of antioxidant activity and the main chemical compositions of EOs from different growth ages of C. loureirii bark. The1, 2, 3, 4, 5, 6, 7, 8, 9, 10 and 11 represent trans-cinnamaldehyde, beta-caryophyllene, α-copaene, τ-muurolene, γ-muurolene, δ-cadinene, a-calacorene, τ-muurolol, 2-hexyl-1-octanol, heptacosane and octacosane, respectively.
The relationship between antioxidant activity and the main components of EOs was determined by a correlation analysis. The results (Table 3) indicated beta-caryophyllene, α-copaene, τ-muurolene, γ-muurolene, δ-cadinene and τ-muurolol was significantly positive correlation to the ARP, FRAP and ABTS assay (r = 0.73, 0.65, 0.69, 0.75, 0.48, 0.78; r = 0.75, 0.84, 0.82, 0.89, 0.64, 0.88 and r = 0.73, 0.77, 0.71, 0.84, 0.50, 0.82, respectively). These results further confirmed the results from the PCA.
Compounds
ARP
FRAP
ABTS
trans-cinnamaldehyde
−0.24
−0.42
−0.44
beta-caryophyllene
0.73*
0.75*
0.73*
α-copaene
0.65*
0.84**
0.77**
τ-muurolene
0.69*
0.82**
0.71*
γ-muurolene
0.75*
0.89**
0.84**
δ-cadinene
0.48
0.64*
0.50
a-calacorene
0.08
0.26
0.36
τ-muurolol
0.78**
0.88**
0.82**
2-hexyl-1-octanol
−0.68*
−0.55
−0.73*
Heptacosane
−0.65*
−0.59
−0.71*
Octacosane
−0.90*
−0.84
−0.88*
3.5 Determination of total phenolic and flavonoid contents and antioxidants in ethanol extracts
The present study compared the TPC, TFC and antioxidant activities of extracts from 6 to 15-year-old C. loureirii bark (Table 4). The ethanol extracts of C. loureirii bark exhibited remarkable antioxidant activities. There were significant differences in the antioxidant activity of extracts from bark at different growth ages. Except for 9- and 10-year-old bark, for which the FRAP (1773.29, 1842.12 µM Fe2+/g) in the plants was low, the DPPH (0.024–0.040 mg/ml), ARP value (25.00–41.67), FRAP (2110.94–2840.52 µM Fe2+/g) and ABTS (310.5–483.93 mg Trolox/g) in 9- to 15-year-old plants were apparently higher than those in 6- to 8-year-old plants (0.057–0.093 mg/ml for DPPH, 10.75–17.54 ARP value, 1167.32–2054.70 µM Fe2+/g for FRAP and 113.9–295.9 mg Trolox/g for ABTS). In the study, TPC were the range of 37.27 for 376.35 mg GAEs/g, TAC were the range of 39.12 for 102.80 mg REs/g of 6–15-year-old C. loureirii bark. Moreover, the results indicated that the antioxidant capacities of the different growth ages showed a significant relationship between TPC and TFC in C. loureirii. For example, 13–14 growth years were found to have the highest antioxidant activity, which coincided with higher total phenolics (429.85–474.45 mg GAEs/g) and total flavonoids (85.99–102.80 mg REs/g) in the ethanol extracts. Six- to eight-year-olds were found to have low antioxidant capacity, which coincided with lower total phenolic (37.27–43.65 mg GAEs/g) and total flavonoid (39.12–59.09 mg REs/g) contents. Values in the same column with different subscripts are significantly different for each assay at p < 0.05. a TAE, tannic acid equivalents. b RE, rutin equivalent.
Growth ages
Total phenolic (mg TAE a/g DW)
Total flavonoid (mg RE b/g e DW)
DPPH IC50 (mg/ml)
ARP
FRAP (µM Fe2+/g)
ABTS (mg Trolox/g)
6
37.27 ± 2.28 g
39.12 ± 0.86e
0.093 ± 0.0019a
10.75
1167.32 ± 19.18f
113.9 ± 7.362c
7
44.13 ± 0.57 g
64.92 ± 0.82 cd
0.057 ± 0.0081b
17.54
2054.70 ± 55.43bc
295.9 ± 5.60b
8
43.65 ± 2.53 h
59.09 ± 1.10de
0.060 ± 0.0032b
16.67
1808.77 ± 85.61de
290.8 ± 9.40b
9
305.33 ± 2.51f
73.39 ± 1.03bcd
0.030 ± 0.0079ef
33.33
1773.29 ± 40.50e
310.5 ± 5.32b
10
307.12 ± 3.27f
74.20 ± 0.94bcd
0.028 ± 0.0010 fg
35.71
1842.12 ± 50.80e
321.00 ± 8.55b
11
348.15 ± 1.50e
75.55 ± 0.61bcd
0.026 ± 0.0055 fg
38.46
2110.94 ± 150.91bc
317.2 ± 1.40b
12
387.03 ± 7.39c
85.54 ± 1.05abc
0.036 ± 0.0012 cd
27.77
2608.38 ± 157.64a
329.91 ± 7.36b
13
429.85 ± 3.72b
102.80 ± 1.15a
0.034 ± 0.0028de
29.41
2756.17 ± 180.67a
361.84 ± 2.42ab
14
474.45 ± 2.05a
85.99 ± 0.04bc
0.024 ± 0.0018 g
41.67
2840.52 ± 82.69a
438.93 ± 4.64a
15
376.35 ± 3.55d
80.89 ± 0.59ab
0.040 ± 0.0011c
25.00
2529.10 ± 161.06ab
385.41 ± 3.15ab
TROLOX
5220 ± 7.95
3966.4 ± 6.01
Gallic acid
0.013 ± 0.0013
3.6 Identification and quantification of phenolic acid and flavonoid compounds
To study the correlation of the compounds with the antioxidant activity in the C. loureirii bark, the phenolic acid and flavonoid compounds from C. loureirii bark were analyzed by HPLC-MS/MS. The results are presented in Table 5. Six ethanol extract compounds, namely, hyperoside, epicatechin, rutin, ellagic acid, protocatechualdehyde and procyanidin B2, were identified and then quantified by comparing their peak areas with these six standards. Great variation existed in the composition among these samples. Procyanidins B2 (1.38–3.10 µg/mg) and hyperoside (0.21–0.45 µg/mg) had the highest content among the seven compounds. The content of procyanidins B2 and hyperoside in older trees (10–15 years) was higher than that in younger trees (6–9 years). The highest contents of procyanidin B2 and hyperoside were obtained from 14 years of growth (3.10 µg/mg and 0.45 µg/mg, respectively) (Table 5). Values in the same column with different subscripts are significantly different for each assay at p < 0.05.
Different ages
Compounds (µg/mg)
Hyperoside
Epicatechin
Rutin
Ellagic acid
Protocatechualdehyde
Procyanidins B2
6
0.21
3.36 × 10⁻³
0.78 × 10⁻³
159.47 × 10⁻³
23.36 × 10⁻³
1.49
7
0.25
9.68 × 10⁻³
10.82 × 10⁻³
4.95 × 10⁻³
20.02 × 10⁻³
1.80
8
0.24
2.55 × 10⁻³
10.32 × 10⁻³
5.14 × 10⁻³
28.25 × 10⁻³
1.38
9
0.28
6.47 × 10⁻³
7.8 × 10⁻³
120.18 × 10⁻³
31.85 × 10⁻³
1.90
10
0.31
2.6 × 10⁻³
5.27 × 10⁻³
88.13 × 10⁻³
16.47 × 10⁻³
2.24
11
0.42
4.64 × 10⁻³
4.64 × 10⁻³
118.04 × 10⁻³
8.55 × 10⁻³
2.73
12
0.38
5.68 × 10⁻³
2.92 × 10⁻³
2.32 × 10⁻³
8.9 × 10⁻³
2.69
13
0.41
7.66 × 10⁻³
2.23 × 10⁻³
84.74 × 10⁻³
10.76 × 10⁻³
2.62
14
0.45
1.37 × 10⁻³
4.37 × 10⁻³
134.32 × 10⁻³
8.47 × 10⁻³
3.10
15
0.37
5.09 × 10⁻³
1.97 × 10⁻³
65.82 × 10⁻³
26.64 × 10⁻³
2.37
3.7 Correlation between polyphenol and antioxidant activity
To more directly investigate the relationship between antioxidant capacity and active components of C. loureirii bark, principal component analysis (PCA) and correlation analysis methods were used in this paper.
PCA was carried out using a correlation matrix of all of the phytochemical compounds and eigenvalues and cumulative variance for factors obtained based on the phytochemical compositions obtained at the different growth ages (Fig. 3). The first component (PC1) had the most important ingredient, and its variance contribution ratio was 58.87%. The second component (PC2) has a variance contribution rate of 18.35%. This indicates that the two principal components express 77.22% of all information. Hence, the two principal components can reflect the vast majority of spectrum information. Because the contribution of PC1 was higher (58.87%), most of the measured components and the FRAP,·ABTS and ARP activities had high positive effects on PC1. From the PCA model of Fig. 3, it can be seen that the FRAP,·ABTS, ARP activities and y1, y6, TF and TP showed significantly positive correlations with PC1, and y2, y3, y5 and TF showed significantly positive correlations with PC2. This indicates that hyperoside, procyanidin B2, total phenolic, and total flavonoid should be considered the most important active components related to antioxidant effects in C. loureirii bark.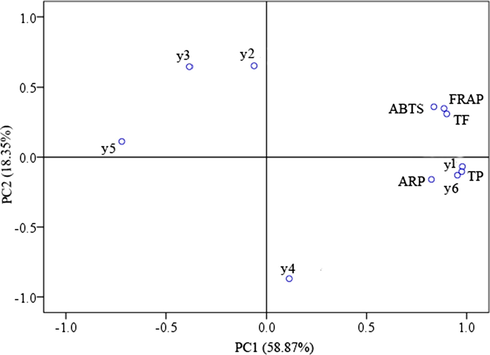
Principal component analysis loading plot of antioxidant activity and chemical compositions of phenolic acid and flavonoids from C. loureirii bark. y1, y2, y3, y4, y5, y6, TP and TF represent hyperoside, epicatechin, rutin, ellagic acid, protocatechualdehyde, procyanidin B2, total phenolic and total flavonoid, respectively.
The correlation analysis method was used to deeply compare the correlation between the individual component contents and three common antioxidant assays in C. loureirii bark. Similar to the results from the PCA (Fig. 3), the linear correlation coefficient results (Table 6) indicated that there was an apparently significant positive correlation between the changes in the hyperoside, procyanidin B2, total phenolic, total flavonoid and antioxidant activities in C. loureirii bark. For example, hyperoside, procyanidin B2, total phenolic and total flavonoid illustrated a positive significant (p < 0.05) correlation with ARP (r = 0.82, r = 0.79, r = 0.67 and r = 0.62, respectively), FRAP (r = 0.87, r = 0.83, r = 0.94 and r = 0.93, respectively) and ABTS (r = 0.84, r = 0.82, r = 0.95 and r = 0.93, respectively).
Compounds
ARP
FRAP
ABTS
Hyperoside
0.82**
0.87**
0.84**
Epicatechin
−0.20
0.06
−0.05
Rutin
0.10
−0.26
−0.36
Ellagic acid
0.33
−0.25
−0.06
Protocatechualdehyde
−0.61
−0.73**
−0.54
Procyanidins B2
0.79**
0.83**
0.82**
Total phenolic
0.67*
0.94**
0.95**
Total flavonoid
0.62
0.93**
0.93**
4 Discussion
4.1 The dynamic accumulation of chemical components in EOs and how they affect the antioxidant activities in C. loureirii bark
C. loureirii belongs to the family Lauraceae, and it is mainly grown in northern regions of Vietnam and southern China bordering Vietnam, and was introduced to southern China in the 1960s (Li et al., 2010). Although the overall flavor and chemical constituents of EOs in C. loureirii bark are similar to that of C. cassia (Chinese cassia cinnamon), the C. loureirii are the most popular in the USA (Ravindran et al., 2004). In this sutdy, we systematically studied the dynamic accumulation of the EOs and its chemical composition from the bark of 6 to 15 year old C. loureirii trees. Our results showed that the EO content of C. loureirii bark with 6–15 years of growth ranged from 1.42 to 5.48%, which met the criterion of the pharmacopoeia of the People's Republic of China with the lowest cinnamon oil content of 1.2% (China Pharmacopeia Commission, 2020), and it was apparently higher than that of C. cassia bark (5–12 years old) with 0.50–2.26% (Geng et al., 2011).
Notably, by comparing the composition of the EOs, we found that trans-cinnamaldehyde (50.2–92.9%) and α-copaene (0.5–21.3%) were the main components in EOs of C. loureirii bark (Table 1), and the difference is that the main constituent of EOs from C. cassia bark was only trans-cinnamaldehyde, and less or no α-copaene was detected (Li et al., 2013a). In particular, the contents of trans-cinnamaldehyde from 10 to 12 years (90.2–92.9%) C. loureirii bark were apparently higher than that in C. cassia EOs ranging from 33.95% to 87.23% (Geng et al., 2011; Li et al., 2013a) and were even close to that of 80–95% in the indigenous C. loureirii in Vietnam (Weiss, 2002) or higher than that (81.97%) of C. loureirii from the Guangxi Province of China (Li et al., 2013a). Therefore, we suggest that the Maoming region of Guangdong Province in China is a suitable geographic region for C. loureirii cultivation and that C. loureirii is an ideal resource for commercial cinnamon development.
EOs possess antioxidant properties and are commonly used in pharmaceutical preparations, cosmetics, food and beverages because they contain abundant amounts of various terpenes, phenolic compounds, and alcohols (Falleh et al., 2020). The changes in antioxidant activity in medicinal plants are always closely associated with the variation in the contents of their chemical components (Kong et al., 2017). Factors affecting the chemical composition of plant EOs (e.g., genetic factors, environment, growth stage and physiological factors) will influence the antioxidant properties of plants (Teixeira et al., 2013).
In this study, by analyzing the changes in antioxidant activity in essential oils of C. loureirii bark in 6- to 15-year-olds, we found that EOs in 13- to 14-year-olds of C. loureirii bark exhibited higher antioxidant activity. Antioxidant activity was positively correlated with changes in α-copaene, beta-caryophyllene, τ-muurolene, γ-muurolene and δ-cadinene of C. loureirii bark oils, and compounds belonging to monoterpenoids and sesquiterpene have been shown to possess strong antioxidant activity (Dahham et al., 2015; Pretti et al., 2018; Zheljazkov et al., 2018; Patial & Cannoo, 2020; Wu et al., 2020). Therefore, the antioxidant activity of EOs may be associated with the presence of monoterpenoids and sesquiterpenes (Ahmed et al., 2020).
Interestingly, a higher trans-cinnamaldehyde content (90.2–92.9%) was found in 10–12-year-old bark, while a higher content of α-copaene (18.1–21.3%) was observed in 13–15-year-old bark, and the antioxidant activity of C. loureirii bark EOs does not completely depend on the presence of trans-cinnamaldehyde as the most abundant compound since some minor compounds (such as α-copaene, beta-caryophyllene, etc.) are likely to play a significant role in antioxidant activity. The synergistic effect of different phytoconstituents present in the EOs of C. loureirii may be the source of its antioxidant potential. A previous report indicated that trans-cinnamaldehyde exhibited weaker activity in C. zeylanicum, whereas the trans-cinnamaldehyde and (E)-cinnamyl acetate ratio changed from 9:1 to 1:9, and an increase in antioxidant activity was observed by FRAP tests (Tepe & Ozaslan, 2020). This means that there may be some other components that may contribute to the antioxidant activity of the oil other than the main components.
By DPPH, FRAP and ABTS assays, 9–15-year-old C. loureirii bark can be regarded as an abundant source of EOs with good antioxidant activity. Thereinto, the barks at 10–12 years old may be chosen as the raw material used to extract C. loureirii bark oils with high trans-cinnamaldehyde content, and bark at 13 and 14 years old may be chosen to develop antioxidant products with high quality.
4.2 The dynamic accumulation of phenolic acids and flavonoids and how they affect the antioxidant activities in C. loureirii bark
Polyphenols, which are frequently found in vegetables, fruits, and grains, play an important role in the removal of toxic reactive compounds (Kandi & Charles, 2018; Sridhar & Charles, 2019). The plant contains numerous antioxidant compounds, such as phenolic acids, flavonoids and proanthocyanidins (Moghaddam et al., 2015; Lin et al., 2016; Vidal-Gutiérreza et al., 2020; Bai et al., 2020). The present study revealed that C. loureirii ethanolic extracts contained abundant phenolics and flavonoids and expressed high antioxidant activity. In particular, the antioxidant capacities of ethanol extract from the different growth age bark showed a significant relationship with TPC and TFC in C. loureirii. The highest antioxidant activity of C. loureirii extracts from 13- and 14-year-old plants might be attributed to the high total phenol compounds and total flavonoids at these two growth ages (Table 4). This result is consistent with previous studies indicating that phenolic compounds contribute significantly to the antioxidant capacities of C. cassia (Yang et al., 2012).
PCA and correlation analysis further indicated that procyanidin B2 and hyperoside were the main contributors to the antioxidant activities during C. loureirii bark growth (Fig. 3 and Table 6). Lin et al. (2016) reported that C. osmophloeum twig extracts extracted from 70% acetone had good antioxidant activities, and the active compounds were proanthocyanidin and condensed tannin. Kong et al. (2017) also reported that stronger antioxidant capacities are closely associated with a higher accumulation of chlorogenic acid, hyperoside, and luteoloside in Lonicera japonica. Our results further suggested that hyperoside and procyanidin B2 were the main contributors to the antioxidant activities of C. loureirii. Taken together, we concluded that the crude ethanol extract of C. loureirii barks as well as the isolated compounds can be used as high-quality raw materials for natural antioxidants and in pharmaceutical applications.
5 Conclusion
In conclusion, our results revealed that the yield and composition of the EO, phenolic acids and flavonoids in cinnamon bark varied depending on the age of the trees. The EO yields reached a maximum content in 12- to 15-year-old bark, and higher contents of trans-cinnamaldehyde were obtained in 10- to 12-year-old bark. Therefore, the bark of C. loureirii at 10–12 years should be chosen as the raw material for the production of cinnamon oils or cinnamaldehyde of high quality. Based on the highest antioxidant activity occurring in 13–14-year-old bark, which contained the highest content of EOs, total phenolics and flavonoids, 13–14 years is recommended as the optimal harvesting period for high-yield, high-quality natural antioxidants from C. loureirii bark. In the future, the antioxidant activity of the main components of EOs, phenolic acids and flavonoids will require comprehensive and standardized techniques and analyses for evaluation.
Acknowledgement
This study was supported by the Science and Technology Innovation Fund Project on Forestry of Guangdong Province, China (2017KJ-CX006), the Natural Science Foundation of Guangdong Province, China (2019A1515011005), and the GuangDong Basic and Applied Basic Research Foundation, China (2020B1515420007).
Declaration of competing interest
The authors declare that they have no known competing financial interests or personal relationships that could have appeared to influence the work reported in this paper.
References
- Chemical composition and antioxidant properties of the essential oil of Cinnamomum altissimum Kosterm. (Lauraceae) Arab. J. Chem.. 2017;10:131-135.
- [Google Scholar]
- Identification of Essential Oil Components by Gas Chromatography/Mass Spectrometry. Carol Stream, IL: Allured Publishing Corporation; 2007.
- Essential oil of Bassia muricata: chemical characterization, antioxidant activity, and allelopathic effect on the weed Chenopodium murale. Saudi J. Biol. Sci.. 2020;27:1900-1906.
- [Google Scholar]
- Determination of carnosic acid and rosmarinic acid in sage by capillary electrophoresis. Food Chem.. 2007;101:1748-1752.
- [Google Scholar]
- China Pharmacopeia Commission, Pharmacopoeia of the People’s Republic of China 2020, vol. 1. Chinese Medical Science and Technology Press, Beijing, China, pp. 142.
- The anticancer, antioxidant and antimicrobial properties of the sesquiterpene β-caryophyllene from the essential oil of Aquilaria crassna. Molecules. 2015;20:11808-11829.
- [Google Scholar]
- Evaluation of antibacterial and antioxidant effects of cinnamon and clove essential oils from Madagascar. Mater. Today: Proc.. 2019;13:762-770.
- [Google Scholar]
- Essential oils: a promising eco-friendly food preservative. Food Chem.. 2020;330:127268
- [Google Scholar]
- Transcriptomics and metabolomics analyses reveal the differential accumulation of phenylpropanoids between Cinnamomum cassia Presl and Cinnamomum cassia Presl var. macrophyllum Chu. Ind. Crop. Prod.. 2020;148:112282
- [Google Scholar]
- Variations in essential oil yield and composition during Cinnamomum cassia bark growth. Ind. Crop. Prod.. 2011;33:248-252.
- [Google Scholar]
- Seasonal variation in the chemical composition of two chemotypes of Lippia alba. Food Chem.. 2019;273:186-193.
- [Google Scholar]
- Effect of Cinnamomum zeylanicum extract on scopolamine-induced cognitive impairment and oxidative stress in rats. Nutr. Neurosci.. 2014;18:210-216.
- [Google Scholar]
- Hydrogen peroxide oxidization method for the determination of cinnamaldehyde in cassia by microextraction. Chin. Condiments.. 2007;9:65-67.
- [Google Scholar]
- Measurement, correlation, and thermodynamic properties for solubilities of bioactive compound (−)-epicatechin in different pure solvents at 298.15 K to 338.15 K. J. Mol. Liq.. 2018;264:269-274.
- [Google Scholar]
- A comparative study of the dynamic accumulation of polyphenol components and the changes in their antioxidant activities in diploid and tetraploid Lonicera japonica. Plant Physiol. Bioch.. 2017;112:87-96.
- [Google Scholar]
- Study on extraction technology and antioxidant property of total flavonoids from cinnamon. Appl. Chem. Ind.. 2011;40:1547-1552.
- [Google Scholar]
- Anti-inflammatory effect of cinnamaldehyde and linalool from the leaf essential oil of Cinnamomun osmophloeum Kanehira in endotoxin-induced mice. J. Food Drug Anal.. 2018;26:211-220.
- [Google Scholar]
- Phenoliccompounds: antioxidant activity and ultrastructural study from Protea hybrid‘Susara’. Ind. Crop. Prod.. 2014;55:230-237.
- [Google Scholar]
- Chemical composition of the essential oils of Cinnamomum loureirii Nees. from China obtained by hydrodistillation and microwave-assisted hydrodistillation. J. Essent. Oil Res.. 2010;22:129-131.
- [Google Scholar]
- The effect of developmental and environmental factors on secondary metabolites in medicinal plants. Plant Physiol. Bioch.. 2020;148:80-89.
- [Google Scholar]
- Variations in essential oil yields and compositions of Cinnamomum cassia leaves at different developmental stages. Ind. Crop. Prod.. 2013;47:92-101.
- [Google Scholar]
- Quality evaluation for essential oil of Cinnamomum verum leaves at different growth stages based on GC–MS, FTIR and microscopy. Food Anal. Methods. 2016;9:202-212.
- [Google Scholar]
- Analysis and evaluation of essential oil components of cinnamon barks using GC–MS and FTIR spectroscopy. Ind. Crop. Prod.. 2013;41:269-278.
- [Google Scholar]
- Antihyperglycemic and antioxidant activities of twig extract from Cinnamomum osmophloeum. J. Tradit. Complement. Med.. 2016;6:281-288.
- [Google Scholar]
- Major chemotypes and antioxidative activity of the leaf essential oils of Cinnamomum osmophloeum Kaneh. from a clonal orchard. Food Chem.. 2007;105:133-139.
- [Google Scholar]
- Antioxidant study and electroanalytical investigation of selected herbal samples used in folk medicine. Int. J. Electrochem. Sc.. 2019;14:838-847.
- [Google Scholar]
- Variation in essential oil composition and antioxidant activity of cumin (Cuminum cyminum L.) fruits during stages of maturity. Ind. Crop. Prod.. 2015;70:163-169.
- [Google Scholar]
- Evaluation of volatile compounds, phenolic acids, antioxidant potential and DFT study of essential oils from different parts of Araucaria columnaris (G. Forst.) Hook. from India. Food Chem. Toxicol.. 2020;141:111376
- [Google Scholar]
- Transcriptional regulation of secondary metabolite biosynthesis in plants. BBA Gene Regul. Mech.. 2013;1829:1236-1247.
- [Google Scholar]
- Variation of biochemical and antioxidant activity with respect to the phenological stage of Tithonia diversifolia Hemsl. (Asteraceae) populations. Ind. Crop. Prod.. 2018;121:241-249.
- [Google Scholar]
- Cinnamon and Cassia (The Genus Cinnamomum). Boca Raton, USA: CRC Press; 2004. p. :1-379.
- Evaluation of antioxidant activity, total phenols and phenolic compounds in thyme (Thymus vulgaris L.), sage (Salvia officinalis L.), and marjoram (Origanum majorana L.) extracts. Ind. Crop Prod.. 2013;43:827-831.
- [Google Scholar]
- Centauries as underestimated food additives: antioxidant and antimicrobial potential. Food Chem.. 2014;147:367-376.
- [Google Scholar]
- In vitro antioxidant activity of Kyoho grape extracts in DPPH and ABTS assays: estimation methods for EC50 using advanced statistical programs. Food Chem.. 2019;275:41-49.
- [Google Scholar]
- Chemical composition and antibacterial and antioxidant properties of commercial essential oils. Ind. Crop. Prod.. 2013;43:587-595.
- [Google Scholar]
- Anti-Alzheimer, anti-diabetic, skin-whitening, and antioxidant activities of the essential oil of Cinnamomum zeylanicum. Ind. Crop. Prod.. 2020;145:112069
- [Google Scholar]
- Phenolic composition and antioxidant activity of Bursera microphylla A. Gray. Ind. Crop. Prod.. 2020;152:112412
- [Google Scholar]
- Ariation in bioactive compounds and antiradical activity of Moringa oleifera leaves: influence of climatic factors, tree age, and soil parameters. Eur. Food Res. Echnol.. 2017;243:1593-1608.
- [Google Scholar]
- The study on essential oil components and comparison of identification in Chinese cassia and Cinnamomum cassia var. macrophyllum Chu. Chin. Arch. Tradit. Chin. Med.. 2011;29:1401-1402.
- [Google Scholar]
- Antibacterial effects of cinnamon (Cinnamomum zeylanicum) bark essential oil on Porphyromonas gingivalis. Microb. Pathogenesis. 2018;116:26-32.
- [Google Scholar]
- Spice Crops. London, UK: CABI Publishing; 2002. p. :55-56.
- Terpenoids and their biological activities from Cinnamomum: a review. J. Chem.-NY.. 2020;1:1-14.
- [Google Scholar]
- Antioxidant activity of various parts of Cinnamomum cassia extracted with different extraction methods. Molecules. 2012;17:7294-7304.
- [Google Scholar]
- Essential oil composition, antioxidant and antimicrobial activity of the galbuli of six juniper species. Ind. Crop. Prod.. 2018;124:449-458.
- [Google Scholar]


