

Translate this page into:
Ti3+ self-doped rutile/anatase/TiO2(B) mixed-crystal tri-phase heterojunctions as effective visible-light-driven photocatalysts
⁎Corresponding authors. xingzipeng@hlju.edu.cn (Zipeng Xing), hdzhuqi@hlju.edu.cn (Qi Zhu), zhouwei1@hlju.edu.cn (Wei Zhou)
-
Received: ,
Accepted: ,
This article was originally published by Elsevier and was migrated to Scientific Scholar after the change of Publisher.
Peer review under responsibility of King Saud University.
Abstract
Ti3+ self-doped rutile/anatase/TiO2(B) mixed-crystal tri-phase heterojunctions photocatalysts are fabricated via hydrothermal approach and mechanochemical process, followed by in-situ solid-state chemical reduction approach. The as-prepared samples are characterized by X-ray diffraction, Raman, scanning electron microscopy, transmission electron microscopy, X-ray photoelectron spectroscopy, and UV–vis diffuse reflectance spectroscopy. The photocatalysts are consisted by anatase/rutile TiO2 nanoparticles and 1D TiO2(B) single-crystalline nanorods, which form rutile/anatase/TiO2(B) tri-phase heterojunctions. The visible-light-driven photocatalytic degradation rates of methyl orange and phenol are up to ∼98 and 97%, which are 2.2 and 1.8 times higher than that of commercial Degussa P25, 2.3 and 2.2 times higher than that of pure TiO2(B) as well. The enhancement can be attributed to the synergistic effect of special nanostructure, tri-phase heterojunctions, oxygen vacancy and Ti3+ self-doping, which facilitates the absorption of visible light and the spatial separation of photo-generated charge carriers. This work provides a new perspective for designing high-active visible-light-driven photocatalyst in future.
Keywords
TiO2
Visible-light-driven photocatalysis
Tri-phase heterojunction
Ti3+ self-doped
Pollutants degradation

1 Introduction
The overuse of fossil fuels has led to more disturbing trends: global warming and the increasing deterioration of the environment, which are closely related to human society (Zhang et al., 2016; Sambur et al., 2016; Liu et al., 2017). In recent years, it is critical to search for a variety of ways to degrade pollutants. Photocatalysts can be the answer to this calamity that is staring mankind in the face (Guo et al., 2016; Wang et al., 2016; Li et al., 2016). On exposure to sunlight, photocatalysts can absorb solar energy to produce electrons and holes, the reduction reaction occurs near the conduction band, and the oxidation reaction occurs at the valence band position. The generation of •OH species, combined with •O2−, have strong oxidation capacity and can totally mineralize the organic pollutant to H2O and CO2, which can provide a new way to solve the water pollution so that it can contribute to long-term human well-being (Zhou et al., 2014; Hussain et al., 2017). In recent years, quite a few kinds of semiconductor photocatalysts have been generally investigated, such as TiO2 (Liu et al., 2015), ZnO (Hewlett and McLachlan, 2016), CdS (Liyanage and Nath, 2016), and WO3 (Kulal et al., 2016). Among the various photocatalysts, TiO2 nanomaterials as promising semiconductor photocatalysts have attracted massive research interests since 1972. It was found by Fujishima and Honda that water could be split by irradiation on TiO2 electrode (Zhang et al., 2016). With the advantages of low-cost, nontoxicity, high physical and chemical stability and the superior photocatalytic activity (Xing et al., 2014), TiO2 has also been widely applied in pollutant degradation, dye-sensitized solar cells (Pan et al., 2015), photoelectrochemical electrodes (Li et al., 2015) and other photocatalytic applications (Xing et al., 2014; Eskandarloo et al., 2015; Eskandarloo et al., 2018).
Generally, TiO2 materials have four phases including anatase (Eskandarloo et al., 2015), rutile (Su et al., 2015), brookite (Li et al., 2015), and TiO2 (B) (Zhang et al., 2015; Su et al., 2016). However, these ploymorphs have wide band gap and the fast recombination of photo-induced electrons and holes. These shortages limit the application in visible light region and photo-induced redox reaction. Hence, it is imperative to seek effective methods to solve these problems. A variety of methods have been brought up to overcome these disadvantages such as non-metal and metal elements doping, heterojunction fabrication, and surface sensitization (Li et al., 2013; Liu et al., 2016; Li and Zhao, 2013; Yao et al., 2017). Among these methods, fabrication of TiO2 phase-junctions is an effective one to reduce the recombination of photo-generated electron-hole pairs (Lin and Wang, 2016). Meanwhile, the synthesis of the mixed phase TiO2 is simple. It has been reported that anatase and rutile phase-junctions of TiO2 with the formation of built-in field can promote charge separation effectively so that exhibit the higher photocatalytic efficiency than that of pure anatase or rutile (Li et al., 2016). A variety of mixed-phases such as anatase-rutile, anatase-brookite, rutile-brookite and anatase-TiO2(B) dual phase TiO2 (Yan et al., 2015; Gao et al., 2017; Chimupala et al., 2016; El-Sheikh et al., 2017) that exhibit notable photocatalytic and photoelectrochemical performances have also been reported. All exhibited improved photocatalytic performance. The morphology of TiO2 crystal plays a critical role in influencing the photocatalytic and photoelectrochemical performance. Although TiO2 nanoparticle has outstanding performance in photocatalysis, the slow charge carrier transfer and the high-cost for recycling limit its application. The preparation of 2D TiO2 nanoparticle is comparably complex. With good chemical stability, 1D nanomaterials in rod-, wire- or fiber-shape can be used as ideal building blocks for assembling various surface heterostructures (Ge et al., 2016). Especially that nanorod can provide a vectorial electrons transfer path for the rapid transfer of electrons (He et al., 2016; Yang et al., 2015; Tian et al., 2014). In particular, 3D nanomaterials can not only supply more accessible active sites in the process of the reaction, but also facilitate the contact between catalysts and reactants (Wang et al., 2016).
As for TiO2, owing to the intrinsic character of wide band gap, only 5% solar energy can be utilized. Therefore, it’s necessary to expend the absorption of visible light. Since Mao et al. prepared a Ti3+ self-doped TiO2 using the high pressure hydrogenation method (Chen et al., 2011). The as-prepared black TiO2 effectively narrowed the band gap and inhibited the fast recombination of electron and hole pairs that exhibited outstanding photocatalytic performance under the visible light illumination. From then on, much effort has been devoted to synthesize Ti3+ self-doped TiO2 due to its optical absorption shift from ultraviolet to visible light and/or near-infrared region (Hu et al., 2016). Various methods have been used to synthesize black or gray TiO2, including high pressure, high Al vapor reduction plasma assisted hydrogenation, laser treatment, hydrogenation, and chemical reduction (Mehta et al., 2016; Zhang et al., 2015). Among these methods, high pressure and hydrogenation are unsuitable for practical application. It has been noticed that in situ reduction treatment by using NaBH4 is an effective route to synthesize Ti3+ self-doped TiO2, owing to the advantages of simple process and low-cost.
In this paper, Ti3+ self-doped rutile/anatase/TiO2(B) mixed-crystal tri-phase heterojunction photocatalyst was successfully synthesized by a mild hydrothermal, a facile mechanochemistry method and followed by an in situ controllable solid-state reaction approach. The prepared photocatalysts with a narrow band gap and tri-phase heterojunctions, extended the photo-response to visible-light region and reduced the recombination of photo-generated electron and hole pairs effectively. The activity of photocatalyst property of the sample has been detected through the removal of methyl orange dye and phenol under visible-light irradiation. Furthermore, the photoelectrochemical property and photocatalytic mechanism were also investigated.
2 Experimental section
2.1 Materials
Tetrabutyl titanate (TBOT), sodium hydroxide (NaOH), hydrogen nitrate (HNO3), hydrochloric acid (HCl), and phenol were purchased from Tianjin Kermel Chemical Reagent Co. Ltd, China. P25 power was purchased from Degussa Co. Ltd, Germany. Sodium boron hydride (NaBH4, 98%) and methyl orange (MO) were purchased from Aladdin Reagent Company, China. Absolute ethanol (EtOH) was purchased from Tianli Chemical Reagent Co. Ltd, China. All the chemicals used in this study were analytical grade and employed without further purification. Deionized water (DI) was used over the whole experiment.
2.2 Synthesis of TiO2(B) nanorods
The synthesis process was divided into two steps. First, titanium dioxide powder was synthesis via sol-gel method. Specifically, 8 mL TBOT, as the titanium source, was dissolved in anhydrous alcohol which was marked solution A. Meanwhile, another aqueous mixture of 5 mL DI water, 4 mL HNO3, and 6 mL anhydrous alcohol were combined under magnetic stirring as solution B. While still stirring, solution B was slowly added into solution A at room temperature to promote the hydrolysis. After magnetic stirring for 4 h, the mixture was dried at 60 °C for 24 h. In the second step, 2 g as-prepared titanium dioxide power was added into 40 mL NaOH (5 mol L−1) solution. After ultrasonically for 5 min, the mixture was transferred into a 100 mL Teflon-lined stainless steel autoclave and heated 180 °C for 26 h. The obtained white powders were washed with 0.1 M HCl and DI water 3 times, respectively, dried at 60 °C for 12 h. Finally, TiO2(B) nanorods, was obtained after annealed at 500 °C for 2 h under Ar atmosphere.
2.3 Synthesis of Ti3+ self-doped mixed-crystal tri-phases heterojunctions
0.4 g of P25 power and 0.2 g TiO2(B) were mixed with 5 mL anhydrous alcohol in an agate jar with several agate balls. The mixtures were ball-milled using a ND7-0.4 planetary ball mill at a speed of 200 rpm for 4 h. After evaporation of ethanol for 12 h at 60 °C, mixed-phases nanorods were obtained, which was dented as PTB. Subsequently, 0.2 g PTB sample was mixed with 0.1 g NaBH4, then transferred into porcelain boats and placed in a tubular furnace to calcined at 400 °C for 60 min under Ar atmosphere. Finally, the gray Ti3+ self-doped mixed-crystal tri-phases heterojunction, which was dented as G-PTB were obtained after washed with deionized water three times to remove unreacted NaBH4 (Fig. 1).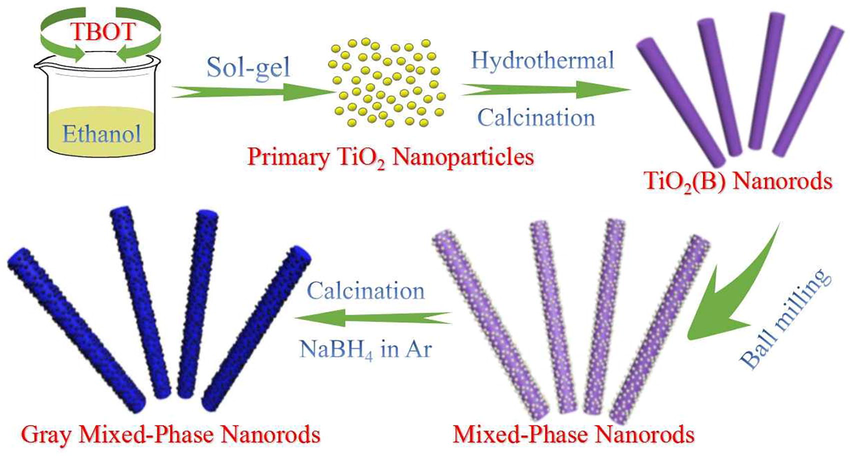
The formation procedure of gray Ti3+ self-doped rutile/anatase/TiO2(B) mixed-crystal tri-phase heterojunction photocatalyst.
2.4 Characterization
Powder X-ray diffraction (XRD) data for the samples were recorded with a Bruker D8 Advance using a Cu Kɑ radiation source (40 kV, 44 mA) to reveal the crystal phase compositions of the samples. Raman measurements were recorded by using a Jobin Yvon HR 800 micro-Raman spectrometer in the range of 100–1000 cm−1 at 457.9 nm. The morphology was studied by a scanning electron microscope (SEM, Hitachi S-4800), transmission electron microscope (TEM, JEOL JEM-2010). X-ray photoelectron spectroscopy (XPS) was conducted on a PHI-5700 ESCA instrument with Al Kɑ X-ray source. The surface area was recorded by using the BET method with an AUTO-SORB-1 (Quantachrome Instruments) nitrogen adsorption apparatus. The UV–vis diffuse reflectance spectra of the samples were performed on a TU-1901 spectrophotometer, in which BaSO4 was employed as the background. Scanning Kelvin probe microscopy (SKPM) measurements were determined using a SKP5050 system. A Au electrode was used as a reference electrode, and the working electrode was prepared by traditional spray coating method on transparent conducting glass (FTO).
2.5 Photocatalytic activity measurement
The photocatalytic activities of the four samples were studied by the degradation of phenol and methyl orange (MO) dye, that carried out in an aqueous solution at room temperature under using a 300 W Xenon lamp with a 420 nm cut-off filter as visible light source. Detection of phenol and MO were used UV–vis spectrophotometry. In a typical experiment, 40 mg of photocatalyst powders was dispersed in 30 mL organic solution (phenol: 10 mg L−1 and MO: 10 mg L−1) which was placed 20 cm from the light source. Before light irradiation, the suspension was stirred for 30 min in the dark to reach adsorption-desorption equilibrium. At given time intervals, the reaction solution was immediately centrifuged and filtered. The absorbance of the centrifuged liquid samples was investigated using a Shimadzu Model UV 2550 spectrophotometer at given wavelength to calculate the photocatalytic degradation rate of organic contaminants.
2.6 Photoelectrochemical tests
Photoelectrochemical tests were record by an electrochemical workstation (CHI760E, Shanghai), employed a standard three-electrode cell with the different sample films as the working electrode, the counter electrode (Pt sheet) and the reference electrode (Ag/AgCl). An aqueous solution of KOH (1 M) water solution was used as the electrolyte, which was irradiated by an AM 1.5 solar power system. The working electrode was measurement on fluorine-doped tin oxide (FTO) glass that was cleaned by sonication with deionized water, acetone, and ethanol in turn with each process for 20 min and dried. The suspension which contained 5 mg of sample and 1 mL of alcohol was spread onto cleaned FTO glasses, and then calcined at 200 °C for 2 h in Ar atmosphere to improve adhesion.
3 Results and discussion
3.1 Structure and morphology
Different crystal structures and crystalline phases have great influence on the properties of the photocatalysts, which may further affect their photocatalytic and photoelectrochemical performance in practical application. The XRD measurement is carried out to detect the crystal phase of P25, TiO2(B), PTB, and G-PTB. As shown in Fig. 2a, it is noteworthy that P25 has ten distinct characteristic peaks. The characteristic peaks are observed at 25.3, 37.8, 48.1, 54.1, 55.1, 62.7, and 68.7° are attributed to the (1 0 1), (0 0 4), (2 0 0), (1 0 5), (2 1 1), (2 0 4), and (1 0 6) lattice planes of anatase TiO2, respectively. The other three characteristic peaks at 27.5, 36.1, and 41.3°, are ascribed to (1 1 0), (1 0 1), and (1 1 1) lattice planes of rutile TiO2, respectively (Duan et al., 2016). Moreover, the XRD patterns marked with several red diffraction peaks at 14.2, 24.9, 28.6, 33.4, 43.6, and 58.2° can be ascribed to (0 0 1), (1 1 0), (0 0 2), (4 0 1), (0 0 3), and (0 2 2) lattice plane of TiO2(B) phase (JCPDS74-1940), respectively. XRD patterns of TiO2(B) nonorods samples calcined at 400, 500, 600, 700 °C are shown in Fig. S1a, it shows that TiO2(B) is transformed into anatase with the increase of calcination temperature. When the calcination temperature is 500 °C, the crystallinity of TiO2(B) is the highest. After adjustment for the baseline (Fig. S1b), the molar ratio of TiO2(B) to anatase phase can be estimated from the intensity ratio of the peak at 33.4 to that at 37.8°. The molar ratio of anatase is 23%. The patterns of PTB and G-PTB samples are very similar, from which typical peaks represent for anatase TiO2, rutile TiO2, and TiO2(B) phases can be observed. No other diffraction peaks can be found from the patterns that indicate the successful synthesis of mixed-phase photocatalyst without detectable structural changes through ball milling process. It is noteworthy that in comparison with PTB sample, the intensity of all the diffraction peaks in G-PTB sample is decreased. This slight change can be assigned to the formation of Ti3+ and oxygen vacancies (Tan et al., 2014), which may lead to disorder-elicited lattice strains after the treatment by NaBH4 reduction.

Typical XRD patterns (a) and Raman spectra (b) of P25, TiO2(B), PTB, and GPTB, respectively. The inset of (b) is the magnified spectra between 100 and 200 cm−1.
Supplementary data associated with this article can be found, in the online version, at https://doi.org/10.1016/j.arabjc.2018.06.010.
Different crystal structures and crystalline phases have great influence on the properties of the photocatalysts, which may further affect their photocatalytic and photoelectrochemical performance in practical application. The XRD measurement is carried out to detect the crystal phase of P25, TiO2(B), PTB, and G-PTB. As shown in Fig. 2a, it is noteworthy that P25 has ten distinct characteristic peaks. The characteristic peaks are observed at 25.3, 37.8, 48.1, 54.1, 55.1, 62.7, and 68.7° are attributed to the (1 0 1), (0 0 4), (2 0 0), (1 0 5), (2 1 1), (2 0 4), and (1 0 6) lattice planes of anatase TiO2, respectively. The other three characteristic peaks at 27.5, 36.1, and 41.3°, are ascribed to (1 1 0), (1 0 1), and (1 1 1) lattice planes of rutile TiO2, respectively (Duan et al., 2016). Moreover, the XRD patterns marked with several red diffraction peaks at 14.2, 24.9, 28.6, 33.4, 43.6, and 58.2° can be ascribed to (0 0 1), (1 1 0), (0 0 2), (4 0 1), (0 0 3), and (0 2 2) lattice plane of TiO2(B) phase (JCPDS74-1940), respectively. XRD patterns of TiO2(B) nonorods samples calcined at 400, 500, 600, 700 °C are shown in Fig. S1a, it shows that TiO2(B) is transformed into anatase with the increase of calcination temperature. When the calcination temperature is 500 °C, the crystallinity of TiO2(B) is the highest. After adjustment for the baseline (Fig. S1b), the molar ratio of TiO2(B) to anatase phase can be estimated from the intensity ratio of the peak at 33.4 to that at 37.8°. The molar ratio of anatase is 23%. The patterns of PTB and G-PTB samples are very similar, from which typical peaks represent for anatase TiO2, rutile TiO2, and TiO2(B) phases can be observed. No other diffraction peaks can be found from the patterns that indicate the successful synthesis of mixed-phase photocatalyst without detectable structural changes through ball milling process. It is noteworthy that in comparison with PTB sample, the intensity of all the diffraction peaks in G-PTB sample is decreased. This slight change can be assigned to the formation of Ti3+ and oxygen vacancies (Tan et al., 2014), which may lead to disorder-elicited lattice strains after the treatment by NaBH4 reduction.
Supplementary material
Supplementary materialRaman spectroscopy is conducted to analyze the structure of the as-prepared photocatalysts. The Raman spectra of P25, TiO2(B), PTB, and G-PTB are shown in Fig. 2b. The Raman spectra of P25 shows five characteristic Raman peaks at 142, 196, 394, 514, and 636 cm−1, which are ascribed to Eg, Eg, B1g, A1g + B1g, and Eg Raman-active modes of anatase TiO2 (Wang et al., 2014), respectively. However, no peaks ascribed to rutile TiO2 at 446 and 610 cm−1 can be found, which can be attributed to the strong intensity of anatase peaks. For TiO2(B) sample, several characteristic Raman peaks at around 142, 194, 293, 362, 405, 468, and 633 cm−1 can be found (Tian et al., 2015). In terms of PTB and G-PTB, both Raman-active modes of P25 and TiO2(B) can be observed clearly. However, in comparison with PTB, the intensity of G-PTB characteristic peaks not only decrease and broaden, but also show a slight blue shift, which can be observed distinctly in the inset of Fig. 2b. It can be related to distortion of the crystallographic symmetry and reduction of the crystal size (Zhang et al., 2017; Alexaki et al., 2009) after treatment with NaBH4, which is consistent with XRD results.
In order to elucidate chemical valence state and surface component, X-ray photoelectron spectroscopy (XPS) was performed to detect chemical composition and bonding configuration of G-PTB sample. The high-resolution XPS spectrum of O 1s in the G-PTB sample is shown in Fig. 3a, the binding energy peaks appear at 529.54 eV with a shoulder peak at 531.89 eV. It can be divided into three single-peaks corresponding to the O lattice of TiO2 (529.54 eV), —OH (531.89 eV) bonds, and the O-atoms in the vicinity of oxygen vacancies (530.35 eV) (Fang et al., 2014). As shown in the Fig. 3b, the peaks located at 464.4, 463.3, 458.6, and 457.6 eV are assigned to Ti4+ 2p1/2, Ti3+ 2p1/2, Ti4+ 2p3/2, and Ti3+ 2p3/2, respectively (Li et al., 2015). It can be seen from Fig. S2 that the XPS spectra of O 1s and Ti 2p of G-PTB after being treated with NaBH4 are wider than those of PTB. The existence of Ti3+ species is attributed to the reduction of Ti4+ from GPTB sample by the treatment of NaBH4. According to XPS spectra, both Ti3+ and oxygen vacancies are formed in G-PTB sample, which can effectively narrow the band gap and inhibit the recombination of photoinduced electron-hole pairs.
O 1s (a) and Ti 2p (b) XPS spectra of G-PTB.
In order to elucidate chemical valence state and surface component, X-ray photoelectron spectroscopy (XPS) was performed to detect chemical composition and bonding configuration of G-PTB sample. The high-resolution XPS spectrum of O 1s in the G-PTB sample is shown in Fig. 3a, the binding energy peaks appear at 529.54 eV with a shoulder peak at 531.89 eV. It can be divided into three single-peaks corresponding to the O lattice of TiO2 (529.54 eV), —OH (531.89 eV) bonds, and the O-atoms in the vicinity of oxygen vacancies (530.35 eV) (Fang et al., 2014). As shown in the Fig. 3b, the peaks located at 464.4, 463.3, 458.6, and 457.6 eV are assigned to Ti4+ 2p1/2, Ti3+ 2p1/2, Ti4+ 2p3/2, and Ti3+ 2p3/2, respectively (Li et al., 2015). It can be seen from Fig. S2 that the XPS spectra of O 1s and Ti 2p of G-PTB after being treated with NaBH4 are wider than those of PTB. The existence of Ti3+ species is attributed to the reduction of Ti4+ from GPTB sample by the treatment of NaBH4. According to XPS spectra, both Ti3+ and oxygen vacancies are formed in G-PTB sample, which can effectively narrow the band gap and inhibit the recombination of photoinduced electron-hole pairs.
The morphology and microstructure are explored by the typical scanning electron microscopy (SEM) and transmission electron microscopy (TEM). The predominant length and width of TiO2(B) nanorods are about 0.5–2.5 µm and 50–350 nm with smooth and clean crystalline surface, as observed in Fig. 4a. As shown in Fig. 4b, P25 nanoparticles are dispersed and covered the surface of the TiO2(B) nanorods, which proves the mixed-phase nanorods have been successful preparation through a mechanochemical process by using balling mill. Furthermore, from Fig. 4c, it is clearly displayed that Ti3+ doping did not lead to the degradation of structure. The same conclusion can be obtained from the insets of Fig. 4d and e. The top-view high resolution transmission electron microscopy (HRTEM) image of the designed square parts in the Fig. 4d and e show that both PTB and G-PTB have three phases lattice fringes, which reveal a well-defined crystal structure. The average d-spacing values of 0.62 and 0.36 nm are correspond to the (0 0 1) and (1 1 0) planes of TiO2(B). The lattice spacing of 0.35, 0.234, and 0.325 nm are correspond to the (1 0 1), (0 0 4) crystal plane of anatase TiO2 and the (1 1 0) crystal plane of rutile TiO2, respectively. Notably, some cross lattice fringes which marked by red lines in Fig. 4d and purple lines in Fig. 4e can be clearly observed, indicating that heterojunctions are successfully formed between anatase TiO2, rutile TiO2, and TiO2(B). The heterojunctions play an important role in the enhancement of photocatalytic performance and the separation of photo-generated electron-hole pairs during the photocatalytic degradation of pollutants. The selected-area electron diffraction (SAED) pattern of G-PTB is shown in Fig. 4f, which displays a well-developed single-crystalline structure.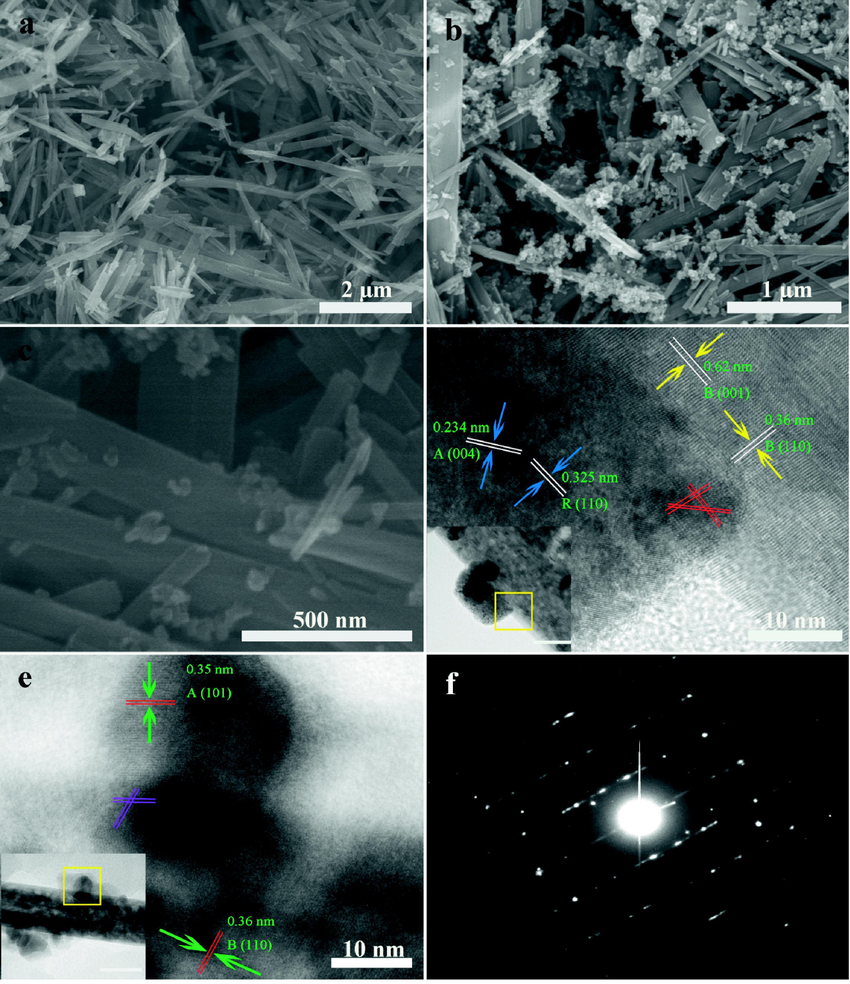
SEM images of TiO2(B) (a), PTB (b), and G-PTB (c). HRTEM images of PTB (d) and G-PTB (e). The insets of (d) and (e) are the corresponding TEM image. SAED pattern (f) of G-PTB.
The nitrogen adsorption-desorption isotherms and Barrett-Joyner-Halenda (BJH) pore-size distribution plots of P25, TiO2(B), PTB, and G-PTB are detected to further study their microstructures. As shown in Fig. 5a, the Brunauer-Emmett-Teller (BET) specific surface areas of P25, TiO2(B), PTB, and G-PTB are 57, 36, 43, and 47 m2 g−1, respectively. Obvious, the specific surface area of PTB and G-PTB samples increase slightly compared with that of TiO2(B), but decreases relative to P25, which is in consistent with SEM results. The pore-size distribution plots of P25, TiO2(B), PTB, and G-PTB are calculated by BJH method which are shown in Fig. 5b. From the BET specific surface areas and the pore-size distribution plots of the G-PTB sample, the composites are successfully formed.
N2 adsorption-desorption isotherm curves (a) and the corresponding BJH pore-size distribution plots (b) of P25, TiO2(B), PTB, and G-PTB, respectively.
3.2 Photocatalytic and photoelectrochemical properties
The photocatalytic performance is primarily determined by the optical absorption property. As shown in Fig. 6, UV–vis diffuse reflectance spectra are performed to investigate the optical properties and the band gaps. All the samples show a significant absorption band in the ultraviolet range due to the wide band gap. In comparison with P25 and TiO2(B), PTB sample exhibits the enhanced absorption in the UV light region, which can be attributed to the synergistic effect between anatase, rutile and TiO2(B). G-PTB sample exhibits the strong absorption towards visible light and even extends to the near-infrared region, which can be attributed to the generation of Ti3+ and oxygen vacancies (Kong et al., 2015). From the photographic image of PTB and G-PTB (inset of Fig. 6a), the color of PTB sample is white, but the G-PTB sample is gray. The indirect band gap values of the samples can be calculated from Fig. 6b. From the inset of Fig. 6b, the band gaps of P25, TiO2(B), and PTB are 3.07, 3.09, and 3.04, respectively. Meanwhile, it can be clearly observed that the band gap of G-PTB sample is the narrowest (about 2.75 eV), which confirms that G-PTB with narrower band gap is more active than that of the white one in visible light region.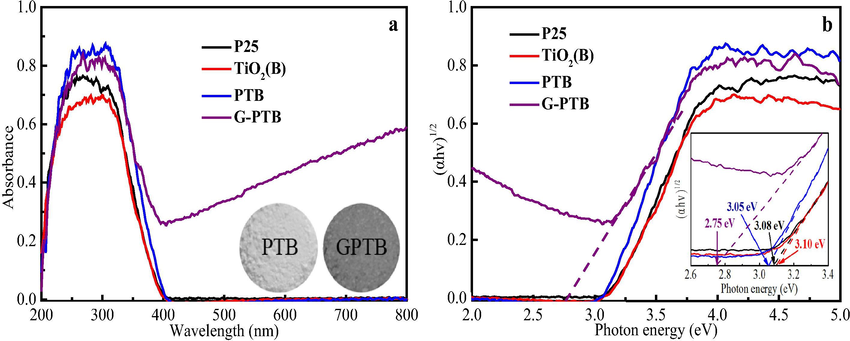
UV–visible diffuse reflectance spectra (a), and determination of the indirect interband transition energies (b) of P25, TiO2(B), PTB, and G-PTB, respectively. The inset of (a) is the photographic images of PTB and G-PTB, and the inset of (b) is the magnified patterns between 2.6 and 3.4 eV.
The photocatalytic performances were tested through the experiments of the degradation of phenol and MO under visible light irradiation. Fig. S3a shows the photocatalytic degradation of methyl orange of G-PTB complex with various quality ratio of P25:TiO2(B). It can be seen that the degradation efficiency increased gradually when the ratio of P25:TiO2(B) increased from 0.5:1 to 2:1. However, when the ration of P25:TiO2(B) increased from 2:1 to 4:1, the degradation efficiency is decreased. This is probably because the increased of P25 nanocrystals weakens the transfer of photoelectron transfer. Therefore, the photocatalytic activity of G-PTB complex with different quality of P25:TiO2(B) can be determined the optimal compound condition is: the quality ratio of P25:TiO2(B)=2:1. So the next main characterization analysis is mainly focused on the sample of G-PTB-2:1. Before the visible light irradiation, in order to reach the adsorption equilibrium, the adsorption in the dark for 30 min should be carried out. As shown in Fig. 7a and c, the self-degradation can be neglected after visible light irradiation for 180 min. During the process of adsorption, the removal rates of MO and phenol by P25, TiO2(B), PTB, and G-PTB is in consistent with the BET results. Among four samples, G-PTB shows the highest degradation efficiency of MO and phenol (∼98 and 97%) in visible light irradiation for 180 min. The outstanding visible light performance of G-PTB photocatalyst can be attributed to the formation of phase-junctions of anatase-rutile-TiO2(B) tri-phase and the synergistic effects of Ti3+ self-doping and oxygen vacancies. Besides, the first-order reaction rate constants (k) are calculated, as illustrated in Fig. 7b and 7d. The k values for MO removal by P25, TiO2(B), PTB, and G-PTB are 0.0025, 0.0027, 0.0030, and 0.0219 min−1, and the k values for phenol removal are 0.0030, 0.0024, 0.0036, and 0.0188 min−1, respectively. It can be observed that the k values of G-PTB for MO and phenol removal are 8.7 and 6.3 times higher than those of P25. These results indicate that G-PTB sample shows enhanced photocatalytic activity under visible light irradiation. The results of degradation experiment combined with the results of UV–Vis diffuse reflection show that after the reduction of NaBH4, the successful introduction of Ti3+ and Ov can greatly enhance the light absorption in the visible light range and further enhance the photocatalytic degradation efficiency.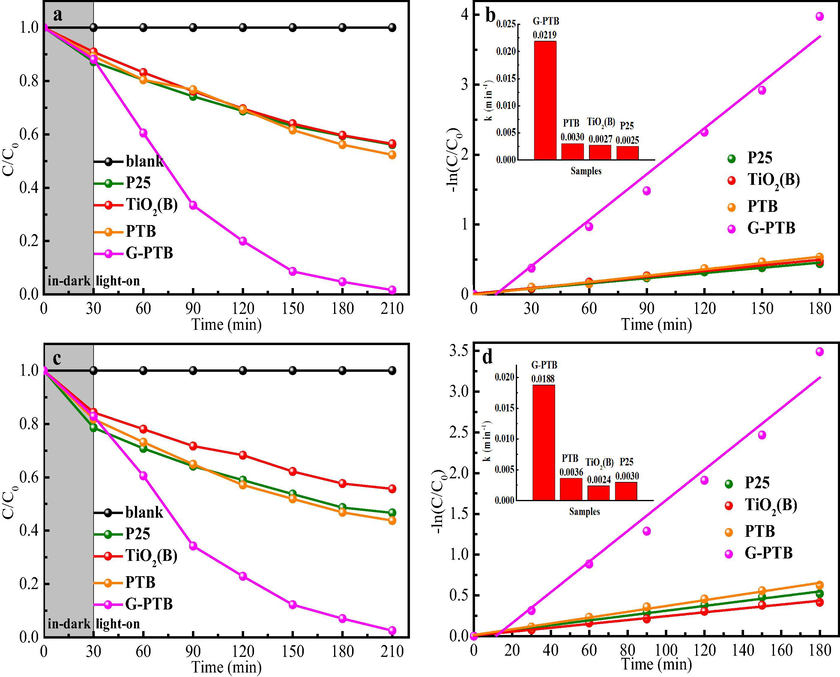
Evaluation of photocatalytic activity under visible light irradiation, photocatalytic degradation of MO (a) and phenol (c) with four samples. The corresponding the linear relationship of -ln(C/C0) versus irradiation time with four samples (b, d).
The photocatalytic performances were tested through the experiments of the degradation of phenol and MO under visible light irradiation. Fig. S3a shows the photocatalytic degradation of methyl orange of G-PTB complex with various quality ratio of P25:TiO2(B). It can be seen that the degradation efficiency increased gradually when the ratio of P25:TiO2(B) increased from 0.5:1 to 2:1. However, when the ration of P25:TiO2(B) increased from 2:1 to 4:1, the degradation efficiency is decreased. This is probably because the increased of P25 nanocrystals weakens the transfer of photoelectron transfer. Therefore, the photocatalytic activity of G-PTB complex with different quality of P25:TiO2(B) can be determined the optimal compound condition is: the quality ratio of P25:TiO2(B)=2:1. So the next main characterization analysis is mainly focused on the sample of G-PTB-2:1. Before the visible light irradiation, in order to reach the adsorption equilibrium, the adsorption in the dark for 30 min should be carried out. As shown in Fig. 7a and c, the self-degradation can be neglected after visible light irradiation for 180 min. During the process of adsorption, the removal rates of MO and phenol by P25, TiO2(B), PTB, and G-PTB is in consistent with the BET results. Among four samples, G-PTB shows the highest degradation efficiency of MO and phenol (∼98 and 97%) in visible light irradiation for 180 min. The outstanding visible light performance of G-PTB photocatalyst can be attributed to the formation of phase-junctions of anatase-rutile-TiO2(B) tri-phase and the synergistic effects of Ti3+ self-doping and oxygen vacancies. Besides, the first-order reaction rate constants (k) are calculated, as illustrated in Fig. 7b and 7d. The k values for MO removal by P25, TiO2(B), PTB, and G-PTB are 0.0025, 0.0027, 0.0030, and 0.0219 min−1, and the k values for phenol removal are 0.0030, 0.0024, 0.0036, and 0.0188 min−1, respectively. It can be observed that the k values of G-PTB for MO and phenol removal are 8.7 and 6.3 times higher than those of P25. These results indicate that G-PTB sample shows enhanced photocatalytic activity under visible light irradiation. The results of degradation experiment combined with the results of UV–Vis diffuse reflection show that after the reduction of NaBH4, the successful introduction of Ti3+ and Ov can greatly enhance the light absorption in the visible light range and further enhance the photocatalytic degradation efficiency.
The dominating active species generated during the process of MO degradation are monitored by adding various scavengers, which covers TBA (•OH scavenger), BQ (•O2– scavenger), and AO (h+ scavenger). As shown in Fig. S3b, the degradation rates of MO are decreased by adding different scavengers. Among these tests, the rate with •OH scavenger is the lowest, suggesting the main active group is •OH. The fluorescence is tested to examine the generation of hydroxyl radicals (•OH) under Xenon lamp irradiation for 1 h with a 420 nm cut-off filter. It is clearly observed in Fig. 8a that the curve of G-PTB sample displays the highest fluorescence intensity at around 425 nm, compared with other samples, implying the G-PTB photocatalyst can generate maximum •OH radicals under visible light irradiation, which coincides with the results of phenol and MO degradation. By testing the degradation efficiency and fluorescence intensity of all the samples in the visible range, it is found that the self-doping of Ti3+ can improve the photocatalytic effect. Under the simulated AM1.5 illumination to further detect the performance of the as-prepared samples. As displayed in Fig. 8b, the positive slopes of four samples can be observed in the Mott-Schottky (M-S) analysis, demonstrating that four samples are all n-type semiconductors. The smallest slop for G-PTB nanorods shown in M-S plot indicates the highest carrier concentration among four samples, which can be attributed to the formation of three-phase heterojunctions, Ti3+ self-doping, and oxygen vacancies that can promote the charge transfer and separation effectively (Guerrero-Araque et al., 2017). The more photo-generated charge carriers are used for the degradation of phenol and MO, the higher photocatalytic and photoelectrochemical performance. Retrieved from the Mott-Schottky plots, the flat band energies (Efb) of P25, TiO2(B), PTB, and G-PTB were −0.85, −1.00, −0.94, and −1.04 eV versus Ag/AgCl [EAg/AgCl is ≈0.198 eV vs. NHE (normal hydrogen electrode) at pH 6.5], respectively. Because the Mott-Schottky test was performed at room temperature, the room temperature compensation potential was approximately 25 meV versus NHE, and the Fermi levels of the P25, TiO2(B), PTB, and G-PTB were calculated as −0.67, −0.78, −0.72, and −0.82 eV versus NHE, respectively. Moreover, the electrochemical impedance spectra (EIS) result as shown in Fig. 8c. The results reflect that the diameter of the G-PTB is smaller than that of other three samples, which means that the G-PTB has the lowest charge transfer resistance. As shown in Fig. S3, the resistance becomes more significant under AM1.5 illumination than in the dark, suggesting that the interface resistance decreases owing to the accumulation of photo-electrons at the interface. In other words, G-PTB exhibits the enhanced separation efficiency for photo-generated charge carriers. Furthermore, Fig. 8d shows the photocurrent density of three photocatalysts in I-T curves. The photocurrent of the G-PTB is 65.5 µA cm−2, which is 1.57, 6.78, and 1.29 times higher than that of P25, TiO2(B), and PTB under AM 1.5. The photo-excited electrons and holes can also be separated more efficiently by G-PTB (Zhang et al., 2016). These analyses are in consistent with the results of photocatalytic degradation towards MO and phenol.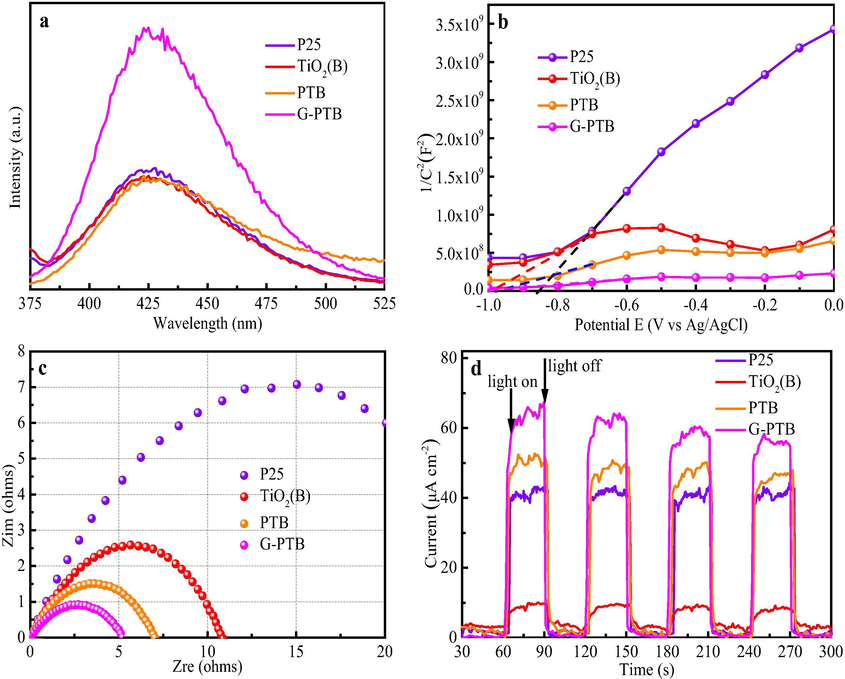
(a) fluorescence intensity under visible light irradiation for 1 h by using terephthalic acid solution for P25, TiO2(B), PTB, and G-PTB samples. (b) Mott-Schottky plots of four samples. (c) Electrochemical impedance spectra, and (d) chronoamperometry tests under AM 1.5.
The dominating active species generated during the process of MO degradation are monitored by adding various scavengers, which covers TBA (•OH scavenger), BQ (•O2– scavenger), and AO (h+ scavenger). As shown in Fig. S3b, the degradation rates of MO are decreased by adding different scavengers. Among these tests, the rate with •OH scavenger is the lowest, suggesting the main active group is •OH. The fluorescence is tested to examine the generation of hydroxyl radicals (•OH) under Xenon lamp irradiation for 1 h with a 420 nm cut-off filter. It is clearly observed in Fig. 8a that the curve of G-PTB sample displays the highest fluorescence intensity at around 425 nm, compared with other samples, implying the G-PTB photocatalyst can generate maximum •OH radicals under visible light irradiation, which coincides with the results of phenol and MO degradation. By testing the degradation efficiency and fluorescence intensity of all the samples in the visible range, it is found that the self-doping of Ti3+ can improve the photocatalytic effect. Under the simulated AM1.5 illumination to further detect the performance of the as-prepared samples. As displayed in Fig. 8b, the positive slopes of four samples can be observed in the Mott-Schottky (M-S) analysis, demonstrating that four samples are all n-type semiconductors. The smallest slop for G-PTB nanorods shown in M-S plot indicates the highest carrier concentration among four samples, which can be attributed to the formation of three-phase heterojunctions, Ti3+ self-doping, and oxygen vacancies that can promote the charge transfer and separation effectively (Guerrero-Araque et al., 2017). The more photo-generated charge carriers are used for the degradation of phenol and MO, the higher photocatalytic and photoelectrochemical performance. Retrieved from the Mott-Schottky plots, the flat band energies (Efb) of P25, TiO2(B), PTB, and G-PTB were −0.85, −1.00, −0.94, and −1.04 eV versus Ag/AgCl [EAg/AgCl is ≈0.198 eV vs. NHE (normal hydrogen electrode) at pH 6.5], respectively. Because the Mott-Schottky test was performed at room temperature, the room temperature compensation potential was approximately 25 meV versus NHE, and the Fermi levels of the P25, TiO2(B), PTB, and G-PTB were calculated as −0.67, −0.78, −0.72, and −0.82 eV versus NHE, respectively. Moreover, the electrochemical impedance spectra (EIS) result as shown in Fig. 8c. The results reflect that the diameter of the G-PTB is smaller than that of other three samples, which means that the G-PTB has the lowest charge transfer resistance. As shown in Fig. S3, the resistance becomes more significant under AM1.5 illumination than in the dark, suggesting that the interface resistance decreases owing to the accumulation of photo-electrons at the interface. In other words, G-PTB exhibits the enhanced separation efficiency for photo-generated charge carriers. Furthermore, Fig. 8d shows the photocurrent density of three photocatalysts in I-T curves. The photocurrent of the G-PTB is 65.5 µA cm−2, which is 1.57, 6.78, and 1.29 times higher than that of P25, TiO2(B), and PTB under AM 1.5. The photo-excited electrons and holes can also be separated more efficiently by G-PTB (Zhang et al., 2016). These analyses are in consistent with the results of photocatalytic degradation towards MO and phenol.
The scanning Kelvin probe microscopy can be used to discriminate the subtle molecular interactions, which shows flat potential or Fermi level according to the work function (Zhang et al., 2016). The flat band energies (Efb) of P25 (−0.85 eV), TiO2(B) (−1.00 eV) from the Mott-Schottky indicate the easy escape of photogenerated electrons which in TiO2(B) and then enhances the separation efficiency of photogenerated charge carriers in the phases-junctions. After treatment P25 and TiO2(B) with NaBH4, the measured work functions of black P25 and black TiO2(B) (Fig. 9) were 5.34 and 5.25 eV, respectively. The smaller work function of black TiO2(B) indicates the approximate Fermi level is higher and the conduction band position is more negative than that of black P25. Namely, black TiO2(B) enhances the built-in electric field and surface band bending (Nanayakkara et al., 2013), so electrons are more likely to overflow into the black P25, and thus favors the separation of photo-generated electrons and holes.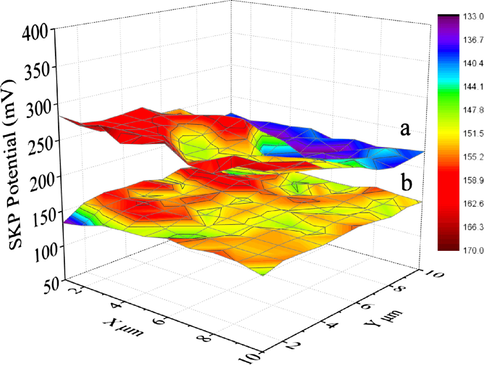
The Scanning Kelvin probe microscopy maps of (a) black P25 and (b) black TiO2(B).
Based on the above analysis, the possible photocatalytic mechanism of the TiO2 tri-phase heterojunctions is proposed as illustrated in Fig. 10. The Ti3+ and oxygen vacancies are located under the conduction band (CB) of TiO2 (Banerjee et al., 2014), lowering the position of photoexcited electrons, which can effectively narrow the band gap of three phases of TiO2 and improve the optical absorption properties. When the G-PTB photocatalyst is exposed to the visible light, the photo-generated electrons (e−) can be excited from the valence band (VB) to CB of three phases. Since the CB levels of rutile and TiO2(B) are more negative than anatase, the e− can be transferred from the CB of rutile and TiO2(B) to the CB of anatase, which promote the separation of photo-generated carriers. The photoexcited electron in the conduction band can react with oxygen to form superoxide radicals (•O2−) or hydroperoxide radicals (•OH) and these reactive oxygen species can participate in the degradation of MO and phenol. Furthermore, the photo-generated holes (h+) transfer from the VB of anatase to the VB of rutile and TiO2(B) which can react with water or hydroxide ions to produce •OH, which in turn oxidizes the organic pollutants. In a word, for G-PTB photocatalyst, the photo-generated e−-h+ pairs can be spatial separated and transferred efficiently owing to the formation of three phases-junctions and the introduction of Ti3+ and oxygen vacancies broaden the range of light response of G-PTB photocatalyst. Their synergistic effect between them improves the photocatalytic properties under visible light irradiation significantly.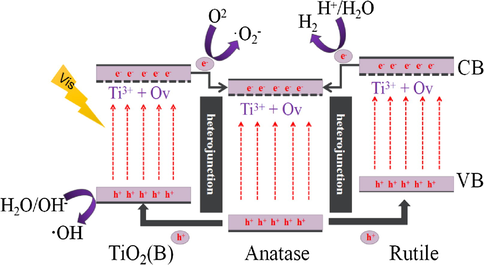
Schematic illustration of the visible-light-driven photocatalytic mechanism for Ti3+ self-doped mixed-crystal tri-phase heterojunction photocatalyst.
4 Conclusions
In summary, a novel Ti3+ self-doped mixed-crystal tri-phase heterojunction photocatalyst was designed and synthesized by a mild and effective method. The prepared photocatalyst formed three phases heterojunctions. Significantly, the degradation rates of MO and phenol were ∼98 and ∼97% under visible-light. The photocurrent density was 65.5 µA cm−2 for G-PTB. The outstanding photocatalytic and photoelectrochemical performances were attributed to the synergistic effect among the special rutile/anatase/TiO2(B) phases heterojunctions, oxygen vacancy and Ti3+ self-doping, which narrowed the band gap and facilitated the spatial separation of photo-generated electron-hole pairs. Therefore, the rutile/anatase/TiO2(B) mixed-phases nanorods photocatalyst can be an outstanding candidate for solar energy utilization and waste water treatment in environment.
Acknowledgments
We gratefully acknowledge the support of this research by the National Natural Science Foundation of China (51672073), the Natural Science Foundation of Heilongjiang Province (B2018010 and H2018012), the Heilongjiang Postdoctoral Startup Fund (LBH-Q14135), the Postdoctoral Science Foundation of China (2017M611399), the University Nursing Program for Young Scholars with Creative Talents in Heilongjiang Province (UNPYSCT-2015014 and UNPYSCT-2016018), the Postgraduate Innovative Science Research Project of Heilongjiang University (YJSCX2018-177HLJU).
References
- Mesoporous titania nanocrystals prepared using hexadecylamine surfactant template: Crystallization progress monitoring, morphological characterization and application in dye-sensitized solar cells. Microporous Mesoporous Mater.. 2009;124:52-58.
- [Google Scholar]
- New insights into the mechanism of visible light photocatalysis. J. Phys. Chem. Lett.. 2014;5:2543-2554.
- [Google Scholar]
- Increasing solar absorption for photocatalysis with black hydrogenated titanium dioxide nanocrystals. Science. 2011;331:746-750.
- [Google Scholar]
- Universal synthesis method for mixed phase TiO2(B)/anatase TiO2 thin films on substrates via a modified low pressure chemical vapour deposition (LPCVD) route. J. Mater. Chem. A. 2016;4:5685-5699.
- [Google Scholar]
- Plasmonic Ag-TiO2-x nanocomposites for the photocatalytic removal of NO under visible light with high selectivity: the role of oxygen vacancies. Appl. Catal., B: Environ.. 2016;204:67-77.
- [Google Scholar]
- Tailored synthesis of anatase-brookite heterojunction photocatalysts for degradation of cylindrospermopsin under UV-Vis light. Chem. Eng. J.. 2017;310:428-436.
- [Google Scholar]
- Enhanced photocatalytic removal of phenazopyridine by using silver-impregnated SiO2-TiO2 nanoparticles: optimization of synthesis variables. Res. Chem. Intermed.. 2015;41:9929-9949.
- [Google Scholar]
- Photo and chemical reduction of copper onto anatase-type TiO2 nanoparticles with enhanced surface hydroxyl groups as efficient visible light photocatalysts. Photochem. Photobiol.. 2015;91:797-806.
- [Google Scholar]
- Shape-controlled fabrication of TiO2 hollow shells toward photocatalytic application. Appl. Catal., B: Environ.. 2018;227:518-529.
- [Google Scholar]
- A new approach to prepare Ti3+ self-doped TiO2 via NaBH4 reduction and hydrochloric acid treatment. Appl. Catal., B: Environ. 2014:160-161. 240-246
- [Google Scholar]
- Directly probing charge separation at interface of TiO2 phase junction. J. Phys. Chem. Lett.. 2017;8:1419-1423.
- [Google Scholar]
- A review of one-dimensional TiO2 nanostructured materials for environmental and energy applications. J. Mater. Chem. A. 2016;4:6772-6801.
- [Google Scholar]
- Interfacial charge-transfer process across ZrO2-TiO2 heterojunction and its impact on photocatalytic activity. J. Photochem. Photobiol., A. 2017;335:276-286.
- [Google Scholar]
- Elementary photocatalytic chemistry on TiO2 surfaces. Chem. Soc. Rev.. 2016;45:3701-3730.
- [Google Scholar]
- Enhanced osteogenic activity of TiO2 nanorod films with microscaled distribution of Zn-CaP. ACS Appl. Mater. Interfaces. 2016;8:6944-6952.
- [Google Scholar]
- Surface structure modification of ZnO and the impact on electronic properties. Adv. Mater.. 2016;28:3893-3921.
- [Google Scholar]
- Facile strategy for controllable synthesis of stable mesoporous black TiO2 hollow spheres with efficient solar-driven photocatalytic hydrogen evolution. J. Mater. Chem. A. 2016;4:7495-7502.
- [Google Scholar]
- Simple ethanol impregnation treatment can enhance photocatalytic activity of TiO2 nanoparticles under visible-light irradiation. ACS Appl. Mater. Interfaces. 2015;7:7752-7758.
- [Google Scholar]
- Sol-gel synthesised WO3 nanoparticles supported on mesoporous silica for liquid phase nitration of aromatics. Appl. Catal., B: Environ.. 2016;182:142-152.
- [Google Scholar]
- N and Ti3+ co-doped 3D anatase TiO2 superstructures composed of ultrathin nanosheets with enhanced visible light photocatalytic activity. J. Mater. Chem. A. 2015;3:22073-22080.
- [Google Scholar]
- Sol-gel design strategy for ultradispersed TiO2 nanoparticles on graphene for high-performance lithium ion batteries. J. Am. Chem. Soc.. 2013;135:18300-18303.
- [Google Scholar]
- Extension of the Stöber method to construct mesoporous SiO2 and TiO2 shells for uniform multifunctional core-shell structures. Adv. Mater.. 2013;25:142-149.
- [Google Scholar]
- General strategy to synthesize uniform mesoporous TiO2/graphene/mesoporous TiO2 sandwich-like nanosheets for highly reversible lithium storage. Nano Lett.. 2015;15:2186-2193.
- [Google Scholar]
- Mesoporous materials for energy conversion and storage devices. Energy Environ. Sci.. 2016;9:411-433.
- [Google Scholar]
- Understanding the anatase-rutile phase junction in charge separation and transfer in a TiO2 electrode for photoelectrochemical water splitting. Chem. Sci.. 2016;7:6076-6082.
- [Google Scholar]
- Achieving overall water splitting using titanium dioxide-based photocatalysts of different phases. Energy Environ. Sci.. 2015;8:2377-2382.
- [Google Scholar]
- Epitaxy of radial high-energy-facetted ultrathin TiO2 nanosheets onto nanowires for enhanced photoreactivities. Adv. Funct. Mater.. 2016;26:1580-1589.
- [Google Scholar]
- “Black” TiO2 nanotubes formed by high-energy proton implantation show noble-metal-co-catalyst free photocataly H2-evolution. Nano Lett.. 2015;15:6815-6820.
- [Google Scholar]
- Noble metal-metal oxide nanohybrids with tailored nanostructures for efficient solar energy conversion, photocatalysis and environmental remediation. Energy Environ. Sci.. 2017;10:402-434.
- [Google Scholar]
- Fabrication of 3D mesoporous black TiO2/MoS2/TiO2 nanosheets for visible-light-driven photocatalysis. ChemSusChem. 2016;9:1118-1124.
- [Google Scholar]
- CdS-CdTe heterojunction nanotube arrays for efficient solar energy conversion. J. Mater. Chem. A. 2016;4:14637-14648.
- [Google Scholar]
- Hydrogen treated anatase TiO2: a new experimental approach and further insights from theory. J. Mater. Chem. A. 2016;4:2670-2681.
- [Google Scholar]
- Built-in potential and charge distribution within single heterostructured nanorods measured by scanning kelvin probe microscopy. Nano Lett.. 2013;13:1278-1284.
- [Google Scholar]
- Engineering the intermediate band states in amorphous Ti3+-doped TiO2 for hybrid dye-sensitized solar cell applications. J. Mater. Chem. A. 2015;3:11437-11443.
- [Google Scholar]
- Sub-particle reaction and photocurrent mapping to optimize catalyst-modified photoanodes. Nature. 2016;530:77-80.
- [Google Scholar]
- Anatase TiO2: better anode material than amorphous and rutile phases of TiO2 for Na-Ion batteries. Chem. Mater.. 2015;27:6022-6029.
- [Google Scholar]
- A high-performance rechargeable Mg2+/Li+ hybrid battery using one-dimensional mesoporous TiO2(B) nanoflakes as the cathode. ACS Appl. Mater. Interfaces. 2016;8:7111-7117.
- [Google Scholar]
- A facile and versatile method for preparation of colored TiO2 with enhanced solar-driven photocatalytic activity. Nanoscale. 2014;6:10216-10223.
- [Google Scholar]
- Morphology-engineered and TiO2(B)-introduced Anatase TiO2 as an advanced anode material for lithium-ion batteries. J. Mater. Chem. A. 2015;3:14721-14730.
- [Google Scholar]
- Recent progress in design, synthesis, and applications of one-dimensional TiO2 nanostructured surface heterostructures: a review. Chem. Soc. Rev.. 2014;43:6920-6937.
- [Google Scholar]
- Scalable water splitting on particulate photocatalyst sheets with a solar-to-hydrogen energy conversion efficiency exceeding 1%. Nat. Mater.. 2016;15:611-615.
- [Google Scholar]
- Three-dimensional branched TiO2 architectures in controllable bloom for advanced lithium-ion batteries. ACS Appl. Mater. Interfaces. 2016;8:20040-20047.
- [Google Scholar]
- Coexistence of an anatase/TiO2(B) heterojunctionand an exposed (001) facet in TiO2 nanoribbon photocatalysts synthesized via a fluorine-free route and topotactic transformation. Nanoscale. 2014;6:5329-5337.
- [Google Scholar]
- A floating macro/mesoporous crystalline anatase TiO2 ceramic with enhanced photocatalytic performance for recalcitrant wastewater degradation. Dalton Trans.. 2014;43:790-798.
- [Google Scholar]
- Hierarchical porous TiO2 ceramics with enhanced photocatalytic performance for micropolluted pesticide degradation. ACS Appl. Mater. Interfaces. 2014;6:16653-16660.
- [Google Scholar]
- Photovoltaic device based on TiO2 rutile/anatase phase junctions fabricated in coaxial nanorod arrays. Nano Energy. 2015;15:406-412.
- [Google Scholar]
- Ferroelectric polarization-enhanced photoelectrochemical water splitting in TiO2-BaTiO3 core-shell nanowire photoanodes. Nano Lett.. 2015;15:7574-7580.
- [Google Scholar]
- Selective catalytic reduction of NOx by NH3 over CeO2 supported on TiO2: comparison of anatase, brookite, and rutile. Appl. Catal., B: Environ.. 2017;208:82-93.
- [Google Scholar]
- Improved electrochemical performance of nitrogen doped TiO2-B nanowires as anode materials for Li-ion batteries. Nanoscale. 2015;7:12215-12224.
- [Google Scholar]
- An order/disorder/water junction system for highly efficient co-catalyst-free photocatalytic hydrogen generation. Energy Environ. Sci.. 2016;9:499-503.
- [Google Scholar]
- Ni2+ and Ti3+ co-doped porous black anatase TiO2 with unprecedented-high visible-light-driven photocatalytic degradation performance. RSC Adv.. 2015;5:107150-107157.
- [Google Scholar]
- High thermostable ordered mesoporous SiO2-TiO2 coatedcirculating-bed biofilm reactor for unpredictable photocatalytic and biocatalytic performance. Appl. Catal., B: Environ.. 2016;180:521-529.
- [Google Scholar]
- Ti3+ Self-doped blue TiO2(B) single-crystalline nanorods for efficient solar-driven photocatalytic performance. ACS Appl. Mater. Interfaces. 2016;8:26851-26859.
- [Google Scholar]
- Black N/H-TiO2 Nanoplates with a flower-like hierarchical architecture for photocatalytic hydrogen evolution. ChemSusChem. 2016;9:2841-2848.
- [Google Scholar]
- Self-floating amphiphilic black TiO2 foams with 3D macro-mesoporous architectures as efficient solar-driven photocatalysts. Appl. Catal., B: Environ.. 2017;206:336-343.
- [Google Scholar]
- Ordered mesoporous black TiO2 as Highly Efficient Hydrogen Evolution Photocatalyst. J. Am. Chem. Soc.. 2014;136:9280-9283.
- [Google Scholar]


