

Translate this page into:
Traditional multi-herbal formula in diabetes therapy – Antihyperglycemic and antioxidant potential
⁎Corresponding author at: University of Novi Sad, Faculty of Medicine, Department of Pharmacy, Hajduk Veljkova 3, 21000 Novi Sad, Republic of Serbia. nebojsa.salaj@mf.uns.ac.rs (Nebojša Salaj),
-
Received: ,
Accepted: ,
This article was originally published by Elsevier and was migrated to Scientific Scholar after the change of Publisher.
Abstract
Traditional medicinal plants are used as an additional form of type 2 diabetes therapy in which oxidative stress is one of the progression factors. The aim of the study was the evaluation of antihyperglycemic and antioxidant potential of tea mixture registered as food and marketed for treatment of type 2 diabetes mellitus. Chemical profiling of the extracts included quantification of total phenolics and flavonoids, while antihyperglycemic potential was estimated through determination of inhibition potential of α-amylase and α-glucosidase. Additionally, extracts were characterized for specific phenolic compounds by high performance liquid chromatography (HPLC). The in vitro antioxidant activity was estimated by application of DPPH, OH, NO and FRAP tests. The greatest anti-α-amylase potential is attributed to the Phaseoli legumen, while the highest potential to inhibit α-glucosidase was recorded for Olivae folium. Generally, screening of the phenolic compounds enabled us to conclude that a high level of correlation exists between anti-α-amylase potential and the quantified amounts of total phenolics, as well as gallic acid, while the chlorogenic acid is most probably responsible for the inhibition of α-glucosidase activity. Therefore, the high total ratio (40%, m/m) of Olivae folium and Phaseoli legumen in the evaluated tea mixture can be stated as fully justified. However, future in vivo research is required for further understanding of the antihyperglycemic activity mechanisms of secondary metabolites found in specified herbal components, as well as to evaluate their synergistic effect when applied in a form of tea mixture.
Keywords
Tea mixture
Antioxidant
Antihyperglycemic activity
Chemometrics

1 Introduction
Diabetes mellitus (DM) is a chronic progressive metabolic disease characterized by hyperglycemia which occurs as a consequence of defect in insulin secretion, insulin sensitivity, or both. The main types of diabetes are classified as: type 1, type 2, gestational diabetes mellitus and other specific types of DM. Type 2 diabetes mellitus (T2DM) is the most prevalent form of DM followed by the two pathophysiological defects in endocrine function – insulin resistance and impaired insulin secretion (American Diabetes Association, 2014). Namely, in response to hyperglycemia, various pathways leading to the oxidative stress increase are activated. The aforementioned includes production of mitochondrial reactive oxygen species (ROS), enhanced non-enzymatic glycosylation of proteins and favor of the hexosamine biosynthetic pathway (Kawahito et al., 2009). The overall elevated oxidative stress plays a key role in development of leading metabolic disturbances characteristic for T2DM – insulin resistance and a relative deficiency of insulin secretion (Evans et al., 2002).
Nine classes of oral prescription medicines currently approved for the treatment of T2DM are frequently associated with gastrointestinal adverse effects. One of the most popular pharmacological approaches in the management of postprandial hyperglycemia is reduction of dietary carbohydrate digestion, and consequent absorption, trough the inhibition of key enzymes involved in their intestinal metabolism – α-amylase and α-glucosidase (Oboh et al., 2014).
The usage of traditional herbal remedies is widely adopted in treatment of different types of diabetes. More than 400 medicinal plants have been investigated for their beneficial effects in the treatment of T2DM, but only for a limited number was proved to be clinically efficient and safe. A wide range of biologically active constituents isolated from medicinal plants, such as phenolics, alkaloids, terpenoids and tannins, have been reported to display antihyperglycemic activity through α-amylase and α-glucosidase inhibition (Alam et al., 2014; Bahadoran et al., 2013; Salehi et al., 2019). This might represent a novel therapeutic strategy for the treatment of postprandial hyperglycemia, when taking into account relatively clinically insignificant and rare adverse effects, in contrast to conventional antihyperglycemic medicines (Salehi et al., 2019). However, currently popular traditional medicinal systems (phytotherapy, traditional Chinese medicine, Ayurveda) are based on holistic approach, which implies the use of medicinal plants mixtures, instead of single herbal components. Numerous studies have revealed the clinical importance of synergistic effects produced by application of multicomponent herbal mixtures in patients with diabetes, as well as potential mechanisms of action (Rather et al., 2013).
Thus, the aim of the current study was the evaluation of antihyperglycemic and antioxidant potential of tea mixture registered as food and marketed as a remedy for treatment of type 2 diabetes mellitus, containing common wormwood herb (Artemisia absinthium L.), leaves of common nettle (Urtica dioica L.), black mulberry (Morus nigra L.), blueberry (Vaccinium myrtillus L.), silver birch (Betula pendula Roth, Betula pubescens Ehrh.), olive (Olea europaea L.) and common bean legumes (Phaseolus vulgaris L.). Furthermore, special emphasis was placed on the contribution of herbal mixture individual components to the investigated biological activity and elucidation of secondary metabolites contributing to the specified medicinal properties.
2 Materials and methods
2.1 Reagents and chemicals
2,2-diphenyl-1-picrylhydrazyl (DPPH) radical, sulphanilamide, N-(1-naphthyl)-ethylenediamine dihydrochloride and iron(III)-chloride hexahydrate were obtained from Alfa Aesar (Haverhill, MA, USA). Folin-Ciocalteu (FC) reagent was purchased from Merck (Darmstadt, Germany). Ethanol, hydrochloric acid, trichloroacetic acid, hydrogen peroxide, sodium carbonate, potassium dihydrogenphosphate, potassium hydrogenphosphate and sodium nitroprusside were obtained from Lach-Ner (Brno, Czech Republic). Sodium bicarbonate, iron(II)-sulphate heptahydrate, acetic acid and methanol were purchased from POCH (Gliwice, Poland). Gallic acid, caffeic acid, trans-cinnamic acid, p-coumaric acid, chlorogenic acid, rosmarinic acid, ferulic acid, quercetin, rutin, quercitrin, aluminum-chloride, 2-deoxy-ᴅ-ribose, 2-thiobarbituric acid, ethylenediaminetetraacetate dihydrate, 2,4,6-tris(2-pyridyl)-s-triazine, Starch azure, α-amylase, α-glucosidase, glutathione (reduced) and p-nitrophenyl-α-ᴅ-glucopyranoside were obtained from Sigma Aldrich (St. Louis, MO, USA). All chemicals used in this study were of analytical grade, except for the reagents for chromatography analysis, which were of HPLC grade.
2.2 Herbal material and preparation of extracts
The commercially available tea mixture (marketed as “Tea used in diabetes”) purchased at pharmacy (Novi Sad, 2019) was used in this research. The composition of the tea mixture declared by the manufacturer is presented in Table 1.
English common name
Latin name
Botanical name
Mass fraction (w/w, %)
common wormwood herb
Absinthii herba
Artemisia absinthium L., Asteraceae
5%
common nettle leaves
Urticae folium
Urtica dioica L., Urticaceae
5%
black mulberry leaves
Mori nigrae folium
Morus nigra L., Moraceae
10%
olive leaves
Olivae folium
Olea europaea L., Oleaceae
10%
blueberry leaves
Myrtilli folium
Vaccinium myrtillus L., Ericaceae
20%
silver birch leaves
Betulae folium
Betula pendula Roth, Betula pubescens Ehrh., Betulaceae
20%
common bean/bean shell legumes
Phaseoli legumen
Phaseolus vulgaris L., Fabaceae
30%
Also, the individual herbal components were macroscopically separated from the tea mixture and were further evaluated for their biological potential and chemical profile. The extracts of tea mixture and individual herbal components were prepared in a form of decoct, as suggested by the manufacturer's instructions available on the packaging (heating with boiling water for 15 min). The decocts were filtered, evaporated to dryness by heating, and the extraction yield (dry extract, d. e.) was quantified. The dried extracts were dissolved in distilled water for the purpose of biological potential evaluation and preliminary chemical characterization. In order to perform detailed chemical profiling by high-performance liquid chromatography (HPLC), the obtained dried extracts were dissolved in 70% (v/v) methanol.
2.3 Chemical characterization
2.3.1 Preliminary chemical characterization
The obtained extracts were preliminary chemically characterized in a term of total phenolic content (TPC) and total flavonoid content (TFC), according to the previously described method (Božin et al., 2013). The amounts of total phenolics and flavonoids were expressed as mg of gallic acid equivalents (GAE) per g of dry extract (mg GAE/g d.e.) and mg of quercetin equivalents (QE) per g of dry extract (mg QE/g d.e.), respectively, based on the previously obtained calibration curves for gallic acid and quercetin.
2.3.2 Detailed chemical profiling
The previously developed and validated high performance liquid chromatography (HPLC) method was used for identification and quantification of selected phenolic compounds (Salaj et al., 2020). The molecules of interest were separated using an Agilent Technologies 1100 liquid chromatographer equipped with diode array detector (Agilent Technologies, Waldbronn, Germany) on a reversed-phase Nucleosil C18 column (4.6 × 250 mm, 5 μm particle size;) held at 30 °C. The mobile phase consisting of 1% (v/v) aqueous formic acid (solvent A) and methanol (solvent B) was delivered in gradient mode as follows: 0 min, 10% B; 10 min, 25% B; 20 min, 45% B; 35 min, 70% B; 40 min, 100% B; 46 min, 10% B. The injected volume was 10 μL and the total running time was 48 min, using a variable flow-rate (0–10 min, 1 mL/min; 10–20 min, 0.8 mL/min; 20–30 min, 0.7 mL/min; 30–46 min, 1 mL/min). For the quantification of the selected compounds, chemical standards of gallic (GA), caffeic (CA), trans-cinnamic (CNA), p-coumaric (pQA), chlorogenic (CHA), rosmarinic (RA) and ferulic acid (FA), quercetin (Qe), rutin (R) and quercitrin (Qt) were dissolved in methanol and run under the same experimental conditions. The compounds of interest were monitored at 280 nm (GA, CA and CNA), 330 nm (pQA, CHA, RA, FA and Qe) and 350 nm (R and Qt) and identified by comparing the retention times and UV spectra of unknown peaks with those of corresponding reference standards. The results were expressed as micrograms per gram of dry extract (µg/g d.e.).
2.4 Evaluation of antioxidant activity
The potential of the obtained extracts to neutralize 2,2-diphenyl-1-picrylhydrazyl (DPPH), hydroxyl (OH) and nitroso (NO) radicals was determined spectrophotometrically, as previously described (Božin et al., 2013). The results were expressed as IC50 values (the concentration of sample required for neutralization of 50% of free radicals).
Furthermore, the ferric reducing antioxidant power (FRAP) of extracts was estimated according to a modified methodology of Benzie and Strain (Benzie and Strain, 1996; Lesjak et al., 2011). Ascorbic acid was used as a positive control, so the FRAP values were expressed as milligrams of ascorbic acid equivalents (AAE) per g of dry extract (mg AAE/g d.e.).
2.5 Evaluation of antihyperglycemic potential
The antihyperglycemic potential of the obtained extracts was evaluated through the α-amylase and α-glucosidase inhibition assays. Both of the tests were performed according to previously described and modified procedures from Sigma Aldrich (Kladar et al., 2017, 2015; Mun’im et al., 2013). Acarbose was used as a positive control. The results were expressed as percentage of α-amylase and α-glucosidase inhibition activity.
2.6 Statistical analysis
The obtained results were processed by the use of Microsoft Excel, v.2010 software package and Statistica v12.5 software (StatSoft Inc., Tulsa, OK, USA). All of the results were expressed as means of triplicate analyses corrected by standard deviation (SD). Based on the percentage of free radical neutralization, IC50 values were determined by regression analysis. The obtained dataset was analyzed by means of univariate (one-way ANOVA followed by post-hoc Tukey test) and multivariate statistical methods (principal component analysis (PCA) and hierarchical cluster analysis (HCA)). Multivariate statistical methods were applied to a dataset determined by variables describing antioxidant potential (IC50 values, FRAP value) and antihyperglycemic potential (Amy8000 and Glu40). The variables describing antihyperglycemic potential were derived as reciprocal values of a percentage of inhibition at a concentration of extract at which the activity of the tested enzyme was inhibited by more than 50% (for at least one of the extracts). Specifically, the selected concentration in the case of α-amylase was 8000 µg/mL (Amy8000), while in the case of α-glucosidase was 40 µg/mL (Glu40). The previously stated derivatization of variables was performed in order to obtain the same mathematical nature as of IC50 values.
3 Results and discussion
3.1 Chemical characterization
3.1.1 Preliminary chemical characterization
The results of preliminary chemical characterization (Table 2) showed notable variability of extraction yield (ranging from 11.16 to 32.42%). Previously performed studies dealing with individual herbal components included in the examined tea mixture have shown great variability in terms of biological potential determination and chemical characterization. The aformentioned can be a consequence of several factors. Namely, we must not neglect the possibility of genetic variations in biological sources, as well as unavoidable and well-recognized influence of ecological factors, which both significantly affect the intensity of secondary metabolites biosyntheis in plants (Ferreira et al., 2007; Heimler et al., 2005; Jovančević et al., 2011; Kahkonen et al., 1999; Kostić et al., 2013; Lee et al., 2013; Pourmorad et al., 2006; Szentmihályi et al., 2010).
Sample
TPC (mg GAE/g d.e.)a mean ± SDc
TFC (mg QE/g d.e.)b mean ± SD
Extraction yield (%)
Tea mixture
61.50 ± 1.01
8.33 ± 0.15
11.38
Absinthii herba
85.83 ± 3.56
6.31 ± 0.28
18.72
Urticae folium
48.11 ± 7.12
7.43 ± 0.27
16.95
Mori nigrae folium
59.69 ± 7.18
9.36 ± 0.01
23.71
Myrtilli folium
25.18 ± 1.09
4.70 ± 0.49
16.27
Betulae folium
80.15 ± 3.27
13.04 ± 0.40
19.55
Phaseoli legumen
181.34 ± 5.83
31.78 ± 1.89
32.42
Olivae folium
98.74 ± 1.89
4.97 ± 0.27
11.16
Specifically, the quantification of total phenolics in the examined samples has shown lower total phenolic content in common wormwood herb (Absinthii herba), black mulberry leaves (Mori nigrae folium) and olive leaves (Olivae folium) extracts, compared to the results of previously performed studies on the same type of extracts (Ferreira et al., 2007; Kostić et al., 2013; Lee et al., 2013). On the other hand, common nettle leaves (Urticae folium), blueberry leaves (Myrtilli folium), silver birch leaves (Betulae folium) and common bean legumes (Phaseoli legumen) extracts were characterized by a higher content of total phenolics, compared to the previous studies of these plant species (Heimler et al., 2005; Mišan et al., 2011; Pourmorad et al., 2006; Szentmihályi et al., 2010). The lower total flavonoid content was quantified in common wormwood herb, black mulberry, common nettle and olive leaves extracts (Heimler et al., 2005; Kostić et al., 2013; Lee et al., 2013; Pourmorad et al., 2006; Szentmihályi et al., 2010). Generally, the differences recorded for quantities of total phenolics and flavonoids, when compared to previously published papers, might be attributed to the geographical origin of the plant material, as well as the prolonged heated assisted extraction applied for extraction in the current research.
3.1.2 Detailed chemical profiling
Detailed chemical profiling (Fig. 1, Table 3) gives insight into variations of specific phenolic compounds in the examined tea mixture and its indiviudal components. Gallic and ferulic acid were the predominant components present in Betulae folium extract. Hydroxycinnamic acids, such as caffeic and p-coumaric acids, as well as quercetin were the most abundant in Mori nigrae folium extract. Trans-cinnamic acid and flavonoid glycosides - rutin and quercitrin were the dominant compounds found in Phaseoli legumen extract, while chlorogenic and rosmarinic acids were the main phenolic components of the Olive folium extract.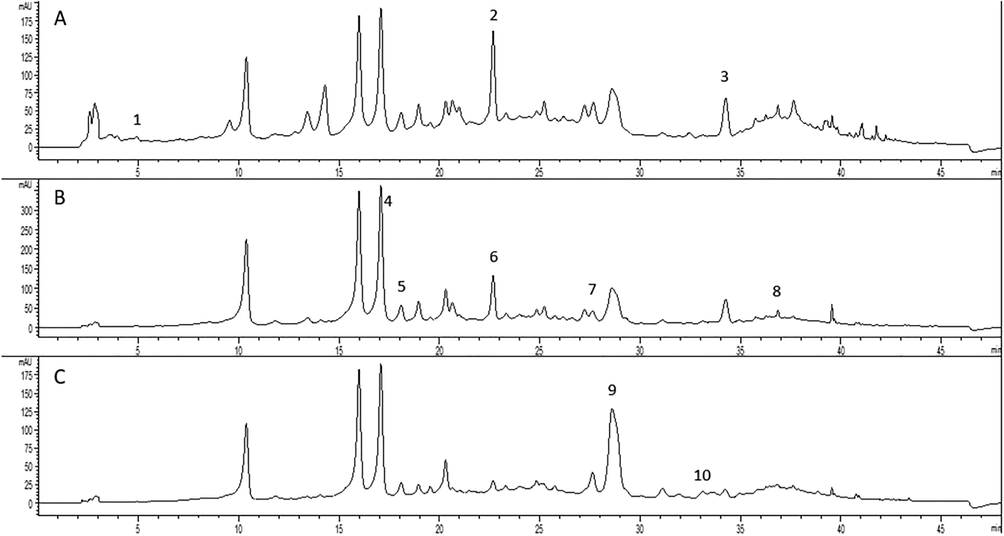
HPLC-DAD chromatogram of tea mixture extract with detection at 280 nm (A), 330 nm (B), 350 nm (C): 1 – gallic acid, 2 – caffeic acid, 3 – trans-cinnamic acid, 4 – p-coumaric acid, 5 – quercetin, 6 – chlorogenic acid, 7 – rosmarinic acid, 8 – ferulic acid, 9 – rutin, 10 – quercitrin.
Content (µg/g d.e.)a
Sample
Tea mixture
Absinthii herba
Urticae folium
Mori nigrae folium
Myrtilli folium
Betulae folium
Phaseoli legumen
Olivae folium
GAb
11.56 ± 1.73
137.85 ± 20.68
< LODc
106.50 ± 15.98
< LOD
1140.15 ± 171.02
56.60 ± 8.49
< LOD
CA
694.80 ± 34.74
37.29 ± 1.86
615.15 ± 30.76
909.25 ± 45.46
30.93 ± 1.55
174.81 ± 8.74
362.85 ± 18.14
644.00 ± 32.20
CNA
296.40 ± 32.60
7.50 ± 0.83
23.34 ± 2.57
358.50 ± 39.44
< LOD
< LOD
956.12 ± 105.17
7.46 ± 0.82
pQA
2713.78 ± 271.38
2437.56 ± 243.76
224.46 ± 22.45
38916.25 ± 3891.63
191.50 ± 19.15
720.63 ± 72.06
7281.30 ± 728.13
192.10 ± 19.21
Qe
165.78 ± 11.60
433.65 ± 30.36
33.90 ± 2.37
1812.75 ± 126.89
< LOD
214.74 ± 15.03
329.49 ± 23.06
38.90 ± 2.72
CHA
200.80 ± 10.04
61.50 ± 3.08
287. 10 ± 14.36
73.25 ± 3.66
139.60 ± 6.98
348.41 ± 17.42
340.69 ± 17.03
416.30 ± 20.82
RA
354.88 ± 21.29
308.94 ± 18.54
< LOD
< LOD
< LOD
< LOD
< LOD
2221.00 ± 133.26
FA
292.13 ± 17.53
122.20 ± 6.73
17.73 ± 1.06
272.25 ± 16.34
< LOD
892.29 ± 53.34
82.15 ± 4.93
273.10 ± 16.39
R
3266.63 ± 261.33
< LOD
< LOD
15415.75 ± 1233.26
97.40 ± 7.79
19944.30 ± 1595.54
30250.00 ± 2420.00
< LOD
Qt
204.35 ± 10.22
< LOD
< LOD
1174.00 ± 58.70
< LOD
3123.00 ± 156.15
3332.83 ± 166.64
327.30 ± 16.37
The conducted epidemiological studies have shown that dietary intake of phenolic-rich food corresponds to a lower incidence of the chronic degenerative diseases, such as cancer, diabetes type 2, Alzheimer’s disease and cardiovascular diseases (Gutiérrez-Grijalva et al., 2016). Previous studies have reported beneficial effects of flavonoids, such as quercetin, on endothelial cell functions, and these effects are mediated via adenosine monophosphate-activated protein kinase (AMPK) pathway, key sensor of cellular energy homeostasis (Shen et al., 2012). Also, numerous studies have shown that antiplatelet effect of flavonoids may be a result of the thromboxane A2 receptor antagonism and inhibition of thromboxane formation (Shu-Huey et al., 1991).
3.2 Antioxidant potential
The obtained results of free radicals scavenging activity of tea mixture and its indiviudal components against DPPH and OH radical (Fig. 2) suggest variations in the antioxidant potential of the examined extracts. The IC50 values obtained in DPPH assay ranged from 2.05 µg/mL (Phaseoli legumen extract) to 30.48 µg/mL (Mori nigrae folium extract). Previously was observed that Phaseoli legumen extract possesses the highest DPPH free radical scavenging activity (Boateng et al., 2008). Significant (p < 0.05) negative correlations between DPPH radical scavenging activity (IC50 value) of the examined extracts and total phenolic content (r = −0.95) as well as total flavonoid content (r = −0.74) were recorded. Furthermore, it was noticed that higher ability of DPPH neutralization was found for Phaseoli legumen, Urticae folium, Betulae folium and Olivae folium extracts, while Absinthii herba extract showed higher IC50 values, compared to the results of previous studies (Goldsmith et al., 2015; Nikolova et al., 2011; Otles and Yalcin, 2012; Sidaoui et al., 2016; Zou and Chang Sam, 2014). In the tested concentration range, Myrtilli folium extract showed no potential to neutralize 50% of DPPH radicals. The ability of Mori nigrae folium extract to scavenge DPPH was similar to the results of previous studies (Memon et al., 2010). The comparison of the in vitro obtained results concerning free radical scavenging assays may represent an issue due to the differences in applied analytical protocols which results in generating of different concentrations of free radicals. Therefore, the use of positive control – synthetic antioxidants greatly contributes to the credibility of the results obtained in the assessment of antioxidant activity. Regarding this, it is necessary to highlight the remarkable antioxidant effect of Phaseoli legumen extract, when compared to the antioxidant effect of quercetin dihydrate and propyl gallate, determined under the same experimental conditions (Kladar et al., 2017).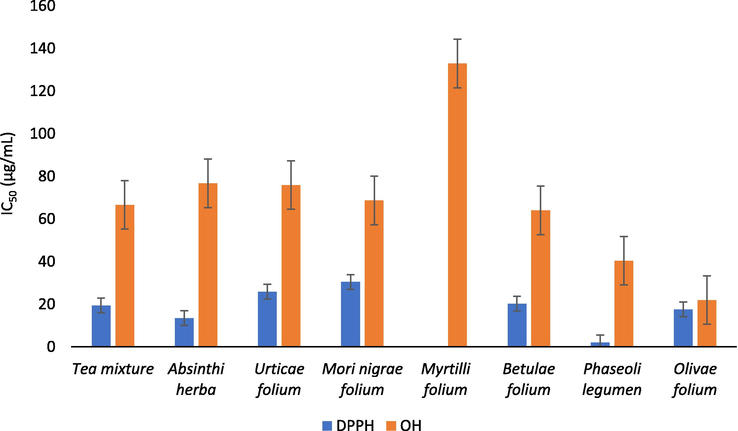
The free radicals scavenging activity of tea mixture and its individual components against DPPH and OH radical.
Furthermore, statistically significant differences were recorded in the results obtained for neutralization potential of DPPH radicals exhibited by examined herbal extracts and ascorbic acid (F(8) = 2917.37, p = 0.00). The post-hock Tukey test has demonstrated that the differences in antioxidant potential do not exist only in the case of Absinthii herba (p = 0.14) and Phaseoli legumen (p = 1.00) extracts, when compared to ascorbic acid, thus confirming their strong antioxidant potential.
The potential of the examined extracts to neutralize OH radical resulted in the IC50 values ranging from 21.98 µg/mL (Olive folium) to 132.95 µg/mL (Myrtilli folium). Propyl gallate, a positive control, exhibited slightly higher ability to neutralize hydroxyl radicals in comparison to the examined Olive folium extract. A significant correlation (p < 0.05) between the neutralization potential of OH radical (IC50 values) and total phenolic content quantified in the examined extracts was noticed (r = −0.81).
None of the tested samples showed the ability to neutralize 50% of the generated NO radicals in the tested concentration range, indicating a low ability of reactive nitrogen species neutralization.
The Phaseoli legumen extract exhibited the highest ability to reduce Fe3+ in the FRAP assay (337.83 ± 3.09 mg AAE/g d.e.), while generally the results of FRAP assay (Fig. 3) significantly correlated (p < 0.05) with the quantified amount of total phenolics in the extracts (r = 0.87). The recorded FRAP values of the Absinthii herba, Urticae folium and Phaseoli legumen extract were higher when compared to the results of the previously conducted studies (Boateng et al., 2008; Kőszegi et al., 2020; Orhan et al., 2010).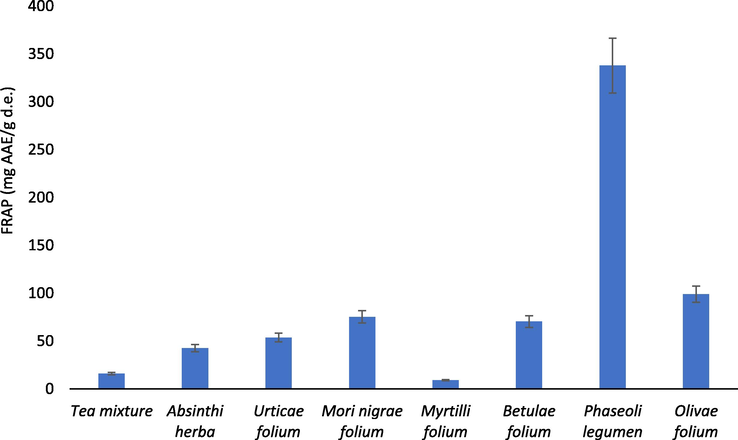
FRAP values of the analyzed samples.
3.3 Antihyperglycemic potential
Phenolic compounds have been highlighted as bioactive metabolites with significant health promoting benefits, especially in prevention of chronic non-communicable diseases. The inhibition of α-glucosidase and α-amylase, enzymes responsible for dietary carbohydrates metabolism, is one of the mechanisms by which phenolics reduce postprandial hyperglycemia.
Based on the results of α-amylase inhibitory activity (Fig. 4), it can be concluded that several analyzed samples (Absinthii herba, Urticae folium, Betulae folium and Phaseoli legumen) have shown dose-dependent increase in inhibitory effect of α-amylase. Furthermore, Betulae folium and Phaseoli legumen extracts exhibited the strongest ability of inhibiting α-amylase, at concentration of 8000 µg/mL. Also, α-amylase inhibitory activity (Amy8000) significantly correlated (p < 0.05) with the total flavonoid content (r = −0.94) and GA content (r = −0.71). The Phaseoli legumen extract showed an inhibition rate over 50% at concentration greatly higher (8000 µg/mL) than the IC50 value of positive control (acarbose, IC50 = 4.9 µg/mL). However, common bean is a medicinal plant, widely studied as in vitro and in vivo α-amylase inhibitor. Phaseolamin, an active compound of P. vulgaris, is a glycoprotein present in white kidney beans and known as non-competitive inhibitor of mammalian salivary and pancreatic α-amylase. Also, water extract of P. vulgaris (Phase 2®) is registered as a dietary supplement on the market (De Gouveia et al., 2014; Etxeberria et al., 2012).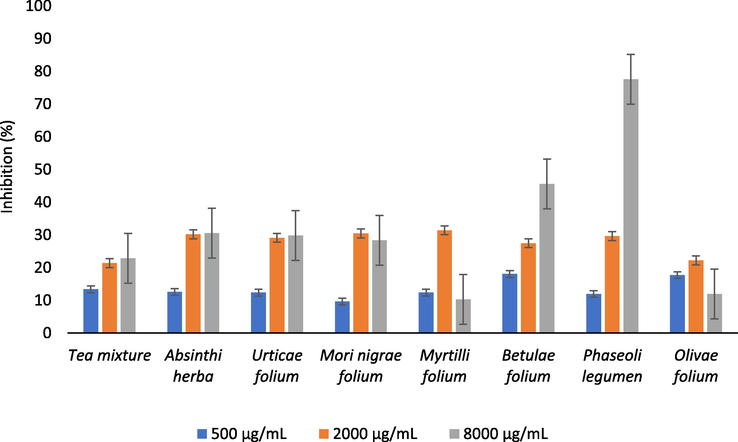
The α-amylase inhibitory activity of the analyzed samples.
The results of α-glucosidase inhibitory activity (Fig. 5) of the Absinthii herba, Urticae folium, Mori nigrae folium, Betulae folium and Olive folium extracts have showed concentration dependent increase in α-glucosidase inhibitory activity. Among all of the tested extracts, Olive folium extract exhibited the highest inhibitory effect on α-glucosidase (87.42% of inhibition) at concentration of 40 µg/mL, which is in agreement with previous studies (Othman et al., 2009). Inhibitory activity of the Olive folium extract was found to be especially significant when compared to the IC50 value of acarbose (IC50 = 41 µg/mL), while the previous studies identify oleanolic acid and oleuropein as strong inhibitors of α-glucosidase (Etxeberria et al., 2012). Phaseoli legumen extract was found to be the most efficient inhibitor of α-glucosidase activity (46.79% of inhibition) at concentration of 80 µg/mL. The results were consistent with the results of the previously conducted studies (Mojica et al., 2015). The α-glucosidase inhibitory activity (Glu40) significantly negatively correlated (p < 0.05) with the CHA content (r = −0.79).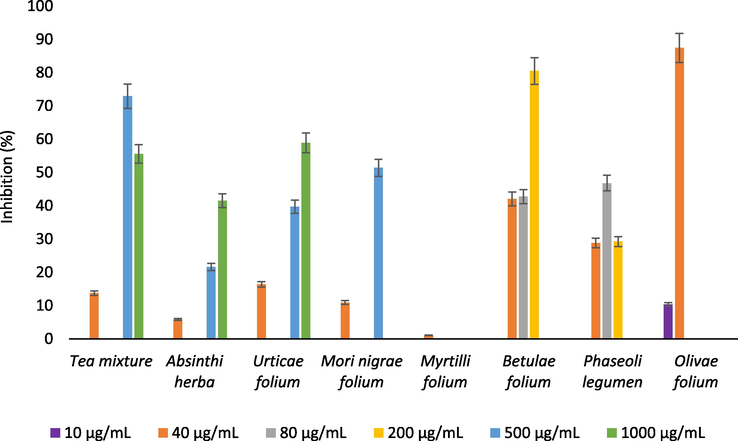
The α-glucosidase inhibitory activity of the analyzed samples.
The α-glucosidase inhibitory activity of Olive folium and Phaseoli legumen extracts may be attributed to the high content of specific phenolic compounds, which supports previous studies where phenolics have been described as potent α-amylase and α-glucosidase inhibitors. Generally, phenolic compounds have been widely investigated as antidiabetic agents. Phenolic acids, such as CA, GA, CHA and RA are easily oxidized to quinones. The mechanism of action of these intermediary products could lay in the interaction with free thiol and amino nucleophilic groups of carbohydrates-hydrolyzing enzymes. The results of the previously conducted in vivo studies showed that some hydroxycinnamic derivates, such as FA, effectively suppresses glycaemia by elevating glucokinase activity, increasing the levels of plasma insulin and production of glycogen in diabetic rats. Also, CHA, FA and CA are able to reduce bioavailability of carbohydrates by inhibiting intestine sodium-dependent glucose transporter (Bahadoran et al., 2013). The antidiabetic effect of CHA is mainly attributed to the stimulation of glucose transport via AMPK activation in skeletal muscles (Salehi et al., 2019). Furthermore, recent studies have revealed a relationship between hydroxyl groups amount in the flavonoid structure and inhibitory activity against α-amylase and α-glucosidase. Specifically, it was noticed that flavonoids containing more than three OH groups exhibited higher inhibitory activity against pancreatic α-amylase (De Souza Schmidt Gonçalves et al., 2010). Quercetin is a flavonoid of the flavonol class present in a variety of medicinal plants. It exhibits anti-inflammatory effect on pancreatic β-cells through the ability to inhibit aldose reductase and also enhances expression and translocation of insulin-dependent GLUT4 transporter resulting in increased glucose uptake in myocytes. Also, quercetin has demonstrated strong radical scavenging activity against hydroxyl, superoxide, and peroxyl radicals, the major free radicals in T2DM (Alam et al., 2014). Rutin (quercetin-3-O-rutinoside) is a widely distributed flavonoid glycoside among plants and has important pharmacological effects. It was found to alter the activities of gluconeogenic and glycolytic enzymes and improves the translocation of GLUT 4 transporter (Salehi et al., 2019).
3.4 Chemometric evaluation of the tea mixture biological potential
The principal component analysis (PCA) was applied to evaluate the dataset describing antioxidant and antihyperglycemic activity of tea mixture and its individual components. The performed PCA indicates that the first two extracted components (PCA1 and PCA2) describe more than 90% of the samples’ variability. The variability described by PCA1 mostly correlates with the results describing antioxidant and anti-α-glucosidase potential, while in the case of PCA2, those are the variables describing antihyperglycemic potential (Fig. 6a). The position of the analyzed samples in the space defined by the first and the second principal component axes indicates on Myrtilli folium sample located in the negative part of PCA1, based on a lower antioxidant and antihyperglycemic activity (Fig. 6b). On the other hand, the position of Olive folium and Phaseoli legumen samples in the positive part of PCA1 suggests stronger antioxidant activity, while these samples further differentiate in the space defined by PCA2, based on the stronger anti-α-glucosidase and anti-α-amylase potential, respectively.
PCA. (a) Loading plot of the first two principal components (PCA1 and PCA2) and (b) the position of the analyzed samples - cases in the space defined by the first two principal components.
Additionally, the results of HCA (Fig. 7) were confirming the separative grouping of Myrtilli folium extract as a separate cluster, based on modest antioxidant potential, while all of the other samples belong to one large cluster, which further differentiates Phaseoli legumen and Olive folium extracts as separate subclusters.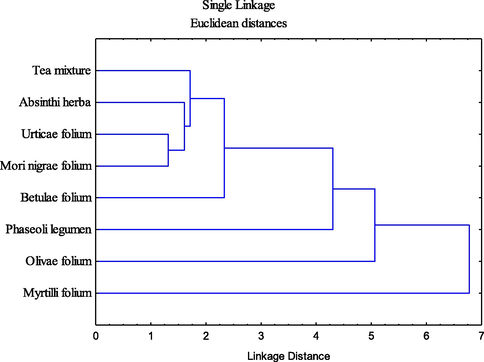
Cluster diagrams of the analyzed samples based on antioxidant and antihyperglycemic activity.
4 Conclusion
The performed study enabled evaluation of the potential health beneficial effects of tea mixture classified as food product, but also marketed as complementary herbal remedy in treatment of diabetes. Namely, it was observed that the high total phenolic content of specific components mostly contributes to the antioxidant potential (neutralization of DPPH and OH radical, FRAP value) of the examined tea mixture. Furthermore, if we consider the individual components found in the mixture, the greatest anti-α-amylase potential is attributed to the Phaseoli legumen, while the highest potential to inhibit α-glucosidase was recorded for Olivae folium. Generally, screening of the tested compounds enabled us to conclude that a high level of correlation exists between anti-α-amylase potential and the quantified amounts of total phenolics, as well as gallic acid, while the chlorogenic acid is most probably responsible for the inhibition of α-glucosidase activity. The antihyperglycemic activity seems to be almost exclusively exerted by the Phaseoli legumen and Olive folium extracts, which further implicates an insignificant inhibition potency of the other herbal components. Therefore, the high total ratio (40%, m/m) of Olivae folium and Phaseoli legumen in the evaluated tea mixture can be stated as fully justified. However, future in vivo research is required for further understanding of the antihyperglycemic activity mechanisms of secondary metabolites found in specified herbal components, as well as to evaluate their synergistic effect when applied in a form of tea mixture. This will allow us to make progress and further steps in potential development of functional food products and nutraceuticals.
Acknowledgements
This research was supported by the Ministry of Education, Science and Technological Development of the Republic of Serbia (grant number: 451-03-68/2020-14/200114).
References
- Protective effect of quercetin on hyperglycemia, oxidative stress and DNA damage in alloxan induced type 2 diabetic mice. Life Sci.. 2014;109:8-14.
- [CrossRef] [Google Scholar]
- American Diabetes Association, 2014. Diagnosis and classification of diabetes mellitus. Diabetes Care 37, 81–90.
- Dietary polyphenols as potential nutraceuticals in management of diabetes: a review. J. Diabetes Metab. Disord.. 2013;12
- [Google Scholar]
- The ferric reducing ability of plasma (FRAP) as a measure of ‘“antioxidant power”’: The FRAP assay. Anal. Biochem.. 1996;239:70-76.
- [CrossRef] [Google Scholar]
- Effect of processing on antioxidant contents in selected dry beans (Phaseolus spp. L.) LWT - Food Sci. Technol.. 2008;41:1541-1547.
- [CrossRef] [Google Scholar]
- Impact of origin and biological source on chemical composition, anticholinesterase and antioxidant properties of some St. John’s wort species (Hypericum spp., Hypericaceae) from the central Balkans. Molecules. 2013;18:11733-11750.
- [CrossRef] [Google Scholar]
- An in vitro and in vivo study of the α-amylase activity of phaseolamin. J. Med. Food. 2014;17:915-920.
- [CrossRef] [Google Scholar]
- Chemical composition and antioxidant/antidiabetic potential of Brazilian native fruits and commercial frozen pulps. J. Agric. Food Chem.. 2010;58:4666-4674.
- [CrossRef] [Google Scholar]
- Antidiabetic effects of natural plant extracts via inhibition of carbohydrate hydrolysis enzymes with emphasis on pancreatic alpha amylase. Expert Opin. Ther. Targets. 2012;16:269-297.
- [Google Scholar]
- Oxidative stress and stress-activated signaling pathways: a unifying hypothesis of type 2 diabetes. Endocr. Rev.. 2002;23:599-622.
- [CrossRef] [Google Scholar]
- Antioxidant activity and phenolic contents of Olea europaea L. leaves sprayed with different copper formulations. Food Chem.. 2007;103:188-195.
- [Google Scholar]
- Phytochemical properties and anti-proliferative activity of Olea europaea L. leaf extracts against pancreatic cancer cells. Molecules. 2015;20:12992-13004.
- [CrossRef] [Google Scholar]
- Review: Dietary phenolic compounds, health benefits and bioaccessibility. Arch. Latinoam. Nutr.. 2016;66:87-100.
- [Google Scholar]
- Rapid tests to assess the antioxidant activity of Phaseolus vulgaris L. dry beans. J. Agric. Food Chem.. 2005;53:3053-3056.
- [Google Scholar]
- Analysis of phenolic compounds in wild populations of bilberry (Vaccinium myrtillus L.) from Montenegro. J. Med. Plants Res.. 2011;5:910-914.
- [Google Scholar]
- Antioxidant activity of plant extracts containing phenolic compounds. J. Agric. Food Chem.. 1999;47:3594-3962.
- [Google Scholar]
- Problems associated with glucose toxicity: role of hyperglycemia-induced oxidative stress. World J. Gastroenterol.. 2009;15:4137-4142.
- [Google Scholar]
- Hypericum perforatum: synthesis of active principles during flowering and fruitification - novel aspects of biological potential. Evid.-Based Complement. Altern. Med.. 2017;2017
- [CrossRef] [Google Scholar]
- Ecologically and ontogenetically induced variations in phenolic compounds and biological activities of Hypericum maculatum subsp. maculatum. Hypericaceae. Brazilian J. Bot.. 2015;38:703-715.
- [CrossRef] [Google Scholar]
- Phenolic content and antioxidant activities of fruit extracts of Morus nigra L (Moraceae) from Southeast Serbia. Trop. J. Pharm. Res.. 2013;12:105-110.
- [Google Scholar]
- Changes in total polyphenol content and antioxidant capacity of stinging nettle (Urtica dioica L.) from spring to autumn. Period. Polytech. Chem. Eng.. 2020;64:548-554.
- [CrossRef] [Google Scholar]
- Polyphenol composition and antioxidant activity from the vegetable plant Artemisia absinthium L. Aust. J. Crop Sci.. 2013;7:1921-1926.
- [Google Scholar]
- Juniperus sibirica Burgsdorf. As a novel source of antioxidant and anti-inflammatory agents. Food Chem.. 2011;124:850-856.
- [CrossRef] [Google Scholar]
- Phenolic acids profiling and antioxidant potential of mulberry (Morus laevigata W., Morus nigra L., Morus alba L.) Leaves and fruits grown in Pakistan. Polish J. Food Nutr. Sci.. 2010;60:25-32.
- [Google Scholar]
- Development of a rapid resolution HPLC method for the separation and determination of 17 phenolic compounds in crude plant extracts. Cent. Eur. J. Chem.. 2011;9:133-142.
- [CrossRef] [Google Scholar]
- Bean cultivars (Phaseolus vulgaris L.) have similar high antioxidant capacity, in vitro inhibition of α-amylase and α-glucosidase while diverse phenolic composition and concentration. Food Res. Int.. 2015;69:38-48.
- [Google Scholar]
- Screening of α- Glucosidase Inhibitory Activity of Some Indonesian Medicinal Plants. Int. J. Med. Arom. Plants. 2013;3:144-150.
- [Google Scholar]
- Screening of plant extracts for antioxidant properties. Bot. serbica. 2011;35:43-48.
- [Google Scholar]
- Inhibition of key enzymes linked to type 2 diabetes and sodium nitroprusside induced lipid peroxidation in rats’ pancreas by phenolic extracts of avocado pear leaves and fruit. Int. J. Biomed. Sci.. 2014;10:210-218.
- [Google Scholar]
- Profiling of cholinesterase inhibitory and antioxidant activities of Artemisia absinthium, A. herba-alba, A. fragrans, Marrubium vulgare, M. astranicum, Origanum vulgare subsp. glandulossum and essential oil analysis of two Artemisia species. Ind. Crops Prod.. 2010;32:566-571.
- [CrossRef] [Google Scholar]
- Effects of the methanolic extracts of Zizyphus spina christi, Olea europaea and Morus alba leaves in Streptozotocin- induced diabetic rats. Egypt. J. Hosp. Med.. 2009;37:759-771.
- [Google Scholar]
- Phenolic compounds analysis of root, stalk, and leaves of nettle. Sci. World J.. 2012;2012
- [Google Scholar]
- Antioxidant activity, phenol and flavonoid contents of some selected Iranian medicinal plants. African J. Biotechnol.. 2006;5:1142-1145.
- [Google Scholar]
- Multicomponent phytotherapeutic approach gaining momentum: Is the “one drug to fit all” model breaking down? Phytomedicine. 2013;21:1-14.
- [Google Scholar]
- Stabilization of sunflower and olive oils with savory (Satureja kitaibelii, Lamiaceae) J. Food Nutr. Res.. 2020;59:259-271.
- [Google Scholar]
- Antidiabetic potential of medicinal plants and their active components. Biomolecules. 2019;9:551.
- [CrossRef] [Google Scholar]
- Quercetin and its metabolites improve vessel function by inducing eNOS activity via phosphorylation of AMPK. Biochem. Pharmacol.. 2012;84:1036-1044.
- [Google Scholar]
- Inhibition of platelet aggregation by some flavonoids. Thromb. Res.. 1991;64:91-100.
- [Google Scholar]
- Chemical and functional characterization of Tunisian Artemisia absinthium volatiles and non-volatile extracts obtained by supercritical fluid procedure. Int. J. Pharm. Clin. Res.. 2016;8:1178-1185.
- [Google Scholar]
- Inhibition of lipid peroxidation of herbal extracts (obtained from plant drug mixtures of Myrtilli folium, Phaseoli fructus sine seminibus and Salviae folium) used in type 2 diabetes mellitus. Acta Biol. Hung.. 2010;61:45-51.
- [Google Scholar]
- Antioxidant and antiproliferative properties of extract and fractions from small red bean (Phaseolus vulgaris L.) J. Food Nutr.. 2014;1:1-11.
- [Google Scholar]


