

Translate this page into:
Treatment of iron ore beneficiation plant process water by electrocoagulation
⁎Corresponding author. barun@iitism.ac.in (Barun Kumar Nandi)
-
Received: ,
Accepted: ,
This article was originally published by Elsevier and was migrated to Scientific Scholar after the change of Publisher.
Abstract
Process water collected from the iron ore beneficiation plant was treated by electrocoagulation (EC) process to make it suitable for reuse or safe for discharge. Experimental studies were carried out towards efficient removal of the various metal ions such as iron (Fe), chromium (Cr), copper (Cu), zinc (Zn), manganese (Mn), lead (Pb), aluminum (Al) from process water along with monitoring of total dissolved solids (TDS), turbidity, conductivity, salinity. The influence of various operating parameters of EC, such as electrode material, electrode configuration, current density, inter-electrode distance, and solution conductivity, were explored for effective treatment of process water. Experimental results showed that aluminum electrodes at monopolar mode with a current density of 68.50 A/m2, an inter-electrode distance of 1 cm, and solution conductivity of 1033 µS/cm were the ideal operating conditions to get treated water with a removal efficiency of 99.95%, 99.46%, 99.33%, 97.99%, 73.44% for Fe, Cr, Pb, Mn, and Cu ions respectively after 60 min of EC with electric energy consumption of 3.93 kWh/m3 and operating cost of 0.6115 US$/m3. X Ray Diffraction analysis of EC generated sludge confirmed the exclusion of major elements like Fe, Cr, Cu, Zn, Mn, Pb, Al as well as trace elements such as Nickel, Cobalt, Magnesium, Titanium, Vanadium, Zinc, Neodymium, Samarium, Yttrium, etc. from process water.
Keywords
Electrocoagulation
Process water
Wastewater treatment
Metal ion removal
Mineral processing

1 Introduction
Release and transport of metal ions from active mines and mineral beneficiation plants to the environment pose a threat to different water bodies. Water originated from mineral processing units contains different types of metal ions, organic compounds, total dissolved solids (TDS), etc. as major pollutants (Brooks et al., 2019). Post beneficiation process, such wastewater known as process water is either recycled or stored in tailings ponds after primary treatment (Wu et al., 2019). During the longer duration of storage in tailing ponds, contaminated water percolates through the soil and eventually reaches the groundwater (Brooks et al., 2019). During heavy rain, some of the water overflows the tailing ponds and enters various surface water bodies like ponds, rivers, canals, etc. Release of such metal ion-contaminated water in the surrounding environment seriously affects agriculture and hazardous for human health due to its consumption through the food chain. In many cases, mineral processing plants face difficulty to get massive amounts of freshwater for plant operation. However, if process water is treated suitably to remove various metal ions and treated water is recycled to plant, quantity of freshwater consumption may be reduced.
Substantial numbers of research work have been reported in the literature on the effect of mine waters, particularly acid mine water to nearby water bodies affecting the water quality and their remediation (Arefieva et al., 2019; Naidu et al., 2019; Qina et al., 2019) Suitable treatment techniques for the treatment of acid mine water also have been reported by many authors using adsorption, electrocoagulation, membrane separation, etc. (Silva et al., 2012; Nariyan et al., 2017). Most of the research work has conveyed that the treatment of such water is possible even on at large scale. However, very little attention has been given on treatment and recycling of mineral beneficiation plant process water. Many researchers proposed conventional techniques like flocculation- coagulation, fenton process and chemical flocculation along with the adsorption process to remove metal ions from contaminated water (Shahedi et al., 2020; Elnakar and Buchanan, 2020). For large-scale application, adsorption techniques have limitations in terms of selectivity of pollutants and their adsorption capacity. Except for activated carbon, clay-based adsorbents are highly selective for any particular metal ion or organic contaminants. In this context, electrocoagulation (EC) based separation can be applied for all types of pollutants, including metal ions, organic pollutants, TDS, turbidity, etc. In recent years EC has been evolved as a promising method for water treatment for various researchers (Govindan et al., 2020; Silva et al., 2018). During EC process, in situ production of insoluble metal hydroxide flocs such as (Al(OH)3(S) or Fe(OH)3(S)) occur depending upon the anode material (Al or Fe). Summary of such electrochemical reactions (for Fe and Al anode) are summarized below (Canizares et al., 2007):
These freshly generated metal hydroxide complexes (Al(OH)3(S) or Fe(OH)3(S)) have the high surface area and high ionic characteristics. Presence of freshly generated various active ionic species helps in ionizing the other organic and inorganic species present in water and form water-insoluble materials. As a result, freshly generated metal hydroxide complexes (Al(OH)3(S) or Fe(OH)3(S)) easily trap different types of ionic pollutants such as ions of Fe, Cr, Pb, Mn, etc. present in water and eventually separated them as water-insoluble sludge after undergoing coagulation adsorption, flocculation, and co-precipitation (Das and Nandi, 2020). EC process bears several advantages like minimum expenditure, easier installation, low chemical consumption, more cost-effective and lesser treatment time. Also, EC produces very less amount of sludge as compared to other coagulation techniques, readily settleable and easy to dewater (Hashim et al., 2017). Although some work has been reported on the treatment of acid mine drainage and metal ion rich mine wastewater using conventional process, almost no research work has been reported on iron ore beneficiation plant process water. As a result, most of the iron ore beneficiation plant faces difficulty in discharging large volumes of water as well as a shortage of fresh water to operate the plant. Hence, suitable treatment technologies needs to be explored to operate iron ore beneficiation plant in environment-friendly manner.
The present work aims to verify the applicability of EC process towards the treatment of mineral beneficiation unit process water. Iron ore process water obtained from the beneficiation plant was treated using EC process. Impact of various operating conditions like most effective pair of the electrode, electrode configuration, current density (j), inter-electrode distance (id), and solution conductivity (S) on metal ions removal as well as various water quality parameters such as TDS, conductivity, salinity have been assessed. Kinetic analysis of EC has been carried out towards deeper analysis of the effect of current density on metal ion removal. Overall, the present study is expected to improve the water management system in different mineral processing industries and consequently contribute in reducing the contamination of groundwater as well as surface water due to discharge of such pollutant rich water in the nearby areas.
2 Materials and methods
About 100 L of iron ore beneficiation plant process water was collected from iron ore beneficiation plant located in Odisha state, India. After collection, water was brought to the laboratory and kept in a tank for two days to allow suspended particles to settle down. Further, water was filtered using Whatman 1 filter paper (pore size: 11 μm) to remove any suspended solids. EC experiments were conducted using a 2 L beaker considering 1 L of water for 60 min. The schematic of the experimental setup is shown in Fig. 1a. Aluminum (Al, 99% purity) and Iron (Fe, 99% purity) plates with 99% purity and a submerged area of 0.0146 m2 (length: 0.073 m; width: 0.1 m, thickness: 0.001 m) were used as electrodes. Three different electrode configurations, namely monopolar (M) using two electrodes, series monopolar (SM) using four electrodes and series bipolar (SB) using four electrodes as shown in Fig. 1a–c respectively, have been used. All the experiments were conducted at room temperature (25 ± 2 °C) and the natural pH (pH: 7.09) of the water. Magnetic stirrer (Model: SPINIT Digital MC-02, TARSON) operating at 200 RPM was used for uniform mixing of water and flocs during EC. DC power source (Model: L6410S, APLAB) was used for providing the desired electricity. Sodium chloride (NaCl) salt was added to enhance the conductivity of the water. Table 1 presents the various range of operating conditions considered in the study. About 3–5 ml of water sample was collected at an interval of 10 min and filtered using filter paper and used for further analysis. After every experiment, the electrode surface were cleaned using abrasive paper and followed by diluted hydrochloric acid and water wash to remove all the impurities. Untreated and treated water sample was analyzed for the presence of different metal ions (Cr, Fe, Mg, Zn, Cu, Pb and Al) using Atomic Absorption Spectrometer (Model: iCE 3000 Series, Thermo scientific) after calibrating with a standard solution for each metal ion (Das and Nandi, 2020). TDS, salinity, conductivity, and pH of the untreated water and treated water were measured using a digital multimeter (Model: PC2700, EUTECH) (Das and Nandi, 2019a). Turbidity was estimated using a turbidity meter (Model: TN-100, Thermo Scientific) (Das and Nandi, 2020). For the characterization of the generated sludge, XRD analysis was conducted using the XRD analyzer available at CIMFR, Dhanbad. In the present work all the experiments were performed thrice and ±0.50% variations of individual values were observed. The removal efficiency of each metal ion is calculated using the following equation:
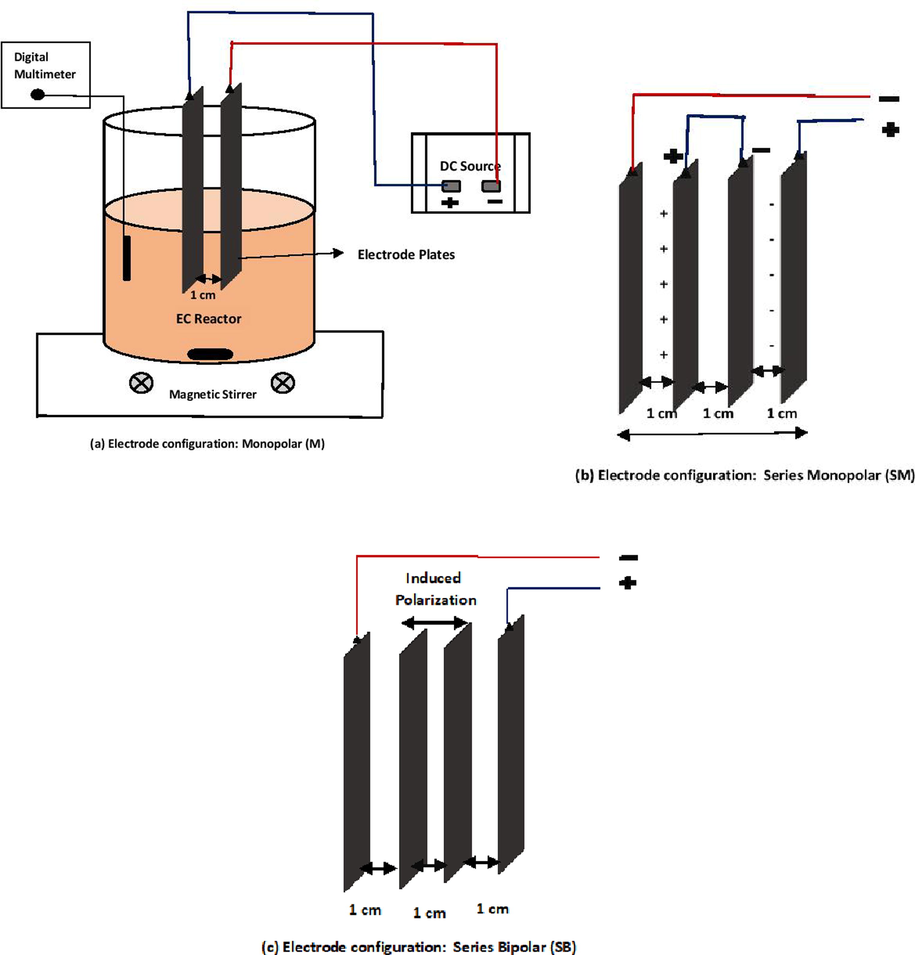
Schematic diagram of the experimental set-up with (a) Monopolar (M) electrode configuration, (b) Series monopolar (SM) electrode configuration and (c) Series bipolar (SB) electrode configuration.
Effect of operating conditions studied
Range considered
Conditions kept constant
Electrode material (Anode/Cathode)
Al/Al, Fe/Fe, Al/Fe, Fe/Al
Mode: M, j-68.50 A/ m2, id-1 cm, S-1033 µS/cm
Electrode configuration mode
M, SM, SB
Electrode: Al/Al, j-68.50 A/m2, id-1 cm, S-1033 µS/cm
Current density (j, A m−2)
34.25, 51.37, 68.50, 86.20 A/m2
Mode: M, Electrode: Al/Al, id-1 cm, S- 1033 µS/cm
Inter-electrode distance, (id, cm)
1.0, 1.5, 2.0 cm
Mode: M, Electrode: Al/Al, j-68.50 A/m2, S-1033 µS/cm
Solution conductivity (S, µS cm−1)
1033, 1454, 1888 µS/cm
NaCl: 0.5, 0.75, 1.0 g/LMode: M, Electrode: Al/Al, j-68.50 A/m2, id-1 cm
Electric energy consumption (EEC) per unit volume (KWh/m3) for various operating condition was estimated by the following Eq. (10) (Das and Nandi, 2019b):
To justify the application of EC process economic evaluation of the present study was estimated by considering the cost of energy consumed and electrode material as these are the major components of operating cost for lab scale units as (Al-Qodah and Al-shannag, 2017):
3 Results and discussions
3.1 Characterization of water before treatment
Table 2 shows the concentrations of various metal ions and other water quality parameters present in process water collected from iron ore beneficiation plant followed by settling and filtration. It is observed from the results that the concentration of total Fe, Cr, Pb, Mn and turbidity are found to be 115.24 mg/L, 7.10 mg/L, 2.68 mg/L, 0.96 mg/L and 977 NTU respectively. Overall, values of Cu and Al ions, TDS, conductivity, pH, etc. were found to be within world health organization (WHO) permissible limit. As the concentration of Fe, Cr, Pb and Mn were above the permissible limit, removal of Fe, Cr, Pb and Mn were analyzed in-detailed in the present study.
Sl. No
Parameters
Values
Permissible limit (WHO, 2004)
1
Fe (mg/L)
115.24
0.30
2
Cr (mg/L)
7.10
0.05
3
Cu (mg/L)
0.27
1.3
4
Pb (mg/L)
2.68
0.01
5
Mn (mg/L)
0.96
0.05
6
Al (mg/L)
24.75
5
7
Silica (mg/L
1.29
5–25
8
TDS (mg/L)
130.6
500–700
9
TSS (mg/L)
43,693
25
10
Turbidity (NTU)
977
<1
11
Conductivity (µS/cm)
178.3
200–2000
12
Resistivity (KΩ)
4.566
–
13
Salinity (mg/L)
95.36
–
14
pH
7.09
6.5–8.5
3.2 Effect of anode and cathode material:
To evaluate the effect of electrode material on metal ions removal, different combination on anode and cathode material were used. Fig. 2a-d shows the removal efficiency of Fe, Cr, Pb and Mn at various electrode combinations after 60 min of EC. From all the figures, it can be observed that Al/Al combinations give better removal for Fe, Pb and Mn ions and Fe/Fe combination gives better Cr ions removal. From Fig. 2a it is observed that the removal efficiency of Fe after 60 min EC was 99.95% for Al/Al electrode combination compared to 98.34%, 99.29% and 99.92% for Fe/Fe, Al/Fe and Fe/Al electrode combinations, respectively. From Fig. 1b it is observed that removal efficiency of Cr ions after 60 min of EC were 99.46%, 99.68%, 99.42% and 99.54% for Al/Al, Fe/Fe, Al/Fe and Fe/Al, respectively. Removal efficiency of Pb ions after 60 min of EC were 99.33%, 96.92%, 98.13% and 97.48% for Al/Al, Fe/Fe, Al/Fe and Fe/Al, respectively (Fig. 2c). For Mn ions removal efficiency were 97.99%, 93.54%, 95.61% and 90.37% Al/Al, Fe/Fe, Al/Fe and Fe/Al, respectively (Fig. 2d). Higher Cr ions removal for Fe/Fe combinations was due to faster reduction of total chromium ions to trivalent chromium ions in the presence of Fe(OH)3 flocs (Lu et al., 2016). Overall, better performance of Al/Al electrode combinations over Fe/Fe and other electrode combinations was due to higher electro dissolution of the aluminum anode at the same electric voltage applied and generation of more coagulants, which enhances Fe, Cr, Pb and Mn ions removal. In other words, Al possesses higher electrode oxidation potential (E° = −1.66 V) in the electrochemical series of elements compared to Fe (E° = +0.44 V), it loses electrons easily compared to Fe which makes the coagulation, adsorption and precipitation process faster (Das and Nandi, 2019a). Table 3 shows the final values of TDS, turbidity, conductivity, salinity, Al ions and Cu ions after 60 min of EC treatment for various combinations of electrodes. It is seen that for Al/Al combination, all the values are lower than other combinations, but all the values are found within the permissible limit (Table 2). Since Al/Al electrode combination shows higher removal efficiency for Fe ions with highest initial concentration of 115.24 mg/L and adequate removal efficiency for Cr, Pb and Mn ions also, Al/Al pair of the electrode was used for further experiments.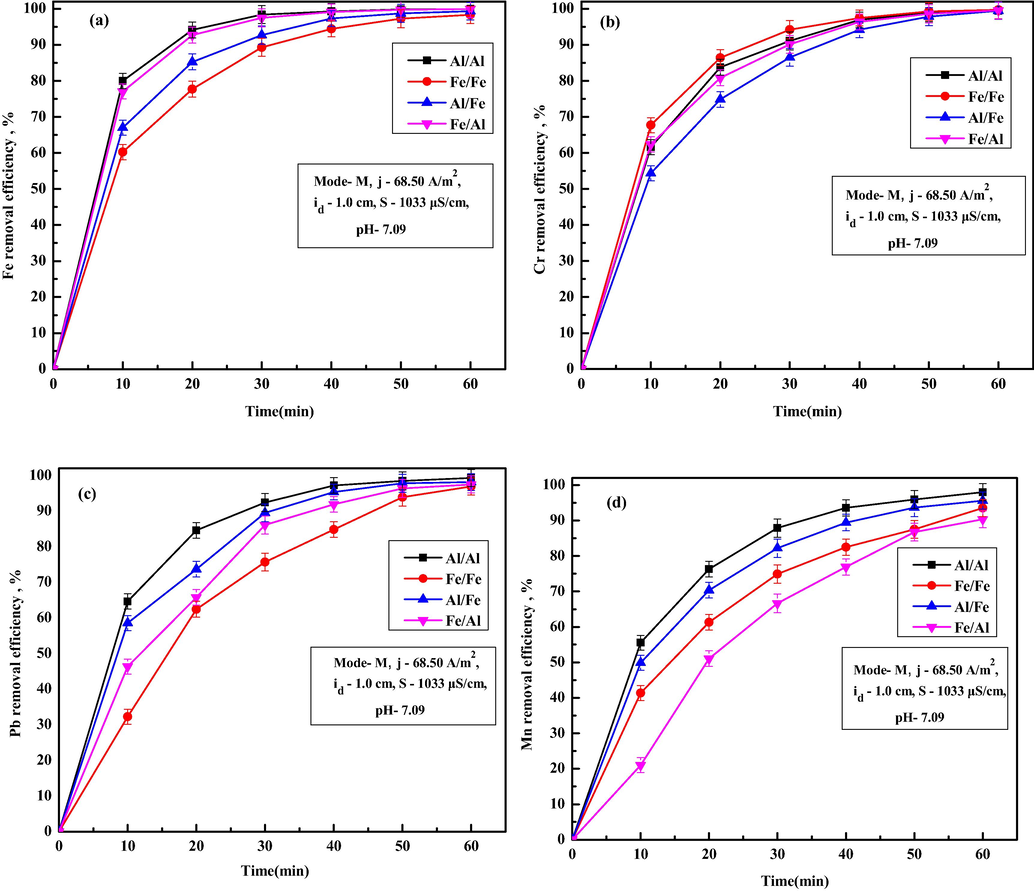
Effect of different metal combinations as anode/cathode on removal of (a) Fe, (b) Cr, (c) Pb and (d) Mn ions.
Electrode material
TDS (mg/L)
Turbidity (NTU)
Salinity (mg/L)
Conductivity (µS/cm)
Al ions (mg/L)
Cu ions (mg/L)
EEC (kWh/m3)
Al/Al
85.45
0.89
92.61
522
0.72
0.07
3.93
Fe/Fe
106.21
0.94
98.21
574
1.27
0.005
4.66
Al/Fe
102.35
0.92
101.5
571
1.67
0.03
4.33
Fe/Al
110.41
0.98
105.3
612
1.43
0.008
4.06
3.3 Effect of electrode configuration
Fig. 3a–d shows the variations of residual ion concentration of Fe, Cr, Pb and Mn ions with M, SM and SB electrode configuration using Al/Al electrodes. From Fig. 3a–d, it is observed that, SB electrode configuration gives faster ion removal compared to M and SM. Removal efficiency of Fe ion were 99.95%, 99.98%, and 99.98% for M, SM and SB after 60 min of EC. For Cr ions removal efficiency were 99.46%, 99.63% and 99.84% for M, SM and SB (Fig. 3b). Similarly, for Pb ions removal efficiency were 99.33%, 99.70% and 99.83% (Fig. 3c), for Mn ions removal efficiencies were 97.99%, 99.12% and 99.35% (Fig. 3d) for M, SM and SB, respectively. Better ion removal efficiency for SM and SB mode was due to availability of higher electrode surface area and eventually better flocs generation. Better ion removal from SB mode compared to SM mode was due to higher electro dissolution of the anodes at bipolar mode (Modirshahla et al., 2008). Table 4 infers that the final value of TDS (103.27 mg/L) and turbidity (1.24 NTU) are slightly higher for SB mode compared to M mode. Higher values of TDS and turbidity for SM and SB mode were due to the presence of excessive flocs, which acts as a secondary pollutant to the water. Thus, the results show that all the values of final TDS, turbidity, conductivity, salinity, Al ions and Cu ions, were found within the permissible limit for all the modes. EEC for M, SM and SB was found to be 3.93, 7.47 and 11 kWh/m3 with corresponding electrode potential of 11.8, 22.4 and 33 V, respectively. Such observations inferred that EEC increases with increase in number of electrode plates due to increase in necessary electrode potential. The operating cost at electrode configuration of M, SM and SB are estimated as 0.6115, 0.9429 and 1.2733 US$/m3 respectively. To keep TDS, turbidity and salinity values on the lower side and considering the complexity of using more than two electrodes, further experiments were conducted using M mode, which also give satisfactory removal of Fe, Cr, Pb and Mn ions.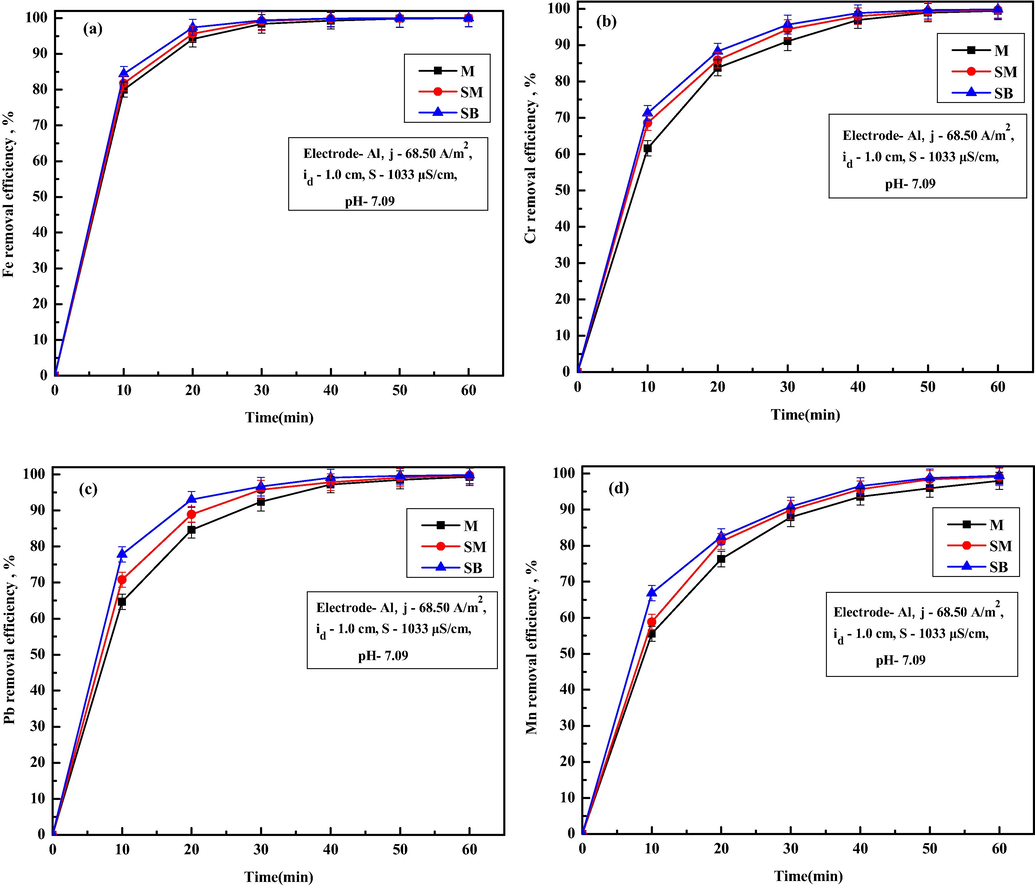
Effect of different electrode configuration on removal of (a) Fe, (b) Cr, (c) Pb and (d) Mn ions.
Electrode configuration
TDS (mg/L)
Turbidity (NTU)
Salinity (mg/L)
Conductivity (µS/cm)
Al ions (mg/L)
Cu ions (mg/L)
EEC (kWh/m3)
OC (US$/m3)
M
85.45
0.89
92.61
522
0.72
0.07
3.93
0.6115
SM
92.42
0.97
93.34
501
0.79
0.02
7.47
0.9429
SB
103.27
1.24
94.35
478
0.69
0.01
11
1.2733
3.4 Effect of current density
Current density is an influential operating condition in EC as it controls flocs generation rate and pollutant removal rate. Fig. 4a-d shows the variations of removal efficiencies of Fe, Cr, Pb and Mn ion in treated water for various current densities. From Fig. 4a, it is observed that the removal efficiency Fe ion increases from 99.69% to 99.97% as CD increases from 34.25 to 86.20 A/m2. Similar results were also observed for Cr, Pb and Mn ions (Fig. 4b–d). For all the ions, permissible limits were attained at almost 40 min for higher CD of 68.50 A/ m2 and above. Removal efficiency were 95.44%, 96.50%, 99.46% and 99.65% for Cr ions, 97.48%, 97.86%, 99.33% and 99.61% for Pb ions and 78.82%, 83.99%, 97.99% and 98.87% for Mn ions for CD of 34.25, 51.37, 68.50 and 86.20 A/m2, respectively after 60 min of EC. An increase in metal ions removal with current density were attributed to the increase of in situ coagulant production with larger size and surface area due to faster dissolution of the anode, which results in rapid pollutant ions removal (Akbal and Camcı, 2011). Variations in removal efficiency of Al and Cu ions for various current densities are shown in Fig. 6a and b. It is observed from Fig. 6a that, removal efficiency of Al ions increases to 98%, within 10 min of EC for current density of 86.20 A/m2 and then varied slightly during the entire EC duration. Cu ions concentration decreases gradually with EC time. Obtained values of TDS, turbidity, conductivity, salinity, Cu ions, Al ions and final pH after 60 min of EC for different current densities are summarized in Table 5. From Table 5, it can be seen that, final TDS varied from 101.23 to 79.12 mg/L, conductivity decreased from 656 to 498 µS/cm, turbidity reduced from 10.1 to 0.70 NTU, salinity varied from 97.14 to 88.24 mg/L, copper ions decreased from 0.09 mg/L to 0.04 mg/L, Al ions varied from 0.41 to 0.75 mg/L and final pH varied from 7.25 to 7.52 as the current density increases from 34.25 to 86.20 A/m2. The decrease in TDS, turbidity, conductivity, salinity, Cu ions with an increase in current density was due to the increased adsorption or entrapment of the pollutant materials by the excess coagulant available in solution at higher current density. Minor increase in Al ions at higher current density is due to the presence of surplus amount of aluminum hydroxide flocs unutilized after EC. However, the presence of excess amounts of Al ions is not desirable as it acts as a secondary pollutant in treated water. The EEC and OC increases from 0.13 to 6.28 kWh/m3 and 0.1265 to 0.8626 US$/m3 as CD increases from 34.25 to 86.20 A/m2. Hence, the use of higher current density needs to be avoided to maintain desirable water quality. Hence, a moderate current density of 68.50 A/m2 with EEC of 3.93 kWh/m3 and OC of 0.6115 of US$/m3 was used for further experiments as desirable removal efficiency up to permissible limit. Such EEC and OC values are lower compared to the EEC and OC reported by Al-Qodah et al. (2020a, 2020b), 2019; Elazzouzi et al. (2019), Dhadge et al. (2018) and many others during treatment of wastewater using hybrid process. Al-Qodah et al. (2020b) reported that combined EC process with granular activated carbon for removal of acid dye at current density of 109.14 A/m2 gives 20% higher removal efficiency than EC alone but at extremely higher operating cost of 5.033 $/Kg. Elazzouzi et al. (2019) reported that combined EC-floatation process for urban wastewater treatment at optimum condition gives operating cost of 0.80 $/kg and 0.82 $/kg using Al and Fe electrodes. Dhadge et al. (2018) reported that hybrid process of EC and MF gives 98.74%, 95.65%, 93.2% and 100% removal for iron, arsenic, fluoride and microorganisms at current density of 625 A/m2 and operating cost of 7.91 US$/m3.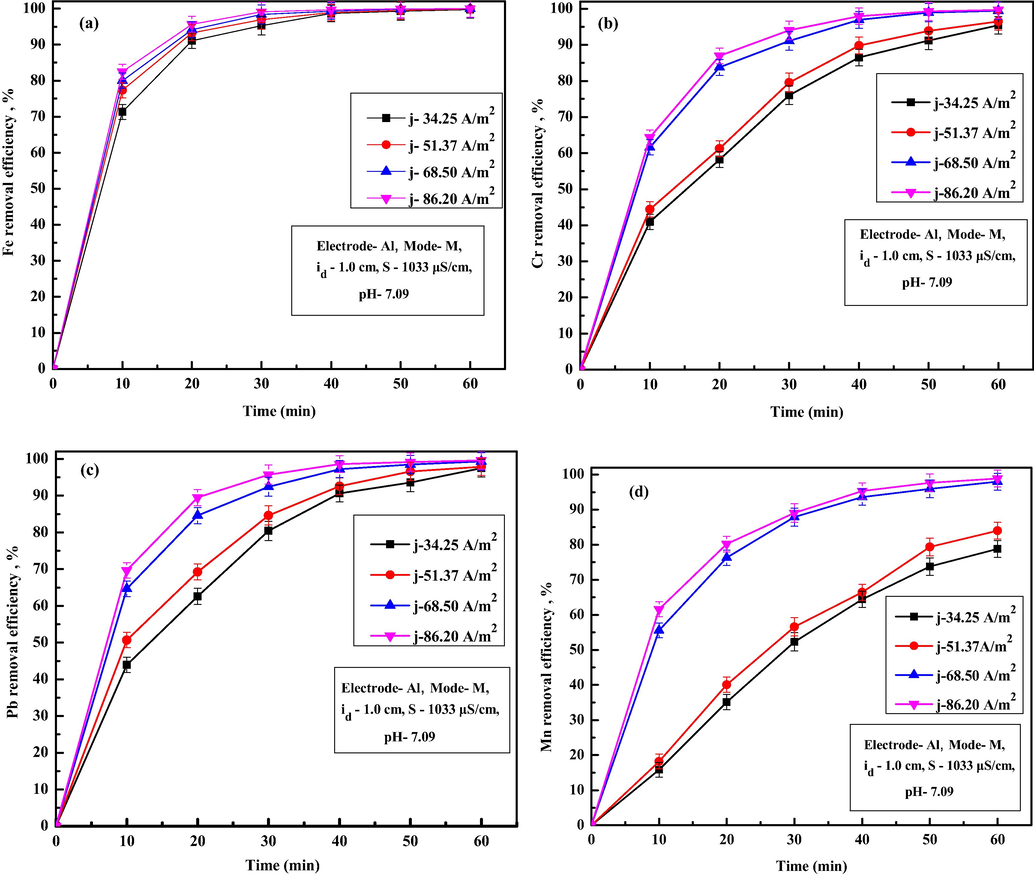
Effect of current densities on removal of (a) Fe, (b) Cr, (c) Pb and (d) Mn ions.
Current density (A/m2)
TDS (mg/L)
Turbidity (NTU)
Salinity (mg/L)
Conductivity (µS/cm)
Al ions (mg/L)
Cu ions (mg/L)
pH
EEC (kWh/m3)
OC (US$/m3)
34.25
101.23
10.01
97.14
656
0.41
0.09
7.25
0.13
0.1265
51.37
92.33
5.02
94.25
596
0.65
0.08
7.28
2.45
0.4009
68.50
85.45
0.89
92.61
522
0.72
0.07
7.36
3.93
0.6115
86.20
79.12
0.70
88.24
498
0.75
0.04
7.52
6.28
0.8626
To verify the kinetics of individual metal ions removal, first order kinetic model and second order model were verified. However, it was observed that individual metal ion removal during EC were apparently following first-order kinetic model as follows (Das and Nandi, 2020):
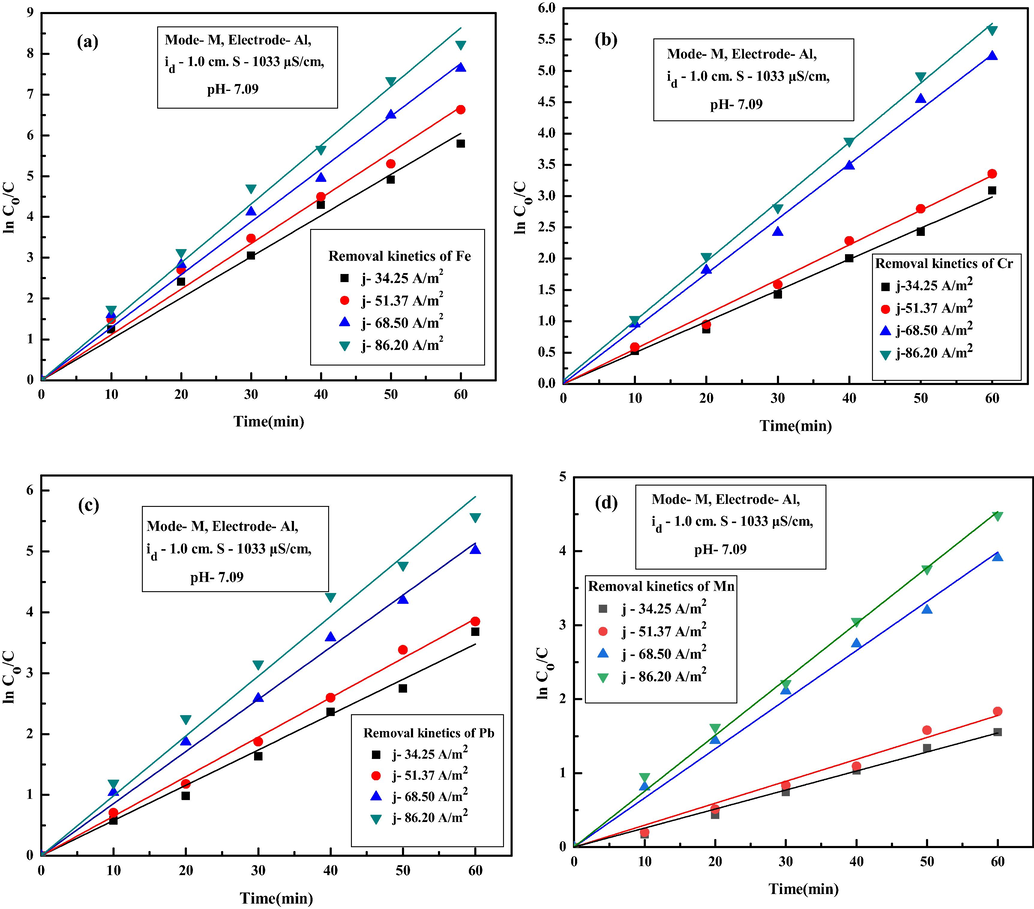
First-order kinetic model for removal of (a) Fe, (b) Cr, (c) Pb and (d) Mn ions for different current density.
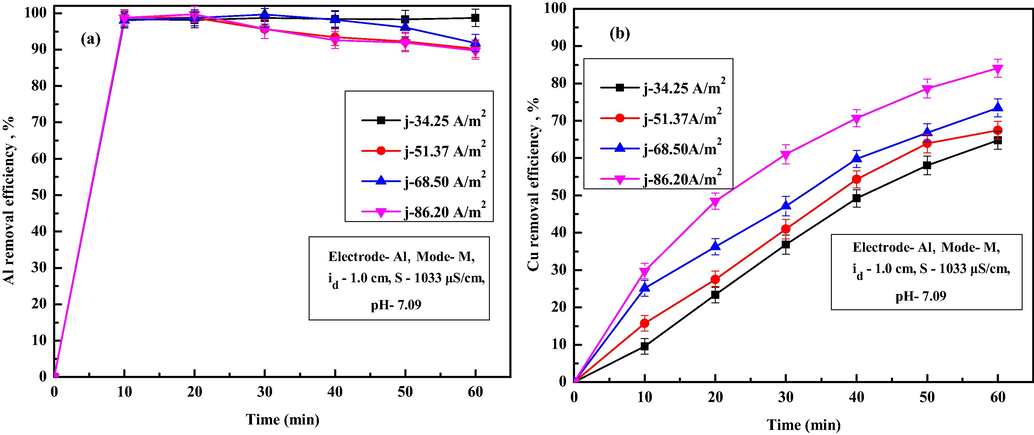
Variation in removal efficiency at various CD of (a) Aluminum and (b) Copper.
Current density (A/m2)
Rate constant, (k, min−1)
Fe
Cr
Pb
Mn
34.25
0.1008
0.0497
0.0580
0.0257
51.37
0.1116
0.0555
0.0649
0.0297
68.50
0.1294
0.0877
0.0857
0.0664
86.20
0.1469
0.0936
0.0984
0.0756
3.5 Effect of inter-electrode distance
Different inter-electrode distances (id) of 1, 1.5 and 2 cm were used to identify the effect of inter-electrode distance on Fe, Cr, Pb and Mn ions removal, and results are shown in Fig. 7a–d. It is observed from Fig. 7a that removal efficiency of Fe ion decreased from 99.95 to 99.85% with an increase in id from 1.0 to 2.0 of 60 min of EC. Similar trends of results are also observed for removal of Cr ions (decreased from 99.46% to 93.75%, Fig. 7b), Pb ions (decreased from 99.33% to 98.23%, Fig. 7c), and Mn ions (decreased from 97.99% to 85.44% Fig. 7d). An increase in residual ion concentration with id was due to decreases in electrostatic effects of generated flocs. With an increase in id, electron transport between the electrodes gets slowed down, flocs generation rate reduced and finally, pollutant ion capture by flocs decreases. Obtained values of TDS, turbidity, conductivity, salinity, Cu ions and Al ions after 60 min of EC for different id are summarized in Table 7. From Table 7, it can be observed that final TDS varied from 85.45 to 96.47 mg/L, conductivity varied from 522 to 578 µS/cm, turbidity varied from 0.89 to 2.63 NTU, salinity varied from 92.61 to 102.69 mg/L, copper ions varied from 0.07 to 0.10 mg/L and Al ions varied from 0.7225 to 0.6939 mg/L as id increased from 1 to 2 cm. Increase in TDS, turbidity, conductivity, salinity, Cu ions with an increase in inter-electrode distance was due to reduced electrostatic effects of generated flocs and pollutant materials. Minor decrease in Al ion concentration with an increase in id inferred better flocs utilization due to slower EC process. Since higher id needs higher voltage to maintain the necessary current density and removal efficiency of most of the ions decreased, a minimal inter-electrode distance of 1 cm was used for all the further experiments.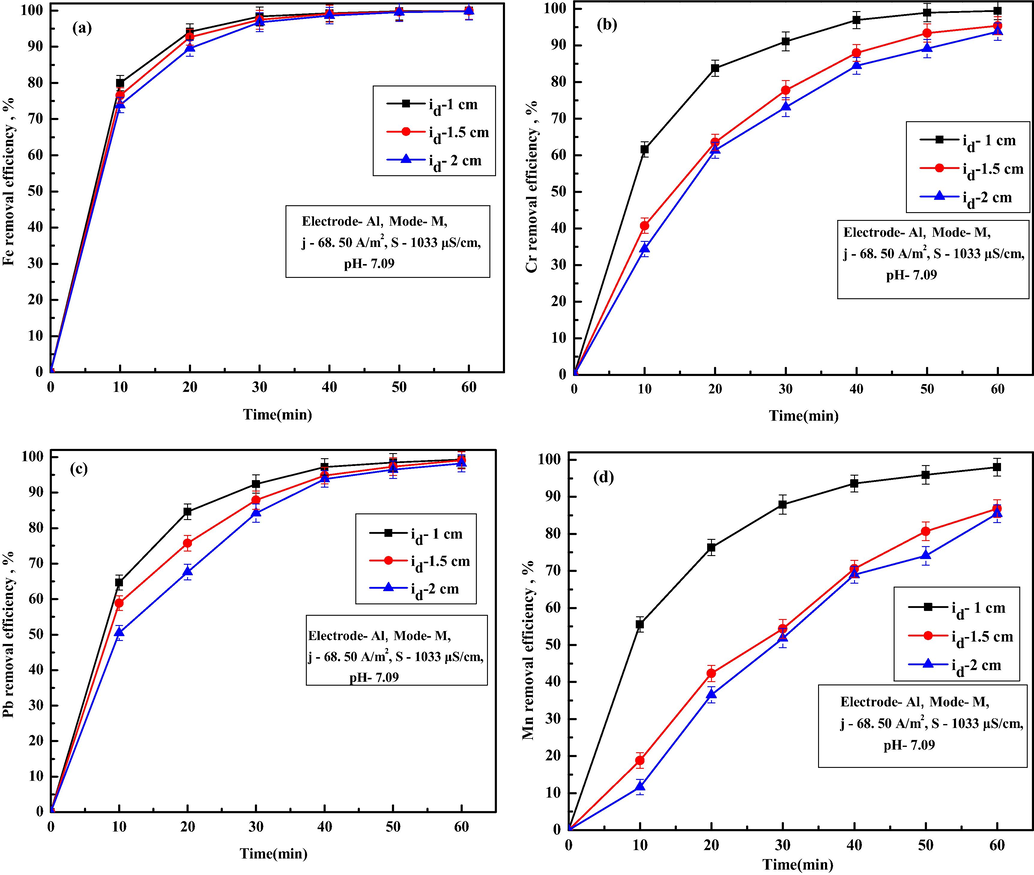
Effect of different inter-electrode distance on removal of (a) Fe, (b) Cr, (c) Pb and (d) Mn ions.
Inter-electrode distance (cm)
TDS (mg/L)
Turbidity (NTU)
Salinity (mg/L)
Conductivity (µS/cm)
Al ions (mg/L)
Cu ions (mg/L)
EEC (kWh/3)
1.0
85.45
0.89
92.61
522
0.72
0.07
3.93
1.5
91.28
1.53
96.56
556
0.70
0.08
5.8
2.0
96.47
2.63
102.69
578
0.69
0.10
7.5
3.6 Effect of solution conductivity
Since electrical conductivity of process water was low (178.3 µS/cm), some salts need to be added in process water to keep the applied voltage on lower side to maintain necessary current density. In this work, NaCl was added to improve the electrical conductivity of untreated water. For this purpose, experiments were performed with varying NaCl dose of 0.5, 0.75 and 1 g/L to obtain overall conductivity of 1033, 1454 and 1888 µS/cm. Further, experiments were performed with a current density of 68.50 A/m2 and corresponding Fe, Cr, Pb and Mn removal trends are shown in Fig. 8a–d. It is observed from Fig. 5a–d that overall Fe, Cr, Pb and Mn ion removal efficiency rapidly with an increase in solution conductivity. From Fig. 8a, it is observed that the removal efficiency of Fe ion varied from 99.95 to 99.98% with an increase in conductivity from 1033 to 1888 µS/cm after 60 min of EC. Similar trends of results are also observed for removal of Cr ions (increased from 99.46% to 99.85%), Pb ions (increased from 99.33% to 99.79%), and Mn ions (increased from 97.99% to 99.02%). The permissible limit of all the ions was achieved at lower conductivity at 1033 µS/cm at almost 50 min of EC. The increase in ion removal efficiency with the rise in solution conductivity was due to an increase in ionic activity in solution at higher electrical conductivity, which enhances the pollutant ion removal (Das and Nandi, 2019b). At higher conductivity, higher anodic dissolution occurs, which increases flocs generation rate and ion removal becomes faster. Obtained values of TDS, turbidity, conductivity, salinity, Cu ions and Al ions after 60 min of EC for different conductivity are summarized in Table 8. From this table, it can be observed that final TDS decreased from 85.45 to 72 mg/L, turbidity decreased from 0.89 to 0.79 NTU, copper ions increased from 0.07 to 0.01 mg/L, residual conductivity risen from 522 to 547 µS/cm, salinity increased from 92.61 to 97.25 mg/L, and Al ions increased from 0.72 to 0.75 mg/L with the increase in conductivity from 1033 to 1888 µS/cm. Higher values of residual conductivity, salinity and Al ions were due to use of additional NaCl addition and higher amounts of
flocs generation. Considering the presence of higher amount residual Al ions as well as higher conductivity and salinity, lower solution conductivity of 1033 µS/cm was used for all the further experiments.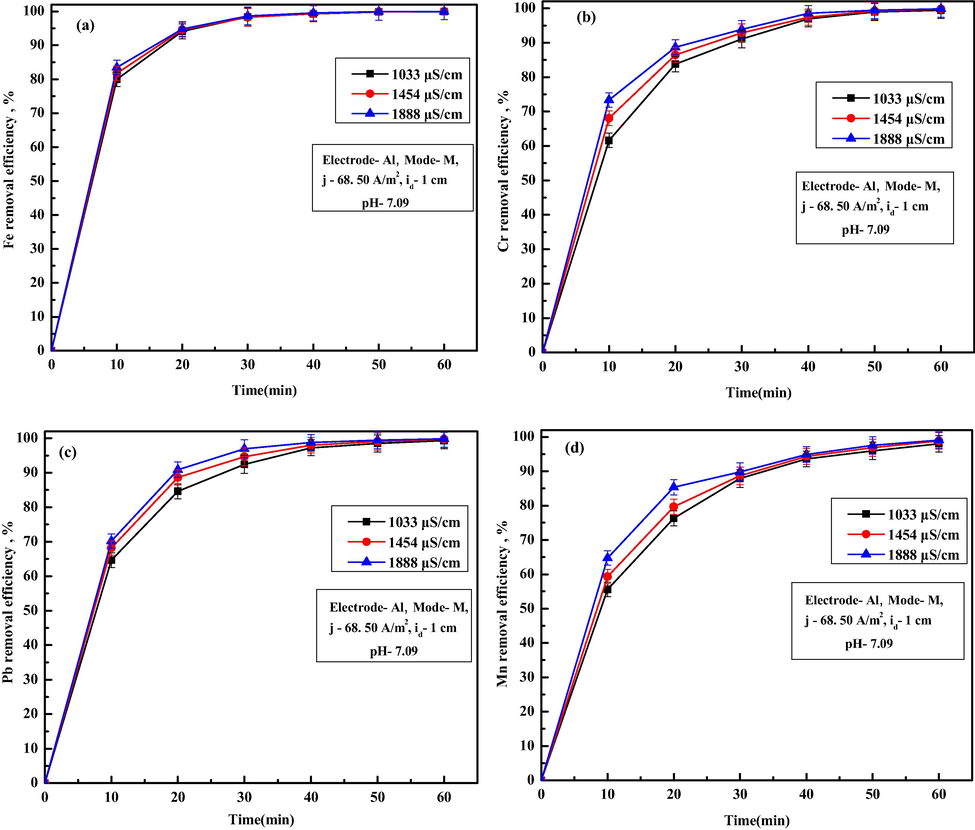
Effect of solution conductivity on removal of (a) Fe, (b) Cr, (c) Pb and (d) Mn ions.
Initial conductivity (µS/cm)
TDS (mg/L)
Turbidity (NTU)
Salinity (mg/L)
Conductivity (µS/cm)
Al ions (mg/L)
Cu ions (mg/L)
EEC (kWh/m3)
1033
85.45
0.89
92.61
522
0.72
0.07
3.93
1454
78
0.84
94.35
532
0.74
0.02
2.86
1888
72
0.79
97.25
547
0.75
0.01
2.4
3.7 Characterization of EC generated sludge
Apart from Fe, Cr, Pb, Mn, Cu, Al ions, mineral beneficiation process water may contain many metal ions in traces. So, it was necessary to identify the removal of various other metal ions present in water at a very lower quantity by EC. For this purpose, EC generated sludge was collected, dried and further XRD analysis was carried out to identify the presence of various metallic phases and results are shown in Fig. SM-4. All the XRD peaks present in the spectrum were matched with the JCPDS (Joint Committee on Powder Diffraction Standards) (JCPDS 1997) database file and results are summarized in Table 9. It can be observed from Fig. 9 that many metallic compounds of aluminum, iron, nickel, magnesium, cobalt, zinc, calcium, chromium, copper, manganese and silicide are present with higher intensities. Also, many low-intensity peaks corresponding to various other metals like titanium, samarium, galium, yttrium, etc. were also identified as observed from Table 9. Presence of all such metallic phases in sludge confirmed the removal of major metal ions like Fe, Cr, Pb, Mn and Cu along with other ions with trace concentrations such as nickel, cobalt, magnesium, titanium, vanadium, phosphide, zinc, neodymium, samarium, yttrium, etc. from process water. Such observations indicate that Al(OH)3 coagulant formed during EC entraps most of the impurities and ions present in the process water.
Sl. No
Reference Code
PDF index name
Chemical formula
Sl No
Reference Code
PDF index name
Chemical formula
1
PDF-00-038-1027
Aluminum Manganese
Al86Mn14
18
PDF-00-008-0269
Magnesium Zinc
Zn3Mg7
2
PDF-00-043-1154
Aluminum Titanium Vanadium
Al3Ti0.8V0.2
19
PDF-00-044-1288
Titanium
Ti
3
PDF-01-072-2074
Calcium Nickel Silicon
CaNi0.5Si1.5
20
PDF-00-021-0759
Aluminum Copper Neodymium
AlCuNd
4
PDF-01-072-2046
Calcium Nickel Silicon
CaNi2Si2
21
PDF-00-034-0400
Aluminum Iron Samarium
Al7Fe5Sm
5
PDF-00-013-0450
Calcium Magnesium
CaMg2
22
PDF-00-040-1111
Aluminum Manganese Silicide
Al85Mn14Si
6
PDF-00-033-0402
Chromium Phosphide
Cr12P7
23
PDF-00-020-0072
Aluminum Yttrium
Y3Al
7
PDF-00-044-1088
Iron Nickel
Fe0.96Ni0.056
24
PDF-01-072-1027
Cerium Nickel Silicon
Ce3Si2Ni8
8
PDF-00-003-0987
Copper Magnesium
Cu2Mg
25
PDF-00-047-1012
Chromium Cobalt Iron Vanadium
Co15Cr23 Fe57 V5
9
PDF-00-018-0459
Copper Titanium
Ti2Cu3
26
PDF-00-030-0456
Cobalt Samarium
Co2Sm
10
PDF-00-029-0523
Cobalt Zinc
CoZn13
27
PDF-00-037-1037
Copper Neodymium
NdCu4
11
PDF-00-033-1017
Iron Nickel
FeNi
28
PDF-00-035-1093
Galium Manganese
GaMn
12
PDF-00-002-1267
Iron Silicon
FeSi
29
PDF-00-027-0223
Galium
Ga
13
PDF-00-034-0529
Iron
Fe
30
PDF-00-043-1379
Galium Magnesium
Ga5Mg2
14
PDF-01-071-0615
Magnesium Copper Phosphide
MgCuP
31
PDF-00-015-0096
Iron Yttrium
Fe2Y
15
PDF-00-019-0797
Manganese Vanadium
MnV
32
PDF-00-018-0784
Magnesium Yttrium
MgY
16
PDF-00-001-1141
Manganese
Mn
33
PDF-01-081-1377
Neodymium Silicon
NdSi1.25
17
PDF-00-035-0773
Magnesium Silicon
Mg2Si
34
PDF-01-073-0117
Yttrium Cobalt
YCo
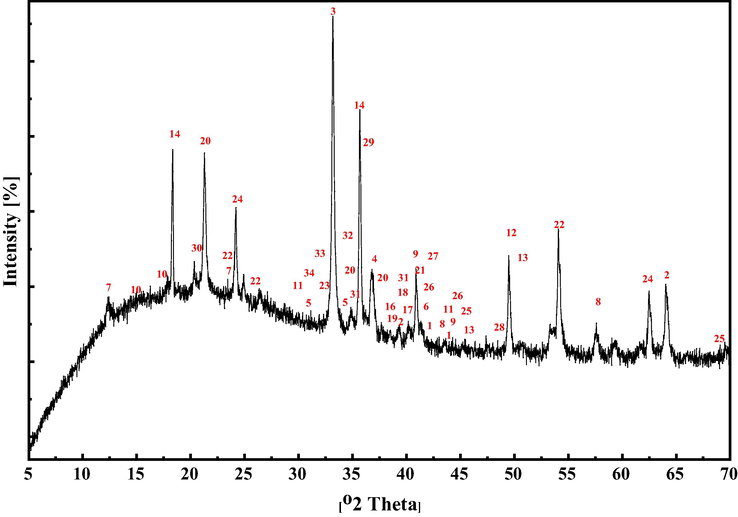
X-ray diffraction patterns of the sludge generated after EC treatment.
3.8 Comparison of the present study with reported work
Comparison of the present work with similar reported work in literature using EC is shown in Table 10. From Table 10 it is noticed that, CD in the present study is lower than other works reported by investigators. Detailed analysis of literature infers that EC treatment time to achieve sufficient removal in some studies (Wu et al., 2019; Nariyan et al., 2017) is higher compared to the present study. Also the working volume used by several authors are lower, it seems that excess energy was used in previous studies. From this point of view it is evident that the any EC studies needs to conduct with larger volume of water to make the process economical.
Type of Wastewater
Water volume (mL), electrode and electrode area (cm2)
CD (mA/cm2) & EC Time (min)
Ion removal (%)
Reference
Sulphide Mineral processing wastewater
200, Al, 33
90.91, 120
93.14% SO42−, 94.86% Ca2+
Wu et al. (2019)
Mine water
500, Al/SS, 35
70, 120
74.7% Fe, 99% Cu, 99% Si, 40% Zn, 21.26% Mn, 28.9% SO4
Nariyan et al. (2017)
Iron-rich acid mine drainage
250, Fe, 26.25
500, 60
99.9% Fe
Foudhaili et al. (2019)
Mine drainage
750, Fe, 24.2
20, 45
52% SO4
Foudhaili et al. (2020a)
Antimony mine wastewater
500, Al, 18
16.66, 60
96% Sb
Zhu et al. (2011)
Gold mine wastewater
1500, Fe
20, 30
SO4 (>7.5%)
Foudhaili et al. (2020b)
Iron ore Beneficiation plant process water
3000, Al, 14.6
6.86, 60
99.95% Fe, 97.77% Cr, 99.34% 88.69% Pb, Mn, 73.44% Cu
Present work
4 Conclusions
In the present study, process water collected from iron ore beneficiation plant was treated by electrocoagulation (EC) to obtain treated water suitable for reuse or safe for discharge as per WHO guidelines. Various metal ions present in water such as various metal ions such as Fe, Cr, Cu, Zn, Mn, Pb, Al and other pollutants like: TDS, turbidity, conductivity, and salinity were estimated before and after EC treatment to identify the influence of EC parameters on pollutant removal. Characterization of process water showed that water having 115.24 mg/L of Fe, 7.10 mg/ L of Cr, 2.68 mg/L of Pb, 0.96 mg/L of Mn ions as major along with 977 NTU turbidity. Residual Cu ions, Al ions, TDS, conductivity, salinity were found in WHO permissible limits. Based on the experimental results, it was observed that, aluminum electrodes at monopolar mode with current density of 68.50 A/m2, inter-electrode distance of 1 cm and solution conductivity of 1.033mS are the ideal operating conditions to get treated water with removal efficiency of 99.95%, 99.46%, 99.33%, 97.99%, 73.44% for Fe, Cr, Pb, Mn and Cu ions respectively after 60 min of EC with electric energy consumption of 3.93 kWh/m3 and operating cost of 0.6115 US$/m3. It was observed that, with increase in current density from 34.25 to 86.20 A/m2, residual Fe ion concentration decreases from 0.35 to 0.03 mg/L, Cr ion concentration decreases from 0.32 to 0.02 mg/L, Pb ion concentration decreases from 0.06 to 0.01 mg/L, Mn ion concentration decreases from 0.20 to 0.01 mg/L. Values of TDS, conductivity, salinity and pH of treated water were also found to be in WHO permissible the range. Kinetic analysis showed that metal ions removal followed the apparent first-order model. Characterization of EC generated sludge confirmed the removal of major elements like Fe, Cr, Cu, Zn, Mn, Pb, Al as well as trace elements such as Ni, Co, Mg, Ti, V, Zn, Nd, Sm, Y etc. from process water. Overall experimental results indicate that EC process could be used to treat iron ore beneficiation plant process water to make it suitable for reuse or safe for discharge.
Declaration of Competing Interest
The authors declare that they have no known competing financial interests or personal relationships that could have appeared to influence the work reported in this paper.
References
- Copper, chromium and nickel removal from metal plating wastewater by electrocoagulation. Desalination. 2011;269:214-222.
- [Google Scholar]
- Combined biological wastewater treatment with electrocoagulation as a post-polishing process: A review. Sep. Sci. Technol.. 2020;55:2334-2352.
- [Google Scholar]
- On the performance of electrocoagulation-assisted biological treatment processes: a review on the state of the art. Environ. Sci. Pollut. Res.. 2019;26:28689-28713.
- [Google Scholar]
- Heavy metal ions removal from wastewater using electrocoagulation processes: a comprehensive review. Sep. Sci. Technol.. 2017;52:2649-2676.
- [Google Scholar]
- Combined electrocoagulation processes as a novel approach for enhanced pollutants removal: A state-of-the-art review. Sci. Total Environ.. 2020;744:140806.
- [Google Scholar]
- Impact of mine waters on chemical composition of soil in the Partizansk Coal Basin, Russia. Int. Soil Water Conserv. Res.. 2019;7:57-63.
- [Google Scholar]
- An ecotoxicological assessment of mine tailings from three Norwegian mines. Chemosphere. 2019;233:818-827.
- [Google Scholar]
- Study of the electrocoagulation process using aluminum and iron electrodes. Ind. Eng. Chem. Res.. 2007;46:6189-6195.
- [Google Scholar]
- Arsenic removal from tap water by electrocoagulation: Investigation of process parameters, kinetic analysis and operating cost. J. Disp. Sci. Technol. 2019
- [CrossRef] [Google Scholar]
- Removal of hexavalent chromium from wastewater by Electrocoagulation (EC): Parametric evaluation, kinetic study and operating cost. Trans. Ind. Inst. Met.. 2020;73:2053-2060.
- [Google Scholar]
- Removal of Fe(II) ions from drinking water using Electrocoagulation process: Parametric optimization and kinetic study. J. Environ. Chem. Engin.. 2019;7:103116.
- [Google Scholar]
- House hold unit for the treatment of fluoride, iron, arsenic and microorganism contaminated drinking water. Chemosphere. 2018;199:728-736.
- [Google Scholar]
- Enhancement of electrocoagulation-flotation process for urban wastewater treatment using Al and Fe electrodes: Techno-economic study. Mater. Today: Proc.. 2019;13:549-555.
- [Google Scholar]
- Treatment of Bypass Wastewater Using Novel Integrated Potassium Ferrate(VI) and Iron Electrocoagulation System. J. Environ. Eng. (United States). 2020;146:1-8.
- [Google Scholar]
- Effect of the electrocoagulation process on the toxicity of gold mine effluents: A comparative assessment of Daphnia magna and Daphnia pulex. Sci. Total Environ.. 2020;708:134739.
- [Google Scholar]
- Sulfate removal from mine drainage by electrocoagulation as a stand-alone treatment or polishing step. Miner. Eng.. 2020;152:106337.
- [Google Scholar]
- Comparative efficiency of microbial fuel cells and electrocoagulation for the treatment of iron-rich acid mine drainage. J. Environ. Chem. Eng.. 2019;2019:103149.
- [Google Scholar]
- Mechanisms for degradation and transformation of β-blocker atenolol: Via electrocoagulation, electro-Fenton, and electro-Fenton-like processes. Environ. Sci. Water Res. Technol.. 2020;6:1465-1481.
- [Google Scholar]
- Defluoridation of drinking water using a new flow column-electrocoagulation reactor (FCER) – Experimental, statistical, and economic approach. J. Environ. Manage.. 2017;197:80-88.
- [Google Scholar]
- Removal of Cr ions from aqueous solution using batch electrocoagulation: Cr removal mechanism and utilization rate of in situ generated metal ions. Process Saf. Environm. Protec.. 2016;104:436-443.
- [Google Scholar]
- Investigation of the effect of different electrodes and their connections on the removal efficiency of 4-nitrophenol from aqueous solution by electrocoagulation. J. Haz. Mat.. 2008;154:778-786.
- [Google Scholar]
- A critical review on remediation, reuse, and resource recovery from acid mine drainage. Environ. Poll.. 2019;247:1110-1124.
- [Google Scholar]
- Electrocoagulation treatment of mine water from the deepest working European metal mine – Performance, isotherm and kinetic studies. Sep. Purif. Technol.. 2017;177:363-373.
- [Google Scholar]
- Effects of an abandoned Pb-Zn mine on a karstic groundwater reservoir. J. Geochem. Explor.. 2019;200:221-233.
- [Google Scholar]
- A review on industrial wastewater treatment via electrocoagulation processes. Curr. Opin. Electrochem.. 2020;22:154-169.
- [Google Scholar]
- Treatment of high-manganese mine water with limestone and sodium carbonate. J. Cleaner Prod.. 2012;29–30:11-19.
- [Google Scholar]
- Electrocoagulation Process for the removal of co-existent fluoride, arsenic and iron from contaminated drinking water. Sep. Purif. Technol.. 2018;197:237-243.
- [Google Scholar]
- Guidelines for Drinking Water Quality, Recommendations (third ed.). Geneva: World Health Organization; 2004.
- Electrocoagulation method for treatment and reuse of sulphide mineral processing wastewater: Characterization and kinetics. Sci. Total Environ.. 2019;696:134063.
- [Google Scholar]
- Removal of antimony from antimony mine flotation wastewater by electrocoagulation with aluminum electrodes. J. Environ. Sci.. 2011;23:1066-1071.
- [Google Scholar]


