

Translate this page into:
Ultra-high performance liquid chromatography/ion mobility time-of-flight mass spectrometry-based untargeted metabolomics combined with quantitative assay unveiled the metabolic difference among the root, leaf, and flower bud of Panax notoginseng
⁎Corresponding author at: State Key Laboratory of Component-based Chinese Medicine, Tianjin University of Traditional Chinese Medicine, 10 Poyanghu Road, Jinghai, Tianjin 301617, China. wzyang0504@tjutcm.edu.cn (Wenzhi Yang)
-
Received: ,
Accepted: ,
This article was originally published by Elsevier and was migrated to Scientific Scholar after the change of Publisher.
Abstract
Abstract
Despite Panax notoginseng (Sanchi: the root and rhizome) is globally popular serving as the source of food additives, health-care products, and traditional Chinese medicines (TCMs), the saponin difference between the root (PNR) and two aerial parts (leaf, PNL; flower bud, PNF) that can be vicariously used, remains unclear. Authentication of Sanchi, particular from the Chinese patent medicines (CPMs), poses great challenges. Ultra-high performance liquid chromatography/ion mobility-quadrupole time-of-flight mass spectrometry (UHPLC/IM-QTOF-MS)-based untargeted metabolomics and quantitative assay by UHPLC-UV were utilized to establish the “Identification Markers” for Sanchi. Targeted monitoring of multiple identification markers was performed for authenticating Sanchi simultaneously from 15 different CPMs. Dimension-enhanced profiling by UHPLC/IM-QTOF-MS in the negative high-definition MSE (HDMSE) mode and in-house library-driven peak annotation could characterize totally 328 ginsenosides (133 from PNR, 125 from PNL, and 161 from PNF). Multivariate statistical analysis of the PNR/PNL/PNF samples (45 batches) identified 27 potential markers. Five major markers (notoginsenoside R1, ginsenosides Rg1, -Rb1, -Rb2, and -Rb3) thereof were quantitatively assayed by a fully validated UHPLC-UV (detected at 203 nm) approach. The application of selective ion monitoring (SIM) of 12 differential saponins coupled with UHPLC separation could precisely identify Sanchi from 15 different CPMs (45 batches). Holistic difference in ginsenosides among three parts of P. notoginseng was unveiled, and the markers deduced may assist to identify the illicit substitution of leaf or flower as the root in the TCM compound formulae. Conclusively, the integration of untargeted metabolomics and quantitative analysis can provide reliable information enabling the precise authentication of TCM.
Keywords
Panax notoginseng
Ginsenoside
Metabolite difference
Untargeted metabolomics
Selective ion monitoring
Chinese patent medicine

1 Introduction
Recent outbreaks of novel coronavirus worldwide (COVID-2019) have given rise to the increasing concerns on traditional Chinese medicine (TCM) (Du et al., 2020). Different from the western medicine or chemical drug, a herb-derived TCM often represents a complex chemical system that is composed by various primary and secondary metabolites, let alone the Chinese patent medicine (CPM) typically involving several to tens of TCM species. The presence of numerous compounds renders the quality control of TCM compound formulae in practice rather difficult (An et al., 2020; Ma et al., 2016).
Metabolites profiling and the multicomponent characterization of foods and TCM have harvested remarkable progress due to the ongoing development and preferable applications of LC-MS (Cao et al., 2020; Ganzea and Sturm, 2018). Advancements of chromatography are impressed by the popularization of sub-2 µm particles packed columns in the reversed-phase chromatography (RPC), hydrophilic interaction chromatography (HILIC), supercritical fluid chromatography (SFC), and ion exchange chromatography (IEC), etc. (Huang et al., 2018; Jin et al., 2016). In addition, two-dimensional liquid chromatography (2D-LC) greatly expands the peak capacity and enhances the selectivity of chromatography (Pirok et al., 2019; Qian et al., 2020). On the other hand, herbal components analysis has been largely driven by the rapid upgrading of MS, featured by the high sensitivity, high throughput and selectivity, and the flexible scan methods (Zhang et al., 2017). Currently strategies, used for the untargeted characterization of TCM components, are based on a DDA (data-dependent acquisition) or DIA (data-independent acquisition) approach. In contrast, DIA enables the highest coverage of the metabolome, but a primary step of precursor-product ions matching is indispensable (Wang et al., 2021; Tsugawa et al., 2015). A notable new trend of MS applied in the analysis of TCM components is the introduction of ion-mobility mass spectrometry (IM-MS) (D’Atri et al., 2018; Masike et al., 2020), which offers an orthogonal dimension of separation for the gas-phase ions by the charge state, size, and shape of ions. IM-derived collision cross section (CCS) has the potential to discriminating the isomeric biomolecules (Tu et al., 2019).
Comprehensive measurement of plant metabolites, referred as the metabolomics approach, provides insights into the holistic chemical variations and enables the discovery of potential markers suitable for the precise authentication of TCM, which has been increasingly used to compare the metabolomic differences of herbal medicines that are derived from different congeneric species (Guo et al., 2015), different parts (Wang et al., 2019), collection regions (Li et al., 2017), processing technologies (Xu et al., 2018), or with different growing ages (Shin et al., 2016), etc.. Pseudo-targeted metabolomics or quantitative metabolomics has been proposed to bridge between the untargeted and targeted modes, with their individual merits of high coverage and high precision integrated (Song et al., 2018; Wang et al., 2016).
Panax notoginseng (Burk.) F. H. Chen is utilized as a reputable TCM, and its rhizome/root is the source for Sanchi (Notoginseng Radix et Rhizoma) with remarkable therapeutic effects on the cardiovascular diseases and the tonifying functions on human bodies (Kim, 2018; Yang et al., 2014). The raw material of P. notoginseng and the related versatile prescription preparations (e.g. Xueshuantong/Xuesaitong Injection, Yunnan Baiyao, and Pianzaihuang, etc.) are extensively utilized in daily life and in clinic, rendering Sanchi among the most popular herbal medicines. Decades of the phytochemistry researches on P. notoginseng have reported multiple classes of plant metabolites, of which the saponins contained are the most important bioactive ingredients with extensive pharmacological effects (Ratan et al., 2021). Notably, the leaf (PNL) and the flower bud (PNF) of P. notoginseng both contain rich saponins as the root (PNR) (Jia et al., 2019). Despite the obvious appearance features for these three parts, it becomes rather difficult to exactly differentiate them in the forms of extractives and the use in CPMs. A feasible solution to the precise quality control of P. notoginseng may result from the ginsenoside markers (Yang et al., 2016).
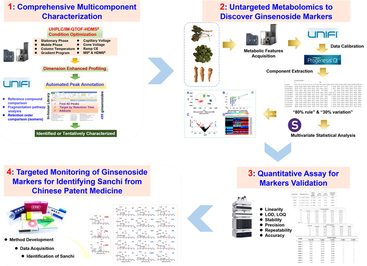
The aim of this work was to develop dimension-enhanced LC-MS approaches that could comprehensively characterize the ginsenosides and discover the “Identification Markers” for P. notoginseng root (PNR) for its precise identification. We established a dimension-enhanced, data-independent UHPLC/IM-QTOF-HDMSE (high-definition MSE) approach, combined with the in-house library-driven automated peak annotation using UNIFI™ to achieve the systematic ginsenoside characterization simultaneously from PNR, PNL, and PNF. Untargeted metabolomics analysis of the PNR/PNL/PNF samples based on the HDMSE data integrated with the quantitative assays was performed to probe into the ginsenoside markers diagnostic for differentiating three parts of P. notoginseng. Finally, a highly specific SIM method was developed by monitoring multiple ginsenoside markers to identify Sanchi from diverse CPMs. Hopefully, we can propose a “From-Single Drug-to- Compound Formula” strategy to enable the precise authentication for TCM.
2 Materials and methods
2.1 Materials
Sixty-nine ginsenoside compounds (purity > 95% determined by HPLC-UV), purchased from Shanghai Standard Biotech. Co., Ltd. (Shanghai, China), Chengdu Desite Biotechnology Co., Ltd. (Chengdu, China), or isolated from the roots of P. ginseng and P. notoginseng, were used as the reference compounds. Their structures and detailed information are offered in Fig. 1 and Table S1, respectively. LC-MS-grade acetonitrile (CH3CN), methanol (Fisher, Fair lawn, NJ, USA), formic acid (FA; ACS, Wilmington, USA), ammonium acetate (AA; Sigma-Aldrich, St. Louis, MO, USA), and ultra-pure water prepared by a Milli-Q Integral 5 water purification system (Millipore, Bedford. MA, USA), were used. Raw materials (including the root, leaf, and flower bud) of P. notoginseng were collected in Yunnan Province of China, with their information detailed in Table S2. Various Chinese patent medicines containing Sanchi were identified, with their information given in Table S3. Voucher specimens of these analytes were deposited at the authors′ laboratory in Tianjin University of Traditional Chinese Medicine (Tianjin, China).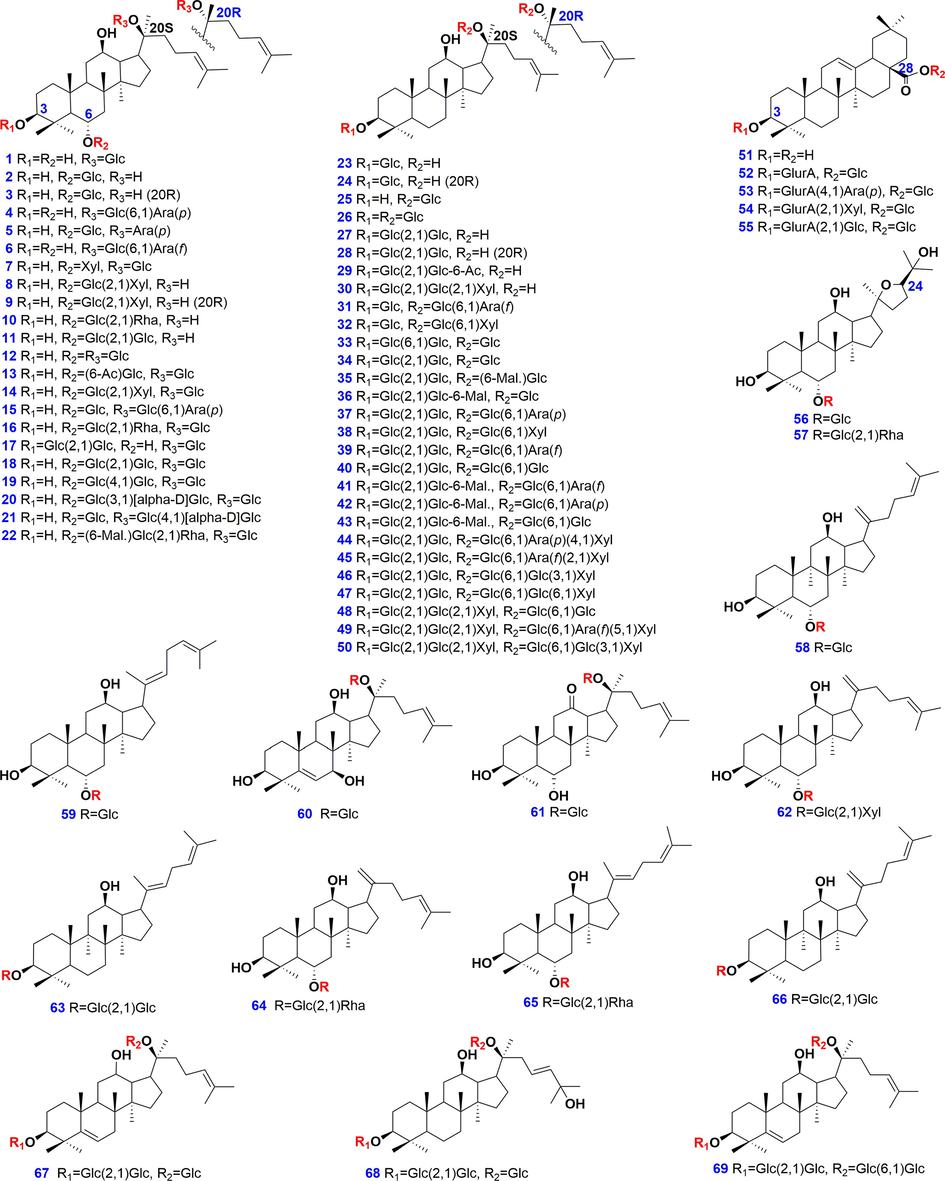
Chemical structures of 69 reference compounds of ginsenosides.
2.2 Preparation of test solutions and calibration reference solutions
In untargeted metabolomics investigation, each accurately weighed (50 mg) sample (PNR/PNL/PNF) was dissolved in 10 mL of 70% (v/v) methanol and then extracted in a water bath (<40 °C) assisted with the ultrasound for 1 h. The extract obtained was centrifuged at 3,219g (4,000 revolutions per minute, rpm) for 10 min, and the supernatant was transferred into a 10 mL-volumetric flask which was diluted to the constant volume with 70% methanol. The solution, after mixing, was further centrifuged at 11,481g (12,000 rpm) for another 10 min, and the supernatant was finally used as the test solution (5 mg/mL) for the metabolomics analysis. A QC sample (QC1) by mixing the equal volume of three representative samples (PNF-1, PNR-14, and PNL-1) was prepared for the method development, while another QC sample (QC2) prepared by pooling 45 batches of samples in equal volume was obtained for monitoring the stability of the LC-MS system through the whole analytical batch.
For the systematic ginsenoside characterization experiment, the samples were prepared using the same manner, but reached different concentrations based on their total ion intensity difference: 50 mg/mL for PNR, and 25 mg/mL for PNL/PNF. In the quantitative assays, 900 mg of each sample was extracted by 5 mL of 70% methanol twice. The pooled liquid was diluted to 10 mL yielding the test solution (90 mg/mL). A quantity (1 mL) of the stock solutions containing five reference compounds (noto-R1: 2.20 mg, ginsenoside Rg1: 7.20 mg, -Rb1: 6.08 mg, -Rb2: 2.08 mg, and -Rb3: 4.06 mg) were prepared and then serially diluted to afford a series of working solutions. All the calibration reference solutions were stored at 4 °C prior to the analysis.
2.3 Systematic ginsenoside characterization and untargeted metabolomics by UHPLC/IM-QTOF-HDMSE
In both the multicomponent characterization and metabolomics analysis of the multi-batches of P. notoginseng samples, an ACQUITY UPLC I-Class/Vion IM-QTOF hybrid high-resolution LC-MS system (Waters, Milford, MA, USA) was employed. Chromatographic separation was performed using an HSS T3 column (2.1 × 100 mm, 1.8 µm) maintained at 40 °C and a binary mobile phase consisting of 0.1% FA in CH3CN (A) and 0.1% FA in H2O (B). The optimal gradient elution program was as follows: 0–2 min, 15–20% (A); 2–2.5 min, 20–27% (A); 2.5–7 min, 27–29% (A);7–7.5 min, 29–32% (A); 7.5–19 min, 32–33% (A); 19–26 min, 33–46% (A), 26–27 min, 46–95% (A); and 27–29 min, 95% (A). The flow rate was set at 0.3 mL/min and the injection volume was 3 µL.
The HDMSE data were recorded on a Vion IM-QTOF mass spectrometer in the negative ESI mode (Waters Corporation) for both the multicomponent characterization and untargeted metabolomics experiments. The LockSpray ion source parameters were set as follows: capillary voltage, −1.0 kV; cone voltage, 20 V; source offset, 80 V; source temperature, 120 °C; desolvation gas temperature, 500 °C; cone gas flow (N2), 50 L/h; and desolvation gas flow (N2), 800 L/h. For the traveling wave IMS separation, default parameters were defined. The HDMSE data scanned over m/z 350–1500 at a rate of 0.3 s/scan. Low energy of HDMSE was set at 6 eV to record the information of all precursors, and a high energy ramp of 40–80 eV was set to acquire the fragmentation information of all the scan range masses. Data acquisition was controlled by the UNIFI 1.9.3.0 software (Waters Corporation). Calibration of the HDMSE data was conducted by constantly infusing a 200 µg/mL of leucine enkephalin solution (Sigma-Aldrich, St. Louis, MO, USA) at a flow rate of 10 µL/min.
Streamlined workflows by applying UNIFI to automatedly annotate the high-resolution HDMSE data were developed. Key parameters set for UNIFI were as follows: intensity threshold, 1000 and 5 counts for the low energy and high energy acquisitions, respectively; tolerance for both target match and fragment match was 10 ppm; To remove the redundant adduction species, multiple adduct ions, containing [M − H]−, [M − H + CH3COOH]−, [M − H + HCOOH]−, [M + Cl]−, and [M + e]−, were employed. For lock mass, leucine encephalin (at m/z 554.2620) was used to perform the data calibration in the negative ESI mode, with combine width of 3 scans and mass window of 0.5 m/z. An in-house library of ginsenosides recording 499 known saponins was incorporated into the UNIFI platform for library-driven automate peak annotation (Zuo et al., 2020).
The multi-batch HDMSE data of PNR/PNL/PNF were imported into UNIFI for correction by reference to m/z 554.2620 for the LE data. Corrected HDMSE data were further processed by the bioinformatics tool, Progenesis QI 2.1 software (Waters Corporation). Isotope and adduct fusion were applied to reduce the number of detected metabolic features. The adduct ions, including [M − H]−, [M + Cl]−, [M − 2H + FA]2−, [M + FA − H]−, [M − 2H]2−, [M + CH3COOH − H]−, and [M − 2H + 2FA]2−, in the negative ESI mode, were set to avoid redundant adduct ions. After automatic peak alignment and peak picking, a data matrix containing the normalized peak area, tR, m/z, and CCS, was obtained, which was filtered by “80% rule” and “30% variation”. The remaining metabolic features were exported into the SIMCA-P 14.1 software (Umetrics, Umea, Sweden) for chemometric analyses by PCA and OPLS-DA.
2.4 Quantitative assay of five ginsenosides by UHPLC-UV
Quantitative assay of noto-R1, Rg1, Rb1, Rb2, and Rb3, in 45 batches of P. notoginseng samples, was conducted on the Agilent 1290 Infinity II UHPLC system. Chromatographic separation was achieved on an HSS T3 (2.1 × 100 mm, 1.8 µm) column maintained at 30 °C using 0.1% FA in H2O (A) and 0.1% FA in CH3CN (B) as the mobile phase. The flow rate was 0.3 mL/min and the detection wavelength was 203 nm. The gradient program was as follows: 0–14 min: 21% (B); 0–14 min: 21–27% (B); 14.5–25 min: 27–29% (B); 25–30 min: 29–30% (B); 30–60 min: 30% (B); and 60–60.5 min: 30–95% (B). The injection volume was 3 µL. Method validation was performed in terms of specificity, linearity, LOD, LOQ, precision, stability, repeatability, and accuracy, which were similar to those reported in literature (Wang et al., 2020).
2.5 Simultaneous identification of Sanchi from 15 different CPMs by SIM of 12 ginsenoside markers
Simultaneous identification of Sanchi from 15 CPMs (Table S3) was achieved by SIM of 12 ginsenoside markers on the UHPLC/IM-QTOF-MS instrument. These markers corresponded to ten different masses, involving Rg2 at m/z 829.49, noto-R1 at m/z 977.53, Ra1 at m/z 1255.63, Rb1 at m/z 1153.59, Re and Rd at m/z 991.55, Rg1 at m/z 845.49, Rc and Rb3 at m/z 1123.59, Rh1 at m/z 683.43, noto-R2 at m/z 815.48, and noto-S at m/z 1387.67). The other parameters for UHPLC/IM-QTOF-MS were the same as above described in the Section 2.3.
3 Results and discussion
3.1 Development of a dimension-enhanced UHPLC/IM-QTOF-HDMSE approach
Given the chemical complexity of TCM, powerful analytical approach is in need to elucidate the contained components. In this work, we established a dimension-enhanced DIA method (HDMSE), by the high-resolution Vion IM-QTOF mass spectrometer, coupled with in-house library-driven automated peak annotation, to profile and characterize ginsenosides simultaneously from three parts of P. notoginseng (PNR/PNF/PNL). Key parameters both in UHPLC and HDMSE were optimized in sequence to obtain the satisfactory performance by the single-factor experiments.
First of all, the factors (e.g., stationary phase, mobile phase, column temperature, and gradient elution program) influencing the resolution of ginsenosides by UHPLC were evaluated. It was proven, as previously reported, the different additives (formic acid, FA; ammonium acetate, AA) in the mobile phase obviously affected the selectivity and the retention behavior of ginsenosides on a RP-mode HSS T3 column (Fig. S1) (Jia et al., 2019). Compared with the use of 3 mM AA as the additive, 0.1% FA in H2O was able to resolve more peaks, rendering a more balanced spectrum. Different stationary phases were subsequently assessed by considering the peak symmetry and the number of resolvable peaks. In this section, ten UHPLC columns packed with sub-2 µm particles from two vendors (Waters and Agilent), were examined under 35 °C. These columns differ mainly in the bonding technology, bonding groups, and the silica gel core (fully porous or core–shell). In respect of the number of resolvable peaks, HSS T3, CSH C18, and BEH Shield RP18, could resolve more components than the others (Fig. S2). In addition, the HSS T3 column showed better selectivity and column efficiency for the separation of P. notoginseng multicomponents. The impact of alternation on column temperature (25–40 °C) was assessed, and the influence of temperature exerted in general was weak, however, the setting of 40 °C benefitted the resolution of ginsenosides eluted at 11–24 min and 26–30 min (Fig. S3).
Key MS parameters (e.g., capillary voltage, cone voltage, and collision energy) of the Vion IM-QTOF high-resolution mass spectrometer were further optimized to boost the ion response of ginsenosides and improve the fragmentation. As previously reported, capillary voltage and cone voltage on this instrument for analyzing ginsenosides had been optimized (Jia et al., 2019), and under 1.0 kV of capillary voltage and 20 V of cone voltage, the best response could be enabled. Considering that ramp collision energy (RCE) can benefit the fragmentation of ginsenosides glycosylated with different numbers of sugars (Jia et al., 2019; Zuo et al., 2020), we set six groups of RCE (involving 20–40 eV, 40–60 eV, 60–80 eV, 80–100 eV, 100–120 eV, and 120–140 eV), to observe the impacts on generating the sapogenin-related product ions using ginsenosides Rb1, -Rd, and -Rg1 (Fig. S4). Evidently, higher RCE could better fragment the deprotonated ginsenosides. A compromise should be made for the mono- to penta-glycosidic ginsenosides, and as a result, RCE of 40–80 eV was the best, under which the product ions of most ginsenosides were abundant for identifying their structures. Good resolution and sensitive detection of the multiple components from PNR, PNL, and PNF, were achieved, with the base peak chromatograms (BPCs) of representative samples exhibited in Fig. 2.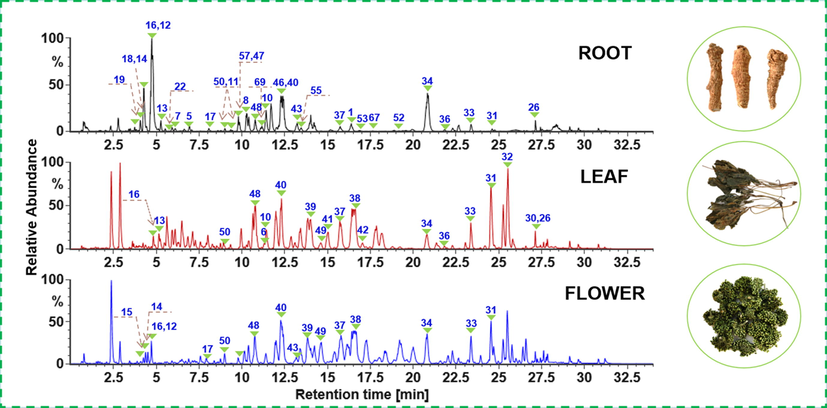
Base peak chromatograms of the representative PNR (PNR-1), PNL (PNL-1), and PNF (PNF-1) samples. The peaks unambiguously identified are annotated with the numbering consistent with that of Fig. 1.
We took full account of the characteristics of this instrument and performed a comparison of two DIA data acquisition modes, MSE and HDMSE, in order to acquire the satisfactory results. On the one hand, the ion response of ginsenosides (peak area) acquired by MSE was much more abundant than that by HDMSE, as shown in Fig. 3A using nine representative ginsenosides. It can be due to the dimension-enhanced separation of ion mobility. On the other hand, taking ginsenoside Rb1 as a case, IM could separate the doubly charged precursors from those deprotonated molecules and their adducts in the MS1 spectra (Fig. 3B and C), rendering the high-definition MS spectra. Therefore, despite the weaker response, less interference can be encountered by HDMSE generating more reliable characterization results.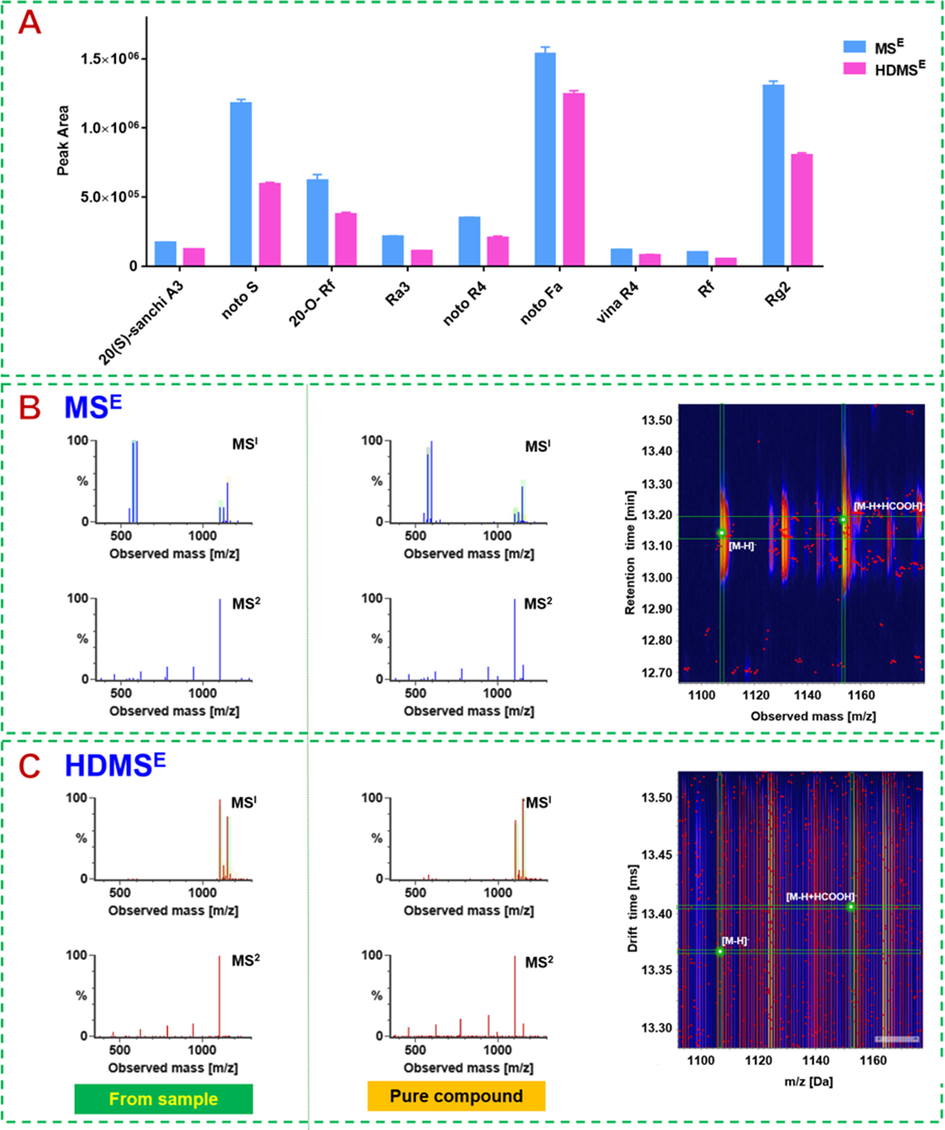
Comparison of MSE and HDMSE for ginsenoside analysis. A: Bar charts by the peak areas of representative components; B: the MS1 and MS2 spectra for ginsenoside Rb1 (the left is from the sample and the right is the reference compound) recorded by MSE, and the 3D plot showing the precursor ion peaks; C: the MS1and MS2 spectra for ginsenoside Rb1 recorded by HDMSE, and the 3D plot showing the precursor ion peaks.
3.2 Streamlining efficient characterization workflows by UNIFI and the searching of in-house ginsenoside library for the systematic characterization of ginsenosides from PNR/PNL/PNF
Comprehensive characterization of the multicomponents simultaneously from PNR, PNL, and PNF, was performed by a well-established intelligent characterization strategy (Zuo et al., 2020). The components listed in “Identified Compounds” were further confirmed based on the fragmentation pathways and the elution order on RPC, with false positives removed. Moreover, the ginsenosides listed in “Unknown Compounds” could be characterized manually.
Based on the sapogenin structures and acyl substituents, ginsenosides can involve the protopanaxatriol (PPT) type, protopanaxadiol (PPD) type, oleanolic acid (OA) type, octillol (OT) type, C-17 side chain varied, and the malonylated (Qiu et al., 2015; Zuo et al., 2020). To illustrate their characterization, some typical examples were analyzed based the collision-induced dissociation (CID)-MS2 data (Fig. 4). Notably, both the FA-adduct and deprotonated precursors were observed in the MS1 spectra for the neutral ginsenosides (such as the PPT/PPD/OT types), while only deprotonated precursors detectable for the carboxyl-containing OA and malonylated ginsenosides, enabling the rapid identification of ginsenoside subclasses for an unknown saponin. The neutral loss (NL) masses of 162.05 Da, 146.06 Da, 132.04 Da, and 176.05 Da, can be consistent with the eliminations of Glc (glucose), Rha (rhamnose), a pentose (Xylose-Xyl, and Arabinose-Ara in either the pyran- or furan-form), and GlurA (glucuronic acid), respectively (Lai et al., 2015; Qiu et al., 2015; Yao et al., 2017; Zuo et al., 2020).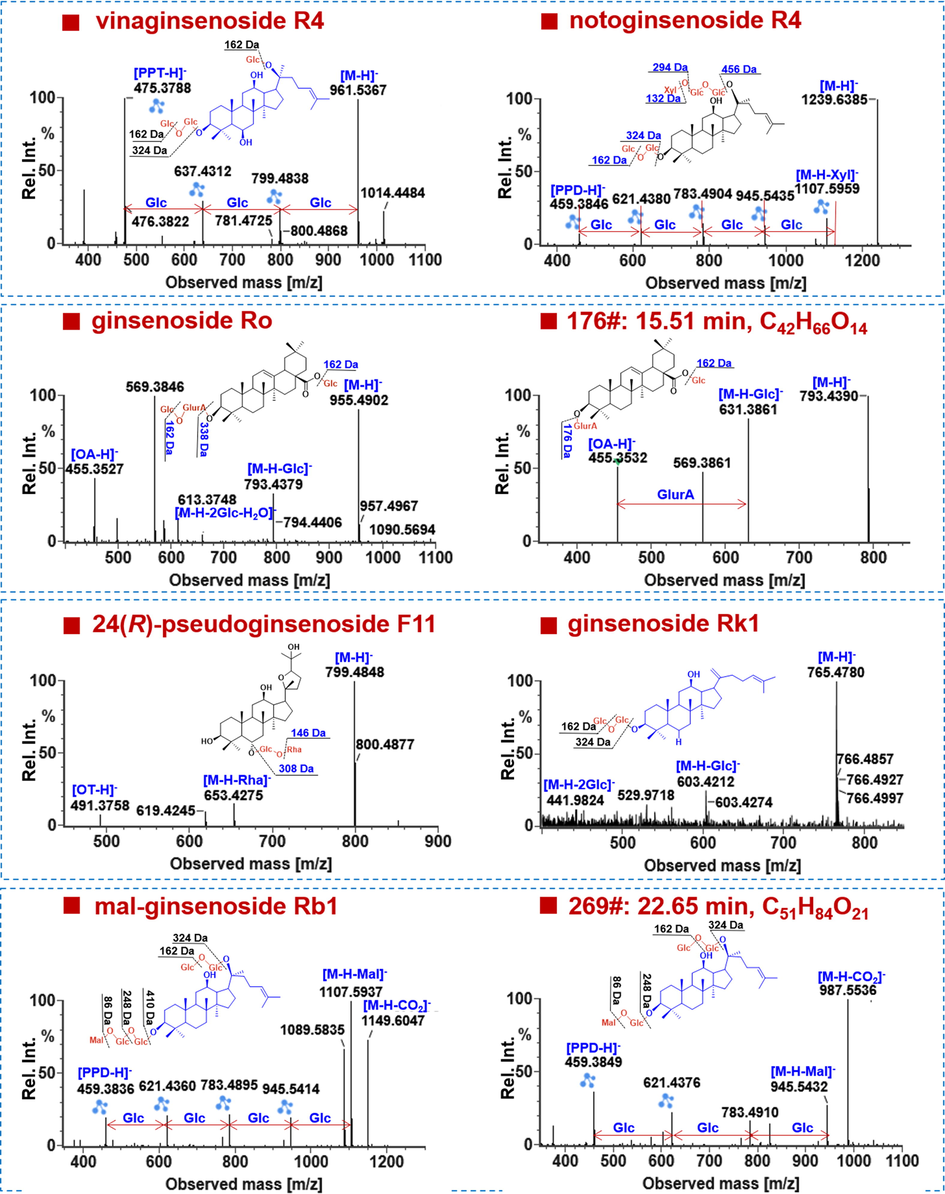
Automated annotation of the negative-mode HDMSE data of representative ginsenosides.
Ginsenosides of the PPD- and PPT-type represent the most common saponins for most Panax species (Yang et al., 2014). The sapogenin fragments at m/z 475.38 (PPT) and 459.38 (PPD) together with their secondary ions at m/z 391.29 and 375.29 could be used as the diagnostic product ions (DPI) to rapidly characterize ginsenosides of these two subtypes (Qiu et al., 2015). These fragmentation features could be found in the negative CID-MS2 spectrum of vinaginsenoside R4, a PPT-type reference compound (Fig. 4). Its precursor ions were at m/z 961.5367, which were dissociated into the fragments at m/z 799.4838, 637.4312, 475.3788, and 391.2852. They could indicate the successive eliminations of three Glc residues (3 × 162.05 Da) from the precursor ions. Similarly, we could deduce the presence of Xyl by NL of 132.04 Da (m/z 1239.64 > 1107.60), Glc (m/z 1107.60 > 945.54), Glc (m/z 945.54 > 783.49), and Glc (m/z 783.49 > 621.44), as well as the PPD sapogenin (m/z 459.3846), in notoginsenoside R4 (Fig. 4). These features assisted to rapidly characterize the PPD-/PPT-type ginsenosides, and 211 belonged to the PPD-type (64.33% of the total amount), and 83 as the PPT-type (25.30%).
The MS/MS fragmentation of OA-type saponins was featured by the fragment of OA sapogenin at m/z 455.35 together with the lost mass of GlurA by 176.03 Da. For the reference compound ginsenoside Ro, its CID-MS2 spectra displayed rich product ions, including m/z 793.4379 ([M−H−Glc]−), 613.3748 ([M−H−2Glc−H2O]−), and the sapogenin ion at m/z 455.3527. As for the unknown compound 176# (tR 15.51 min, C42H66O14) detectable in the root, its CID-MS2 spectra exhibited very similar product ions to those of Ro, but it encompassed only one Glc residue. Therefore, it was tentatively characterized as the isomer of chikusetsusaponin IVa (compound 221#). We could characterize a total of 6 OA-type ginsenosides (1.83%), which indicated their low diversity in this species.
OT-type ginsenosides are known as the characteristic constituents of P. quinquefolius, and in this work, we were able to characterize four saponins of this type (1.22% of the total amount). They all gave the same sapogenin ion at m/z 491.38, as well as some other characteristic product ions as m/z 799.48 and 653.43. These features can be illustrated by the reference compound, 24(R)-pseudoginsenoside F11 (Fig. 4).
Another class of the carboxyl-containing acidic saponins is the malonylated, and we could characterize 87 malonylginsenosides (26.52%) in this work, five of which were identified by the aid of reference compounds. The characteristic NL forms, such as CO2 (43.99 Da), a whole malonyl group (86.00 Da), malonyl plus H2O (104.01 Da), and even dimalonyl groups (172.00 Da), could be used to rapidly discern a malonylginsenoside (Qiu et al., 2015). As displayed in the CID-MS2 spectrum of malonyl-ginsenoside Rb1, a series of malonyl-related product ions, comprising [M−H−CO2]− (m/z 1149.6047), [M−H−Mal]− (m/z 1107.5937), and [M−H−Mal−H2O]− (m/z 1089.5835), were observed. Other fragments of m/z 945.5414, 783.4895, 621.4360, and 459.3836, could suggest four Glc substituents as those in Rb1 (Fig. 4). For the unknown compound 269# (tR 22.65 min, C51H84O21), the presence of m/z 987.5536 ([M−H−CO2]−), 945.5432 ([M−H−Mal−), 783.4910 ([M−H−Mal−Glc]−), 621.4376 ([M−H−Mal−2Glc]−), and 459.3849 ([PPD–H]−), could suggest an isomer of malonylginsenoside Rd, but their structural difference failed to be identified only by the available MS information.
A class of ginsenosides with diverse variations on the side chain is named as C-17 side-chain varied, such as H2O-addition, hydroxylation, peroxidization, methoxylation, and carbonylation dehydration, etc. (Yang et al., 2014). For the reference compound, ginsenoside Rk1, the high-abundance precursor ion was detected at m/z 765.4780 ([M−H]−), which could further give the product ions at m/z 603.4212 ([M−H−Glc]−), and 441.9824 ([M−H−2Glc]−). The sapogenin ion at m/z 441 was consistent with a dehydrated PPD skeleton. A total of 152C-17 side-chain varied saponins (46.34%) were identified, which mostly contributed to the structural diversity of ginsenosides from P. notoginseng.
As a result, a total of 328 ginsenosides were identified or tentatively characterized, including 133 from the root, 125 from the leaf, and 161 from the flower bud, and 39 thereof were accurately identified with the aid of reference compounds (Table S4). Unexpectedly, 86 novel ginsenoside structures (26.22%) have unknown masses or new sapogenins. However, to exactly identify the glycosylation sites, the configuration of the glycosidic bonds, and novel substituents, more structural information is in need.
3.3 Untargeted metabolomics to unveil potential ginsenoside markers for differentiating among PNG, PNL, and PNF
Unveiling the difference in ginsenoside compositions among three parts of P. notoginseng is a premise to establish the “Identification Markers” for the precise authentication of Sanchi. Multivariate statistical analysis, based on the negative HDMSE data of 45 batches of P. notoginseng samples was performed. Processed by the Progenesis QI software, the multi-batch HDMSE data generated a data set containing 4067 metabolic features, which were further screened by “80% rule” and “30% variation” to remove those unwanted metabolite information (Yao et al., 2017). Normalized ion response data were used for chemometrics analyses by PCA (unsupervised) and OPLS-DA (supervised) in sequence. Very tight clustering of QC data in the score plot of PCA could indicate good quality of the data (Fig. S5). The samples, corresponding to the root (PNR), leaf (PNL), and flower bud (PNF), were segregated into three groups, demonstrating the remarkable chemical difference among three parts from the same plant. Subsequently, OPLS-DA was utilized to better differentiate three groups and probe into the potential ginsenoside markers. The established OPLS-DA model exhibited good fitness (R2X 0.927; R2Y 0.986) and predictability (Q2 0.974), in which each group was separated from the others (Fig. 5A). A permutation test could indicate this OPLS-DA model was not overfitted (Fig. 5B). A total of 33 differential ions were screened when the VIP cutoff was set at 4.0 Fig. 5C), and the abundance difference of these ions was intuitively embodied in a heat map (Fig. 5D). By further searching of the multicomponent characterization results (Table S4), these 33 differential ions could be assigned to 27 compounds (Table S5). Notably, the CID-MS2 fragments of these identified markers had been validated by targeted MS/MS experiments. Amongst them, ginsenosides Rb1 (M1), -Rb3 (M2), -Ra1 (M3), notoginsenoside Fa (M4), chikusetsusaponin FK4 (or isomer; M5), ginsenosides Rd (M6), -Rc (M7), -Rh1 (M8), and floralginsenoside P (or isomer; M9), are nine most important. Their abundance difference among PNR, PNL and PNF, is reflected in a box chart (Fig. 5E). In contrast, the root contains less M2/M3/M5/M7/M9, but more M6 than both the leaf and flower, while M9 is a potential marker to discriminate between the leaf and the flower.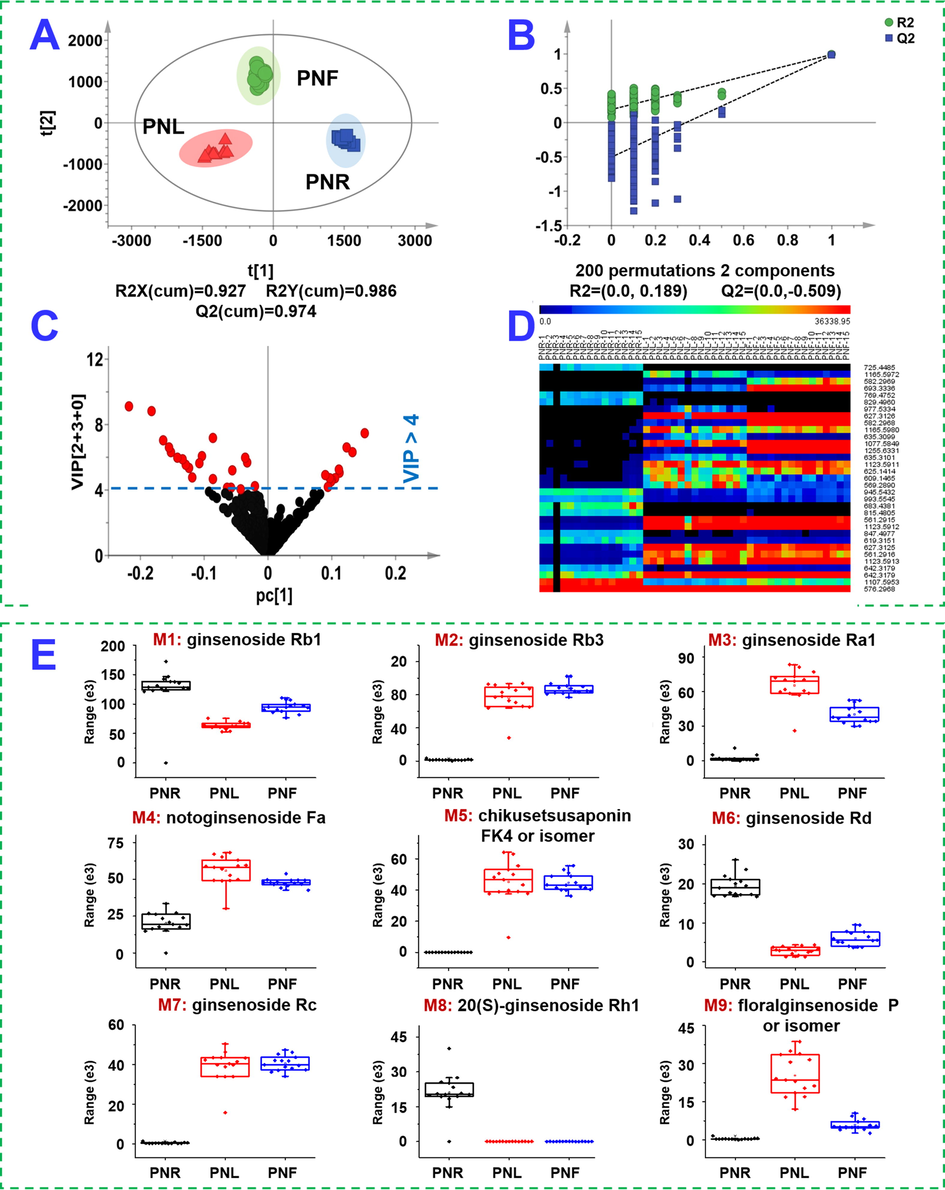
OPLS-DA of the multiple batches of three parts of P. notoginseng (PNR: the root; PNL: the leaf; PNF: the flower) based on the negative-mode HDMSE data. A: Score plot; B: permutation test; C: VIP plot; D: heat map of 33 differential ions among 45 batches of samples; E: the box charts of 9 most important potential ginsenoside markers.
3.4 Quantitative assay of five ginsenosides by UHPLC-UV for validating the discovered markers
A UHPLC-UV quantitative assay method was established and validated for partially confirming the potential markers discovered by untargeted metabolomics. The repeatability evaluated by these five analytes ranged from 1.28 to 2.96% (Table S6). Stability of the sample over 48 h was between 1.24% and 2.87%. Precision through three consecutive days was no more than 2.10%. Recovery ranged from 90.35% to 107.87%. This quantitative assay approach was applied to determine the content differences of these five ginsenosides among 45 batches of P. notoginseng samples (Table S7). Apparently, the root contains more abundant PPT-type noto-R1 (0.56–1.43%) and Rg1 (2.32–4.77%), but very minor Rb2 and Rb3 (<0.1%); both the leaf and flower involve few noto-R1 and Rg1 (<0.20%), but are rich of the PPD-type Rb2 and Rb3; the flower is richer in Rb1 (0.90–2.43%) and Rb2 (0.55–1.47%) than the leaf (Rb1: 0.19–0.48%, Rb2: 0.06–0.51%).
3.5 Selective monitoring of 12 ginsenoside markers for the identification of Sanchi from 15 different CPMs
The simultaneous monitoring of multiple markers can achieve the accurate authentication of CPM (Yang et al., 2016; Zhang et al., 2020). We performed the authentication of Sanchi simultaneously from 15 different CPMs (Table S3). According to the untargeted metabolomics and quantitative assay results, 12 ginsenoside markers, including noto-R1, noto-R2, ginsenosides Re, -Rg1, -Rg2, -Rh1, -Ra1, -Rb1, -Rd, -Rc, -Rb3, and noto-S, were simultaneously detected by an SIM approach in combination with UHPLC. Fig. 6 exhibits the SIM spectra of the representative PNR, PNL, and PNF samples, as well as 45 batches of CPMs. By comparing the SIM spectrum of Sanchi, the major identification markers for Sanchi, such as noto-R1, Re, Rg1, noto-R2, Rg2, Rh1, Rb1, and Rd, could be observed in the SIM spectra for 15 different CPMs, based on which we could draw the conclusion that Sanchi was used correctly in preparing these CPMs. Moreover, the established UHPLC/SIM approach, in theory, can discern the illegal use of PNF or PNL to replace Sanchi in the preparation of CPMs. However, it relies on the added amount and the preparation technology itself may cause component loss. To exactly identify the species that is illegally used in CPM is very difficult, as we have to grasp the key identification information for all TCM species. This work is an example for the “Monomethod for Multiple Use” strategy we have proposed for TCM standards collaboration aimed to elevate the applicability of the analytical methods.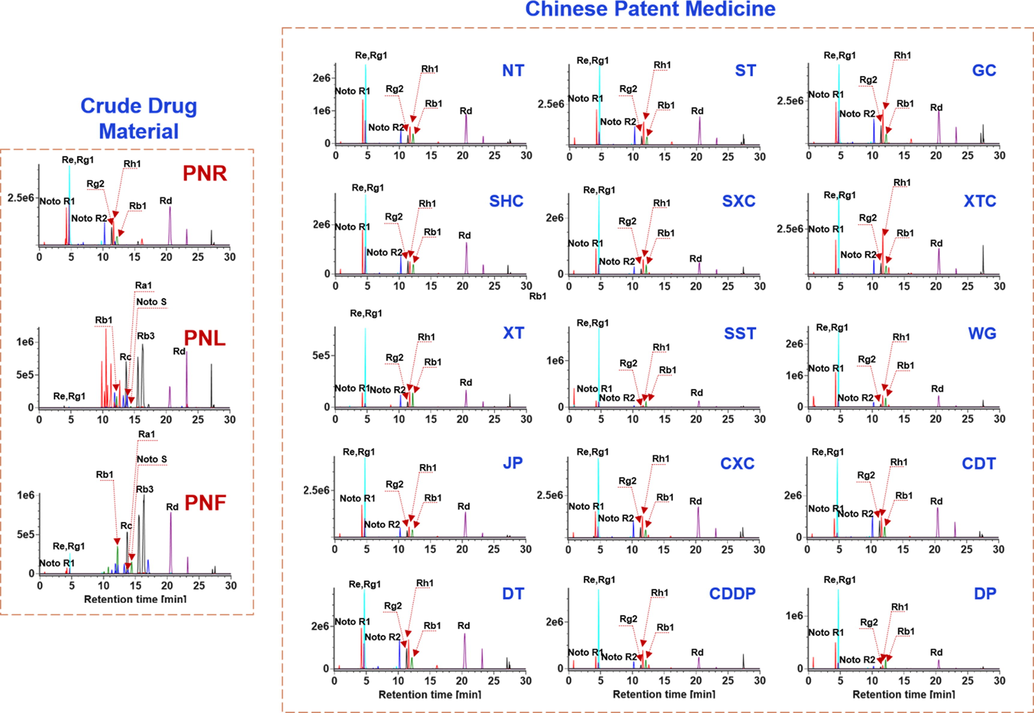
Identification of Sanchi from the Chinese patent medicines based on the selective ion monitoring of 12 marker compounds.
4 Conclusions
Aimed to establish the “Identification Markers” of P. notoginseng enabling its exact authentication, we conducted a systematic comparison study on the ginsenosides among three different parts by integrating untargeted metabolomics and quantitative assays. The profiling approach, established by UHPLC/IM-QTOF-MS in the negative HDMSE mode, facilitated the dimension-enhanced separations providing four-dimensional information (tR, MS, MS2, and CCS) for each component. In-house library-driven automated peak annotation by UNIFI resulted in the characterization of 328 ginsenosides. The comparative analyses of 45 batches of P. notoginseng samples ultimately unveiled 27 markers. The richness of the PPT-type saponins (noto-R1, Re, Rg1, noto-R2, Rg2, and Rh1), but low abundance of the PPD-type (Rc, Rb2, Rb3, Ra1, and noto-S) could help differentiate the root from the leaf and the flower, while floralginsenoside P (or isomer) might be a new marker to discriminate between the leaf and flower. Targeted monitoring of the ginsenoside markers by SIM enabled a practical approach for authenticating Sanchi from diverse CPMs. These findings would benefit the quality control of P. notoginseng, particularly as the extractives or the use in TCM compound formulae. In a broader sense, this work is an example in intelligent and precise quality control of TCM.
Acknowledgments
This work was supported by State Key Research and Development Project-Special Research of TCM Modernization (2017YFC1702104), Natural Science Foundation of Tianjin of China (20JCYBJC00060), and National Natural Science Foundation of China (81872996).
Declaration of Competing Interest
The authors declare that they have no known competing financial interests or personal relationships that could have appeared to influence the work reported in this paper.
References
- Comprehensive chemical profiling of Jia-Wei-Qi-Fu-Yin and its network pharmacology-based analysis on Alzheimer’s disease. J. Pharm. Biomed. Anal.. 2020;189:113467
- [CrossRef] [Google Scholar]
- Mass spectrometry for analysis of changes during food storage and processing. J. Agric. Food. Chem.. 2020;68(26):6956-6966.
- [CrossRef] [Google Scholar]
- Adding a new separation dimension to MS and LC-MS: What is the utility of ion mobility spectrometry? J. Sep. Sci.. 2018;41(1):20-67.
- [CrossRef] [Google Scholar]
- Traditional Chinese Medicine: an effective treatment for 2019 novel coronavirus pneumonia (NCP) Chin. J. Nat. Med.. 2020;18(3):206-210.
- [CrossRef] [Google Scholar]
- Structural characterization and discrimination of Chinese medicinal materials with multiple botanical origins based on metabolite profiling and chemometrics analysis: Clematidis Radix et Rhizoma as a case study. J. Chromatogr A.. 2015;1425:129-140.
- [CrossRef] [Google Scholar]
- Recent advances on HPLC/MS in medicinal plant analysis—An update covering 2011–2016. J. Pharm. Biomed. Anal.. 2018;147:211-233.
- [CrossRef] [Google Scholar]
- Supercritical fluid chromatography in traditional Chinese medicine analysis. J. Pharm. Biomed. Anal.. 2018;147:65-80.
- [CrossRef] [Google Scholar]
- Recent developments in liquid chromatography stationary phases for separation of Traditional Chinese Medicine components. J. Pharm. Biomed. Anal.. 2016;130:336-346.
- [CrossRef] [Google Scholar]
- Simultaneous profiling and holistic comparison of the metabolomes among the flower buds of Panax ginseng, Panax quinquefolius, and Panax notoginseng by UHPLC/IM-QTOF-HDMSE-based metabolomics analysis. Molecules. 2019;24(11):2188.
- [CrossRef] [Google Scholar]
- Pharmacological and medical applications of Panax ginseng and ginsenosides: a review for use in cardiovascular diseases. J. Ginseng Res.. 2018;42(3):264-269.
- [CrossRef] [Google Scholar]
- An integrated high resolution mass spectrometric data acquisition method for rapid screening of saponins in Panax notoginseng (Sanqi) J. Pharm. Biomed. Anal.. 2015;109:184-191.
- [CrossRef] [Google Scholar]
- Strategy for comparative untargeted metabolomics reveals honey markers of different floral and geographic origins using ultrahigh-performance liquid chromatography-hybrid quadrupole-orbitrap mass spectrometry. J. Chromatogr. A.. 2017;1499:78-89.
- [CrossRef] [Google Scholar]
- An integrated strategy for global qualitative and quantitative profiling of traditional Chinese medicine formulas: Baoyuan decoction as a case. Sci. Rep.. 2016;6:38379.
- [CrossRef] [Google Scholar]
- Detailed phenolic characterization of protea pure and hybrid cultivars by liquid chromatography-ion mobility-high resolution mass spectrometry (LC-IM-HR-MS) J. Agric. Food. Chem.. 2020;68(2):485-502.
- [CrossRef] [Google Scholar]
- Recent developments in two-dimensional liquid chromatography: fundamental improvements for practical applications. Anal. Chem.. 2019;91(1):240-263.
- [CrossRef] [Google Scholar]
- A four-dimensional separation approach by offline 2D-LC/IM-TOFMS in combination with database driven computational peak annotation facilitating the in-depth characterization of the multicomponents from Atractylodis Macrocephalae Rhizoma (Atractylodes macrocephala) Arab. J. Chem.. 2020;14:102957.
- [CrossRef] [Google Scholar]
- A green protocol for efficient discovery of novel natural compounds characterization of new ginsenosides from the stems and leaves of Panax ginseng as a case study. Anal. Chim. Acta. 2015;893:65-76.
- [CrossRef] [Google Scholar]
- Pharmacological potential of ginseng and its major component ginsenosides. J. Ginseng Res.. 2021;45(2):199-210.
- [CrossRef] [Google Scholar]
- Metabolomic approach for discrimination of four- and six-year-old red Ginseng (Panax ginseng) using UPLC-QToF-MS. Chem. Pharm. Bull.. 2016;64(9):1298-1303.
- [CrossRef] [Google Scholar]
- Serially coupled reversed phase-hydrophilic interaction liquid chromatography-tailored multiple reaction monitoring, a fit-for-purpose tool for large-scale targeted metabolomics of medicinal bile. Anal. Chim. Acta. 2018;1037:119-129.
- [CrossRef] [Google Scholar]
- MS-DIAL: data-independent MS/MS deconvolution for comprehensive metabolome analysis. Nat. Methods.. 2015;12(6):523-526.
- [CrossRef] [Google Scholar]
- The emerging role of ion mobility-mass spectrometry in lipidomics to facilitate lipid separation and identification. Trends Anal. Chem.. 2019;116:332-339.
- [CrossRef] [Google Scholar]
- A novel ion mobility separation-enabled and precursor ions list-included high-definition data-dependent acquisition (HDDDA) approach: Method development and its application to the comprehensive multicomponent characterization of Fangji Huangqi Decoction. Arab. J. Chem.. 2021;14:103087.
- [CrossRef] [Google Scholar]
- In-depth profiling, characterization, and comparison of the ginsenosides among three different parts (the root, stem leaf, and flower bud) of Panax quinquefolius L. by ultra-high performance liquid chromatography/quadrupole-Orbitrap mass spectrometry. Anal. Bioanal. Chem.. 2019;411(29):7817-7829.
- [CrossRef] [Google Scholar]
- Holistic quality evaluation of Saposhnikoviae Radix (Saposhnikovia divaricata) by reversed-phase ultra-high performance liquid chromatography and hydrophilic interaction chromatography coupled with ion mobility quadrupole time-of-flight mass spectrometry-based untargeted metabolomics. Arab. J. Chem.. 2020;13(12):8835-8847.
- [CrossRef] [Google Scholar]
- An improved pseudotargeted metabolomics approach using multiple ion monitoring with time-staggered ion lists based on ultra-high performance liquid chromatography/quadrupole time-of-flight mass spectrometry. Anal. Chim. Acta. 2016;927:82-88.
- [CrossRef] [Google Scholar]
- Remarkable impact of steam temperature on ginsenosides transformation from fresh ginseng to red ginseng. J. Ginseng Res.. 2018;42(3):277-287.
- [CrossRef] [Google Scholar]
- Saponins in the genus Panax L. (Araliaceae): A systematic review of their chemical diversity. Phytochemistry. 2014;106:7-24.
- [CrossRef] [Google Scholar]
- Identification and differentiation of Panax ginseng, Panax quinquefolium, and Panax notoginseng by monitoring multiple diagnostic chemical markers. Acta Pharm. Sin. B.. 2016;6(6):568-575.
- [CrossRef] [Google Scholar]
- UHPLC-Q-TOF-MS-based metabolomics approach to compare the saponin compositions of Xueshuantong injection and Xuesaitong injection. J. Sep. Sci.. 2017;40(4):834-841.
- [CrossRef] [Google Scholar]
- Recent developments and emerging trends of mass spectrometry for herbal ingredients analysis. Trends Anal. Chem.. 2017;94:70-76.
- [CrossRef] [Google Scholar]
- Highly selective monitoring of in-source fragmentation sapogenin product ions in positive mode enabling group-target ginsenosides profiling and simultaneous identification of seven Panax herbal medicines. J. Chromatogr. A. 2020;1618:460850.
- [CrossRef] [Google Scholar]
- Offline two-dimensional liquid chromatography coupled with ion mobility-quadrupole time-of-flight mass spectrometry enabling four-dimensional separation and characterization of the multicomponents from white ginseng and red ginseng. J. Pharm. Anal.. 2020;10(6):597-609.
- [CrossRef] [Google Scholar]
Appendix A
Supplementary material
Supplementary data to this article can be found online at https://doi.org/10.1016/j.arabjc.2021.103409.
Appendix A
Supplementary material
The following are the Supplementary data to this article:


