

Translate this page into:
Ultrasound-assisted dispersive solid-phase extraction for the preconcentration of dyes in water samples
⁎Corresponding author. 15239126088@139.com (Jinfeng Fu),
-
Received: ,
Accepted: ,
This article was originally published by Elsevier and was migrated to Scientific Scholar after the change of Publisher.
Peer review under responsibility of King Saud University.
Abstract
MgFe2O4/ZnO nanocomposite was synthesized and characterized. Extraction optimization using four variables at three levels were applied. Ultrasound shows considerable advantage on the dispersive solid phase extraction. The proposed method was successfully applied to various water samples.
Abstract
In this research, the magnesium ferrite/zinc oxide (MgFe2O4/ZnO) nanocomposite has been utilized as an effective adsorbent in the ultrasound-assisted dispersive solid-phase extraction (USA-DSPE) coupled to a spectrophotometric method for preconcentration of methylene blue (MB) and safranin O (SO) dyes. X-Ray diffraction (XRD), vibrating sample magnetometer (VSM), transmission electron microscopy (TEM), and field emission scanning electron microscopy (FESEM) analyses were performed to characterize and confirm the properties of the synthesized MgFe2O4/ZnO nanocomposite. Box-Behnken design (BBD) based on response surface methodology (RSM) was utilized to optimize the variables. The results of this research showed that the maximum extraction efficiency was obtained at pH = 7, eluent volume of 140 µL, adsorbent amount of 1.53 mg, and ultrasonic time of 8 min. After optimization by RSM and using the Quadratic model, the extraction efficiency for MB and SO was 98.60% and 97.23%, respectively. The analysis of variance (ANOVA) showed that the data obtained from the experiment were consistent with the predicted model. Under optimal conditions, the calibration curve was linear in the range of 5–1000 µg/L (coefficient of determination of 0.9884) for MB and 10–1100 µg/L (coefficient of determination of 0.9973) for SO. The limit of detections (LOD) of the proposed method for MB and SO were determined as 1.5 µg/L and 3 µg/L, respectively. The relative standard deviations (RSD, n = 5) for MB and SO were obtained as 1.1% and 2.1%, respectively. The results of adsorbent recovery revealed that MgFe2O4/ZnO nanocomposite could be used several times without a significant adsorbent efficiency loss. Furthermore, the findings of interference studies revealed that the presence of different ions does not cause substantial interference with the extraction of dyes. The environmental water samples analysis showed that the extraction efficiency for dyes was in the range of 93.74–99.11%.
Keywords
Box-Behnken design
Magnesium ferrite/zinc oxide nanocomposite
Methylene blue
Safranin O
Solid-phase extraction

1 Introduction
Accurate determination and measurement of organic and inorganic compounds at trace and ultra-trace levels in various scientific and environmental fields are crucial (Kurnia et al., 2022, Tuzen et al., 2021. However, direct measurement of trace-level substances in complex matrices such as water and wastewater samples are often impractical due to limitations such as the high limit of detection (LOD) of the technique, the physical and chemical state of the sample, non-uniform distribution of the analyte, background interference, and interfering species (Amico et al., 2022, Carvalho et al., 2019). Therefore, pre-treatment methods, such as separation and preconcentration, are employed to eliminate matrix interference or enrich trace amounts of the analyte in diverse samples to achieve reliable levels of sensitivity, accuracy, and precision required for measurement. Various methods, including spectrophotometry, high-performance liquid chromatography (HPLC), thin layer chromatography (TLC), gas chromatography (GC), and potentiometry, have been employed for the measurement of dyes (Yusop et al., 2023, Arabkhani et al., 2021, Al Tamim et al., 2020, Sun et al., 2020, Balbas et al., 2019).
Nowadays, there is intense competition to improve the detection limit, increasing accuracy, and reducing the cost of analytical methods. Consequently, a sample preparation and preconcentration step is necessary to achieve a low detection limit, eliminate interferences, and provide a robust and reproducible method that is not sensitive to the sample matrix (Ariño et al., 2022, Mi et al., 2022). These analytical methods should utilize fewer solvents and provide cleaner samples, enabling analytical instruments to accurately determine the analyte concentration in the final step. Solid-phase extraction is one of the methods extensively used for the extraction and preconcentration of organic and mineral samples (Brewer et al., 2022).
Despite all the prominent advantages of the solid-phase extraction method, it still requires relatively large amounts of inorganic or organic solvents, often toxic and expensive. Therefore, researchers have recently focused on developing microextraction methods for solid-phase extraction (Sun et al., 2022). The advantages of these methods include simplicity, suitable extraction speed, high enrichment factor, achieving low detection limits, reducing the extraction solvent volume from milliliters to microliters, and compatibility with analytical systems (Tang et al., 2022, Asfaram et al., 2020). One of the microextraction methods is dispersive solid-phase microextraction, which has gained attention recently. In this method, a small amount of a suitable solid-phase is dispersed in a few milliliters of the sample solution and rapidly adsorbs the sample. The adsorbed sample is then desorbed using a few microliters of an appropriate solvent and subjected to measurement (Hassan et al., 2021).
The adsorbent plays a crucial role in dispersive solid-phase extraction (DSPE) and is often based on the use of nanomaterials. In recent years, magnesium ferrite nanoparticles (MgFe2O4 NPs) have been employed as suitable alternatives to conventional adsorbents in DSPE processes. MgFe2O4 NPs possess advantages such as low toxicity, easy synthesis, cost-effectiveness, high magnetic properties, large surface area, suitable adsorption capacity, and fast adsorption rate (Bose et al., 2021, Kaur and Kaur, 2019). Furthermore, their ability to be synthesized in much smaller sizes than other ferrites like cadmium ferrite (CdFe2O4) and copper ferrite (CuFe2O4) makes them highly favorable. On the other hand, CdFe2O4 NPs and CuFe2O4 NPs exhibit paramagnetic behavior, while MgFe2O4 NPs exhibit superparamagnetic behavior. In fact, superparamagnetic materials respond quickly to magnetic fields compared to paramagnetic materials (Salih and Mahmood, 2023, Garcia-Muñoz et al., 2019).
In order to discover environmentally friendly extraction methods that reduce solvent consumption, shorten the extraction time, and increase efficiency, new technologies have been studied. Among these innovative extraction methods, ultrasound-assisted extraction (USA) can be mentioned as an efficient, cost-effective, and simple approach compared to well-known conventional extraction technologies (Vilkhu et al., 2008). The mechanism of extraction using ultrasound is based on the generation of small bubbles through the phenomenon of cavitation, which occurs within the low-pressure regions created by sound waves (Mehrabi et al., 2017). The extremely high temperatures and pressures that occur within a duration of 2 microseconds and a distance of 200 µm during the collapse and implosion of the bubbles result in the decomposition of organic substances and increased mass transfer from the cellular membrane. Essentially, the ultrasound method can increase efficiency by increasing the contact surface area between liquid and solid phases (Meregalli et al., 2020, Leong et al., 2014).
The most common method for optimizing experimental conditions and achieving optimum values for each process variable is the one-factor-at-a-time (OFAT) method. In this technique, only one variable is changed while keeping the other variables at a constant level (Madondo and Chetty, 2022). The disadvantages of this method include differences between the obtained optimum point and the actual optimum points, a high number of required experiments, high cost, and time-consuming nature. As a result, experimental design methods have taken the place of OFAT. Experimental design involves designing experiments to investigate the effects of different variables on one another and the response. Some advantages of this method include considering all influential variables on the response simultaneously, reducing the number of experiments, creating mathematical models to identify important variables, evaluating interactions between factors, and obtaining optimal conditions (Bagheri et al., 2019).
Response surface methodology (RSM) is a mathematical model and a statistical technique used to estimate relationships between variables and observed results in experiments. It can also be employed to optimize and assess the efficiency of extraction processes and minimize the number of required experiments. In other words, RSM is a collection of statistical techniques for experimental design, model construction, examining the effects of parameters, and searching for optimal conditions (Alshammari et al., 2023, Yang et al., 2022). RSM also quantifies the relationships between one or more measured responses and the main input parameters. The application of RSM reduces the consumption of chemicals and facilitates the execution of necessary experiments for constructing a response surface (Manojkumar et al., 2022).
Therefore, in this study, a simple and effective method for the preconcentration and determination of very low levels of MB and SO dyes in water samples using the USA-DSPE method in the presence of MgFe2O4/ZnO nanocomposite as the adsorbent has been proposed. Furthermore, the RSM method was employed for experimental design and obtaining optimal points.
2 Experimental
2.1 Materials and instrumentation
The chemicals used in this research, such as sodium hydroxide (97%), zinc nitrate (99%), methanol (99%), hydrochloric acid (37%), acetonitrile (99%), tetrahydrofuran (99%), iron(III) nitrate (99%), magnesium nitrate (99%), hydrogen peroxide (30%), and dimethylformamide (99%), were purchased from Merck company. Safranin O (99%) and methylene blue (99%) were supplied by Fluka. All chemicals were of analytical grade purity and were used without any additional purification. To prepare a standard solution of 100 mg/L, a quantity of 0.01 g of the dye was dissolved in a small amount of distilled water and made up to a volume of 100 mL in a volumetric flask using distilled water. Daily solutions were prepared by diluting the aforementioned solution with distilled water. pH values were measured using a Metrohm 780 pH meter (Metrohm, Switzerland), and weighing was done using a Sartorius AG Germany balance. Phase separation was performed using a centrifuge device (Hermle, Z 300 K, Germany). Dispersion of the solid and liquid phases was carried out in an ultrasonic bath (UC-3360, China). UV–vis spectra were measured using a UV/Vis spectrophotometer from Shimadzu Corporation, Japan. XRD patterns were obtained using a Philips PW3040/60 powder diffraction instrument with Cu Kα radiation (40 kV and 40 mA) in the 2θ range of 20–80°. TEM images were captured using an H-600 transmission electron microscope from Hitachi, Japan. The magnetic properties of the magnetic particles were evaluated using a vibrating sample magnetometer (VSM) model Lake Shore 7307.
2.2 Synthesis of magnesium ferrite/zinc oxide (MgFe2O4/ZnO) nanocomposite
2.2.1 Synthesis of zinc oxide (ZnO) nanoparticles via coprecipitation method
For the synthesis of ZnO nanoparticles, a solution of zinc nitrate (0.1 M) was prepared. The obtained solution was stirred at room temperature for a homogeneous and uniform solution. A solution of sodium hydroxide (0.1 M) was added to the initial solution. The addition of sodium hydroxide solution was stopped when the pH of the solution reached 12. To collect the resulting precipitate, the solution was centrifuged. Then, the precipitate was mixed with an appropriate amount of hydrogen peroxide solution and placed inside a sealed container. The sealed container was transferred to a furnace and kept at 75 °C for 2 h. Afterward, the resulting mixture was transferred to a crucible and again placed in the furnace at 75 °C for 8 h. Finally, the obtained powder was calcined.
2.2.2 Synthesis of magnesium ferrite (MgFe2O4) nanoparticles via self-propagating sol–gel method
First, an appropriate amount of iron(III) nitrate and magnesium nitrate was dissolved in a small quantity of water inside a beaker and stirred on a hot plate for 20 min. Simultaneously, a suitable amount of citric acid solution was added to the mixture, and it was stirred for half an hour. To achieve a pH of 7, drop by drop, an ammonia solution was added to the mixture. Then the heating process was initiated to evaporate the solution and form a gel at 70 °C. After the evaporation process, the beaker was placed on a hot plate at 200 °C to undergo gel combustion. Finally, the obtained ash was milled and calcined in a furnace at 400 °C for 2 h.
2.2.3 Synthesis of magnesium ferrite/zinc oxide (MgFe2O4/ZnO) nanocomposite via chemical method
For the synthesis of the MgFe2O4/ZnO nanocomposite, the pre-prepared magnesium ferrite was dispersed in a suitable amount of water using ultrasonication. The subsequent steps to complete the MgFe2O4/ZnO nanocomposite fabrication process are the same as the ones mentioned in the synthesis of ZnO nanoparticles section. Therefore, in the next step, an appropriate amount of zinc nitrate was added to the solution. Then, a suitable solution of sodium hydroxide was added drop by drop to the mixture and subjected to continuous stirring for 1 h. The formed precipitates were placed in a sealed container with an appropriate amount of hydrogen peroxide solution. The sealed container was then transferred to a furnace and kept at 75 °C for 2 h. To carry out the evaporation process, the solution was transferred to a beaker and placed inside the furnace for 8 h. Finally, the obtained powder was calcined at 400 °C for 2 h. The properties and morphology of the MgFe2O4/ZnO nanocomposite were investigated using SEM, TEM, XRD, and VSM analyses.
2.3 Experimental procedures
The extraction method using ultrasound was performed as follows: 10 mL of the desired concentration of dye (500 µg/L) was poured into a 15 mL glass tube and adjusted to pH = 7. Then, 1.53 mg of MgFe2O4/ZnO nanocomposite was added to the test tube. Subsequently, the solution was placed in an ultrasonic bath for 8 min to facilitate mass transfer and dye adsorption onto the MgFe2O4/ZnO nanocomposite. After the desired time elapsed, the adsorbent was separated from the solution using a centrifugation method (5 min at 3500 rpm) and an external magnetic field. To complete the extraction process, 140 μL of methanol was added to the settled adsorbent. Then the test tube was subjected to ultrasonic treatment for 5 min to enhance the desorption of the analyte from the surface of the adsorbent. The test tube was once again placed inside a centrifuge device for 5 min at 3500 rpm to settle the adsorbent. Then, 20 µL of the liquid extraction phase containing the dye was drawn using a micropipette and analyzed using a UV–Vis spectrophotometer. The response (extraction recovery, ER%) was calculated based on Eq. (1).
In this equation, Csed represents the concentration of dye in the precipitated phase, and C0 denotes the concentration of dye in the sample before extraction. Additionally, Vsed represents the volume of the precipitated phase, and Vaq corresponds to the total volume of the sample.
2.4 Experimental design
RSM is a collection of statistical techniques used in process optimization, where the desired response is influenced by several variables (Rind et al., 2023). With the aid of this statistical design, the number of experiments is reduced, and all second-degree regression model coefficients and interaction effects of the factors can be estimated (Sirichan et al., 2022, Shojaei et al., 2021). Additionally, RSM allows for extracting more information compared to the OFAT method. In the present study, Box-Benken design (BBD) based on RSM method was used to evaluate the coefficients of the selected model. Therefore, the four factors (adsorbent amount, ultrasonic time, pH, and eluent volume) were utilized at three different levels, resulting in a total of 29 experiments conducted based on the BBD, as outlined in Table 1. The experimental conditions included adsorbent amount (X1) of 0.5, 1.5, and 2.5 mg, pH (X2) values of 4, 7, and 10, eluent volume (X3) of 50, 150, and 250 µL, and ultrasonic time (X4) of 4, 8 and 12 min. The optimal conditions were determined using a quadratic equation. To examine the effects and interactions of these parameters on the recovery, significance tests and analysis of variance (ANOVA) were performed, and the results were visually represented through surface plots generated using Design Expert 10 software.
Variables
Symbol
Unit
Range and levels
−1
0
+1
Adsorbent amount
X1
mg
0.5
1.5
2.5
pH of the solution
X2
---
4
7
10
Eluent volume
X3
µL
50
150
250
Ultrasonic time
X4
min
4
8
12
Run
Variables
ER%-MB
ER%-SO
X1
X2
X3
X4
Experimental
Predicted
Experimental
Predicted
1
0
−1
0
−1
67.38
68.50
67.20
66.98
2
−1
0
0
−1
73.64
72.93
62.77
63.31
3
0
0
0
0
96.51
96.94
96.20
95.40
4
−1
0
1
0
51.82
52.88
61.02
61.29
5
−1
0
0
1
75.79
74.84
63.03
62.57
6
0
0
1
1
68.88
68.81
62.81
63.18
7
−1
0
−1
0
75.31
74.58
64.73
64.37
8
0
0
−1
1
84.92
85.48
70.98
71.36
9
−1
1
0
0
76.51
77.39
67.79
67.65
10
1
−1
0
0
62.40
61.34
68.32
68.49
11
0
0
0
0
95.29
96.94
94.62
95.40
12
1
0
0
1
71.73
72.36
70.73
70.41
13
0
0
0
0
97.67
96.94
94.61
95.40
14
0
1
0
1
84.82
83.97
73.28
73.24
15
1
0
0
−1
65.56
66.44
63.75
64.43
16
1
0
−1
0
60.74
59.94
76.37
75.84
17
0
0
1
−1
70.78
70.03
59.02
58.67
18
0
0
0
0
96.97
96.94
95.42
95.40
19
0
1
−1
0
87.99
89.09
76.34
76.96
20
0
−1
1
0
67.17
65.99
63.66
63.26
21
0
1
1
0
56.75
56.69
61.37
61.36
22
0
0
−1
−1
76.55
76.44
70.97
70.63
23
0
−1
0
1
73.79
74.48
64.21
64.27
24
1
1
0
0
61.93
61.29
69.23
69.11
25
−1
−1
0
0
53.77
54.22
60.83
60.99
26
0
1
0
−1
82.55
82.12
65.61
65.29
27
0
−1
−1
0
56.69
56.67
67.56
67.79
28
0
0
0
0
98.28
96.94
96.14
95.40
29
1
0
1
0
57.56
58.55
58.67
58.78
3 Results and discussion
3.1 Characterization of the synthesized nanocomposite
Fig. 1a illustrates the XRD pattern of ZnO nanoparticles, MgFe2O4 nanoparticles, and MgFe2O4/ZnO nanocomposite. According to the Fig. 1a, it was observed that only in the pure ZnO sample, the peaks were broader compared to the other samples. A comparison of the XRD patterns showed no shifts or impurity peaks in the samples. Additionally, the formed peaks of the MgFe2O4/ZnO nanocomposite indicated a decrease in the intensity of the MgFe2O4 peaks upon the addition of ZnO. This could be attributed to the surface coverage of MgFe2O4 nanoparticles by ZnO nanoparticles. Based on Fig. 1a, it can be observed that there were no impurity peaks in the XRD pattern of the prepared ZnO nanoparticles, and the formed peaks perfectly matched the standard reference (JCPDS 36–1451). Similarly, there were no impurity peaks in the XRD pattern of the MgFe2O4 nanoparticles, and the formed peaks were in complete agreement with the standard reference (JCPDS 73–1720) for MgFe2O4 nanoparticles (Su et al., 2014). The crystallite size of the MgFe2O4/ZnO nanocomposite was approximately 10 nm, as determined using the Debye-Scherrer equation. Fig. 1b shows the FE-SEM image of the MgFe2O4/ZnO nanocomposite. As depicted in Fig. 1b, the MgFe2O4/ZnO nanocomposite appeared spherical and exhibited a uniform distribution. No significant aggregation was observed in the image. The average nanoparticle size was calculated to be 20 nm. Fig. 1c displays the TEM image of the MgFe2O4/ZnO nanocomposite. Based on Fig. 1c, the formation of fine crystallites with an average size of approximately 10 nm can be observed. The magnetization curves of MgFe2O4nanoparticles and MgFe2O4/ZnO nanocomposite as a function of the magnetic field are shown in Fig. 1d. In Fig. 1d, it can be observed that the samples exhibit a soft magnetic nature with low coercivity. The values obtained from these curves, including saturation magnetization (Ms), residual magnetization (Mr), and coercivity (Hc) of the samples, are presented in Table 2. Furthermore, based on Fig. 1c, it was observed that the introduction of non-magnetic zinc oxide nanoparticles resulted in a reduction of the saturation magnetization of pure magnesium ferrite nanoparticles.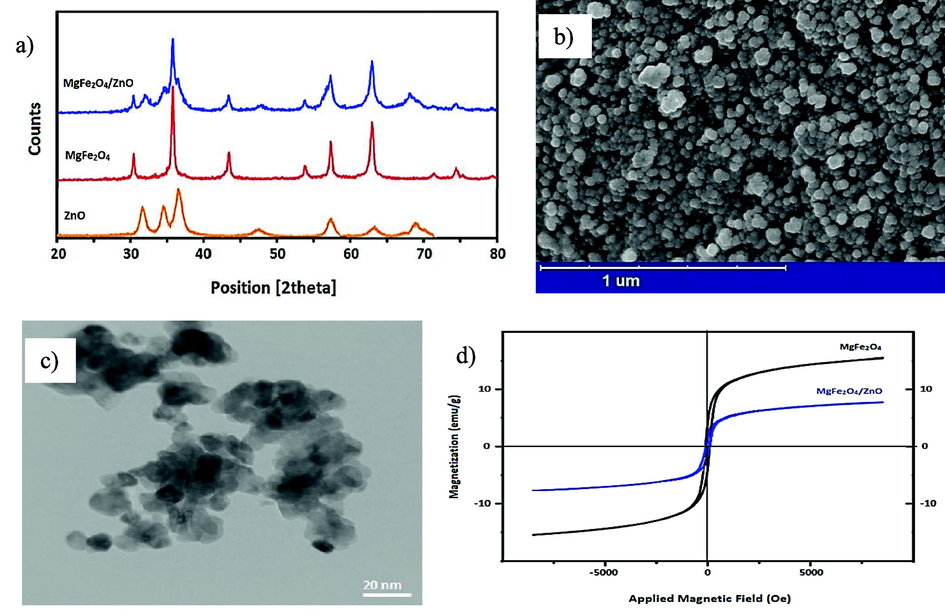
A) xrd patterns, b) fesem image, c) tem image, and d) vsm spectra of mgfe2O4/ZnO nanocomposite.
Sample
Ms (emu/g)
Mr (emu/g)
Hc (Oe)
MgFe2O4
15.38
4.38
104.78
MgFe2O4/ZnO
8.12
2.31
93.57
3.2 Effects of type of eluent
One of the important parameters in the USP-DSPE method is the selection of a suitable eluent. The eluent used should have the ability to desorb the maximum amount of the desired compound. To achieve this, a series of preliminary experiments were conducted before the actual experimental design to select the appropriate eluent with efficient and reproducible analyte desorption from the surface of the nanoparticles. In this study, under identical conditions, methanol, tetrahydrofuran, acetonitrile, and dimethylformamide were examined for selecting the appropriate eluent. Based on Fig. 2, among the investigated solvents, methanol was chosen as the eluent due to its superior extraction results and efficiency. Consequently, methanol was used as the eluent for further studies.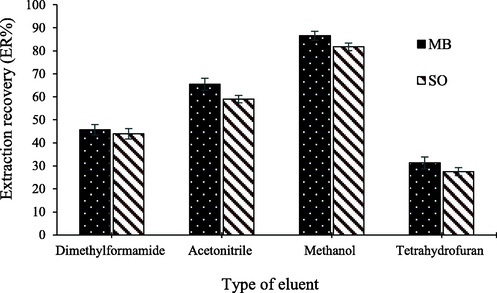
Effect of eluent type on the recovery of MB and SO.
3.3 Effect of the type of mixing
Mixing is another important parameter in the solid-phase extraction method, as it ensures the uniform distribution of the adsorbent in the solution and enhances its interaction with the analyte. For this reason, different mixing techniques were employed to assess their effects on the extraction performance. For this purpose, three types of mixing, including manual, mechanical, and ultrasonication, were applied to the samples for a 5 min. Additionally, a control extraction without mixing was conducted, and its results were compared to those obtained from the mixing methods. As shown in Fig. 3, all three mixing techniques exhibited a more significant impact on the extraction compared to the non-mixed experiment. Based on the results, ultrasonication was selected to achieve the highest extraction efficiency.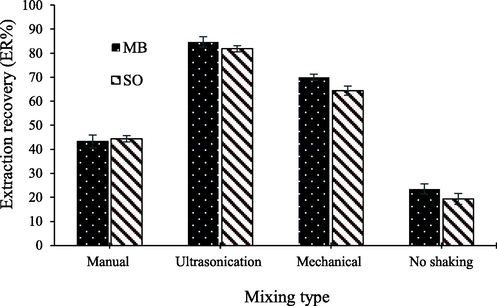
Effect of mixing type on the recovery of MB and SO.
3.4 Fitting of the process model and statistical analysis
In order to obtain the multivariate regression model and predict the response, various linear, quadratic, and polynomial relations were fitted. Then, these models were statistically analyzed so that the appropriate model could be selected. The results of ANOVA of the regression model are shown in Tables S1 and S2. For the quadratic model, it was found that the value of R2 is equal to 1, implying the significance of the fitted model in describing response changes as a function of independent variables (Mohammed et al., 2023, Ameer et al., 2017). The R2 values for MB and SO were 0.9965 and 0.9987, respectively, which means that more than 99.6% of the data changes can be explained. The proximity of R2 and Adjusted R2 values indicates no significant error in the model (Igwilo et al., 2022). In addition, actual values are measured through measurable experiments, and predicted values are estimated through the model. The Adjusted R2 values for MB and SO were 99.29% and 99.74%, respectively, which can be used as a regression model to predict the values of the function variables at different levels of F-value. The coefficients of the dependent variables showed that most of the coefficients were significant (P-value < 0.0001). Adeq-precision measures the signal-to-noise ratio (Kushwah et al., 2023). The most suitable case is a value greater than 4, with 51.60 for MB and 82.61 for SO, indicating a reasonable signal. Also, the quadratic model was significant for efficiency percentage (P-value < 0.0001). Based on the results, the fitted models for each of the extraction response are in terms of Eqs. (2) and (3):
In addition to the statistical criteria to evaluate the model's accuracy, the difference between the predicted and experimental responses (residuals) was used to check the model's accuracy graphically. Also, residuals are considered as unadjusted changes by the model (Sizykh et al., 2023, Saleh et al., 2017). In order to analyze the normality of the test data, the normal probability curve is shown in Fig. S1a and S1b. The proximity of the points to the straight line indicates the normal distribution of the error with a mean of zero and a constant value. The residual diagram is given in Fig. S1c and S1d to evaluate the normal distribution of residues. Fig. S1c and S1d show the consistency between the experimental and predicted values, indicating a good match between R2 and Adjusted R2.
3.5 Study of interactive effects of different parameters on the extraction efficiency
A perturbation plot was utilized to analyze the effects of various factors on a specific point in the design space (Fig. 4a–c). The plot displayed the extraction efficiency (ER%) while changing one factor at a time within its range, while maintaining the other factors constant. This allowed for examining the effects of all factors at their central point, which included a pH value of 7, 1.53 mg of MgFe2O4/ZnO, 140 µL of methanol, and 8 min of sonication.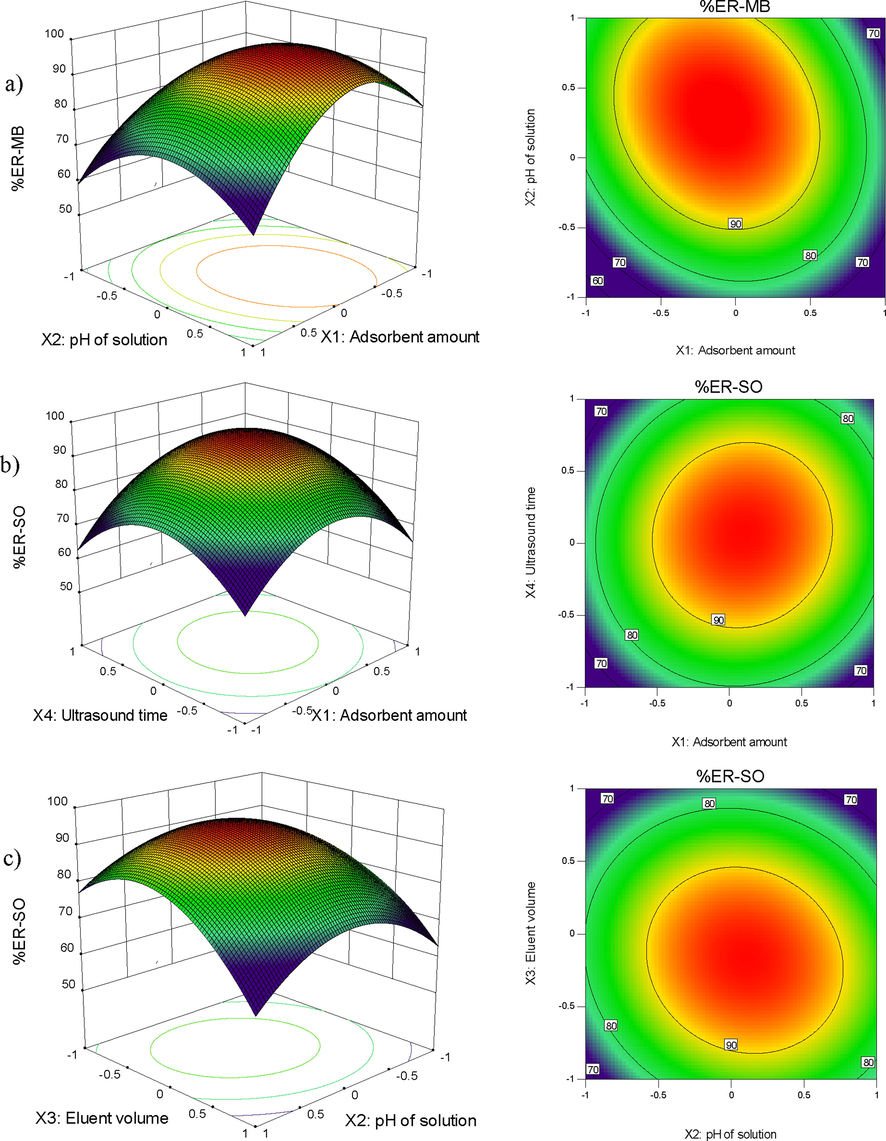
Response surface and contour plots for combined effect of pH and adsorbent amount (a), ultrasonic time and adsorbent dosage (b), eluent volume and pH (c) on the ER% of MB and SO by USA-DSPE method.
Fig. 4a and 4c demonstrate that the maximum recovery of MB and SO (95%) was achieved at pH = 7, while the minimum recovery (50%) was observed at pH values below 4. This behavior can be explained by considering the protonation and deprotonation of surface functional groups of dye and the sorbent (Zahara et al., 2023). In alkaline conditions, the positively charged dye was strongly attracted to the negatively charged MgFe2O4/ZnO nanocomposite, resulting in a higher sorption recovery of dye. Conversely, the lowest recovery in acidic conditions is attributed to the increased interionic repulsion between the cationic analyte species and the MgFe2O4/ZnO nanocomposite adsorbent. Alhmaunde et al., Ozalp et al., and Zhang et al. have also reported similar finding regarding the influence of pH on the recovery of dyes (Alhmaunde et al., 2022; Ozalp et al., 2023; Zhang et al., 2020).
The experimental results presented in Fig. 4b confirm that the maximum extraction efficiency (ER%) of SO can be achieved with sonication times exceeding 8 min, indicating the method's rapidity and high efficiency. The initial rapid sorption is attributed to the increased available surface area and vacant sites, which result from the effective dispersion of the adsorbent in the solution through the application of ultrasonic power (Li et al., 2019). Dil et al., in their study, obtained similar results regarding the increase in extraction recovery with the increase in ultrasonic time in the extraction of dye using the ultrasound-assisted dispersive solid-phase microextraction method (Dil et al., 2016).
The combined effects of eluent volume and pH on the extraction of SO (Fig. 4c) indicate that increasing the pH and eluent volume results in higher recovery rates. Furthermore, elution with a small volume of eluent allows for maximum preconcentration and enrichment factor (Ragheb et al., 2021). However, using an excessive amount of adsorbent in the USA-DSPE method reduces the dispersibility of the eluent volume and increases the recovery of SO (Nguyen et al., 2023).
Increasing the amount of adsorbent leads to an increase in the contact surface area and active binding sites. Therefore, a higher presence of binding sites provides more effective functional groups that play a crucial role in the adsorption process of SO. As shown in Fig. 4a and 4b, increasing the amount of adsorbent enables the establishment of more bonds between the cations of the dye and the opposite charges on the functional groups of the adsorbent. The increase in the number of these interactions between dye molecules and the surface of the adsorbent results in higher dye adsorption from the aqueous solution and improves the extraction efficiency (An et al., 2022). In a study, Shojaei et al. achieved similar results in evaluating the effect of adsorbent amount on the extraction recovery of MG and MB dyes. Their results showed that the extraction efficiency of MG and MB dyes increased with the increase of adsorbent amount (Shojaei et al., 2023).
3.6 Optimization of extraction conditions
Aside from achieving a higher recovery percentage, less solvent and adsorbent consumption is considered to reduce the cost of operation. In order to verify the extraction of dyes, the effect of four factors (eluent volume, ultrasonic time, adsorbent amount, and pH) was investigated. In order to investigate the effect of these factors on dyes recovery, the optimization procedure was used. Table 3 shows the levels associated with each of the factors. All experiments were performed based on the proposed method. In all these experiments, extraction recovery was considered as the answer. Based on the results, the highest recovery percentage of dyes extraction in optimal parameter conditions by the USA-DSPE method was 98.60% and 97.23% for MB and SO, respectively.
Variables
Optimal conditions
ER%
X1
X2
X3
X4
Experimental values
Predicted values
MB
1.53 mg
7
140 µL
8 min
98.60 ± 1.2
98.27
SO
1.53 mg
7
140 µL
8 min
97.23 ± 1.0
96.01
3.7 Study of sample volume and preconcentration factor
In order to measure very low concentrations and achieve high preconcentration factors in extraction methods, the maximum possible sample volume containing the analyte (which leads to the highest extraction efficiency under optimal conditions) is utilized. Based on this, sample volumes ranging from 5 to 20 mL containing 500 µg/L of the investigated dye were used. As observed in Fig. 5, the extraction efficiency remains approximately constant up to a volume of 10 mL, and it decreases at higher volumes. Therefore, by selecting 10 mL as the sample volume, a preconcentration factor of 71.5 was obtained.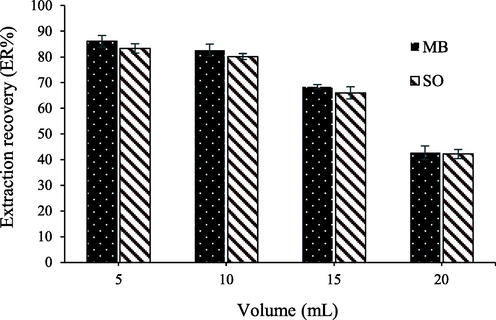
Effect of sample volume on the recovery MB and SO dyes.
3.8 Analytical performance of the USA-DSPE method
The USA-DSPE method was investigated for preconcentration and determination of MB and SO value in optimal conditions. Analytical properties include linear range (LR), the limit of detection (LOD), the limit of quantification (LOQ), relative standard deviation (%RSD), coefficient of determination (R2), enrichment factor (EF), preconcentration factor (PF), and extraction recovery (ER) was calculated by optimized variables to evaluate the performance of the extraction method and resulted presented in Table 4. The detection limit was calculated by 3Sb/m. Sb is the standard deviation of the control, and m is the slope of the calibration curve. LOD values for MB and SO were 1.5 µg/L and 3 µg/L, respectively. The relative standard deviation for five measurements of dyes with a concentration of 500 µg/L was<3% for both dyes. The dyes measurement calibration diagram was linear in the range of 5–1000 µg/L for MB and 10–1100 µg/L for SO. The results showed that the extraction efficiency of method is in the range of 96.16%–98.02%.
Dye
MB
SO
Regression equation
y = 0.0013x − 0.0120, R2 = 0.9884
y = 0.000014x + 0.000152, R2 = 0.9973
Linear range
5–1000 µg/L
10–1100 µg/L
Limit of detection (LOD)
1.5 µg/L
3 µg/L
Limit of quantification (LOQ)
5 µg/L
10 µg/L
Preconcentration factor
71.5
71.5
Enrichment factor
92
100
RSD (n = 5)
1.1%
2.1%
Average recoveries
98.02%
96.16%
3.9 Study of interferences
One of the key parameters that contribute to understanding the capability of an analytical method is evaluating its performance in the presence of interfering species. By examining the interferences, the selectivity of a method can be determined. Essentially, the method's capability should be sufficient to accurately measure the target analyte among various other species with different concentrations. To achieve this, the interferences of different species on dye extraction were investigated under optimal conditions. In this investigation, if the target species resulted in more than a 5% error in dye measurement, it was considered as an interference. The results of this study are presented in Table 5, indicating that the proposed method exhibits relatively high selectivity.
Foreign species
Tolerance (mg/L)
MB
SO
Na+, K+, Mg2+, Ca2+
900
1000
Cl-, Br-, F-, Co2+
700
700
Cu2+, Ni2+, Zn2+
500
400
Fe3+, Pb2+
100
100
3.10 Reusability of the MgFe2O4/ZnO nanocomposite
MgFe2O4/ZnO nanocomposite can be easily separated from the solution, washed, and reused without changing its structure. To separate MgFe2O4/ZnO nanocomposite, after completing the reaction, an external magnetic field (magnet) was applied to the container, and magnetic nanoparticles intensely moved toward the magnet and accumulated. In this case, the solution overflowed into another container, and the remaining MgFe2O4/ZnO nanocomposite in the first container was washed with methanol. Afterward, the remaining MgFe2O4/ZnO nanocomposite was dried at ambient temperature to be prepared for the subsequent use. The process of separating and using MgFe2O4/ZnO nanocomposite was replicated in 6 consecutive times. The recovery rate of MgFe2O4/ZnO nanocomposite and the activity of MgFe2O4/ZnO nanocomposite in the sample reaction were evaluated. On average, more than 95% of MgFe2O4/ZnO nanocomposite was recovered from the reaction medium each time, and maintaining the properties of MgFe2O4/ZnO nanocomposite yielded more than 90% efficacy under optimal conditions. The incurred results approved the recovery property for MgFe2O4/ZnO nanocomposite (Fig. 6a and 6b).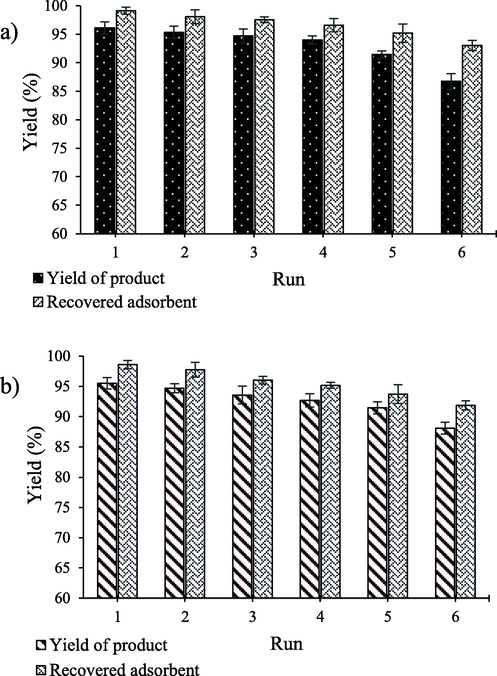
The reusability of adsorbent for extraction of a) MB and b) SO.
3.11 Dyes measurement in environmental water samples
After determining the optimal conditions, several environmental water samples were analyzed to assess the applicability of the USA-DSPE method. The water samples included tap water, river water, mineral water, and wastewater. Prior to analysis, the samples were filtered using 450 μm filter paper to remove impurities. Subsequently, a specific amount of dyes was added to the water samples, and the analysis was conducted under optimal conditions. The laboratory data were documented in Table S3. According to the results presented in Table S3, the extraction efficiency of MB and SO dyes from natural water samples ranged from 93.74% to 99.11%, with an RSD (n = 3) ranging from 1% to 4%. Based on these findings, the USA-DSPE method exhibits the potential for extracting MB and SO dyes in various water samples. The laboratory data represent the average of three replicates with a 95% confidence level.
3.12 Comparison of the presented procedure with other methods
To compare the performance of the USA-DSPE method used in this study, these results were compared with various studies used for dyes extraction (Table 6). The amount of LDs and LODs reported in the present research can be compared with other methods. Also, the relative standard deviation (RSD) values of the methods in this study are lower than other methods (RSD < 3), while in most similar studies, the declared RSD is higher than 3%, which has high accuracy. Most of the aforementioned methods have utilized high-sensitivity and selective analysis devices such as HPLC or MS. However, the extensive application of these devices for dye analysis is impractical in developing countries due to their high cost. Consequently, the proposed approach, in conjunction with spectrophotometry, offers a suitable alternative for the preconcentration and extraction of trace amounts of dyes from aqueous samples. This method exhibits notable advantages, including high sensitivity, simplicity, rapidity, and reproducibility. Also, the results of this study showed that using the RSM technique reduces the number of tests to determine the optimal extraction conditions, and it can also reduce investigation time and costs.
Method
Dye
Time (min)
Linear Range
Limit of detection
Relative standard deviation
Enrichment factor
Reference
Salting-out assisted liquid–liquid extraction- spectrophotometry
MB
2
0.2–7 mg/L
0.06 mg/L
2.2%
*
Razmara et al., 2011
Ionic liquid-based matrix solid-phase dispersion coupled with homogeneous liquid–liquid microextraction- HPLC
SO
5
40–2000 μg kg−1
16.6 μg kg−1
≤ 20%
*
Wang et al., 2014
Liquid–liquid extraction- capillary electrophoresis
MB
20
1–60 μg mL−1
1 μg mL−1
*
4.7
Borwitzky et al., 2005
Ultrasound-assisted dispersive solid-phase microextraction- spectrophotometry
SO
10
25–3500 ng mL−1
6.3 ng mL−1
3%
124.59
Dil et al., 2016
Shaker-assisted liquid–liquid microextraction- spectrophotometry
2
2–170 ng mL−1
0.5 ng mL-1
8.5%
173.18
Ahmadi et al., 2019
Solid-phase extraction- UPLC-MS/MS
MB
2
0.01–5 μg mL−1
0.1 ng mL−1
2.5%
*
Khan et al., 2014
Ultrasound-assisted dispersive solid-phase extraction- spectrophotometry
SO
8
10–1100 μg L−1
3 μg L−1
2.1%
100
Represented method
Ultrasound-assisted dispersive solid-phase extraction- spectrophotometry
MB
8
5–1000 μg L−1
1.5 μg L−1
1.1%
92
Represented method
4 Conclusion
In the present study, the USA-DSPE method paired with spectrophotometry for preconcentration and determination of MB and SO dyes from water samples was successfully developed. Various effective variables, including eluent volume, adsorbent amount, ultrasonic time, and pH were studied and optimized. The BBD-based RSM was used in this study to select the best laboratory conditions for the extraction of dyes. According to the results, quadratic models were statistically significant. The pred-R2 and adj-R2 values were in good agreement, indicating the adequacy of the quadratic model. The optimal conditions for the extraction process were 1.53 mg of adsorbent, 140 µL of eluent volume, 8 min of ultrasonic time, and pH = 7. The linear ranges for MB and SO were 5–1000 μg L−1 and 10–1100 μg L−1, respectively. The LODs for MB and SO were 1.5 μg L−1 and 3 μg L−1, respectively. In addition, the relative standard deviation (n = 5) for MB and SO was between 1.1% and 2.1%. Also, the recovery percentage of dyes in optimal conditions for environmental water samples was 93.74–99.11%. The results of interference studies indicate that different cations and anions did not significantly interfere with the determination of the MB and SO dyes. The reusability of the adsorbent showed that it could be reused for several cycles and maintain its high efficiency in the extraction of dyes. Further, the optimized method in this study can be widely used with high efficiency for pre-concentrating and determining MB and SO dyes from water and wastewater samples.
CRediT authorship contribution statement
LeilaBaharinikoo: Project administration Abduladheem TurkiJalil: Data curation Rahman S.Zabibah: Data curation LaithYassen Qassem: Formal analysis HalaBabur: Formal analysis Ibrahim MouradMohammed: Formal analysis JinfengFu: Supervision ThairAljawahiry: Writing – review & editing Farag M.A.Altalbawy: Writing – review & editing.
Acknowledgments
The authors are grateful to the Jiaozuo University for kind support.
Declaration of Competing Interest
The authors declare that they have no known competing financial interests or personal relationships that could have appeared to influence the work reported in this paper.
References
- Shaker-assisted liquid-liquid microextraction of methylene blue using deep eutectic solvent followed by back-extraction and spectrophotometric determination. Microchem. J.. 2019;145:501-507.
- [Google Scholar]
- Fast and simple method for the detection and quantification of 15 synthetic dyes in sauce, cotton candy, and pickle by liquid chromatography/tandem mass spectrometry. Arabian J. Chem.. 2020;13:3882-3888.
- [Google Scholar]
- Facile synthesis of new magnetic sorbent based on MOF-on-MOF for simultaneous extraction and determination of three benzodiazepines in various environmental water samples using dispersive micro solid-phase extraction and HPLC. Microchem. J.. 2022;181:107802
- [Google Scholar]
- Optimization of Portulaca oleracea L. extract using response surface methodology and artificial neural network and characterization of bioactive compound by high-resolution mass spectroscopy. Arabian J. Chem.. 2023;16:104425
- [Google Scholar]
- Optimization of microwave-assisted extraction of total extract, stevioside and rebaudioside-A from Stevia rebaudiana (Bertoni) leaves, using response surface methodology (RSM) and artificial neural network (ANN) modelling. Food chem.. 2017;229:198-207.
- [Google Scholar]
- Recent applications and novel strategies for mercury determination in environmental samples using microextraction-based approaches: a review. J. Hazard Mater. 2022:128823.
- [Google Scholar]
- Simultaneous determination of four sedative-hypnotics in human urine based on dendritic structured magnetic nanomaterials. Arabian J. Chem.. 2022;15:104363
- [Google Scholar]
- Synthesis of magnetic tungsten disulfide/carbon nanotubes nanocomposite (WS2/Fe3O4/CNTs-NC) for highly efficient ultrasound-assisted rapid removal of amaranth and brilliant blue FCF hazardous dyes. J. Hazard. Mater.. 2021;420:126644
- [Google Scholar]
- Magnetic Cu: CuO-GO nanocomposite for efficient dispersive micro-solid phase extraction of polycyclic aromatic hydrocarbons from vegetable, fruit, and environmental water samples by liquid chromatographic determination. Talanta. 2020;218:121131
- [Google Scholar]
- RSM-CCD design of malachite green adsorption onto activated carbon with multimodal pore size distribution prepared from Amygdalus scoparia: Kinetic and isotherm studies. Polyhedron. 2019;171:464-472.
- [Google Scholar]
- Thin-layer chromatography/metal underlayer-ATR FTIR methodology for the study of synthetic dyes extracted from degraded wool fibres. New J. Chem.. 2019;43:9411-9419.
- [Google Scholar]
- Analysis of methylene blue in human urine by capillary electrophoresis. J. Chromatogr. B.. 2005;826:244-251.
- [Google Scholar]
- Boosted sono-oxidative catalytic degradation of Brilliant green dye by magnetic MgFe2O4 catalyst: Degradation mechanism, assessment of bio-toxicity and cost analysis. Ultrason. Sonochem.. 2021;75:105592
- [Google Scholar]
- A perspective on developing solid-phase extraction technologies for industrial-scale critical materials recovery. Green Chem.. 2022;24:2752-2765.
- [Google Scholar]
- Multi-energy calibration and sample fusion as alternatives for quantitative analysis of high silicon content samples by laser-induced breakdown spectrometry. J. Anal. At. Spectrom.. 2019;34:1701-1707.
- [Google Scholar]
- Trace determination of safranin O dye using ultrasound assisted dispersive solid-phase micro extraction: Artificial neural network-genetic algorithm and response surface methodology. Ultrason. Sonochem.. 2016;33:129-140.
- [Google Scholar]
- Ferrite materials for photoassisted environmental and solar fuels applications. Heterog. Photocatal. 2019:107-162.
- [Google Scholar]
- Switchable-hydrophilicity solvent liquid–liquid microextraction prior to magnetic nanoparticle-based dispersive solid-phase microextraction for spectrophotometric determination of erythrosine in food and other samples. Food Chem.. 2021;348:129053
- [Google Scholar]
- RSM, ANN and ANFIS applications in modeling fermentable sugar production from enzymatic hydrolysis of Colocynthis Vulgaris Shrad seeds shell. Bioresour. Technol. Rep.. 2022;18:101056
- [Google Scholar]
- Facile fabrication of ternary nanocomposite of MgFe2O4 TiO2@ GO for synergistic adsorption and photocatalytic degradation studies. Ceram. Int.. 2019;45:8646-8659.
- [Google Scholar]
- Quantitative determination of methylene blue in environmental samples by solid-phase extraction and ultra-performance liquid chromatography-tandem mass spectrometry: a green approach. RSC Adv.. 2014;4:34037-34044.
- [Google Scholar]
- Insight into the adsorption of dyes onto chitin in aqueous solution: an experimental and computational study. Arabian J. Chem.. 2022;15:104293
- [Google Scholar]
- Optimization of drying parameters for hybrid indirect solar dryer for banana slices using response surface methodology. Process Saf. Environ. Prot.. 2023;170:176-187.
- [Google Scholar]
- Beyond dispersive liquid–liquid microextraction. J. Chromatogr. A.. 2014;1335:2-14.
- [Google Scholar]
- Magnetic porous organic polymers for magnetic solid-phase extraction of triazole fungicides in vegetables prior to their determination by gas chromatography-flame ionization detection. J. Chromatogr. A.. 2019;1601:1-8.
- [Google Scholar]
- Anaerobic co-digestion of sewage sludge and bio-based glycerol: optimisation of process variables using one-factor-at-a-time (OFAT) and Box-Behnken Design (BBD) techniques. S. Afr. J. Chem. Eng.. 2022;40:87-99.
- [Google Scholar]
- A comprehensive review on the application of response surface methodology for optimization of biodiesel production using different oil sources. J. King Saud Univ. Eng. Sci.. 2022;34:198-208.
- [Google Scholar]
- Ultrasound assisted extraction of Maxilon Red GRL dye from water samples using cobalt ferrite nanoparticles loaded on activated carbon as sorbent: optimization and modeling. Ultrason. Sonochem.. 2017;38:672-680.
- [Google Scholar]
- Conventional and ultrasound-assisted methods for extraction of bioactive compounds from red araçá peel (Psidium cattleianum Sabine) Arabian J. Chem.. 2020;13:5800-5809.
- [Google Scholar]
- Recent advancements in microfluidic chip biosensor detection of foodborne pathogenic bacteria: a review. Anal. Bioanal. Chem.. 2022;414:2883-2902.
- [Google Scholar]
- Comparative studies of RSM Box-Behnken and ANN-Anfis fuzzy statistical analysis for seawater biodegradability using TiO2 photocatalyst. Chemosphere.. 2023;314:137665
- [Google Scholar]
- On-line dual-stage enrichment via magneto-extraction and electrokinetic preconcentration: a new concept and instrumentation for capillary electrophoresis. Anal. Chim. Acta.. 2023;1255:341141
- [Google Scholar]
- Magnetic solid-phase extraction of atrazine with ACC@ NiCo2O4@ Fe3O4 nanocomposite in spice and water samples. Sep. Sci. Technol.. 2023;58:916-928.
- [Google Scholar]
- Magnetic solid-phase extraction using metal–organic framework-based biosorbent followed by ligandless deep-eutectic solvent-ultrasounds-assisted dispersive liquid–liquid microextraction (DES-USA-DLLME) for preconcentration of mercury (II) Microchem. J.. 2021;166:106209
- [Google Scholar]
- Determination of methylene blue and sunset yellow in wastewater and food samples using salting-out assisted liquid–liquid extraction. J. Ind. Eng. Chem.. 2011;17:533-536.
- [Google Scholar]
- Synthesis of TiO2 nanoparticles loaded on magnetite nanoparticles modified kaolinite clay (KC) and their efficiency for As (III) adsorption. Chem. Eng. Res. Des.. 2023;191:523-536.
- [Google Scholar]
- Optimization of parameters with experimental design for the adsorption of mercury using polyethylenimine modified-activated carbon. J. Environ. Chem. Eng.. 2017;5:1079-1088.
- [Google Scholar]
- Review on magnetic spinel ferrite (MFe2O4) nanoparticles: from synthesis to application. Heliyon. 2023
- [Google Scholar]
- Removal of the hazardous dyes through adsorption over nanozeolite-X: simultaneous model, design and analysis of experiments. Polyhedron. 2021;196:114995
- [Google Scholar]
- Ultrasound assisted based solid phase extraction for the preconcentration and spectrophotometric determination of malachite green and methylene blue in water samples. Arabian J. Chem.. 2023;16:104868
- [Google Scholar]
- Optimization of ultrasound extraction of functional compound from makiang seed by response surface methodology and antimicrobial activity of optimized extract with its application in orange juice. Ultrason. Sonochem.. 2022;83:105916
- [Google Scholar]
- Enhanced catalyst-free degradation and mineralization of ceftriaxone by UV/H2O2 and UV/S2O82− processes using KrCl excilamp (222 nm) J. Photochem. Photobiol., A.. 2023;436:114357
- [Google Scholar]
- Fabrication of MgFe2O4–ZnO heterojunction photocatalysts for application of organic pollutants. Mater. Lett.. 2014;122:201-204.
- [Google Scholar]
- Development of aerogels in solid-phase extraction and microextraction. TrAC, Trends Anal. Chem.. 2022;146:116497
- [Google Scholar]
- Solid-phase microextraction based on nickel-foam@ polydopamine followed by ion mobility spectrometry for on-site detection of Sudan dyes in tomato sauce and hot-pot sample. Talanta.. 2020;207:120244
- [Google Scholar]
- Solid-phase extraction techniques based on nanomaterials for mycotoxin analysis: an overview for food and agricultural products. J. Sep. Sci.. 2022;45:2273-2300.
- [Google Scholar]
- Experimental and theoretical investigation for the spectrophotometric determination of thiabendazole in fruit samples. Microchem. J.. 2021;168:106488
- [Google Scholar]
- Applications and opportunities for ultrasound assisted extraction in the food industry—a review. Innovative Food Sci. Emerging Technol.. 2008;9:161-169.
- [Google Scholar]
- Ionic liquid-based matrix solid-phase dispersion coupled with homogeneous liquid–liquid microextraction of synthetic dyes in condiments. J. Chromatogr. A.. 2014;1348:52-62.
- [Google Scholar]
- Removal of drug and dye from aqueous solutions by graphene oxide: Adsorption studies and chemometrics methods. NPJ Clean Water.. 2022;5:5.
- [Google Scholar]
- Mass transfer simulation on remazol brilliant blue R dye adsorption by optimized teak wood Based activated carbon. Arabian J. Chem.. 2023;16:104780
- [Google Scholar]
- Removal of divalent cations and oxyanions by keratin-derived sorbents: Influence of process parameters and mechanistic studies. Sci. Total Environ.. 2023;891:164288
- [Google Scholar]
- Synthesis of dummy-template molecularly imprinted polymer adsorbents for solid phase extraction of aminoglycosides antibiotics from environmental water samples. Talanta.. 2020;208:120385
- [Google Scholar]
Appendix A
Supplementary material
Supplementary data to this article can be found online at https://doi.org/10.1016/j.arabjc.2023.105126.
Appendix A
Supplementary material
The following are the Supplementary data to this article:Supplementary data 1
Supplementary data 1
See Figs. S1 and Tables S1-S3.


