

Translate this page into:
Untargeted-metabolomics differentiation between poultry samples slaughtered with and without detaching spinal cord
⁎Corresponding authors at: Pharmacognosy Group, Department of Pharmaceutical Biosciences, Biomedical Centre, Uppsala University, SE- 751 23 Uppsala, Sweden (H.R. El-Seedi). H. E. J. Research Institute of Chemistry, International Center for Chemical and Biological Sciences, University of Karachi, Karachi 75270, Pakistan (S.G. Musharraf). hesham.el-seedi@farmbio.uu.se (Hesham R. El-Seedi), musharraf1977@yahoo.com (Syed Ghulam Musharraf)
-
Received: ,
Accepted: ,
This article was originally published by Elsevier and was migrated to Scientific Scholar after the change of Publisher.
Abstract
Abstract
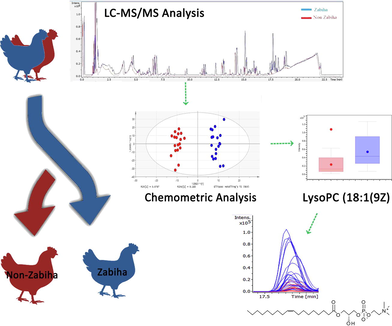
Chicken meat is among the common and relatively inexpensive source of protein consumed worldwide from the poultry industry. Many communities show concern regarding the procedure of slaughtering animals for meat consumption due to ethical, religious, or cultural reasons. Liquid chromatography-electrospray ionization-tandem mass spectrometry (LC-ESI-MS/MS) based untargeted metabolomics of 40 chicken meat samples were evaluated to differentiate meat samples based on slaughtering methods. Samples were grouped into, Zabiha (cutting neck without detaching spinal cord) and Non-Zabiha (completely detaching neck). A volcano plot reveals at least 150 features found significantly different between the two groups having ≥ 2-fold changes in intensities with p-values ≤ 0.05. Among them 05 identified and 25 unidentified metabolites have clear differences in peak intensities. The identified features can be employed to differentiate meat obtained from different slaughtering methods. A characteristic pattern based on principal component analysis (PCA) and orthogonal partial least square-discriminant analysis (OPLS-DA) was observed among the groups. The results will benefit Halal certification, food safety, and security agencies to curb food fraud.
Keywords
Food fraud
Halal
LC-ESI-MS/MS
Metabolomics
Slaughtering
Zabiha

1 Introduction
Food plays a vital role in social, cultural, and religious lifestyles across the globe (Jorfi et al., 2012). Chicken meat is a cheaper and common portion of food in most parts of the world as a source of proteins, essential amino acids, minerals, vitamins, and essential fatty acids (Ali et al., 2011). Production and export of chicken meat is an important industry and business worldwide. Due to globalization variety of food products of different geographical origins are available to consumers. Many of the consumers are interested in knowing the quality, production method, geographical origin, and authenticity of food products for ethical, social, religious, and/or dietary considerations (Danezis et al., 2016, Ellis et al., 2005). Global competition to produce the cheapest products promotes economic fraud such as mislabeling of products (Cajka et al., 2013, Ruiz Orduna et al., 2015). Such practices not only shake the trust of consumers but are also a mounting challenge for relevant authorities to establish meat authenticity (Ellis et al., 2015, Primrose et al., 2010). Although, there are several developed methods to control food fraud but there is no such method that can differentiate slaughtering methods.
Countries such as the USA, China, Brazil, etc., are among the biggest exporters of meat. Globally spread Muslim and or Jewish population of over 1.6 billion (Center, 2015, Desilver and Masci, 2017) consume and import chicken meat to be produced from specific rights of slaughter from these producers. This requires the Halal food authorities to confirm the meat to be produced according to the Islamic rights i.e. Zabiha slaughter. Zabiha (or Dhabiha, ZA) slaughtering procedure involves the severing of the throat with a single stroke of a sharp knife thus cutting a carotid artery, jugular vein, windpipe, and esophagus without injuring the spinal cord. Non-Zabiha (NZ) slaughter may involve completely cutting off the neck of the animal during slaughter. Ali et al. has recently reported the differentiation between zabiha/non-zabiha slaughtering methods suggesting the changes in energy metabolism, however, no details of the parameters for the authentication of identified metabolites and chromatographic profiling were given which seriously limits the scope of the study (Ali et al., 2020). Therefore, methods that can distinguish meat produced from Zabiha slaughter from other common methods are of great economic, social, and religious importance owing to the Islamic population reaching two billion in near future globally (Center, 2011).
Several attempts had been made to produce methods for the authentication of meat (Ali et al., 2012, Ruiz Orduna et al., 2015, Sidwick et al., 2017, Trivedi et al., 2016). However, they are generally developed to target issues of adulteration of pork or horse meat/fat to chicken meat or beef by identifying specific peptides or DNA. The species authentication to check if the meat label belongs to the actual species is also found in several methods, though possible differentiation of chicken meat samples that only differs from the way of slaughtering is challenging. It is suggested that when various procedures of slaughtering are applied, the animal can undergo different pain or psychological stress specific to the treatment (Grandin, 1980, Morzel et al., 2003). Thus, an organism’s response to specific treatment may result in differences in chemical composition and levels of meat metabolites that can be used to distinguish the meat obtained from the halal or non-halal slaughtering. Additionally, it is reported that different slaughtering methods can result in retainment of blood in meat at different levels (Kotula and Helbacka, 1966).
The term metabolomics is an emerging, broad, and significant field to understand the biochemical phenomena occur in complex cell system of all organisms in response to internal and/or external perturbation especially in medicine and agriculture. It has the potential to be used in forensic and food technology (Dettmer et al., 2007, Liu et al., 2013, Mattes et al., 2014, Robertson, 2005). Untargeted metabolomics can generate a large amount of information from a biological sample which can be subjected to chemometric analysis to find similarities and differences among the samples leading to the level two putative identification of compounds (Hajimohammadi et al., 2014). Sidwick et al. have demonstrated the utility of untargeted metabolomics for the potential differentiation between normally slaughtered and dead on arrival poultry meat samples (Sidwick et al., 2017). This study aimed to analyze differences in poultry samples, due to the slaughtering procedure employed, at the metabolome level using an untargeted metabolomics approach. These differences can be further exploited for differentiating meat obtained from Zabiha and Non-Zabiha slaughter based on potential candidate compounds.
2 Experimental
2.1 Chemicals and reagents
All chemicals and reagents used were of analytical grade. Methanol, formic acid, and chloroform were purchased from Daejung chemicals and metals, Co. (Siheung, Gyeonggi, Korea), while internal standards, N-Fmoc-L-alanine was purchased from Chem-impex international (Wood Dale, IL, USA) and N-Fmoc-L-serine (OtBu) was purchased from GL Biochem Ltd. (Shanghai, China). Deionized water (Milli-Q 18.2 MΩ.cm) was used throughout the study (Millipore, Billerica, MA, USA).
2.2 Sample collection and storage
Meat samples of a total of 40 slaughtered broiler chickens with similar ages (45 ± 2 days), weights (1.8 ± 0.3 kg), and gender (all females) were collected from the same batch of a poultry farm in Karachi, Pakistan. All chickens were fed with the same diet and reared in ambient conditions. Samples were divided into types Zabiha (ZA, n = 20), and Non-Zabiha (NZ, n = 20) samples according to the slaughtering procedure. Zabiha samples were slaughtered using halal protocol while Non-Zabiha were slaughtered by direct cutting of complete neck (including spinal cord) by a trained butcher (Benzertiha et al., 2018, Rahman, 2017) followed by storage at −80 °C for analysis. By considering guidelines of the National Institutes of Health (NIH), ethical clearances for the studies were obtained from the local ethical committee of the International Center for Chemical and Biological Sciences, University of Karachi, Karachi, Pakistan (ethical clearance code is 023-HB-2017). A “Fatwa” (permission in the light of Islamic rights) was obtained from Sanha Halal Associates Pakistan Pvt. Ltd. Karachi, Pakistan.
2.3 Sample preparation
Approximately 0.5 g of each meat sample was taken from different body parts including breast, wing, and leg regions in equal amount followed by homogenization using liquid nitrogen. 100 mg of powder material from each sample was extracted using 400 µL of chloroform and 400 µL methanol. A 50 µL of an internal standard solution consisting of a mixture of N-Fmoc-L-alanine and N-Fmoc-L-serine (OtBu) at a concentration of 10 µg/mL was added to the sample followed by mixing for 20 min at 28 °C. After that 400 µL of Milli-Q was added and the sample was vortex for 15 secs, followed by centrifugation for 10 min at 12000 rpm to separate organic and aqueous layers. For initial experiments, both layers were vacuum dried and then dissolved in methanol: water in ratios of 1:1 and 1:4, respectively, for liquid chromatography mass spectrometry (LCMS) analysis. However, for detailed work, only aqueous layers of all samples were taken to a fresh tube and were evaporated using a vacuum concentrator. Vacuum dried samples were dissolved in a 100 µL mixture of methanol: water (1:4) and a separate quality control (QC) sample was prepared by pooling 10 µL of each prepared sample. A total of 10 blind samples (Zabiha = 05 and Non-Zabiha = 05) were also prepared and run similarly as other samples were done. All samples were transferred to autosampler vials for LC-MS analysis and the data was acquired in a single batch in a random sequence.
2.4 Chromatographic and mass spectrometric parameters
Samples were analyzed on UHPLC (Thermo Scientific Dionex 3000) coupled with an Ultra High-Resolution QTOF mass spectrometer (maxis II, Bruker Daltonics, Bremen, Germany) equipped with the electrospray ion source. The mass spectrometry system was calibrated using an internal calibrant solution (sodium formate 0.1 M) injected at the flowrate of 3 µL/min by using a syringe pump before each injection to ensure a high-level of mass accuracy. The separation was carried on an RP-18 column (100 mm × 3.0 mm, 1.8 µm, Macherey-Nagel, Düren, Germany). The column was maintained at 40 °C and the injection volume was 10 µL. The flow rate of mobile phase was 0.40 mL/min and solvent A was 0.1% formic acid and B was methanol with 0.1% formic acid. The linear gradient to 100% B in 16 min, hold at 100% B for 4 min. Return to 100% A in 2 min followed by 2 min equilibration at 100% A, the total run time was 24 min (Trivedi et al., 2016). All the samples were analyzed in positive ion mode. The parameters were set as following, drying gas temperature of 270 °C, the flow of drying gas was set at 12.0 L/min, a capillary voltage of 4500 V, mass range of 100–1200 m/z, Nebulizer pressure of 3.1 bar, spectral rate 2.00 Hz. The same ion source conditions were also used for MSMS mode. Data were recorded using Bruker Hystar software version 4.1 and calibrated using Data Analysis 4.4 (Bruker). Auto MS/MS analysis was done on pooled samples. Top 3 peaks were selected for MSMS analysis with an active exclusion for 30 sec.
2.5 Metabolite extraction
The potential metabolite features were extracted, aligned and intensity normalized on internal standard with data log2-transformed using Metaboscape 3.0 (Bruker). For feature extraction using Metaboscape software following parameters were used, Intensity threshold was 900 counts, Minimum peak length of 9 spectra, Minimum peak length (recursive) of 7 spectra, Minimum feature for extraction were 1/3 of all analyzed samples including QCs. After retention time correction and chromatogram alignment total of 1186 features were generated. Every feature represents a specific m/z value of [M+H] + ion and possible sodium adducts, retention time, and peak height. For identification and molecular formula generation, exact mass of parent ions were matched with < 3 ppm error and mSigma value < 50 in most cases. MS/MS spectra of significantly different features were searched in the NIST 14 tandem mass spectral library and Mass Bank of Europe.
2.6 Statistical analysis
A statistical tool such as a volcano plot was applied at a 95% confidence level on generated features to find significant features between case studied meat samples. Principal component analysis (PCA) was plotted with the SIMCA 14.0 software (Umetrics, Umea, Sweden) for an impression of the data distribution and similarities between samples i.e. clustering and potential outlier identification. After removing an outlier, the orthogonal partial least square-discriminant analysis (OPLS-DA) model was calculated with unit variance scaling. The cross-validation of OPLS-DA model was performed by permutation analysis (500 times). The quality of the 7-fold cross-validated OPLS-DA model was defined by the R2 and Q2, parameters and was further evaluated using a permutation test.
3 Results and discussion
3.1 Metabolomic profiling by LC-QTOF-MS
Metabolomic Profiling of meat samples was performed using LC-Q-TOF-MS performed in positive mode. Initial data collected on the aqueous and organic extracts of Zabiha samples suggest the presence of a higher number of features with better intensities for an aqueous layer when compared to the organic layer. Therefore, further work was performed on the aqueous layer of the samples. The Base Peak Chromatogram (BPC) of aqueous extracts of both Zabiha and Non-Zabiha samples were found very similar (Supplementary Figure S1). However, few minor peaks seem to differ upon careful visual examination. A chromatogram of one Non-Zabiha sample appear very different and was removed from further statistical analysis. Samples derived from the aqueous phase shows a good chromatographic separation between 5 and 17.5 min. For a detailed investigation of differences between each type of sample, a total of 1186 metabolite features were extracted. A total of 75 out of all metabolites were annotated based on the exact mass measurement by the Human Metabolome Database (HMDB) with at least 10 ppm error and are listed in Supplementary Table S1, Supporting Information. The annotated compounds mostly belong to fatty acids, phospholipids, sphingolipids, amino acids, peptides, glycosides, adenosine triphosphate (ATP), nucleotides, neurotransmitters, and some plant metabolites. Volcano plot between Zabiha and Non-Zabiha samples suggest 150 features that were found significantly different between the two groups with at least two-fold change at 0.05 p-value (Fig. 1). Further, only 05 metabolites among the significantly different features have been identified using MSMS spectral data searched in tandem mass spectral libraries including NIST Tandem MS/MS Library 2014, and Mass Bank of Europe. The level of identification used was described as reported earlier (May and McLean, 2016, Schrimpe-Rutledge et al., 2016). Identified compounds shown in Table 1 belong to peptide and fatty acids which are linolenic acid, 1-(9Z-Octadecenoyl)-sn-glycero-3-phosphocholine, 13-Keto-9Z,11E-octadecadienoic acid, Lysophosphatidylcholine 16:0, and D-erythro-sphinganine. Further validation is required for absolute confirmation by using standard compounds. Additionally, extracted ion chromatograms (EICs) of all compounds were manually extracted in individual raw files to check visible differences in peak intensities. A list of 25 compounds with p-values ≤ 0.05 is presented in Table 2 and box plots showing clear visible differences in intensities are given in Supplementary Figure S2 online. However, we were not able to identify or annotate them. The molecular formulas for those compounds were predicted within < 5 ppm accuracy and isotopic pattern match.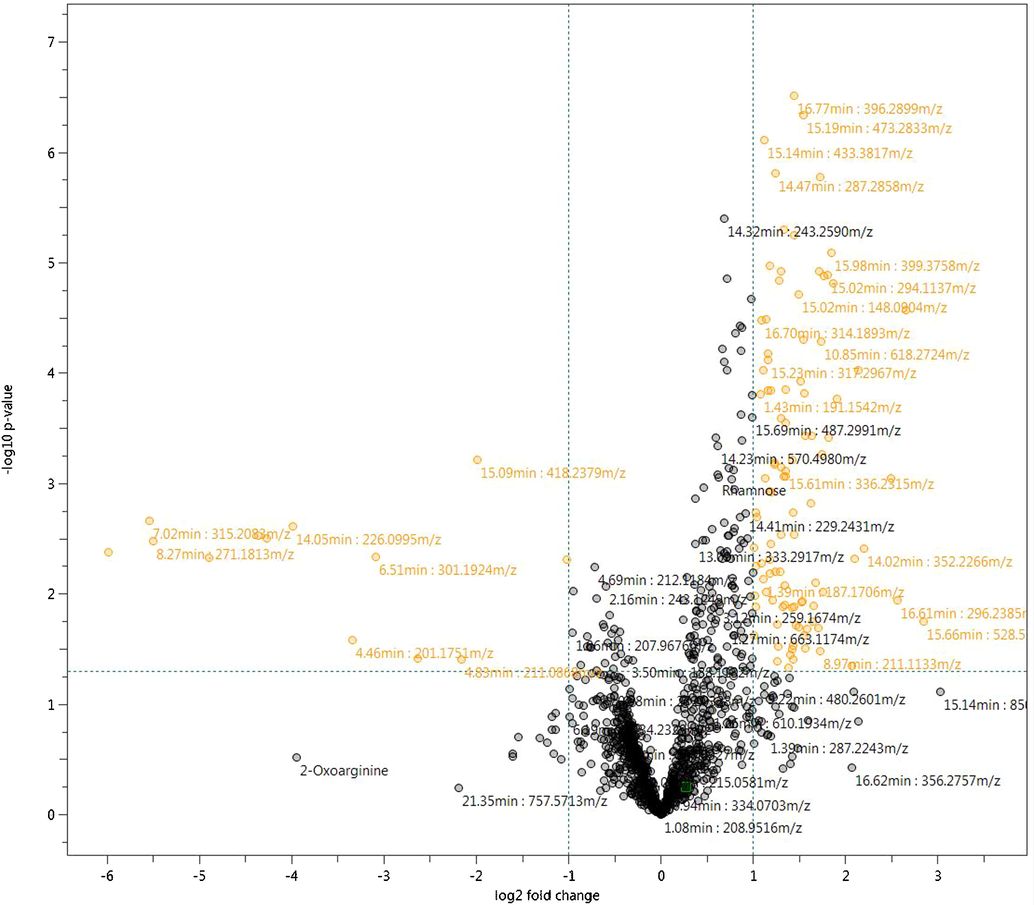
Volcano plot showing significantly different metabolites in orange color between Zabiha and Non-Zabiha samples with at least ≥2-fold change at ≤0.05 p-value.
S. No.
Name
PubChem
ID
RT (min)
Observed mass
(amu)
Formula
Ion type
Calculated mass
(amu)
Error (ppm)
Level of Identification
1
13-Keto-9Z,11E-octadecadienoic acid
6,446,027
14.02
295.2274
C18H30O3
[M + H]+
295.2267
2.4
02
2
Linolenic acid
5,280,934
16.60
279.2318
C18H30O2
[M + H]+
279.2318
0.1
02
3
LysoPhosphatidylcholine 16:0
10,097,314
17.45
496.3407
C24H50NO7P
[M + H]+
496.3397
2.0
02
4
1-(9Z-octadecenoyl)-sn-glycero-3-phosphocholine
16,081,932
17.58
522.3555
C26H52NO7P
[M + H]+
522.3554
0.2
02
5
D-erythro Sphinganine
91,486
15.15
302.3062
C18H39NO2
[M + H]+
302.3053
2.9
02
S. No.
Molecular Formula
m/z
(amu)
p-value
Ion type
RT
(min)
Calculated Mass
(amu)
mSigma value
Error (ppm)
1
C10H39N3O
212.1206
0.03
[M+H]+
08.96
212.1215
34.75
4.24
2
C19H40N4S
379.2864
<0.01
[M+Na]+
18.21
379.2865
78.15
0.26
3
C12H22O6S
295.1210
0.02
[M+H]+
15.02
295.1210
43.95
0.05
4
C22H51N5S
418.3940
<0.01
[M+H]+
15.82
418.3938
73.83
0.49
5
C14H42N5O9P
456.2798
0.01
[M+H]+
16.01
456.2793
21.92
1.12
6
C20H53N5O5
444.4100
<0.01
[M+H]+
15.96
444.4119
57.82
−4.38
7
C18H45N3O10
464.3190
0.03
[M+H]+
17.96
464.3178
32.75
2.65
8
C34H68O22
851.4080
<0.01
[M+Na]+
14.62
851.4094
35.56
−1.70
9
C20H61N13O23
852.4109
<0.01
[M+H]+
15.41
852.4076
95.97
3.87
10
C19H58N12O14
679.4260
<0.01
[M+H]+
17.52
679.4268
20.20
−1.21
11
C17H49N8O15P
637.3129
0.01
[M+H]+
17.55
637.3128
21.81
0.19
12
C15H43N10O14P
619.2796
<0.01
[M+H]+
10.85
619.2771
31.98
4.10
13
C13H33NO5S
316.2155
<0.01
[M+H]+
7.69
316.2152
52.62
0.88
14
C14H43N4O4PS
395.2815
<0.01
[M+H]+
16.71
395.2815
82.47
−0.10
15
C14H38N10O5
427.3080
0.03
[M+H]+
17.95
427.3099
32.09
−4.54
16
C18H41NO6P2
430.2484
<0.01
[M+H]+
9.03
430.2482
47.25
0.49
17
C12H31NO5S
302.1997
<0.01
[M+H]+
6.51
302.1996
52.61
0.43
18
C15H14O2
227.1068
<0.01
[M+H]+
14.05
227.1067
41.48
0.63
19
C16H44N12O5
485.3641
<0.01
[M+H]+
7.1
485.3630
39.55
2.19
20
C18H32O2
303.2330
<0.01
[M+H]+
20.9
371.2703
71.83
2.42
21
C20H32O5
353.2338
<0.01
[M+H]+
14.02
353.2323
63.42
4.39
22
C33H44N2O
507.3351
<0.01
[M+Na]+
17.34
507.3345
68.59
−1.18
23
C20H42O5S
395.2815
<0.01
[M+H]+
16.71
395.2826
69.00
−2.71
24
C19H38N4S
377.2707
<0.01
[M+Na]+
17.84
377.2709
75.73
−0.63
25
C20H41NO10
456.2798
0.01
[M+H]+
16.01
456.2803
47.45
−1.15
3.2 Multivariate data analysis
PCA plot on all extracted features does not show meaningful separation at the x-axis, however, incomplete separation on the y-axis was observed (Supplementary Figure S3). The QC data was plotted with PCA (Supplementary Figure S4) to check the analysis reproducibility and stability of the instrument showing all QC pools were lie in between the samples. The outlier was detected by using Hotelling’s T2 model only one outlier was found with the confidence limit of 99% and 95% (Supplementary Figure S5). After removing an outlier from PCA, OPLS-DA was generated. Construction of stepwise OPLS-DA model, based on the features extracted from the training set, between Zabiha, and Non-Zabiha samples results in the calculated prediction model with excellent performance (R2 = 0.966 Q2 = 0.609, CV ANOVA p < 1.3x10⁻³). For OPLS-DA model generation, Zabiha samples were taken as a control in comparison from Non-Zabiha samples. OPLS-DA plot shows a clear separation of the clusters of Zabiha features on the x-axis distinguishing it from Non-Zabiha samples (Fig. 2). The classification shows 100% correct classification for both Zabiha and Non-Zabiha samples (Supplementary Table S2). For internal validation permutation was performed which suggested a good quality of OPLS-DA (Supplementary Figure S6). Receiver Operating Characteristic (ROC) was also performed to check sensitivity and selectivity for tested samples. Models showed 100% sensitivity and selectivity for the tested samples and area under curve (AUC) values are 0.99 and 1.00 for Zabiha and Non-Zabiha samples, respectively, suggesting the goodness of the fit as shown in Supplementary Figure S7. For external validation of the OPLS-DA model, 10 blind samples were analyzed and tested on the model for classification. The model correctly classifies those blind samples in Zabiha and Non-Zabiha groups, respectively (Supplementary Figure S8). Heatmap was generated using normalized intensities of five statistically significant metabolites and is presented in (Fig. 3). Clear differences in intensities of identified metabolites are evident and thus can potentially be used to differentiate both sample types.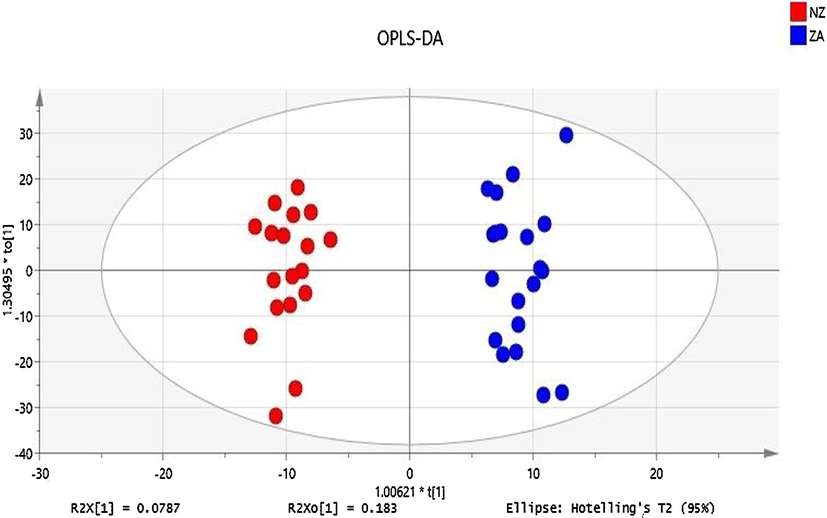
OPLS-DA plot shows a clear differentiation of Zabiha and Non-Zabiha samples on the x-axis.
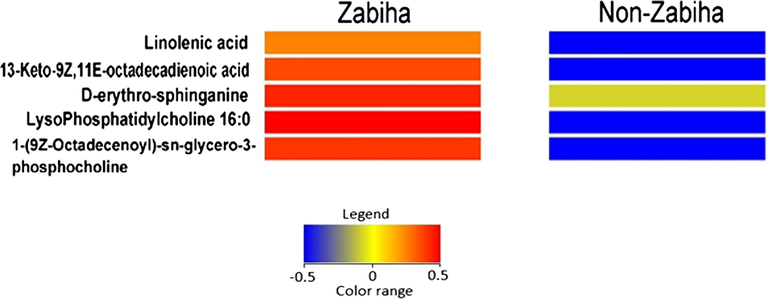
Heatmap showing intensities of metabolites identified by tandem mass spectral library search having ≥ 2-fold change difference at p-value ≤ 0.05 between Zabiha and Non-Zabiha chicken meat samples.
3.3 Identified differential metabolites
1-(9Z-Octadecenoyl)-sn-glycero-3-phosphocholine also termed as LysoPC (18:1(9Z)) and lysophosphatidylcholine 16:0 both are lysophospholipids (LPLs) formed by the substitution of glycerol moiety in monoglycerophospholipid by a phosphorylcholine molecule. Lysophosphatidylcholines are present in most of the animal tissues in small quantities and are derived from phosphatidylcholine hydrolysis by the phospholipase A2 enzyme, as part of the de-acylation/re-acylation cycle. These lipids act as signaling molecules on lysophospholipid receptors (LPL-R) that are members of the G protein-coupled receptor (GPCRs) family of integral membrane proteins (Frasch et al., 2007). Alteration in lysophospholipids i.e. decrease has been reported due to multiple factors like inflammation (Masquelier et al., 2018). The levels of both lysophospholipids i.e. 1-(9Z-octadecenoyl)-sn-glycero-3-phosphocholine (LysoPC (18:1(9Z)) and lysophosphatidylcholine (16:0) were found higher in Zabiha compared to Non-Zabiha samples with p-values of 0.02881 and 0.0152, respectively. The probable reason could be an increased inflammatory response in Non-Zabiha samples that resulted in reduced levels of these two lysophospholipids.
13-keto-9Z,11E-octadecadienoic acid (13-OxoODE) belongs to a group of compounds referred to as linoleic acid derivatives that are produced by an NAD+-dependent dehydrogenase i.e. retinol dehydrogenase, from 13-hydroxyoctadecadienoic acid (13-HODE). The interaction of this molecule with multiple receptors has been reported. However, the reason behind its higher levels in Zabiha chicken meat could be its activity as a repressor of proinflammatory factors. As it has been reported that 13-oxo-ODE binds to peroxisome proliferator-activated receptor gamma (PPARγ) and induce anti-inflammatory effects (Altmann et al., 2007). Differences in levels of this metabolite (with a p-value of 0.02217) suggest that chicken, when slaughtered in a Zabiha manner, might experience decreased inflammatory response.
D-erythro-sphinganine is a dihydrosphingosine that is a key intermediate of ceramide synthesis and a precursor of sphingosine (Górska et al., 2005). Sphinganine is known as a protein kinase C inhibitor and may have beneficial effects (Anderson et al., 2007). Recently, the downregulation of sphingosine has been reported in dead on arrival as compare to normally slaughtered poultry meat (Sidwick et al., 2017). We have observed the presence of both sphingosine and D-erythro-sphinganine in both types of samples. Visually, the intensities of D-erythro-sphinganine were found higher in zabiha samples, however, the t-test does not suggest the differences are significant (p value = 0.8525).
Linolenic acid is a member of omega-3 (Ω-3) fatty acids that are synthesized naturally only in plants, therefore, referred to as essential fatty acids for animal nutrition. This Ω-3-fatty acid is required for the synthesis of precursors of important signaling molecules like leukotrienes, thromboxane, and prostaglandins that are involved in important biological processes (Watson and De Meester, 2015). The presence of linolenic acid has been reported in chicken meat concerning its diet as well (Kartikasari et al., 2012). We have also identified the difference of this essential fatty acid in between Zabiha and Non-Zabiha, that its levels were found relatively higher in Zabiha samples compared to Non-Zabiha samples. As blood is known to be retained in meat tissue during Non-Zabiha slaughter, the release of linolenic acid out of tissue into retained blood is plausible. This, upon washing of tissue, can be lost. To further confirm, the exact masses of both identified and unidentified metabolites were extracted in original data files to check if the intensities are different. These compounds have the potential to be used as putative markers after validation for meat differentiation (Fig. 4).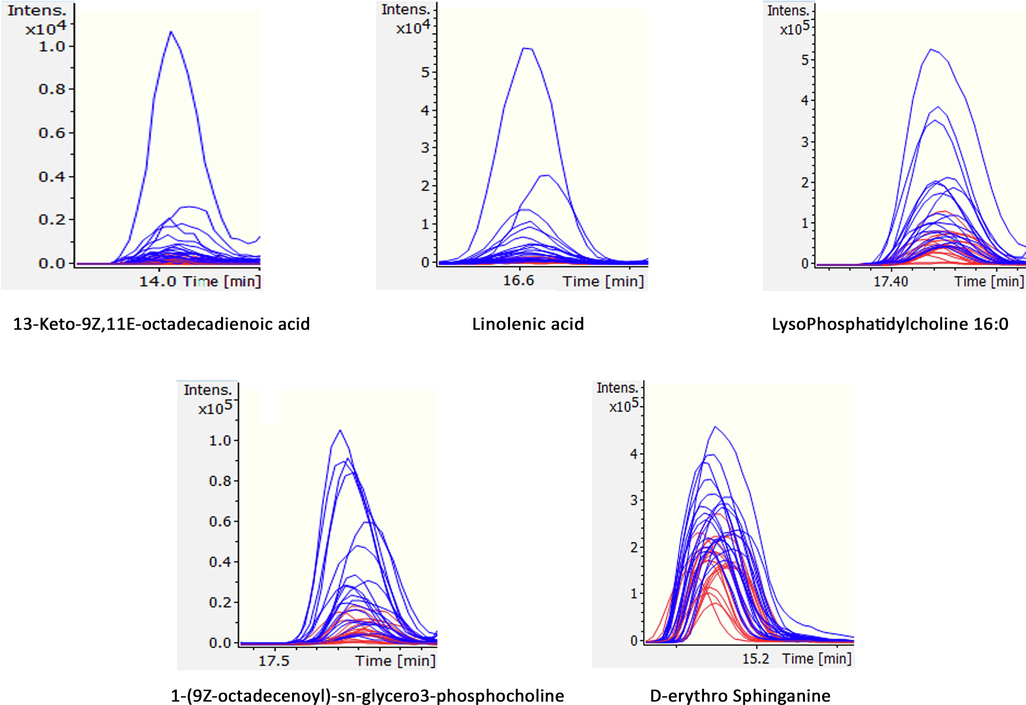
Extracted ion chromatograms (EICs) of the identified metabolites 1–5 in individual samples suggesting clear differences in intensities between each group in original data.
4 Conclusion
Methods differentiating the poultry meat based on slaughtering procedure have immense economic, ethical, cultural, and/or religious importance. It is demonstrated that the untargeted metabolomics approach can be used to distinguishing meat sources when applied to chicken meat samples obtained from Zabiha compared to Non-Zabiha slaughter samples. The comparative LC-MS/MS analysis resulted in pointing out several metabolites that were found significantly different between the sample groups. These identified metabolites are not only beneficial to differentiate the Zabiha sample but also suggest the plausible biological pathways that are perturbed during animal experiencing various slaughtering procedures. This study will be useful for the agencies and authorities that concern the food regulations based on Halal and Kosher slaughtering thus curbing potential food frauds and mislabeling.
Funding
This research work was funded by the Islamic Development Bank.
6 Compliance with Ethics Requirements
All Institutional and National Guidelines for the care and use of animals were followed.
Acknowledgments
The authors are grateful to the Islamic Development Bank for the partial funding of this research work. Mr. Nasir Abbas is thankful to H. E. J. Research Institute of Chemistry for providing study fellowship.
Author contribution
Study design: SGM; Sample collection: Nasir Abbas (NA); Experiments, Investigation and Data interpretation: Nasir Abbas (NA), AA; Statistical Analysis, Software, and Validation: SK, AA; Data analysis: ZAAA and Nisar Ahmed (NA); Biological interpretation: AI. SGM, Nasir Abbas (NA), AA, SK, AI, TS, AH, ZAAA, NA, and HRES assisted in reviewing the manuscript. All authors contributed to manuscript writing.
Declaration of Competing Interest
The authors declare no conflict of interest that pertain to this work.
References
- Species authentication methods in foods and feeds: the present, past, and future of halal forensics. Food Anal. Methods. 2012;5(5):935-955.
- [Google Scholar]
- Effect of different slaughtering methods on metabolites of broiler chickens using Ultra High-Performance Liquid Chromatography-Time of Flight-Mass Spectrometry (UHPLC-TOF-MS) Food Res.. 2020;4(S1):133-138.
- [Google Scholar]
- Effect of slaughtering method on the keeping quality of broiler chickens’ meat. Egypt Poult Sci.. 2011;31(31):727-736.
- [Google Scholar]
- 13-Oxo-ODE is an endogenous ligand for PPARγ in human colonic epithelial cells. Biochem. Pharmacol.. 2007;74(4):612-622.
- [Google Scholar]
- Protein kinase C beta inhibition: the promise for treatment of diabetic nephropathy. Curr. Opin. Nephrol. Hypertens.. 2007;16(5):397-402.
- [Google Scholar]
- Cultural and practical aspects of halal slaughtering in food production. Medycyna Weterynaryjna-Veterinary Medicine-Science and Practice.. 2018;74(6):371-376.
- [Google Scholar]
- Application of direct analysis in real time ionization–mass spectrometry (DART–MS) in chicken meat metabolomics aiming at the retrospective control of feed fraud. Metabolomics. 2013;9(3):545-557.
- [Google Scholar]
- Center P. The Future of the Global Muslim Population: Projections for 2010-2030: January; 2011 [Available from: https://www.pewforum.org/2011/01/27/the-future-of-the-global-muslim-population/.
- Center PR. The future of world religions: Population growth projections, 2010-2050 2015 [Available from: https://www.pewforum.org/2015/04/02/jews/.
- Food authentication: techniques, trends & emerging approaches. TrAC, Trends Anal. Chem.. 2016;85:123-132.
- [Google Scholar]
- Desilver D, Masci D. World's muslim population more widespread than you might think. 2017 [Available from: https://www.pewresearch.org/fact-tank/2017/01/31/worlds-muslim-population-more-widespread-than-you-might-think/.
- Rapid identification of closely related muscle foods by vibrational spectroscopy and machine learning. Analyst.. 2005;130(12):1648-1654.
- [Google Scholar]
- Point-and-shoot: rapid quantitative detection methods for on-site food fraud analysis–moving out of the laboratory and into the food supply chain. Anal. Methods. 2015;7(22):9401-9414.
- [Google Scholar]
- Frasch SC, Zemski-Berry K, Murphy RC, Borregaard N, Henson PM, Bratton DL. Lysophospholipids of different classes mobilize neutrophil secretory vesicles and induce redundant signaling through G2A. Journal of immunology (Baltimore, Md : 1950). 2007;178(10):6540-8.
- Górska M, Dobrzyń A, Baranowski M. Concentrations of sphingosine and sphinganine in plasma of patients with type 2 diabetes. Medical science monitor. 2005;11(1):CR35-CR8.
- The effect of stress on livestock and meat quality prior to and during slaughter. Int. J. Study Anim. Probl.. 1980;1(5):313-337.
- [Google Scholar]
- Theories about effects of Islamic slaughter laws on meat hygiene. Health Scope.. 2014;3(1)
- [Google Scholar]
- Differentiation of pork from beef, chicken, mutton and chevon according to their primary amino acids content for halal authentication. Afr. J. Biotechnol.. 2012;11(32):8160-8166.
- [Google Scholar]
- Dietary alpha-linolenic acid enhances omega-3 long chain polyunsaturated fatty acid levels in chicken tissues. Prostaglandins Leukot. Essent. Fatty Acids. 2012;87(4–5):103-109.
- [Google Scholar]
- Blood retained by chicken carcasses and cut-up parts as influenced by slaughter method. Poult. Sci.. 1966;45(2):404-410.
- [Google Scholar]
- 1H NMR and multivariate data analysis of the relationship between the age and quality of duck meat. Food Chem.. 2013;141(2):1281-1286.
- [Google Scholar]
- Lysophosphatidylinositols in inflammation and macrophage activation: Altered levels and anti-inflammatory effects. Biochimica et Biophysica Acta (BBA)-Molecular and Cell Biology of Lipids. 2018;1863(12):1458-1468.
- [Google Scholar]
- Detection of hepatotoxicity potential with metabolite profiling (metabolomics) of rat plasma. Toxicol. Lett.. 2014;230(3):467-478.
- [Google Scholar]
- Advanced multidimensional separations in mass spectrometry: navigating the big data deluge. Annu Rev Anal Chem (Palo Alto Calif).. 2016;9(1):387-409.
- [Google Scholar]
- Evaluation of slaughtering methods for turbot with respect to animal welfare and flesh quality. J. Sci. Food Agric.. 2003;83(1):19-28.
- [Google Scholar]
- Food forensics: methods for determining the authenticity of foodstuffs. Trends Food Sci. Technol.. 2010;21(12):582-590.
- [Google Scholar]
- Assessment of meat authenticity using bioinformatics, targeted peptide biomarkers and high-resolution mass spectrometry. Food Additives & Contaminants: Part A.. 2015;32(10):1709-1717.
- [Google Scholar]
- Untargeted metabolomics strategies-challenges and emerging directions. J. Am. Soc. Mass Spectrom.. 2016;27(12):1897-1905.
- [Google Scholar]
- Use of liquid chromatography quadrupole time-of-flight mass spectrometry and metabonomic profiling to differentiate between normally slaughtered and dead on arrival poultry meat. Anal. Chem.. 2017;89(22):12131-12136.
- [Google Scholar]
- Meat, the metabolites: an integrated metabolite profiling and lipidomics approach for the detection of the adulteration of beef with pork. Analyst. 2016;141(7):2155-2164.
- [Google Scholar]
- Watson RR, De Meester F. Handbook of lipids in human function: fatty acids: Elsevier; 2015.
Appendix A
Supplementary material
Supplementary data to this article can be found online at https://doi.org/10.1016/j.arabjc.2020.10.032.
Appendix A
Supplementary material
The following are the Supplementary data to this article:Supplementary data 1
Supplementary data 1


