

Translate this page into:
Utilization of camellia oleifera shell for production of valuable products by pyrolysis
⁎Corresponding authors. cskmust@163.com (Song Cheng), baolinxing@hpu.edu.cn (Baolin Xing),
-
Received: ,
Accepted: ,
This article was originally published by Elsevier and was migrated to Scientific Scholar after the change of Publisher.
Peer review under responsibility of King Saud University.
Abstract
Camellia oleifera shell is used as the feedstock to prepare the valuable products by pyrolysis using microwave heating at 400-800 °C. The yield of pyrolysis product is influenced by pyrolysis temperature, which indicates that high pyrolysis temperature promotes to generate bio-gas and restrains the production of biochar. However, pyrolysis temperature little influences the yield of bio-oil. The main compound of bio-oil is phenols, hydrocarbons, ketones, aldehydes and furans, respectively. While, bio-oil produced at 600 °C has as high as 78 % of phenols, which has potential application in chemical industries. The pyrolysis temperature has significantly influenced the composition and heating value of bio-gas. The maximum heating value of bio-gas is 12.44 MJ/Nm3, which is achieved at 600 °C. The physiochemical properties of biochar are also influenced by pyrolysis temperature. Biochar could be used as an adsorbent to adsorb Ag+ from aqueous solution, which is formed the value-added ABiochar composite by reduction. The adsorption and reduction process of Ag+ are investigated. While, ABiochar composite can be used as the catalyst for methylene blue degradation. ABiochar composite can be also used in the lithium ion battery cathode material for energy storage.
Keywords
Camellia oleifera shell
Biochar Adsorption and reduction
Energy storage
Economic analysis

1 Introduction
Biomass is one of the important renewable resources and contains a large quantity of energy (Cheng et al., 2021a; Liao et al., 2018). Moreover, biomass resource has several advantages such as carbon neutrality, abundance and little cost compared to traditional fuel (Liao et al., 2020). Besides, biomass can be converted into the fuels and valuable chemical (Cherubini and Ulgiati, 2010). Many researchers have explored how to convert biomass into energy and valuable product (Ding et al., 2017; Mckendry, 2002). The conversion method of biomass includes direct and indirect method. Biomass can be directly burned into energy for industry application using direct method (Kim et al., 2017; Matsagar et al 2021). But, the ratio of energy utilization is too low. Besides, it generates harmful gas such as CO2 and SO2 (Li et al., 2019). Biomass could be converted into fuel and chemical product such as bioethanol, liquid, gas and char by indirect method (Yang et al., 2021). The indirect method consists of biochemical and thermochemical processes (Robinson et al., 2015). Pyrolysis is a promising indirect method, which can convert biomass into three kinds of products (Cheng et al., 2022a).
Generally, electric furnace is used to provide the heat for pyrolysis, which is one of heating methods for conventional heating (Yan et al., 2016). However, it has the disadvantages of heat loss and heating rate slowly (Cao et al., 2020; Tang et al., 2020). Besides, the temperature of material center is lower than the external surface of material, which restrains the volatilization of pyrolysis vapor and promotes the secondary reactions of pyrolysis products (Chen et al., 2016). Therefore, microwave heating is employed to overcome the disadvantages of conventional heating. Microwave heating has the advantages of selective heating, fast cooling rates, non-contact material heating and energy saving (Cheng et al., 2022b). Therefore, microwave heating can promote the production of bio-gas and prevent these secondary reactions such as retrogressive and condensation reactions, which usually form the stable bio-char or bio-oil. The temperature of material center is higher than the external surface of material in microwave field, unlike conventional heating which promotes the volatilization of pyrolysis vapor and reduces the risk of secondary reactions (Zhang et al., 2017).
Prashanth et al. (2020) investigated the microwave heating and conventional heating in the pyrolysis of empty oil palm fruit bunch. The result indicates that bio-oil has as high as 74 % phenolic compounds using microwave heating. Parvez et al. (2019) studied the influence of microwave heating and conventional heating on the pyrolysis of gumwood, which indicates that H2 produced from microwave heating is 15 % larger than that of conventional heating. Besides, the energy of pyrolysis product in microwave heating process is 13.5 % larger than that of conventional heating. Shi et al, (2013) also analyzed the bio-char produced from gumwood using microwave heating and conventional heating. The result shows that the surface of biochar produced from microwave heating has nano-scale fibers, while biochar produced from conventional heating doesn’t find the nano-scale fibers. Besides, when the biomass has high content moisture, utilization microwave heating can obtain tremendous benefit. Therefore, microwave heating is the promising heating method in many instances for efficiently pyrolysis various biomass with good results (Reddy et al., 2019; Yerrayya et al., 2018).
Biomass pyrolysis can obtain three kinds of pyrolysis products such as bio-oil, bio-gas and biochar, which can be used in many areas. The condensable part of pyrolysis gas produced from biomass pyrolysis is named as bio-oil, which is a dark brown, free flowing organic liquid mixture (Domínguez et al., 2007). The bio-oil comprises of hundreds of organic compounds, such as alcohols, ketones, aldehydes, phenols, furans, nitrogen compounds and miscellaneous oxygenates. Bio-oils are extensively tested as candidate combustion fuels for electricity and heat production in boilers, furnaces, and combustors, diesel engines, and gas turbine (Kan et al. 2016). The primary components of bio-gas are H2, CH4, CO, and CO2. The typical heat values of bio-gas range between 10 and 20 MJ/N m3, which is depended on their practical composition (Huang et al. 2016). Bio-gas has a variety of potential applications such as direct use for production of heat or electricity, and production of individual gas components. Biochar is a stable char with large carbon content and well-developed porous structure, which could be used in soil application/remediation for improved water/nutrient retention (Bogusz et al. 2015). Besides, biochar could be used as adsorbent for removal of heavy metals, anions and organic contaminants including emerging contaminants from aqueous solution. Therefore, pyrolysis products produced from biomass pyrolysis have commercial value and actual application potential.
Tea oil camellia is an oil plant of the genus Camellia of the family, which is considered one of the world’s four major woody oilseed species. The annual production of tea oil camellia seeds in China reached 3.14 million tons (Chen et al., 2022). Camellia oleifera shell (COS), as a by-product of processing tea oil from camellia oleifera fruit, generally accounts for 50–60 % of the whole fresh tea fruit. In 2020, China produced approximately 3.68 million tons of COS (Tan et al., 2020). In general, most of COS as waste is burnt for quick disposal, which is not only a waste of valuable resources, but also emits a lot of pollutants, resulting in a huge threat to the environment. In this work, COS is used as the feedstock to produce valuable products by pyrolysis using microwave heating. The effect of pyrolysis temperature on the physicochemical property of COS pyrolysis products and then evaluation their potential use is little investigated using microwave heating. Besides, the biochar obtained from COS pyrolysis can be used an adsorbent to absorb Ag + and then form value-added Ag-Biochar (ABiochar) composite by reduction. The formed ABiochar composite can be used as the catalyst for methylene blue degradation. The application of ABiochar composite in energy storage is also investigated. The main work of this study is: (1) to investigate the influence of pyrolysis temperature on the yield of pyrolysis products; (2) to analyze the physicochemical property of pyrolysis products under different pyrolysis temperatures; (3) to analyze the generation process of value-added ABiochar composite; (4) to investigate the application of value-added ABiochar composite; (5) to investigate the profit of pyrolysis process.
2 Experimental and materials
2.1 Materials
COS is obtained from the Jiangsu province, China. Silver nitrate is purchased from the Sinopharm Chemical Reagent Co. ltd., China. Methylene blue is purchased from the Tianjin Kemiou Chemical Reagent Co., ltd., China. The collected COS is grinded and dried in electrical oven. The proximate analysis of COS is moisture of 11.67 wt%, ash of 3.06 wt%, volatile matter of 71.84 wt%, fixed carbon of 13.45 wt% and heating value of 20.52 MJ/kg. The elemental analysis of COS is presented as follows: C of 41.92 %, H of 5.58 %, N of 0.40 % and O of 52.10 %.
2.2 Pyrolysis process of COS
The pyrolysis experiment uses a multimode microwave furnace with the microwave power of 0–3 kW. The pyrolysis temperature and pyrolysis time of pyrolysis experiment are 400-800 °C and 30 min, respectively. K-type thermocouple is used to detect pyrolysis temperature in the microwave furnace. The nitrogen is injected into the pyrolysis system to ensure the oxygen-free environment before starting experiment. COS is put in microwave furnace for pyrolysis under nitrogen atmosphere. The pyrolysis gas is taken out from pyrolysis system, which is condensed by condenser pipe to obtain the bio-oil. All the joints of the tubes and vessels of the collected system are sealed using Vaseline to ensure the airtightness. Three glass condensers cooled with the circulation of water and ethylene glycol mixture use the low temperature circulator at approximately −5 °C. The three-necked flask is used to collect the condensates and the gaseous products are collected using gas collection bag. The condensate in the condenser pipe is bio-oil. Pyrolysis gas that is not condensed is bio-gas. Gas collection bag is used to collect bio-gas for further analysis and detection. The residue in microwave furnace is biochar. Pyrolysis experiments are non-consecutively repeated three times. Fig.S1 presents the schematic diagram of pyrolysis system.
The yields of products are calculated by directly and indirectly weighing of the each fraction. The yields of pyrolysis products are calculated using the following equations.
Where MBiochar is the mass of biochar (g), MBio-oil is the mass of bio-oil (g), and M0 is the initial mass of raw material.
2.3 Characterization
Gas chromatography/mass spectrometry (GC–MS, ISQ) is used to detect the chemical composition of bio-oil (Chi et al., 2022). The gas chromatography is used to analyze the bio-gas using the TG-BOND Q packed column (GC-Trace1310). Vario EL III elemental analyzer is used to analyze the element content of COS. The volatile matter, moisture, ash and fixed carbon are measured using the Perkin Elmer TGA 4000 (Zheng et al., 2014). The pore structure of sample is measured by the autosorb instrument (Cheng et al. 2022c). Scanning electronmicroscopy (SEM, Philips XL30ESEM-TMP) is used to analyze the surface microstructures. Ramascope System 1000 (Renishaw, UK) spectroscopy is used to analyze biochar (Li et al. 2022b). X-ray diffraction (XRD) analysis is used to analyze biochar (Li et al., 2022a). X-ray photoelectron spectroscopy (XPS) is used to detect the surface chemical properties of biochar (Cheng et al., 2021b). Fourier transform infrared spectroscopy (FTIR) is used to analyze the chemical property of biochar (Zeng et al. 2022).
3 Results and discussions
3.1 Heating curves of COS
Fig. 1a presents the heating curves of COS under different microwave power. The heating trend of COS under different microwave power is similar. However, the heating rate is obviously different. The heating rate of small microwave power is slower than that of large microwave power. The reason is that COS need more time to absorb microwave energy to reach the specified temperature. As Fig. 1a shown, COS takes 20 min to reach 800 °C when the microwave power is 1000 W. When the microwave power is 2000 W, the heating time is reduced to 6 min to reach 800 °C. This result indicates that large microwave power can significantly reduce the heating time. The heating process of COS is taken as an example to analyze at microwave power of 1500 W. The heating rate of COS is relatively slow before 200 °C. It can be explained that the organic volatile in COS has relatively low dielectric properties. Besides, the absorbed microwave energy is mainly used to remove moisture and preheat the COS. The hemicellulose and cellulose in the COS begin to slowly decompose into bio-oil, bio-gas and preliminary biochar skeleton with the increase of heating time. However, the hemicellulose and cellulose in COS rapidly volatilize, and lignin begins to decompose after 400 °C due to the formation of biochar. The reason is that biochar has good dielectric properties and can rapidly absorb microwave energy. COS has large heating rate with the microwave power of 1500 W. Therefore, 1500 W is selected for subsequent microwave pyrolysis experiment.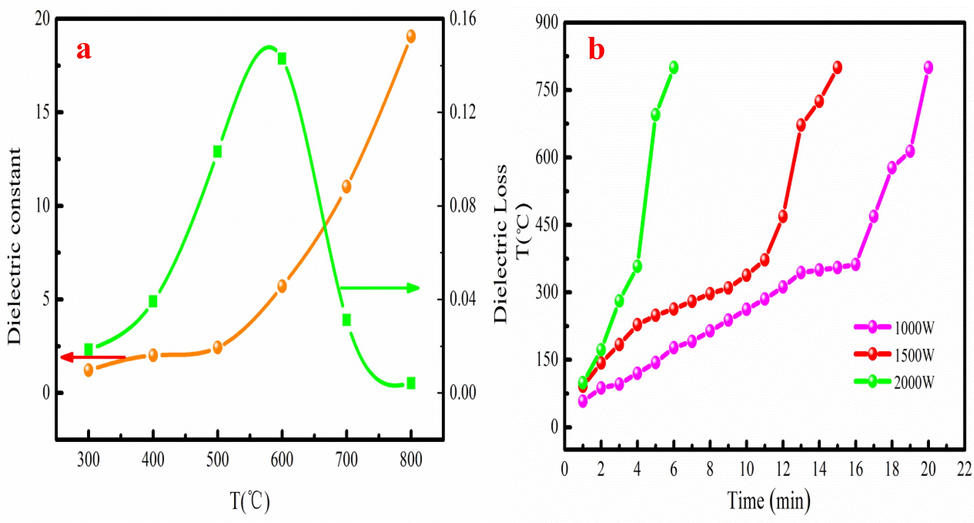
The dielectric property (a) and heating curves (b) of COS.
The dielectric property of COS is shown in Fig. 1b. As Fig. 1b shown, the dielectric property of COS greatly depends on the temperature during pyrolysis process. The dielectric constant slowly increases at 400-800 °C. The behavior of dielectric loss generally increases before 600 °C and then decreases as temperature increases. The dielectric loss has obvious “dielectric loss peak” after 600 °C, which indicates a change in material associated with the loss of an insulating barrier. This phenomenon demonstrates that the main phase transformation occurs. The dielectric property of COS is consistent with the heating curves analysis.
3.2 Distribution of pyrolysis products
Pyrolysis temperature has significantly influenced the pyrolysis product distribution (Xie et al., 2014). High temperature promotes the release of volatiles from the feedstock in the microwave pyrolysis process. Moreover, high heating rates yield higher gas fraction yields. This may be the case of microwave pyrolysis, since the heating rate during microwave heating is known to be high enough to favor gas production. Fig. 2 shows that the yield of bio-oil is general increase at 400 −600 °C. The reason is that the COS undergoes the process of devolatilization, depolymerisation and decarboxylation (Wang et al., 2016). The more detailed reasons are summarized as: more microwave energy is offered for chemical reaction, and more microwave energy is available to break the strong organic bonds to generate volatile component forming bio-oil as pyrolysis temperature increases (Wang et al., 2016). The maximum yield of bio-oil is 21.67 %, which is achieved at 600 °C. When pyrolysis temperature increases from 600 °C to 800 °C, bio-oil yield decreases from 21.67 % to 17.06 %. The reason may be that high pyrolysis temperature will contribute to forming gaseous product rather than bio-oil (Salema and Ani, 2012; Zhang et al., 2010). The yield of bio-gas generally increases at 400-800 °C. The maximum yield of bio-gas achieves at temperature of 800 °C with the yield of 57.53 %. The dielectric loss factor of COS determines the efficiency of heat energy converted from microwave energy. And the efficiency of transforming microwave energy into internal energy is improved. Therefore, the material has better microwave absorption performance. The adsorption microwave energy is used to pyrolyze of the COS to obtain pyrolysis products. Besides, high pyrolysis temperature contributes to volatile component forming bio-gas (Cheng et al. 2022d). This result also implies that microwave-induced pyrolysis would be a highly appropriate way to produce bio-gas from organic waste. The yield of biochar generally decreases at 400-800 °C. The minimum yield of biochar is 25.40 % at temperature of 800 °C due to fact that high pyrolysis temperature promotes to convert portion of biochar into bio-gas. Bio-oil has the largest yield at temperature of 600 °C. So, the optimal pyrolysis temperature is chosen as 600 °C. Table S1 presents the pyrolysis products produced from different kinds of biomass via microwave heating. The yields of pyrolysis products produced from different biomass are quite different (Table S1). As Table S1 shown, the bio-gas yield of COS is larger than other biomass, excluding pine dust. However, the bio-oil yield of COS is lower compared to other biomass, excluding peanut shell.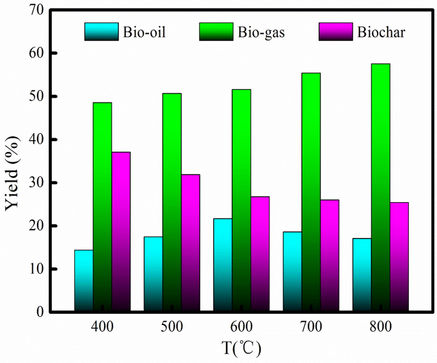
Yield of pyrolysis product at different pyrolysis temperatures.
3.3 Bio-oil analysis
GC–MS has become a quick, efficient, convenient and powerful tool for characterizing complex and heterogeneous bio-oil samples, which is used to detect the composition of bio-oil (Yang et al. 2022). Table S2 lists the composition of bio-oil. The composition of bio-oil is very complex, which has as high as 26 kinds of compounds. Bio-oil can be classified into hydrocarbons, ketones, aldehydes, phenols and furans for analysis based on their different characteristic functional groups. Compounds such as phenols, aldehydes and ketones in bio-oil are mainly decomposed by lignin and cellulose Fig. 3 presents the main composition of bio-oil. As Fig. 3 shown, the content of the main components varies with the increase of pyrolysis temperature. It indicates that the composition of bio-oil is influenced by pyrolysis temperature. Fig. 3 also indicates that the phenolic compound content of bio-oil is larger than that of other compounds. It can be explained that secondary transformations contribute to the generation of phenolic compound. Besides, interaction of moisture/steam with aromatics formed also generates phenolic compound during pyrolysis process (Mukarakate et al., 2015). Phenolic compound can be used to generate valuable products such as chemical and pharmaceutical. Therefore, bio-oil has high commercial value due to large content of phenolic compound. Besides, bio-oil contains high amounts of oxygenated compounds, such as aldehydes and ketones, and these components cause unstable and poor fuel properties of bio-oil. The high amount of oxygenated compounds (phenols, ketones and aldehydes) indicate bio-oil required further upgrading process to remove these unwanted compounds and make it suitable to use as transport fuel.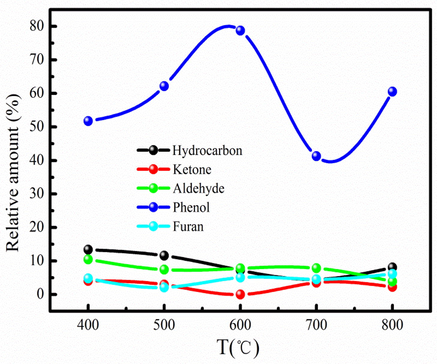
The main component of bio-oil at different pyrolysis temperatures.
3.4 Bio-gas analysis
The generation process of bio-gas is also complex during pyrolysis process. The chemical reactions such as depolymerization, fragmentation and secondary reactions are main routes to produce bio-gas. The generation process of bio-gas is that depolymerization of holocellulose produces high oligomers, levoglucosan, and subsequently generate light volatiles (Kabir et al., 2018). CO and CH4 are generated from the cracking of methoxy of lignin. The decomposition of hemicellulose produces carboxyl component, and then forms CO2. The dehydrogenation of radicals and rearranging, and condensation of aromatic rings generate H2 (KristinaMaliutina et al., 2017). Fig. 4 presents the GC analysis result and heating value of bio-gas. As Fig. 4a shown, the main component of bio-gas is CO2 at 400-500 °C, which accounts for 44.70 % of bio-gas. CO2 is generated by decarboxylation, cracking and reforming of carbonyl and carboxy groups in carbohydrates and proteins of hemicellulose at low pyrolysis temperature (Li et al., 2008). The variation tendency of H2 is opposite to CO2 in the range of 400-800 °C. H2 content is low at 400 °C and quickly released after 500 °C. Yang et al. (2006) reported that H2 is produced from the condensation of heavy aromatic compounds and thermal cracking of hydrocarbons. The dehydrogenation and secondary pyrolysis of carbohydrates and proteins also promote H2 generation at high pyrolysis temperature (Yuan et al., 2015). Besides, the demethoxidation or volatilization of lignin in solid residue also promotes H2 generation. CH4 content is increase at 400-500 °C and then decreases at 600-800 °C. The maximum CH4 content is about 15.59 %, which is achieved at 500 °C. The CO content is decrease at 400-500 °C and then increase after 500 °C. It can be explained that cellulose and hemicellulose easily be converted into CO owe to poor thermal stability by the decarboxylation. Besides, the decarbonylation of lignin may generate CO during aromatic condensation. Therefore, the maximum content of CO is 37.73 % at temperature of 800 °C. This analysis result indicates that pyrolysis temperature has great influenced the component of bio-gas.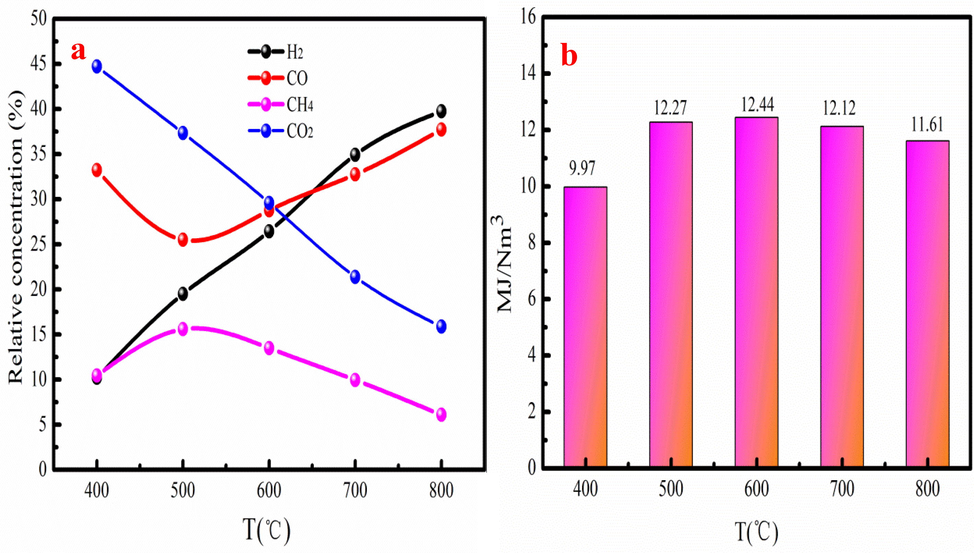
The component (a) and heating value (b) of bio-gas at different pyrolysis temperatures.
The variation trend of bio-gas composition can be explained by the primary pyrolysis process and secondary pyrolysis of pyrolysis productions. The production process of bio-gas can be explained by secondary pyrolysis and transformation of bio-oil and bio-gas (Dai et al., 2000; Li et al., 2007). This process stage occurs at high pyrolysis temperature. The main chemical reactions of secondary pyrolysis and conversion of bio-oil include decarboxylation, cyclization, aromatization and polymerization (Hong et al., 2017). Besides, bio-gas will undergo the secondary cracking and transformation to produce large quantities of non-condensable gaseous at high pyrolysis temperature (Foong et al., 2020; Zhang et al., 2018a).
Fig. 4b shows the heating value of bio-gas produced at different pyrolysis temperature. As Fig. 5b shown, the heating value of bio-gas generally increases at 400-600 °C. The maximum heating value of bio-gas is 12.44 MJ/Nm3, which is achieved at 600 °C. While the heating value of bio-gas has little changed at 700-800 °C. The bio-gas with large can be used in industry production.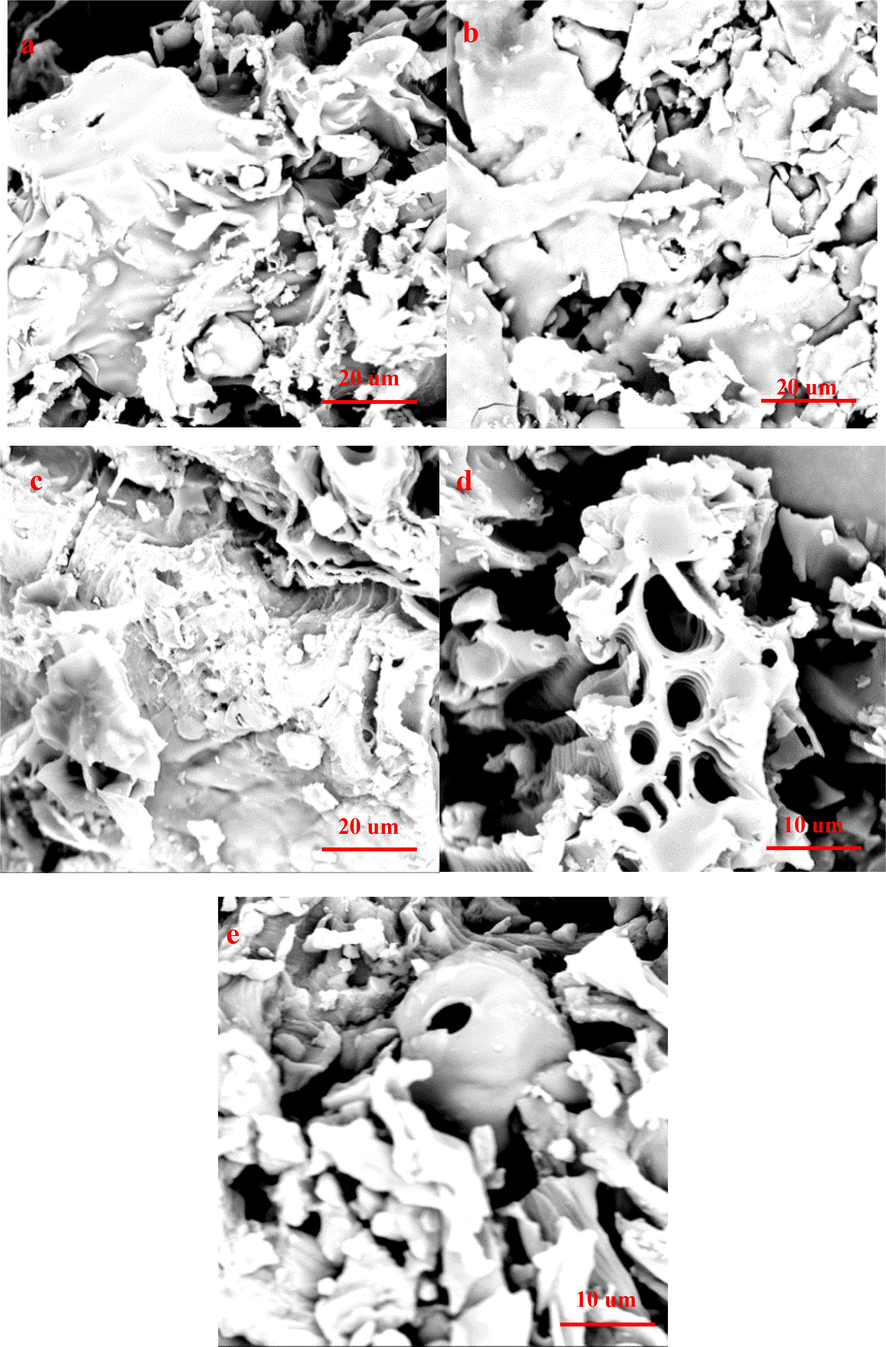
SEM of biochar produced at 400-800 °C(a: COS-400 °C, b:COS-500 °C, c:COS-600 °C, d:COS-700 °C and e:COS-800 °C).
3.5 Biochar analysis
3.5.1 Basic property of biochars
The elemental analysis of biochar produced at 400-800 °C is summarized in Table 1. As Table 1 shown, pyrolysis temperature significantly influences the element content of biochar. The C content of biochar is increase with increasing in pyrolysis temperature increases. Sun et al. (2014) pointed out that pyrolysis could assemble the C element in biomass, which is in good agreement with our work. The H and O content of biochar are decrease with increasing in pyrolysis temperature. The reason is that weaker oxygen bonds in biomass are broken at high pyrolysis temperature. N content of biochar is ranging from 0.72 % to 1.33 %, indicating that pyrolysis temperature has little influenced on N content. N in biochar is in the form of pyridine and pyrrole. The H/C, O/C and (O + N)/C atomic ratios of biochar decrease as pyrolysis temperature increases, which indicates that high pyrolysis temperature produces the high aromaticity, poor hydrophilicity and polarit of biochar (Ahmad et al.2012).
Sample
C /%
H/%
N /%
O /%
H/C
O/C
(O + N)/C
COS
41.92
5.58
0.40
52.10
0.133
1.243
1.252
COS-400 °C
71.24
5.08
0.95
22.73
0.071
0.319
0.332
COS-500 °C
74.68
4.82
0.75
19.75
0.065
0.264
0.274
COS-600 °C
75.52
4.21
1.04
19.23
0.056
0.255
0.268
COS-700 °C
77.33
3.16
1.33
18.18
0.041
0.235
0.252
COS-800 °C
81.07
2.83
0.90
15.20
0.035
0.187
0.198
Brunauer-Emmett-Teller (BET) surface area of biochar is 80.63 m2/g of 400 °C, 172.05 m2/g of 500 °C, 224.82 m2/g of 600 °C, 255.31 m2/g of 700 °C and 204.46 m2/g of 800 °C, respectively. This result indicates that BET surface area of bio-char increases at 400-700 °C. The reason is that a large number of pores are produced at high pyrolysis temperature. However, BET surface area decreases at 800 °C. It can be explained that the generated pores are ruined at 800 °C, resulted in the decrease of BET surface area. The analysis results indicate that pyrolysis temperature influences BET surface area of biochar. Biochar can be used in wastewater treatment with large BET surface area.
SEM images of biochar produced at 400-800 °C are shown in Fig. 5. As Fig. 5 shown, the SEM of biochar produced at low pyrolysis temperature has underdeveloped pores. However, the pore blockage appears on biohcar with increasing in pyrolysis temperature. The pore blockage is removed and the number of pores is generally appeared on biochar as pyrolysis temperature continues to rise. However, high pyrolysis temperature can cause the fuse, closed or even collapsed of pore, resulted in the disappearance of formed holes on biochar. This analysis result is consistent with surface area analysis.
Fig. 6 shows Raman spectrum of biochar produced at 400-800 °C. The biochar have two main peaks at about 1350 and 1600 cm−1 at 400-800 °C, which are corresponded to D and G peak, respectively. D and G peak represent the defection of crystalline structure and graphitic structure of carbon material, respectively. ID/IG ratio is used to investigate the graphitization degree of biochar. As Fig. 6 shown, ID/IG ratio is increase at 400-800 °C. This result indicates that aromatic ring structure and graphite-like structure of biochar increase, and the ratio of disordered/ordered graphene structure also increases. Biochar has high amorphous degree and defects at high pyrolysis temperature.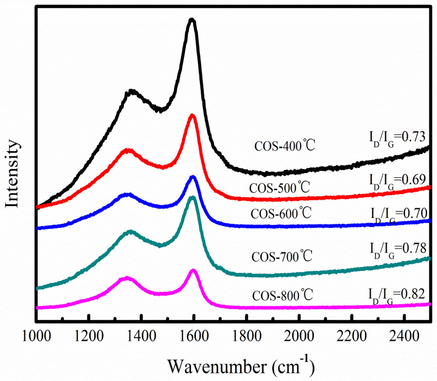
Raman analysis of biochar produced at different pyrolysis temperatures.
3.5.2 Application of biochar
3.5.2.1 Adsorption Ag+ from wastewater
Biochar produced at 700 °C is employed to absorb Ag+ wastewater to evaluate its adsorption performance owe to large BET surface area. Zhou et al. (2014) pointed out that Ag+ is harmful substances in wastewater, which comes from dentistry, clothing, the food industry, and jewelry manufacturing. Simple adsorption experiment is uded to investigate the adsorption capacity of biochar. 0.05 g biochar is mixed with 50 mL Ag+ solution (250 mg/L), which is stirred with 300r/min in the thermostatic oscillator at 25 °C. The atomic absorption spectrum is employed to detect the residue Ag+ in the solution until adsorption equilibrium. The detection result indicates that the Ag+ adsorption capacity of biochar is 54.27 mg/g. This result indicates that biochar could be used as the adsorbent for Ag+ removal from wastewater.
3.5.2.2 Reduction of adsorbed Ag+ on biochar
Fig. 7 shows the SEM-EDS images of biochar after adsorption Ag+. As Fig. 7a-c shown, many white particles matter appear on biochar. As Fig. 7d-e shown, the white granular is element of silver. Fig. 7f shows that the particle matter on biochar is analyzed by XRD. Biochar is existence of Silver crystals after adsorption Ag+ ions compared to original biochar based on XRD analysis. The presence of metallic silver on biochar proves that Ag+ is absorbed and subsequently forms metallic silver on biochar. The value-added ABiochar composite is formed on biochar combined with XRD and SEM-EDS analyses.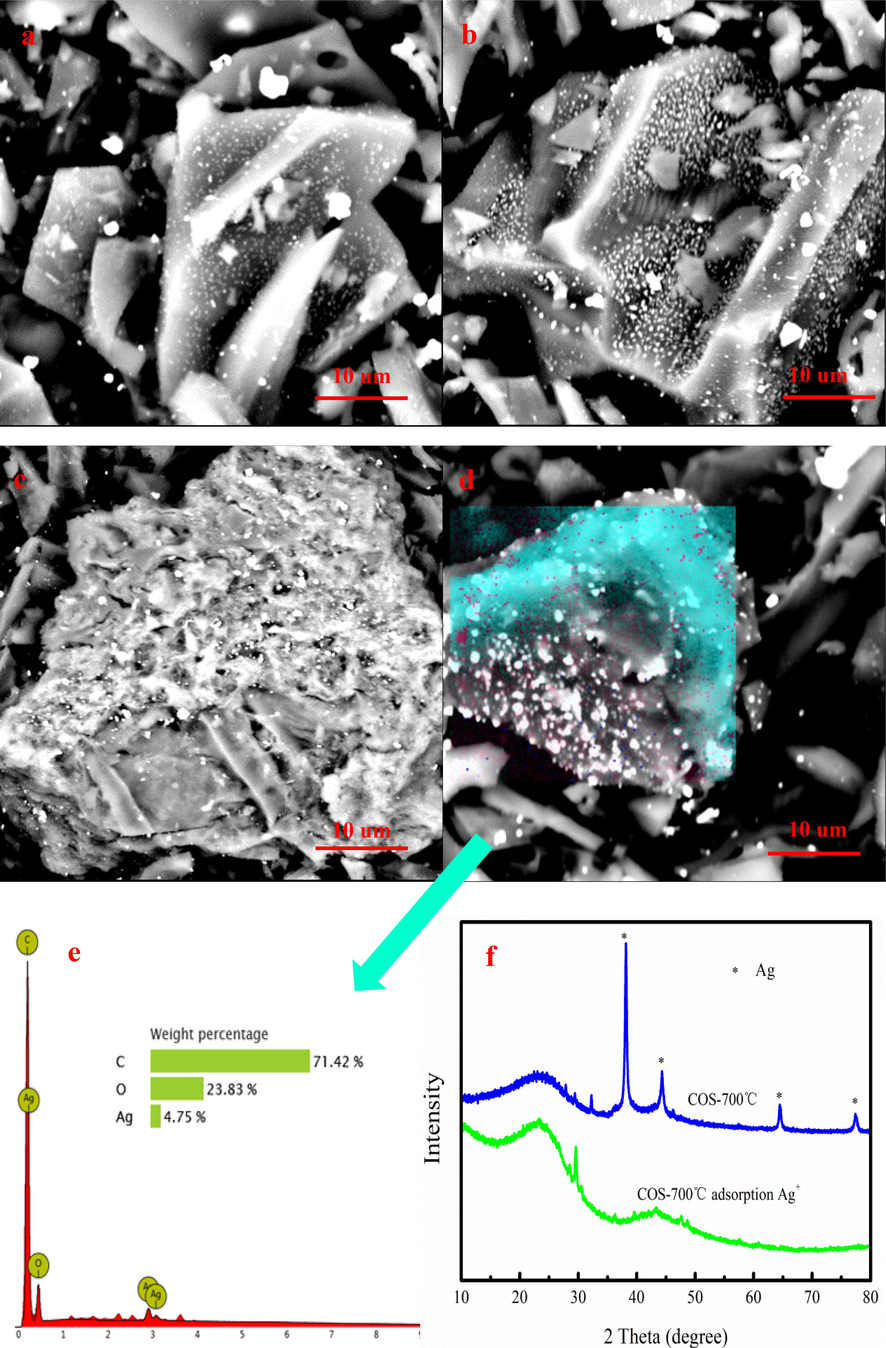
SEM-EDS images of biochar after adsorption of Ag+ (a-e), XRD spectra of biochar before and after Ag+ adsorption (f).
Klüpfel et al. (2014) pointed out that hundreds micromoles of electrons are released by 1 g biochar. Fig. 8a shows the XPS spectra of biochar before and after Ag+ adsorption. As Fig. 8a shown, the Ag element is existence of biochar. Fig. 8b shows that the spectrum of Ag spectra has Ag3d3/2 and Ag3d5/2. This result indicates that silver in the biochar has two different states. One is in the form of metallic silver (Ag3d5/2) and another one is Ag+ (Ag3d3/2). However, the Ag3d5/2 peak is larger compared to Ag3d3/2, indicating that a large number of Ag+ is reduced to form metallic silver on biochar. Fig. 8c-d show that C1s spectra of biochar has three kinds of chemical functional groups, which are C—C, C—O and C⚌O groups. However, the binding energies and peak areas of three groups have changed after g+ adsorption. The peak area of C—O decreases by 3.25 %, while the peak area of C⚌O decreases by 2.88 % after Ag+ adsorption. The hydroxyl and carboxylic groups in biochar participate in Ag+ adsorption and reduction Ag+ into the value-added ABiochar based on XPS analysis result.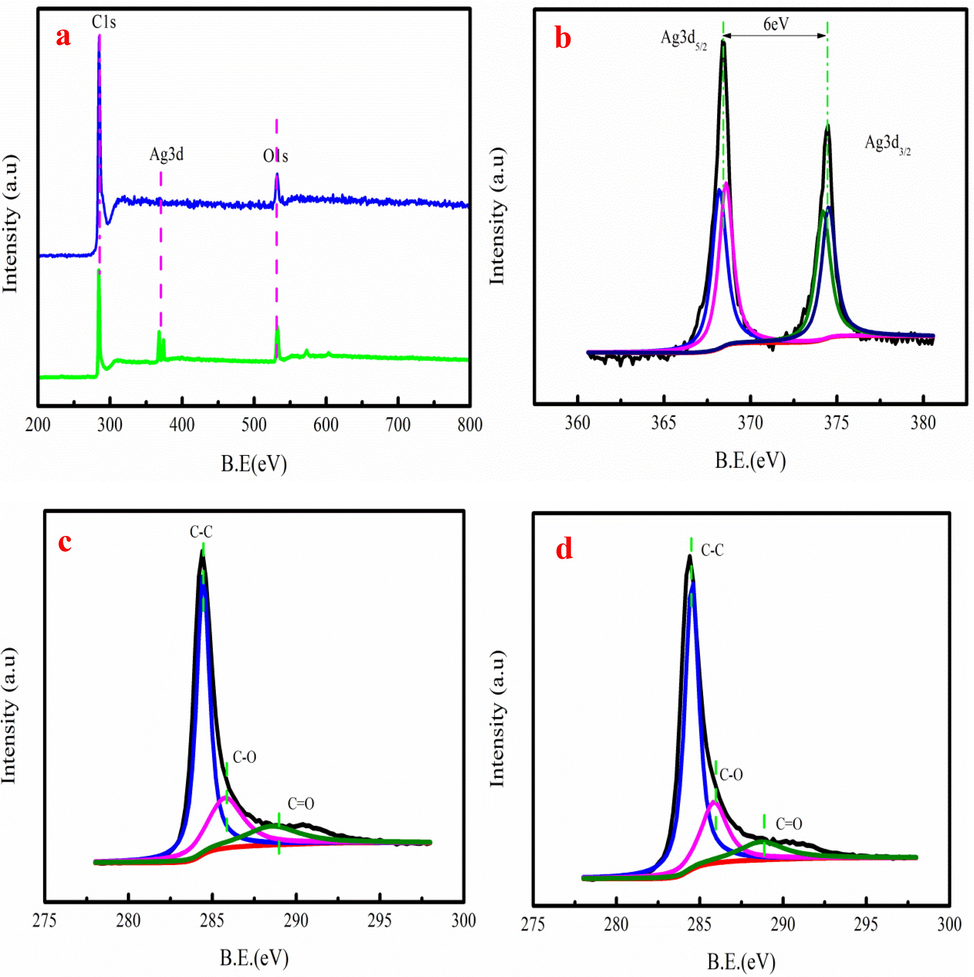
The wide scan XPS spectrum biochar before and after (a), Ag 3d spectra of (b), C1s spectra of (c-d).
Fig. 9 shows the FTIR spectra analysis of biochar before and after adsorption Ag+. As Fig. 9 shown, the peak intensity and peak location of the –OH and –COOH groups are also changed after Ag+ adsorption. Therefore, the reduction process may be that Ag+ is reduced by the carboxyl/hydroxyl groups to reach metastable Ag clusters on biochar due to lower surface energy. The formed Ag clusters are thermodynamically far more favored than smaller entities. These metastable silver clusters agglomerate during the growth period and produce ABiochar composite. The above analysis results provide direct evidences for the redox adsorption of Ag+ ions to Ag nanoparticles on biochar due to the abundant COOH and –OH groups. The adsorption and reduction process of Ag+ are also shown in Fig. 10. The application of ABiochar is in the following section.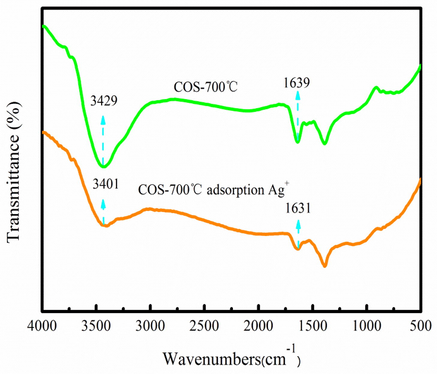
FTIR spectra of biochar before and after (e) adsorption.
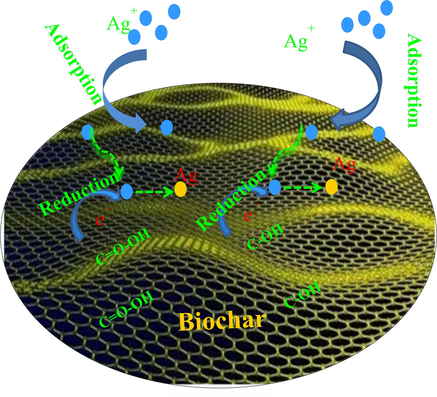
The adsorption and reduction process of Ag+.
3.5.3 Degradation methylene blue using ABiochar
Liu et al. (2013) reported that the ABiochar composite has catalytic performance. Methylene blue is used to evaluate the catalytic performance of ABiochar composite in the existence of NaBH. The simple experiment is used to analyze the catalytic performance of ABiochar composite. 0.02 g ABiochar composite is mixed with 50 mL methylene blue solution with the concentration of 20–40 mg/L. The catalytic removal (η) of the methylene blue using ABiochar composite is shown in Fig. 11a-b. As Fig. 11a shown, the η of methylene blue generally increases with increasing in catalytic time. The maximum η of methylene blue is 92.32 %, which is achieved at 20 mg/L. The biochar also has the certain of methylene blue removal due to its adsorption performance. However, the η of biochar is lower than that of ABiochar composite. It proves that ABiochar composite plays an important role in methylene blue removal. As Fig. 11b shown, the main peak intensity of methylene blue is gradual decrease with increasing in catalytic time. The above analysis results prove that ABiochar composite can be used as promising catalyst for methylene blue removal from wastewater owe to large η of methylene blue.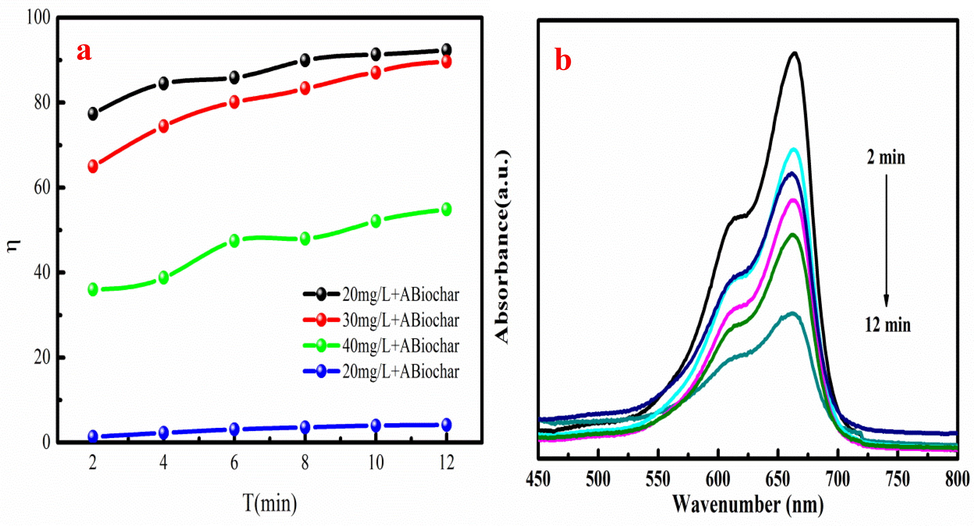
The degradation and methylene blue (a) using ABiochar composite and biochar at different time, UV–visible absorption spectra of methylene blue of ABiochar composite at 20 mg/L (b).
3.5.4 Energy storage potential of ABiochar
Fig. 12 shows the rate performance of ABiochar and original biochar for the lithium ion batteries at different current densities of 50 mA g−1, 100 mA g−1, 200 mA g−1, 500 mA g−1, 1000 mA g−1, 2000 mA g−1 and 50 mA g−1. The efficiency of initial charge and discharge of ABiochar is 49.03 %. Besides, the specific capacities of ABiochar under different current densities are 340 mAh/g, 255 mAh/g, 209 mAh/g, 170 mAh/g, 128 mAh/g, 91 mAh/g and 375 mAh/g, respectively. The result indicates that ABiochar using the lithium ion battery cathode has large the specific capacity 50 mA g−1. The reason is that Ag in the ABiochar composite plays an important role in the energy storage process. Electrochemical performance of various materials applied to lithium ion batteries listed in the Table S3. As Table S3 shown, ABiochar composite can be used as promising lithium ion battery cathode material for energy storage.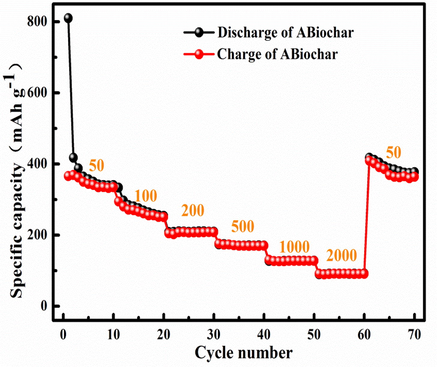
The rate performance of ABiochar and original biochar at 50–2000 mA g−1.
3.6 Economic evaluation of COS pyrolysis process
The profit of COS pyrolysis process is investigated and analysis using the preliminary economic analysis. The production capability of pyrolysis system is assumed to1, 000 ton/year, which can produce the 216.7 ton/year of bio-oil, 515.3 ton/year of bio-gas and 268.0 ton/year of biochar, respectively. In this work, the price of COS is assumed to $ 35 /ton. The operating costs and other costs is summered in Table S3 based on the literature (Perlack and Turhollow, 2003). Bio-oil has large quantities of phenol, which is valuable component with large commercial value. Petrolia et al. (2008) pointed out that the phenol is sold at $5-$5.8/gallon (Petrolia, 2008). However, the bio-oil produced from COS is assumed to $0.5 /gallon due to the bio-oil has other undesirable components such as containing oxygen and sulfur component. The biochar has well-developed pore structure, which could be used as soil remediation or adsorbent for wastewater treatment (Ruan et al., 2008). Therefore, the price of biochar produced from COS is assumed to sell at $ 0.5/kg. As Table S4 shown, the total annual revenue of the COS pyrolysis process is $46,060/year, demonstrating that COS pyrolysis process is profitable for large-scale production. In this work, it should be noticed that the data is obtained from lab-scale experiment, which can support the data for commercial scale process.
4 Conclusion
Effect of pyrolysis temperature on the physicochemical property of pyrolysis products is investigated. High pyrolysis temperature contributes to producing bio-gas and restraining the generation of biochar. The bio-oil mainly has phenols, hydrocarbons, ketones, aldehydes and furans. The composition of bio-gas is significantly influenced by pyrolysis temperature with the maximum heating value of 12.44 MJ/Nm3. Bio-char is acted as the adsorbent for adsorption Ag+ and then forms ABiochar after adsorption. ABiochar can be used as the catalyst for methylene blue degradation. Besides, ABiochar can be used as the lithium ion battery cathode material for energy storage. COS pyrolysis process is profitable based on preliminary economic analysis.
Acknowledgments
The authors would like to express their gratitude to the Specialized Research Fund for the Fundamental Research Funds for the Key Scientific and Technological Project of Henan Province (222102320405), Education Department Science Foundation of Henan Province (22B440002), Universities of Henan Province (NSFRF220417), National Natural Science Foundation of China (51974110, 52074109, 52274261 and 21966019) , Ten Thousand Talents Plan Industrial Technology Talents Project (2019-1096) and the Program for Science &Technology Innovation Talents in Universities of Henan Province (21HASTIT008) for financial support.
Declaration of Competing Interest
The authors declare that they have no known competing financial interests or personal relationships that could have appeared to influence the work reported in this paper.
References
- Effects of pyrolysis temperature on soybean stover-and peanut shell-derived biochar properties and TCE adsorption in water. Bioresour. Technol.. 2012;118:536-544.
- [Google Scholar]
- Application of laboratory prepared and commercially available biochars to adsorption of cadmium, copper and zinc ions from water. Bioresour. Technol.. 2015;196:540-549.
- [Google Scholar]
- Microwave-assisted depolymerization of various types of waste lignin over two-dimensional CuO/BCN catalysts. Green Chem.. 2020;22(3):725-736.
- [Google Scholar]
- Pyrolysis characteristics of tea oil camellia (Camellia oleifera Abel.) shells and their chemically pre-treated residues: kinetics, mechanisms, product evaluation and joint optimization. J. Anal. Appl. Pyrolysis. 2022;164:105526
- [Google Scholar]
- Utilization of municipal solid and liquid wastes for bioenergy and bioproducts production. Bioresour. Technol.. 2016;215:163-172.
- [Google Scholar]
- Lead and cadmium clean removal from wastewater by sustainable biochar derived from poplar saw dust. J. Clean. Prod.. 2021;314:128074
- [Google Scholar]
- Efficient and selective removal of Pb(II) from aqueous solution by modification crofton weed: experiment and density functional theory calculation. J. Clean. Prod.. 2021;280:124407
- [Google Scholar]
- Preparation of magnetic adsorbent-photocatalyst composite for dye removal by synergistic effect of adsorption and photocatalysis. J. Clean. Prod.. 2022;348:131301
- [Google Scholar]
- High-efficiency removal of lead/cadmium from wastewater by MgO modified biochar derived from crofton weed. Bioresour. Technol.. 2022;343:126081
- [Google Scholar]
- Facile one-pot green synthesis of magnetic separation photocatalyst-adsorbent and its application. J. Water Process Eng.. 2022;47:102802
- [Google Scholar]
- Preparation of valuable pyrolysis products from poplar waste under different temperatures by pyrolysis: Evaluation of pyrolysis products. Bioresour. Technol.. 2022;364:128011
- [Google Scholar]
- Crop residues as raw materials for biorefinery systems – a LCA case study. Appl. Energy. 2010;87(1):47-57.
- [Google Scholar]
- Highly efficient one-pot conversion of saccharides to 2,5-dimethylfuran using P-UiO-66 and Ni–Co@NC noble metal-free catalysts. Green Chem.. 2022;24:5070-5076.
- [Google Scholar]
- Comparative pyrolysis behaviors and reaction mechanisms of hardwood and softwood. Energy Convers. Manage.. 2017;132:102-109.
- [Google Scholar]
- Conventional and microwave induced pyrolysis of coffee hulls for the production of a hydrogen rich fuel gas. J. Anal. Appl. Pyrolysis. 2007;79(1–2):128-135.
- [Google Scholar]
- Valorization of biomass waste to engineered activated biochar by microwave pyrolysis: progress, challenges, and future directions. Chem. Eng. J.. 2020;389:124401
- [Google Scholar]
- Microwave-enhanced pyrolysis of macroalgae and microalgae for syngas production. Bioresour. Technol.. 2017;237:47-56.
- [Google Scholar]
- A review on microwave pyrolysis of lignocellulosic biomass. Sustain. Environ. Res.. 2016;26:103-109.
- [Google Scholar]
- Pyrolysis of oil palm mesocarp fiber catalyzed with steel slag-derived zeolite for bio-oil production. Bioresour. Technol.. 2018;249:42-48.
- [Google Scholar]
- Lignocellulosic biomass pyrolysis: a review of product properties and effects of pyrolysis parameters. Renew. Sustain. Energy Rev.. 2016;57:1126-1140.
- [Google Scholar]
- Kim, Jeonghun, Ide, Yusuke, Hossain, Md., S.A., Yamauchi, Dutta, Saikat, Ho, J., 2017. 3D network of cellulose-based energy storage devices and related emerging applications. Materials Horizons 4, 522-545.
- Redox properties of plant biomass-derived black carbon (biochar) Environ. Sci. Technol.. 2014;48(10):5601-5611.
- [Google Scholar]
- KristinaMaliutina, Tahmasebi, A., JianglongYu, Saltykov, S.N., 2017. Comparative study on flash pyrolysis characteristics of microalgal and lignocellulosic biomass in entrained-flow reactor. Energy Conversion & Management 151, 426-438.
- Li, H., Wang, J., Zhu, X., Yang, T., Deng, J., Yan, B., Mao, X., Zhang, Y., Li, S., 2022a. Evaluation of a green-sustainable industrialized cleaner utilization for refractory cyanide tailings containing sulfur. The Science of the total environment 827, 154359-154359.
- Insights into the synergetic effect for co-pyrolysis of oil sands and biomass using microwave irradiation. Fuel. 2019;239:219-229.
- [Google Scholar]
- Dynamic camouflage characteristics of a thermal infrared film inspired by honeycomb structure. Structure. J. Bionic Eng.. 2022;19(2):458-470.
- [Google Scholar]
- Influence of temperature on the formation of oil from pyrolyzing palm oil wastes in a fixed bed reactor. Energy Fuels. 2007;21(4):2398-2407.
- [Google Scholar]
- The investigation of thermal decomposition pathways of phenylalanine and tyrosine by TG–FTIR-ScienceDirect. Thermochim. Acta. 2008;467(1):20-29.
- [Google Scholar]
- Metal-organic frameworks (MOFs) derived effective solid catalysts for the valorization of lignocellulosic biomass. ACS Sustain. Chem. Eng.. 2018;6(11):13628-13643.
- [Google Scholar]
- Engineering a homogeneous alloy-oxide interface derived from metal-organic frameworks for selective oxidation of 5-hydroxymethylfurfural to 2,5-furandicarboxylic acid. Appl. Catal. B. 2020;270:118805
- [Google Scholar]
- Recent progress in the development of biomass-derived nitrogen-doped porous carbon. J. Mater. Chem. A. 2021;9:3703-3728.
- [Google Scholar]
- Energy production from biomass (Part 1): overview of biomass. Bioresour. Technol.. 2002;83(1):37-46.
- [Google Scholar]
- Catalytic fast pyrolysis of biomass: the reactions of water and aromatic intermediates produces phenols. Green Chem.. 2015;17(8):4217-4227.
- [Google Scholar]
- Conventional and microwave-assisted pyrolysis of gumwood: a comparison study using thermodynamic evaluation and hydrogen production. Fuel Process. Technol.. 2019;184:1-11.
- [Google Scholar]
- Feedstock cost analysis of corn stover residues for further processing. Energy. 2003;28(14):1395-1403.
- [Google Scholar]
- The economics of harvesting and transporting corn stover for conversion to fuel ethanol: A case study for Minnesota. Biomass Bioenergy. 2008;32(7):603-612.
- [Google Scholar]
- Analytical and microwave pyrolysis of empty oil palm fruit bunch: kinetics and product characterization. Bioresour. Technol.. 2020;310:123394
- [Google Scholar]
- Reddy, B.R., Shravani, B., Das, B., Dash, P.S., Vinu, R., 2019. Microwave-assisted and analytical pyrolysis of coking and non-coking coals: Comparison of tar and char compositions. Journal of Analytical & Applied Pyrolysis 142(Sep.), 104614.104611-104614.104619.
- Microwave pyrolysis of biomass: control of process parameters for high pyrolysis oil yields and enhanced oil quality. Energy Fuels. 2015;29(3):1701-1709.
- [Google Scholar]
- Size matters: small distributed biomass energy production systems for economic viability. Int. J. Agric. Biol. Eng.. 2008;1(1):64-68.
- [Google Scholar]
- Microwave-assisted pyrolysis of oil palm shell biomass using an overhead stirrer. J. Anal. Appl. Pyrolysis. 2012;96(12):162-172.
- [Google Scholar]
- Effects of feedstock type, production method, and pyrolysis temperature on biochar and hydrochar properties. Chem. Eng. J.. 2014;240(6):574-578.
- [Google Scholar]
- Pelletization of Camellia oleifera Abel. shell after storage: energy consumption and pellet properties. Fuel Process. Technol.. 2020;201:106337
- [Google Scholar]
- Microwave-assisted production of CO2-activated biochar from sugarcane bagasse for electrochemical desalination. J. Hazard. Mater.. 2020;383:121192
- [Google Scholar]
- Hydrocarbon fuel production from soapstock through fast microwave-assisted pyrolysis using microwave absorbent. J. Anal. Appl. Pyrolysis. 2016;119:251-258.
- [Google Scholar]
- Fast microwave-assisted catalytic pyrolysis of sewage sludge for bio-oil production. Bioresour. Technol.. 2014;172:162-168.
- [Google Scholar]
- Characteristics and potential values of bio-oil, syngas and biochar derived from Salsola collina Pall. in a fixed bed slow pyrolysis system. Bioresour. Technol.. 2016;220:378-383.
- [Google Scholar]
- Heterogeneous metal azolate framework-6 (MAF-6) catalysts with high zinc density for enhanced polyethylene terephthalate (PET) conversion. ACS Sustain. Chem. Eng.. 2021;9(19):6541-6550.
- [Google Scholar]
- Thermochemical conversion of plastic waste into fuels, chemicals, and value-added materials: a critical review and outlooks. ChemSusChem. 2022:e202200171.
- [Google Scholar]
- Mechanism of palm oil waste pyrolysis in a packed bed. Energy Fuels. 2006;20(3):1321-1328.
- [Google Scholar]
- Selective production of phenols from lignin via microwave pyrolysis using different carbonaceous susceptors. Bioresour. Technol.. 2018;270:519-528.
- [Google Scholar]
- Comparative study on pyrolysis of lignocellulosic and algal biomass using a thermogravimetric and a fixed-bed reactor. Bioresour. Technol.. 2015;175:333-341.
- [Google Scholar]
- Insight into the microstructural evolution of anthracite during carbonization-graphitization process from the perspective of materialization. Internat. J. Mining Sci. Technol.. 2022;212:13781.
- [Google Scholar]
- Application of biomass pyrolytic polygeneration by a moving bed: characteristics of products and energy efficiency analysis. Bioresour. Technol.. 2018;254:130-138.
- [Google Scholar]
- Effects of feedstock characteristics on microwave-assisted pyrolysis - a review. Bioresour. Technol.. 2017;230:143-151.
- [Google Scholar]
- Catalytic conversion of microwave-assisted pyrolysis vapors. Energy Sources. 2010;32(18):1756-1762.
- [Google Scholar]
- Steam activation of Eupatorium adenophorum for the production of porous carbon and hydrogen rich fuel gas. J. Anal. Appl. Pyrolysis. 2014;110:113-121.
- [Google Scholar]
- Biochar-supported zerovalent iron reclaims silver from aqueous solution to form antimicrobial nanocomposite. Chemosphere. 2014;117(1):801-805.
- [Google Scholar]
Appendix A
Supplementary material
Supplementary data to this article can be found online at https://doi.org/10.1016/j.arabjc.2022.104348.
Appendix A
Supplementary material
The following are the Supplementary data to this article:Supplementary data 1
Supplementary data 1


