

Translate this page into:
Valorisation of coal gasification slag and fly ash to mesoporous activated carbon @zeolite socony mobil-5 composite for preconcentration of pharmaceuticals and their removal
⁎Corresponding author. pnnomngongo@uj.ac.za (Philiswa Nosizo Nomngongo)
-
Received: ,
Accepted: ,
This article was originally published by Elsevier and was migrated to Scientific Scholar after the change of Publisher.
Peer review under responsibility of King Saud University.
Abstract
Upcycling industrial solid waste, such as coal gasification slag and fly ash, to functional adsorbents with unique structures for water decontamination is of great importance to achieving Sustainable Development Goal 6.0. This study used coal gasification slag and fly ash to synthesise mesoporous activated carbon @zeolite socony mobil-5 (MAC@ZSM-5) composite. Various analytical techniques were used to investigate the surface, morphological, and structural properties of the MAC@ZSM-5 composite. The MAC@ZSM-5 composite had a relatively high specific surface and was classified as a mesoporous adsorbent. The MAC@ZSM-5 composite was used as an adsorbent in ultrasound-assisted micro solid phase extraction (UA-µSPE) for effective preconcentration and removal of aspirin (ASP), ibuprofen (IBP), and paracetamol (PCT) from water samples before determination by high-performance liquid chromatography equipped with a photodiode array detector (HPLC-DAD). The Langmuir adsorption isotherm characterised the adsorptive removal method, while the kinetics followed a pseudo-second order type. Thermodynamic studies revealed that the adsorption process was endothermic, spontaneous, and chemisorption. Additionally, the UA-µSPE/HPLC-DAD method displayed a good linear range of 0.1–1000 µg/L, with a coefficient of determination greater than 0.99. The developed method had a good performance, as shown by the relatively low limits detection (LODs: 0.017–0.064 µg/L) and quantification (LOQs: 0.057–0.21 µg/L) as well as high precision (relative standard deviation (%RSD) < 5 %). The proposed method was applied successfully for preconcentration and removal of the target analytes from real water samples. The MAC@ZSM-5 composite was reusable (up to 5 cycles) and proved a promising adsorbent for effective extraction, preconcentration, and adsorptive removal of emerging contaminants from water bodies.
Keywords
Emerging pollutants
Waste-derived nanomaterials
Upcycling
Pharmaceutical decontamination
Sustainable Development Goal 6.0

1 Introduction
Many communities in developing countries face water scarcity challenges due to availability and pollution. On the other hand, water pollution due to various anthropogenic activities decreases the quality of available freshwater, thus impacting potable water supply and demand (Fedorova et al., 2022). Among the water pollutants, pharmaceutical residues from partially treated domestic wastewater effluents and hospital wastewater discharge are of great concern (Khan et al., 2020; Wang et al., 2021; Letsoalo et al., 2023). Amongst these pharmaceutical residues are over-the-counter medicines, such as painkillers (paracetamol) and non-steroidal anti-inflammatory drugs (NSAIDs, such as ibuprofen, ketoprofen, aspirin, and naproxen), which have the highest consumption rate worldwide (Parolini, 2020; Maseda and Ricciotti, 2020; Singgih et al., 2020). The increased consumption rate has resulted in their frequent discharge into the environment. For instance, high concentrations of NSAIDs have been detected in South African waters (Sigonya et al., 2022). The presence of NSAIDs and painkillers in surface water and freshwater sources may lead to human health issues as well as chronic toxicity effects in aquatic species (Parolini, 2020). However, there are limited studies on the occurrence of pharmaceutical residues in in environmental waters from developing countries as compared to developed countries.
Generally, pharmaceutical residues in environmental water systems are found in trace concentrations and associated with complex matrices. Therefore, several sample preparation methods have been reported for extracting, isolating, and preconcentrating pharmaceutical residues from various matrices (Pérez-Lemus et al., 2019; Nouri et al., 2020; Gao et al., 2022; Madariaga-Segovia et al., 2023). Solid phase-based extraction methods are commonly used because of their attractive features (Pérez-Lemus et al., 2019). These include flexibility, rapidity, miniaturisation, and high extraction efficiency. Choosing a suitable adsorbent material in solid phase-based extraction methodologies plays a significant role in obtaining large extraction efficiency and high adsorption capacity (Gao et al., 2022). Recent studies have shown increasing trends in developing advanced adsorbents for extracting and preconcentrating NSAIDs and painkillers from complex matrices Aigbe et al., 2021; Solangi et al., 2021; S and Vishwakarma, 2021; Xie et al., 2023). However, some of the materials reported by the researchers above require expensive precursors during the preparation process, thus hindering their large-scale production.
Hence, industrial and agricultural wastes have been precursors to fabricate porous materials (Bhatt et al., 2019; Yuan et al., 2022). Coal is still the most significant energy source in South Africa, and this condition might continue for several decades in the future. Burning coal in thermal power plants produces large amounts of coal fly ash (CFA) residues (Sun et al., 2022; Ren et al., 2023). CFA contains large amounts of silica, alumina, iron oxide, and calcium oxide; these minerals are suitable precursors for preparing nanometal oxide-based adsorbents and zeolites (Bhatt et al., 2019). Another good precursor for preparing low-cost sorbents is coal gasification slag (CGS), a general solid waste obtained during coal gasification (Yuan et al., 2022b). The gasification process generates fine and coarse slag that contains inorganic minerals and residual carbon (Yuan et al., 2022; Xue et al., 2023). The residual carbon in the CGS has been reported to have high specific surface and micropore areas (Yu et al., 2022). Consequently, CGS has been used as a precursor for preparing mesoporous activated carbon or carbon silica composite (Iovino et al., 2015; Nordin et al., 2023).
This study used CGS and CFA as precursors for the preparation of MAC@ZSM-5 nanocomposite. The MAC from CGS was chosen due to its abundant functional groups, high specific surface area, high affinity to organic pollutants, and good mechanical and thermal stability (Brião et al., 2017;Jawad et al., 2021;Xiong et al., 2022). ZSM-5 was selected due to its remarkable physical and structural properties, such as hydrophobicity, ion exchange capacity, good porosity, high specific surface area, negatively charged lattice and mechanical and chemical stability (Brião et al., 2017). Combining MAC and ZSM-5 to form a nanocomposite offers potentially enhanced performance compared to individual components. Hence, this study prepared MAC@ZSM-5 nanocomposite with enhanced surface area, increased adsorption capabilities and introduction of various functional groups that induce surface hydrophobicity onto the adsorbent surface (Azizi et al., 2022; Kathuria et al., 2023). Even though the removal of NSAIDs and painkillers using low-cost adsorbents has been widely reported, there are still limited reports on the application of MAC @ZSM-5 nanocomposite.
2 Experimental
2.1 Materials and reagents
The coal gasification slag (CGS) used in this study was obtained from commercial gasification conversion of South African Highveld Coal (Mpumalanga Province, South Africa). The coal fly ash (CFA) was obtained from a coal processing power supply (Mpumalanga Province, South Africa). Reagents and solvents were commercially attainable, and they were utilised as received. HPLC-grade acetonitrile, ethanol, and methanol were purchased from Merck (Johannesburg, South Africa). The analytes of interest are aspirin (>99.9 %), paracetamol (>98 %) and ibuprofen (>99 %), sodium carbonate (Na2CO3), tetrapropyl ammonium bromide (TPABr), nitric acid (HNO3), phosphoric acid (H3PO4), sulphuric acid (H2SO4) and hydrochloric acid (HCl) were purchased from Merk (Johannesburg, South Africa).
2.2 Instrumentation
Thermal treatment was performed in a tube furnace (Celsius Scientific cc, Johannesburg, South Africa) under N2/CO2 gases, whereas a muffle furnace (Celsius Scientific, Johannesburg, South Africa) was used for calcination. The auto-clave thermal reactor was used for the preparation of ZSM-5. A flotation tank (Metso, Pretoria, South Africa) was used to recover residual carbon from the gasification slag. The crystallinity of the raw and prepared material was acquired using X-ray diffraction spectroscopy (PANalytical BV, Almelo, Netherlands). The scanning electron microscope (SEM) (TESCAN VEGA 3 XMU, LMH instrument, Brno, Czech Republic) was used to study the morphological properties of the individual components of MAC@ZSM-5. The surface properties of the prepared materials were also analysed using transmission electron microscopy (TEM JOEL JEM-2100, Japan), Brunauer Emmet Teller surface area and porosity analyser (Micrometrics instrument cooperation, Norcross, USA). The functional groups present in the molecular structure of the synthesised materials were measured using a Perkin-Elmer spectrum 100 spectrometer (Perkin-Elmer, CT, USA). An Agilent high-performance liquid chromatography (HPLC) (Agilent Technologies, Waldron Germany) 1200 infinity series, equipped with a diode array detector, was used for all analyses. The separation was carried out using Zorbax Eclipse Plus C18 Column (3.5 µm × 150 mm × 4.6 mm) (Agilent, Newport, CA, USA) operated at an oven temperature of 25 °C. The chromatograms were recorded using a 1.00 mL/min flow rate, a solvent mixture of 60 % mobile phase C (Acetonitrile) and 40 % mobile phase D (1 %Phosphoric acid), an adsorption wavelength of 230 nm using gradient elution. pH adjustment was performed using an OHAUS series pen pH meter (Pine Brook, NJ, USA). The adsorption studies were conducted using a Scientific ultrasonic cleaner (Labotech, Johannesburg, South Africa). Eppendorf 5702 centrifuge (Eppendorf Ag, Hamburg, Germany) separated the sorbent from the sample solution. Elemental analysis was measured by LECO combustion analyser, CS844 series (LECO Africa pty, Johannesburg, South Africa).
2.3 Enrichment of residual carbon from CGS
The residual carbon was extracted from coal gasification slag using a froth flotation physicochemical separation method. Four tests were performed in the flotation tank (Table S1). For each test, methyl isobutyl carbinol (MIBC) was used as a frother and 200 g of coal gasification slag sample was added to a flotation cell. Different dosages of collector and frother were put into the flotation cell and conditioned for 5 min. Test one was carried out using MIBC only to froth and collect, Test 2 and Test 3 were performed using diesel as a collector, and Test 4 used paraffin as a collector. After completing the flotation process, the resulting flotation concentrate slurry (carbon-rich fraction) and tailings (mineral-rich fraction) were collected, filtered, and dried in a vacuum drying oven at 70 °C for 6 h.
2.4 Synthesis of MAC@ZSM-5 composite
2.4.1 Synthesis of mesoporous-activated carbon
Mesoporous activated carbon was prepared from coal gasification slag residual carbon sample using a modified method reported by Shawabkeh et al., (2015). In a typical experimental run, a 10 g residual carbon sample was placed into a 200 mL round bottom flask. A mixture of 3 mL phosphoric acid, 5 mL sulphuric acid and 15 mL nitric acid was added. The solution was permitted to boil at 90 °C for 3 h. After, the reaction was allowed to cool to room temperature. The chemical-treated residual carbon sample was washed with deionised water and hot water multiple times to remove acid from the material's pores. The produced material was dried in an oven at 110 °C and stored in a desiccator for further use. Thermal treatment was performed in a tubular furnace under nitrogen and carbon dioxide gases. In a tube furnace, the chemically activated residual carbon sample was treated with N2 and CO2 at elevated temperatures (300, 600, and 900 °C). A small portion of each chemical-treated CGS (3.0 g) was transferred into a quartz crucible and placed in the middle of a tube furnace, and a mixture of nitrogen and carbon dioxide was permitted to flow at a rate of 1 L/min and a pressure of 2 bars. The temperature of the furnace was increased at a rate of 10 °C /min to the desired value and held for 30 min. Using inert gas nitrogen for thermal treatment helps keep the environment stable and prevents other reactions. The CO2 enhances the material's porosity by creating more micro and mesopores on the surface of the residual carbon.
2.4.2 Preparation of ZSM-5
The synthesis of ZSM-5 was adapted from the method reported by Liu and Lu., (2020) with slight modifications. Firstly, the CFA sample was dried at 110 °C for 12 h. After drying, the coal fly ash was screened, crushed, and pulverised. Then, a small portion of CFA was mixed with sodium carbonate in a ratio (1:1). The mixed material was calcined at 800 °C in a muffle furnace for 2 h. The calcined mixture was allowed to cool, and the material was grounded. About 7 M HCl aqueous solution was added to the fabric according to the solid mass/liquid volume ratio (1 (g): 5 (mL)). The mixed material was heated and allowed to boil for 2 h. After cooling, the material was filtered, washed, and dried for ZSM-5 synthesis. Zeolite was prepared using a tetra propyl ammonium bromide template (TPABr) and CFA as the source of Al and Si. The composition of the material was listed in mass ratio as follows: 1 treated CFA: 0.44 TPABr: 15 H2O. The pH of the material was adjusted to about 10.0 using H2SO4 and 0.1 M of NaOH. The mixture was transferred into an autoclave hydrothermal reactor and reacted at 150 °C for 48 h. After, the material was filtered and washed to about pH 8.0 and dried at 90 °C. The final product was calcined in a muffle furnace at 550 °C for 2 h.
2.4.3 MAC@ ZSM-5 composite
The MAC@ZSM-5 composite was prepared using a hydrothermal method. Briefly, 3 g of MAC and 3 g of ZSM-5 were measured in a (1:1) ratio and put into a beaker containing 50 mL of ultrapure water under constant stirring for 24 h at room temperature. The mixture was transferred into a hydrothermal reactor and reacted at 120 °C for 6 h. After, the mixture was filtered and dried in an oven at 70 °C for 8 h. It was then subjected to a thermal treatment in a tube furnace at 550 °C under N2/CO2 gases for 2 h and cooled in a desiccator for further use.
2.5 Preconcentration method
2.5.1 Ultrasound-assisted solid phase microextraction method
A suitable mass of adsorbent was weighed and transferred into a glass vial with a stopper, followed by adding 5 mL of synthetic sample solution (10 µg/L) from the intermediate solution prepared from the stock solution (1000 mg/L). After that, the sorbent was dispersed using an ultrasonic water bath for the specified time (10–40 min). The sample solution and the adsorbent were separated by centrifugation. The supernatant was discarded, and the sorbent was mixed with an appropriate amount of acetonitrile to elute the analytes of interest. The quantification of the compounds was carried out using HPLC-DAD.
Design of experiments (DOE) was used to optimise the most significant independent parameters. The optimisation of the most influential parameters was achieved by central composite design (CCD) and response surface methodology (RSM). In this optimisation strategy, the independent variables were considered MA, pH, and ET, denoted as a mass of adsorbent, sample pH, and extraction time, respectively. Each variable was investigated at five levels, as presented in Table 1. The design matrix generated using Statistica software resulted in 26 experiments carried out randomly in triplicates to eliminate uncontrollable effects. The means of the respective analytical responses were used.
Factors
−α
Low
Central
High
+α
Mass of sorbent (MA)(mg)
10
30
60
90
120
Sample pH
1.5
4
6.5
9
11.5
Extraction time (min)
0
10
20
30
40
Eluent (µL)
0
300
600
900
1200
2.6 Adsorption studies
Adsorption studies were conducted in batch mode to examine the sorption capacity of the prepared composite. Under optimised conditions, equilibrium isotherms were carried out in triplicates. The stock solutions of IBP, PCT, and ASP (1000 µg/L) were prepared by weighing the appropriate amount of each standard into a 100 mL flask containing acetonitrile and sonicated until complete dissolution. A mixed standard (100 mg/L), prepared from the stock solutions, was to prepare working solutions ranging from 1-30 mg/L. Briefly, 120 mg of the MAC@ZSM-5 sorbent was placed into amber glass bottles, and 200 mL of working solutions adjusted to pH 6.5 using diluted sodium hydroxide and hydrochloric acid (0.01 mol/L) were added to the bottles. The combined solution was sonicated for 40 min using an ultrasonic bath. The supernatant was filtered through 0.22 µm syringe filters followed by HPLC-DAD analysis. After this, the removal efficiency of the sorbent was determined using Equation (1).
C0: initial concentration and Ce: equilibrium concentration
The sorption capacity was calculated using equation (2).
Where qe (mg/g) is the sorption capacity, m (g): mass of the sorbent, and V (L): volume of the working solution.
Under optimum conditions, kinetics were carried out in triplicate at room temperature at a concentration of 30 mg/L for 5–60 min. Thermodynamics was done by varying the system's temperature from 298-313 K using optimised conditions. The pH of the sample solution was adjusted using sodium hydroxide or hydrochloric acid (0.01 mol/L).
2.7 Method validation
The analytical parameters, including repeatability, linearity, reproducibility, enrichment factor, preconcentration factor, accuracy, matrix effect, limit of detection (LOD), and limit of quantification (LOQ), were all assessed to substantiate the performance of the established method. The standards were prepared by diluting the stock solution of each analyte with ultrapure water. Linearity was studied at seven different concentration levels from 0-1000 µg/L. The LODs and LOQs were determined by analysing river water samples free from the target analytes spiked with the lowest concentration of the calibration curve. LODs and LOQs were estimated based on the signal–noise ratio as 3 SD/b and the LOQ using 10 SD/b, where SD was the standard deviation of ten replicate measurements of the blank solution of the calibration curve, and b was the slope of each calibration. Matrix-matched calibration curves were employed to verify linearity. The sample of blank river water was spiked with a solution containing the analytes of interest at concentrations ranging from 1-5 µg/L. The optimised method was subsequently used to prepare the samples. After that, the samples were quantified using HPLC-DAD, and a seven-point calibration was created. The developed technique's reproducibility and repeatability were calculated using 1 and 5 µg/L measurements in river water samples. This was done to assess the matrix's impact on the extraction efficiency of the developed method. The preconcentration factors (PF) were specified as sample volume (Vs) to eluent volume (Ve) ratios:
The enrichment factor was determined by comparing the slopes before (Sbp) and after preconcentration (Sap).
To ensure that the quality assurance/quality control criteria were met, blanks were injected into the HPLC-DAD system before any sample comprising the targeted analytes.
2.8 Analysis of real samples
Wastewater samples (influent and effluent) were collected from Baviaanspoort wastewater treatment plant (Pretoria, South Africa). River water samples were collected from the Pianaars River (Pretoria, South Africa). This river receives water from this treatment plant. Samples were collected in 1000 mL amber glass bottles precleaned with soap ultrapure water and rinsed with real samples. The samples were placed in a cooler box with ice, transported to the laboratory, and kept in a refrigerator at 4 °C. To eliminate particulates and suspended solids, samples were filtered through 0.22 µm PVDF microfiber filters, and their pH was adjusted to 6.5. The developed procedure was used to extract and preconcentrate ASP, IBP, and PCT. Samples were prepared and analysed in triplicates.
3 Results and discussion
3.1 Properties of the raw materials (CGS and CFA)
3.1.1 Composition and proximate analysis of CGS and CFA
Elemental analysis was conducted using a semi-quantitative XRF to assess the elemental composition of CFA and CGS. This was done to evaluate the suitability of these raw materials for preparing the intended adsorbent; the results are shown in Table S2. The CFA contains 59.9 % silica, 32.2 % alumina, 4.45 % iron oxide, and 6.07 % calcium oxide. Coal gasification slag comprises 64 % silica, 29 % alumina, 4.98 % iron oxide, and 6.53 % calcium oxide. The presence of iron oxide and calcium oxide in CFA and CGS competes with alumina during the formation of the ZSM-5 framework. The presence of these impurities restricts the nucleation of ZSM-5 crystal during the synthesis process. Acid treatment was performed to leach out the iron oxide and calcium oxide before the preparation of ZSM-5. The loss on ignition (LOI) was also conducted to determine the amount of organic matter in the CGS and CFA. The results are shown in Table S2.
The proximate and ultimate analysis of the recovery of residual carbon are shown in Table S3. The CGS and CFA samples were dried at 80 °C before the test analysis and were prepared in duplicates. Samples were subjected to ignition at elevated temperatures to ascertain the extent of water loss and decomposition. It is imperative to consider the evaporation of volatile substances, particularly when working with high-temperature procedures such as those executed within a muffle furnace. Proximate analysis determines the amount of fixed carbon in the sample, which includes the three sets of analysis, i.e. the determination of moisture, volatile and ash, which is done by gravimetric analysis. The ultimate analysis was performed using an elemental analyser and calorimetric analysis to determine the elemental composition of the fundamental constituents in their purest form, denoted by carbon (C), hydrogen (H), oxygen (O) and nitrogen (N) in a dry basis.
3.1.2 Effect of collector in flotation
The effect of collectors on coal gasification slag was studied using three collectors: MIBC, diesel, and paraffin. The obtained results are presented in Fig. S1. The results demonstrated that paraffin resulted in the highest extraction efficiencies of the residual carbon with the highest percentage of loss on ignition in the concentrate, low ash content, and reduced LOI in the tailings. Therefore, the residual carbon attained in test 4, where paraffin was used as a collector and MIBC as a frother, was selected to prepare mesoporous activated carbon.
3.2 Characterisation of the material
3.2.1 Fourier -transform infrared spectroscopy (FTIR)
The functional groups present in the raw and fabricated materials were confirmed by FTIR spectroscopy (Fig. 1). The stretching band at 447 cm−1 that appeared in CFA corresponds to C–C-O out-of-plane bending. The vibration bands around 2962 cm−1 and 3692 cm−1 in CFA represent the stretching of the C–H bond and O–H alcohol- free bond. From the FTIR results of the ZSM-5 material presented in Fig. 1. The stretching vibration band around 1086 cm−1 can be assigned to the asymmetric stretching vibration of B-O-Si in the TO4 tetrahedron. The vibrational band at 793 cm−1 corresponds to Si-O-Al symmetric stretching vibration. The sharp band around 550 cm−1 is associated with the ZSM-5 structure, correlating with the bending vibration of the T-O-T bond in the ring of MFI zeolite. Similar bands were observed by (Hamidzadeh et al., 2020). The stretching bands at 456 cm−1, 571 cm−1, and 790 cm−1 in the CGS can be assigned to silicate spheres (Si-O-Si, O-Si-O, and T-O-Si).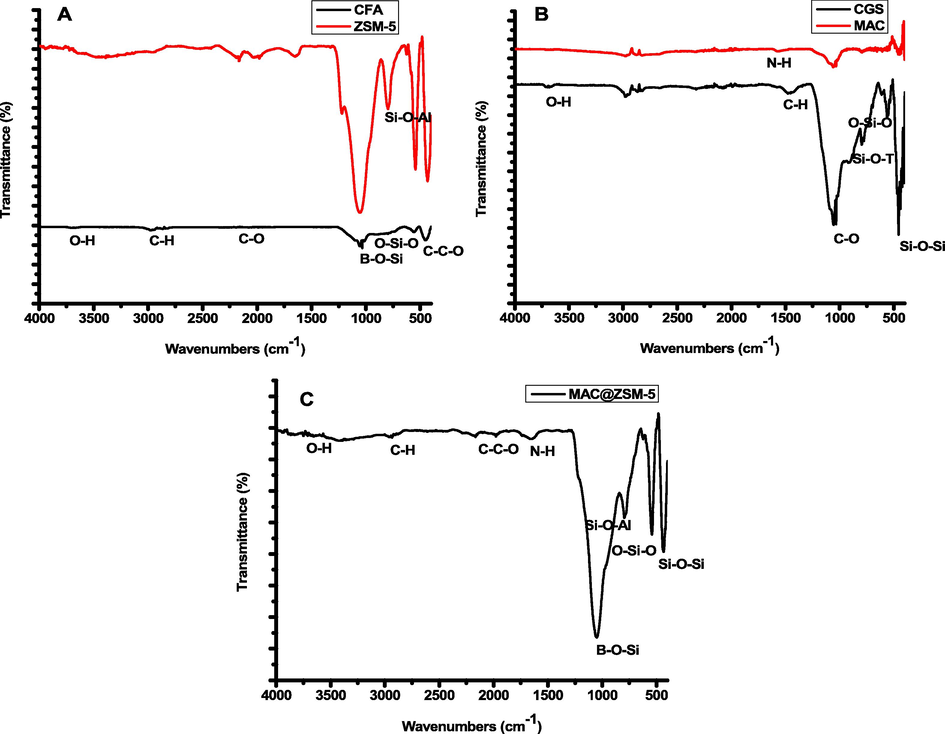
FTIR spectrum of CFA & ZSM-5 (A), CGS & MAC (B) and MAC@ZSM-5 composite (C).
3.2.2 X-ray diffraction (XRD)
The crystalline and amorphous nature of the raw and synthesised materials was identified using XRD diffraction patterns. The XRD patterns of CFA, CGS, AC, ZSM-5 and MAC@ZSM-5 are shown in Fig. 2. The XRD diffraction patterns of the CFA and CGS had similar characteristic peaks at 2θ 19°, 24.5°, 31°, 33°. 55.9°, 66.8°). Low quarts < 15 %, mullites < 25 %, hematite < 0.9 %, only the CGS had cristobalite of 1.1 %. The broad peak patterns of the CFA and CGS indicated the amorphous nature of the raw, which was found to be 60 %. The XRD pattern of MAC (24°, 25.5°, and 43°) displayed the carbon planes indexed to (0 0 2) and (1 0 0) of the prepared material. The characteristic peaks were similar to those reported by(Chen et al., 2018). Diffraction patterns of the MFI structure can represent the prominent diffraction peaks of ZSM-5 with 2θ in the range of 7.9°, 9.5° 22°-25°) that are associated with (1 0 1), (1 1 1),(0 5 1),(3 1 3) and (3 2 3), indicating that ZSM-5 was synthesised with a high level of purity and the patterns were comparable with those reported by (Hamidzadeh et al., 2020, Yuan et al., 2022a). The most prominent signal peaks in the composite MAC@ZSM-5 represent the predominance of ZSM-5.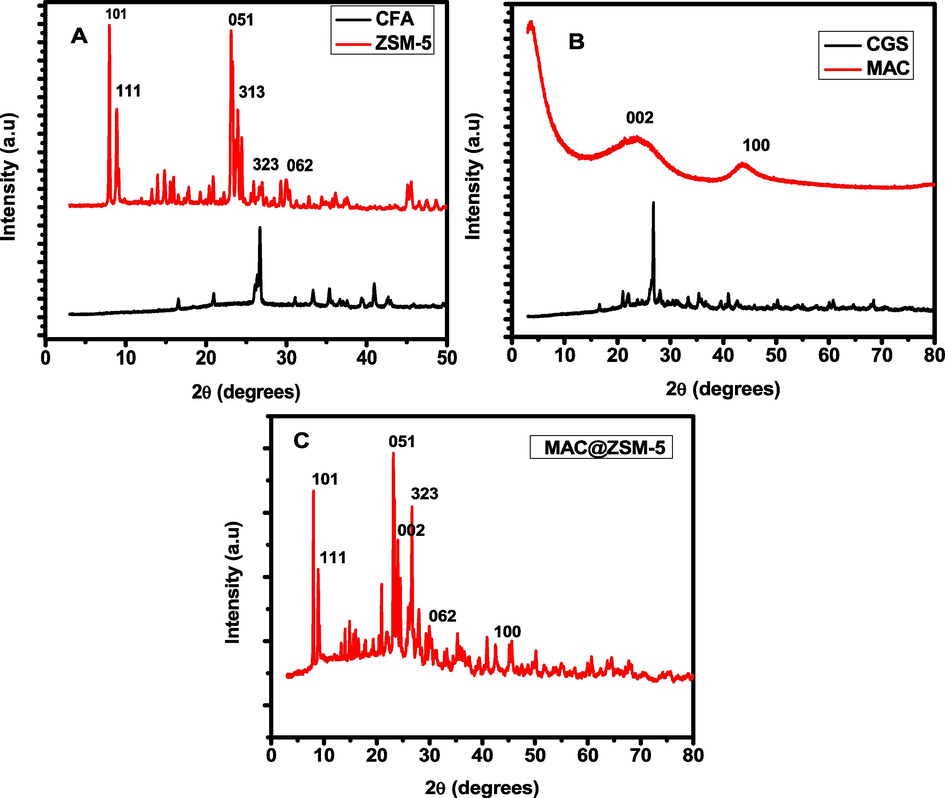
XRD diffraction pattern of CFA & ZSM-5 (A), CGS & MAC (B) and MAC@ZSM-5 composite (C).
3.2.3 Scanning electron microscopy (SEM) and energy dispersive spectroscopy (EDS)
The surface morphology of the raw and synthesised materials was carried out using SEM. The attained pictures are shown in Fig. 3. The fly ash and CGS consisted mainly of alumino-silicate spheres, lesser calcium-rich spheres, and small iron (III) oxide aggregates. The CFA showed small uniform spheres, which might be due to the high temperatures used in the combustion process (Fig. 3A). The few rough blocks could have resulted from unburnt carbon particles and components that were partially melted (Liu et al., 2021; Lv et al., 2023). CGS shows uniform spherical particles with mixed block porous components in the SEM image (Fig. 3B). Fig. 3C present the morphological properties of MAC. As shown, MAC exhibited remarkable porous structure with diverse size and shape. These pores might have been generated during the chemical treatment of the CGS residual carbon. These porous structures could provide enhanced adsorption of the target analytes within its mesopores and surface-active sites. Fig. 3D presents the morphological characteristics of ZSM-5. As shown, there was an absence of spherical particles observed in Fig. 3A, demonstrating the effectiveness of the hydrothermal treatment method that that resulted in high conversion of CFA into ZSM-5. These findings are comparable to those reported in the literature (Rajakrishnamoorthy et al., 2023). The SEM image of MAC@ZSM-5 nanocomposite uniformly dispersed particles on ZSM-5 onto MAC suggesting that MAC had more contact area and strong interaction with ZSM-5 particles. This observation could be favourable for the adsorption of the target analytes.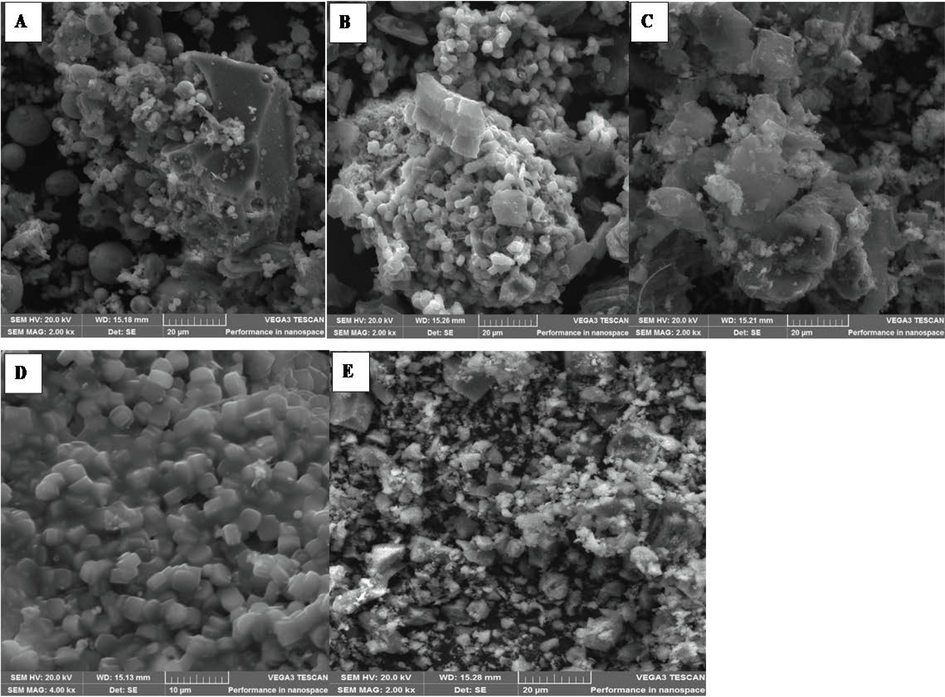
Scanning electron microscopy images of (A) coal fly ash (CFA), (B) coal gasification slag (CGS), (C) mesoporous activated carbon (MAC), (D) ZSM-5 zeolite, (E) MAC@ZSM-5 nanocomposite.
3.2.4 Energy dispersive spectroscopy
Energy dispersion spectra were used to determine the elemental composition of raw materials, their derivatives and nanocomposite (Fig. 4). As shown in Fig. 4A&B, CFA and CGS are composed of major elements such as silicon (Si), aluminium (Al), carbon (C) and oxygen (O), Some elements such as iron (Fe), calcium (Ca), magnesium (Mg), among others, were present in smaller percentages. Fig. 3C-E confirms the successful conversion of CFA and CGS to respective materials. The highest percentage of C and Si in Fig. 4F confirms the successful synthesis of the nanocomposite.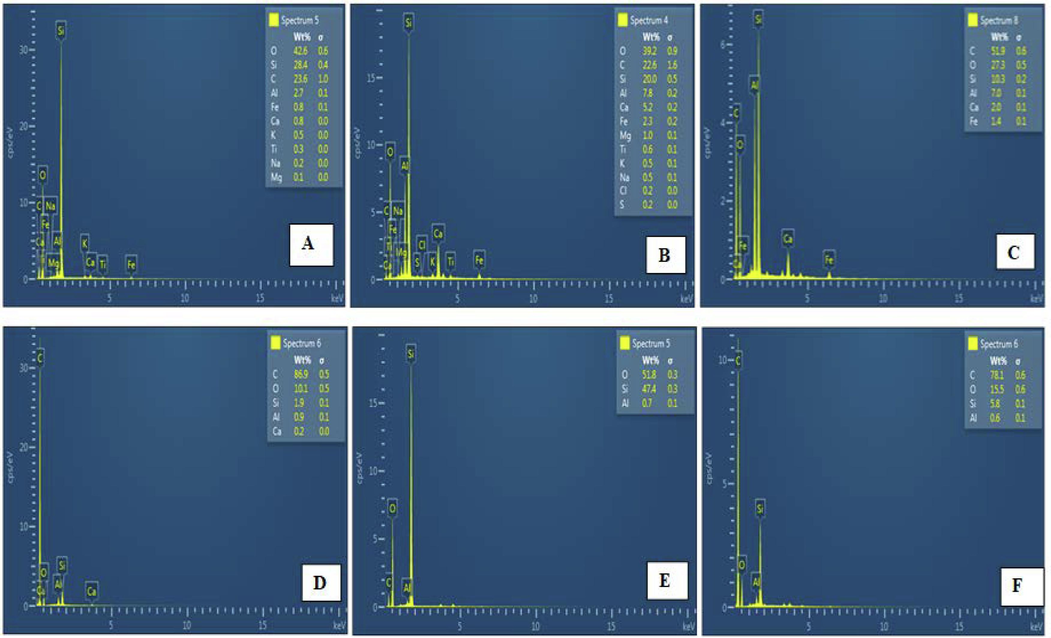
EDS Spectra of (A) CFA, (B) CGS, (C) residual carbon, (D) MAC, (E) ZSM-5 (F) and MAC@ZSM-5 nanocomposite.
3.2.5 Transmission electron microscopy (TEM)
The in-depth surface features of the prepared materials were obtained using TEM analysis and captured in images presented in Fig. 5. The images showed sheet-like structures where alumino-silicate spheres are attached to the ZSM-5, as seen on the image as a bright surface. As presented, Fig. 5 shows the smooth surface of activated carbon with well-defined pores.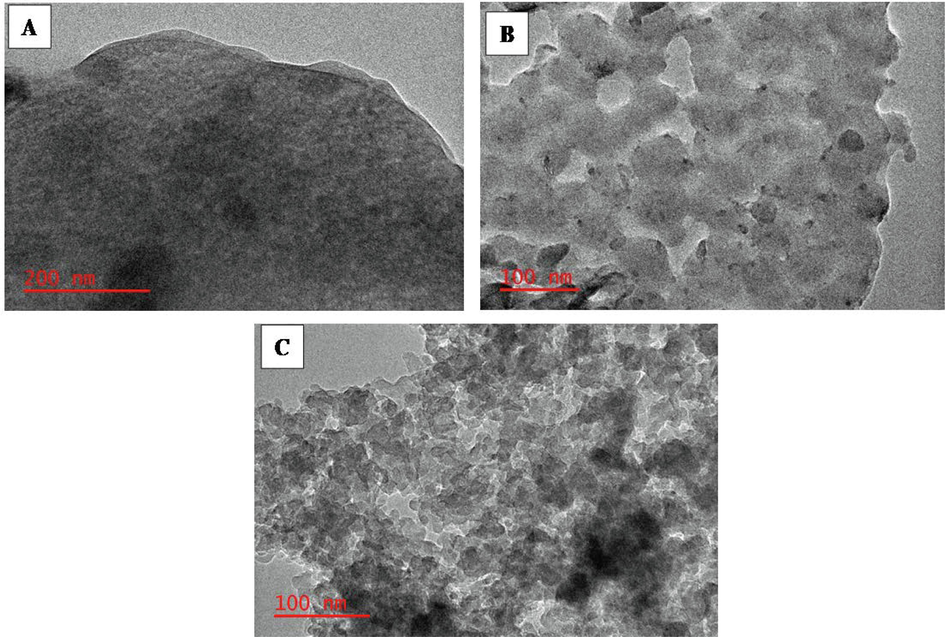
TEM micrographs of mesoporous activated carbon (A), ZSM-5 zeolite (B), and MAC@ZSM-5 (C).
3.2.6 N2 adsorption/desorption isotherm
The porosity of the raw and prepared materials was measured using N2 adsorption/desorption isotherm. Fig. S2. illustrates that the surface area of the CFA, CGS, ZSM-5, MAC, and MAC@ZSM-5 composite were 2, 10, 133, 625, and 500 m2/g, respectively. The BET surface area of the composite material is lower than that of activated carbon, suggesting that the combination of activated carbon with ZSM-5 decreased the surface area. The pore volume of MAC@ZSM-5 is 0.391 cm2/g, and the average pore size is 8.4 nm, as presented in Table 2. The ZSM-5 and MAC possess pore diameters of 2.0 and 13.7 nm, and They belong to the mesopore region according to the IUPAC classification. The results obtained were comparable with other reports. Yuan et al. (2022) prepared a ZSM-5 adsorbent using a coal gasification slag at different molar ratios of sodium hydroxide. They found that a 2 M ZSM-5 has a mesoporous structure and a pore diameter of 2 nm. The chemical treatment during the preparation process contributed to the high surface and total pore volume, which were advantageous for the adsorptive removal of selected pharmaceuticals. The thermal activation process in the presence of N2/CO2 was crucial for creating meso and micropores on the material's surface.
Sample
BET Surface area (m2/g)
Total pore volume (cm3/g)
Average pore size (nm)
CFA
1.98
0.003
6.5
CGS
10.3
0.014
5.2
MAC
625
0.457
13.7
ZSM-5
133
0.320
2.0
MAC@ZSM-5
500
0.391
8.4
3.2.7 The point of zero charge
It is imperative to examine the pH at which the material's surface is neutral, i.e., where the material possesses an equal number of positively and negatively charged. This concept is defined as pH at a point of zero charge. The point of zero charge was performed to investigate the surface science and provide insight into the sorption mechanism through electrostatic and physicochemical interactions between the MAC@ZSM-5 composite and analytes of interest. The point of zero charge was determined using the salt addition method (Bakatula et al., 2018). The pH results were attained as the change in pH was plotted against the initial pH of the aqueous solutions in the pH 2–13 range. The point of zero charge was obtained from the graph of change in pH (=pHf −pHi) against pHi. As presented in Fig. 6. the PZC is 8.9, demonstrating that at pH less than pHpzc, the surface of the prepared material is positively charged, and at a pH greater than pHpzc, the surface is negatively charged.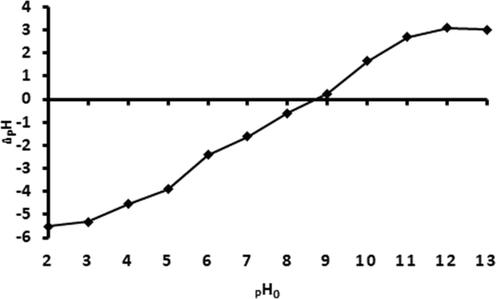
Point of zero charge of MAC@ZSM-5 composite.
3.3 Optimisation strategy
3.3.1 Selection of adsorbent
The extraction efficiencies of the raw and prepared materials fly ash, coal gasification slag, activated carbon and ZSM-5 were compared with the percentage recoveries of the composite obtained during the extraction of aspirin (ASP), ibuprofen (IBP), and paracetamol (PCT). The extraction efficiencies obtained in Fig. 7. indicated that the MAC@ZSM-5 composite resulted in the highest percentage recoveries for the extraction of ASP, IBP and PCT. This could be attributed to MAC@ZSM-5 being highly porous and offering strong binding affinity, permitting various interactions between analytes and the adsorbent and large surface area.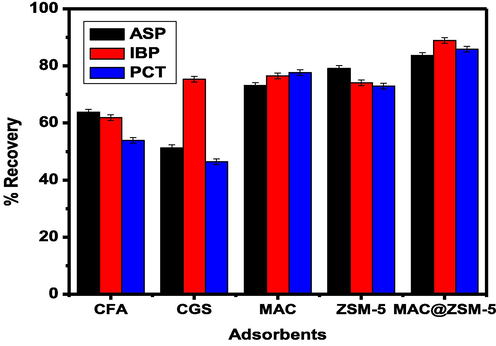
Adsorbent performance for the extraction and preconcentration of (aspirin (ASP), ibuprofen (IBP), and paracetamol (PCT): Experimental conditions: mass of adsorbent 50 mg, eluent volume: 1000 µL acetonitrile, extraction time 30 min, sample volume 5 mL, elution time 5 min sample pH 6.5.
3.3.2 Selection of elution solvent
Selecting a suitable eluent is crucial for the effective and quantitative recovery of the analytes from the adsorbent. Furthermore, it is important to investigate different types of elution solvents because of their differences in physicochemical characteristics, which then influence the desorption process. The capabilities of various organic solvents such as methanol, ethanol, acetonitrile, and methanol–acetonitrile (50:50, v/v) were assessed for the desorption of ASP, IBP, and PCT from the MAC@ZSM-5 composite. The results in Fig. S3. demonstrate that acetonitrile had the highest recoveries for all the target analytes. This is because acetonitrile is an aprotic polar solvent with strong elution capability, which can break the strong interaction between the analytes (ASP, IBP, and PCT) and MAC@ZSM-5 composite. In addition, these results suggest that the analytes were highly soluble in acetonitrile. Therefore, acetonitrile was selected as an elution solvent for further experiments.
3.3.3 Optimisation of extraction and preconcentration factors using central composite design (CCD)
In this study, the extraction and preconcentration conditions were optimised using the design of the experiment approach. The effect of independent factors, including the sorbent mass, eluent volume, sample pH, and extraction time, was assessed using central composite design (CCD), such as mass of adsorbent eluent volume, sample pH and extraction time (ET) well as their interactions on the analytical response (percentage recovery, %R). The CCD was chosen over other DOE approaches because it explores quadratic response surface, and each factor is investigated at five levels. This design evaluated the main, interaction, and quadratic effects were assessed. Furthermore, CCD allows the attainment of combined effects of the significant variables and the estimation of the optimum conditions using the desirability function. The CCD matrix of the experimental factors and their respective analytical response values are shown in Table S4. The results in Table S1 were analysed using STATISTICA software (version 14). The analysis of variance (ANOVA) reproduced in Pareto charts was used to visualise the effect of main individual factors and their interactions on % R at a 95 % confidence level (Fig. S4.). The results showed that sample pH and eluent volume were significant variables for all analytes at a 95 % confidence level. Other factors and interactions between main variables have p-values greater than 0.05 (95 % confidence level), suggesting they are not statistically significant. Furthermore, the sample pH had a negative effect, and eluent volume positively impacted all analytes. This means sample pH must decrease from the highest to lowest values to obtain quantitative extraction of the target analytes. Meanwhile, the eluent volume must increase to obtain quantitative recoveries of the analytes.
3.3.3.1 Response surface methodology
Fig. 8 (A) presents the response surface plots for the MA and sample pH combined effect. It can be seen from Fig. 8. (A) that increasing MA and sample pH leads to an increase in the adsorption of the target analytes. Sample pH values > 9 decreased the adsorption efficiency (See also Fig. 7 (A&E). This might be ascribed to changes in the adsorbent's surface charge and the analyte forms. According to Fig. 6, the pHpzc of the adsorbent was 8.9, suggesting that the surface of the MAC@ZSM-5 composite was positively charged below 8.9 and negatively charged above this pH value(Iovino et al., 2015). Furthermore, the functional groups of the target analytes are similar, suggesting that their adsorption onto the MAC@ZSM-5 composite was almost the same even though they have different pKa values. The pKa values for ASP, IBP, and PCT are 3.5, 4.91, and 9.38 (Iovino et al., 2015; Chen et al., 2018; Nordin et al., 2023), respectively. Therefore, at pH < pKa values, ASP, IBP, and PCT are neutral molecules; at pH > pKa, they exist as anionic forms(Joodaki and Mollahosseini, 2023). The adsorption mechanism of the target analytes onto the surface of the adsorbent was found to be pH-dependent. At pH values ranging from 2 to 3.4, ASP, IBP, and PCT adsorption mechanisms involved π-cation interaction between the analytes NSAIDs and the positively charged MAC@ZSM-5 composite (Baile et al., 2019). At pH values ranging from 5 to 8.8, the adsorption of ASP and IBU was governed by electrostatic interaction between the positively charged MAC@ZSM-5 composite and the anionic ASP and IBP molecules. At the same time, the adsorption of PCT onto the composite was dominated by π-cation interaction since it had the largest pKa value. Above the pHpzc, the adsorption efficiency of the adsorbent decreases due to the electrostatic repulsion between the analytes' negatively charged adsorbent and anionic forms.
Fig. 8 (B) presents the interaction between ET and MA; the results revealed that high extraction of ASP, IBP, and PCT required longer contact time between the analytes and the active sites of the adsorbent. This was attributed to the enhanced mass transfer of the analytes to the adsorbent surface area due to its dispersion in the solution (see Fig. 8 D&F). It is important to note that the extraction and preconcentration of the analytes was carried out via ultrasonication. The ultrasonication process speeds extraction by activating and concentrating the composite surfaces towards the ASP, IBP, and PCT solution. Furthermore, increasing the mass of the MAC@ZSM-5 composite increased the available active sites (Fig. 8 A-C), thus increasing the extraction efficiency of the adsorbent. Similarly, as the elution volume increases, analyte concentrations in the solvent increase, thus increasing %R (Fig. 8 C, E & F). Fig. 8 E shows that at pH values between 2 and 8.8, the %R for the target analytes increased with increasing the EV.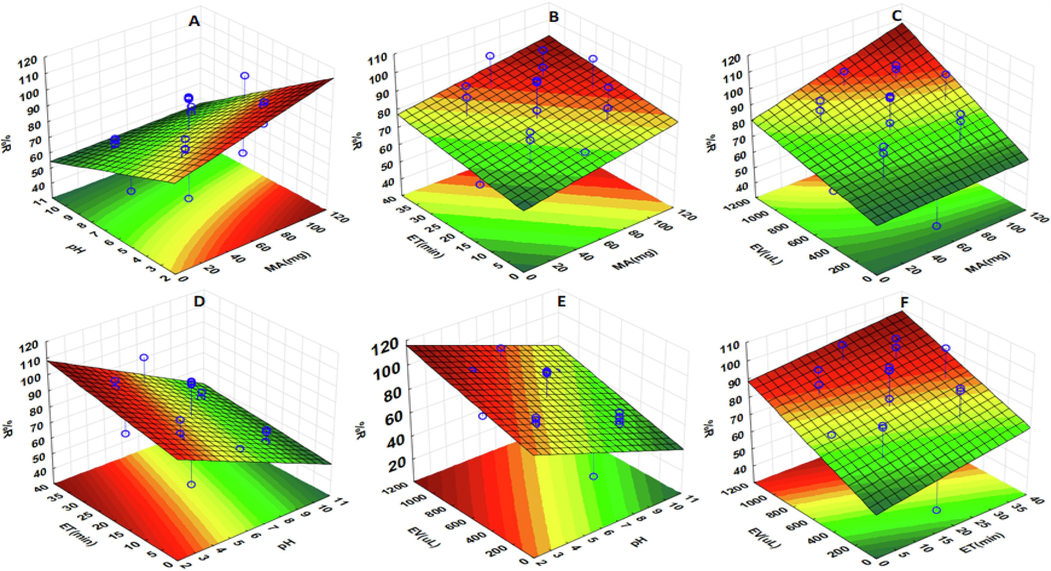
Response surface plots for the preconcentration and removal of ASP, PCT and IBP representing the interactive effects of the independent variables, sorbent mass (MA) and sample pH (A), contact time (ET) and sorbent mass (B), eluent volume (EV) and sorbent mass (MA) (C), contact time (ET) and sample pH (D), eluent volume and sample pH (E) and contact time (ET) and eluent volume (EV) (F).
3.3.3.2 The desirability function
The desirability function was used to obtain the optimum conditions for maximum extraction recovery of ASP, IBP, and PCT from the MAC@ZSM-5 composite. The optimum conditions from the desirability profile are estimated using desirability scores ranging from 0 (undesirable %R) to 1 (most desired %R). In this study, the desirability score of 1 was chosen to obtain the optimal conditions for the extraction and preconcentration of analytes. According to Fig. S5, the optimum conditions were 82 mg, 6.5, 20 min, and 1044 µL for MA, pH, ET, and EV. These optimum conditions could result in predicted %R of 102 %, 100.0, and 107 for ASP, IBP, and PCT, respectively. These results were verified experimentally, and six replicate measurements were performed. The experiments were conducted to evaluate the validity of the model. The experimental results were 98.9 ± 2.4 %, 99.1 ± 2 %, and 101 ± 3 % for ASP, IBP and PCT, respectively. According to the student T-test, the observed values agreed with the predicted %R at a 95 % confidence level, suggesting that the model was valid.
3.4 Equilibrium studies
3.4.1 Adsorption isotherms
The interaction between the analytes of interest and MAC@ZSM-5 composite was examined using equilibrium isotherms. In this study, the equilibrium studies for the adsorption of IBP, PCT, and ASP onto the surface of the MAC@ZSM-5 composite were studied at optimum conditions (Fig. S6). The effect of IBP, PCT, and ASP concentration on the MAC@ZSM-5 composite was determined by fitting the experimental isotherms to Langmuir, Freundlich, and Dubinin-Radushkevich's model. The data obtained from the adsorption of selected compounds fitted well on the Freundlich isotherm model with a high correlation coefficient (R2), as presented in Table 3. The Freundlich model assumes multilayer analyte adsorption onto the composite with a heterogeneous surface (Godiya et al., 2020). Freundlich adsorption occurs on a heterogeneous surface through multisite. The assumption is that stronger binding sites get occupied first, and the decrease in the critical strength is due to the increase in adsorbed molecules at these sites. The maximum equilibrium capacities, qe (mg/g) of MAC@ZSM-5 composite, were 98.0 mg/g, 75.8 mg/g, and 71.4 mg/g for AS, IBP, and PCT, respectively. Dubinin-Radushkevich isotherm was applied to differentiate between physical and chemical sorption by assessing the mean Energy (E). The E value from the D-R model is lower than 8 kJ/mol, suggesting that physisorption dominates the adsorption process.
Isotherms
Parameters
ASP
IBP
PCT
Langmuir
qmax (mg/g)
98.0
75.8
71.4
KL (L/mg)
0.034
0.025
0.50
R2
0.785
0.799
0.723
Freundlich
KF (mg/L)-1/n
35.2
30.5
12.841
n
1.1
1.1
1.3
R2
0.973
0.998
0.918
D-R
qD-R (mg/g)
29.2
11.8
30.3
E (KJ/mol)
0.845
1.29
3.16
R2
0.831
0.745
0.891
3.4.2 Kinetics modelling
The kinetics for ASP, IBP, and PCT adsorption were also investigated. Adsorption kinetic data were used to study the effect of time on the adsorption of selected pharmaceuticals onto the surface of the MAC@ZSM-5 composite. Two kinetic models were used to fit the experimental data: pseudo-first order and pseudo-second order. The parameters and correlation coefficient that were obtained are summarised in Table 4. Compared to the pseudo-first-order model, the pseudo-second-order model fitted well based on the high correlation coefficient achieved for all analytes of interest, as shown in Table 4. This suggested that chemisorption could be involved during the sorption of the NSAIDs onto the MAC@ZSM-5 composite. Furthermore, the experimental qe values were comparable to the pseudo-second-order sorption capacity values. Thus, the rate-limiting step could be said to follow a chemisorption type of adsorption driven by electrostatic interaction between the MAC@ZSM-5 and the target analytes (Godiya et al., 2020).
Equations
Parameters
ASP
IBP
PCT
Pseudo first order
qe exp
436.9
332.2
183.4
0.0735
0.0708
0.0552
K1 (1/min)
44.9
44.6
40.01
R2
0.7134
0.7088
0.8362
Pseudo second order
qe (mg/g)
131.6
93.46
74.07
K2 (g/mg min)
0.00492
0.0087
0.0141
R2
0.7941
0.8766
0.9813
The intraparticle diffusion model was adopted to establish the rate-controlling step and better understand the adsorption mechanism. The slope (Kid) indicates the intraparticle diffusion rate constant (mg/g min1/2), while the intercept (C) represents the boundary layer (mg/g). The model indicated that two stages of ASP, PCT, and IBP adsorption occurred. From the graph of intraparticle diffusion (Fig. S8), it is obvious that a two-step adsorption procedure happened during the adsorption of the three analytes. The principal rate-determining step in the first stage is intraparticle diffusion, while surface area is the primary rate-controlling step in the second step (Sahin et al., 2020). The intraparticle was slow, as demonstrated by the low intraparticle rate constant compared to the one for film diffusion, according to the results reported in Table 5. Elovich and Boyd's models were used further to explore the nature of the analytes sorption mechanism. The Elovich model aids in calculating the activation energy, mass, and surface diffusion. According to the Boyd model, the boundary layer surrounding the mesoporous MAC@ZSM-5 composite had a larger effect on the diffusion of ASP, IBP, and PCT. The statistics in the table fit Elovich's model better than Boyd's, showing that intraparticle diffusion was more important than film diffusion.
Equations
Parameter
ASP
IBP
PCT
Intraparticle diffusion
Kid1 (mg/g) min1/2
5.823
6.64
4.73
C1 (mg/g)
14.689
16.898
4.24
R12
0.9933
0.9895
0.9979
Kid2 (mg/g) min1/2
2.256
1.481
3.54
C2 (mg/g)
20.655
28.3
8.13
R22
0.9235
0.994
0.9155
Elovich
α (mg/g min)
19.4
18.3
16.4
β (g/mg)
46.9
41.2
32.6
R2
0.9286
0.973
0.975
Boyd model
Slope
0.011
0.0075
0.0068
Bt = -0.4977-ln(1-F)
Intercept
1.33
0.771
0.729
R2
0.969
0.882
0.962
3.4.3 Thermodynamics studies
The effect of temperature on the removal of ASP, IBP, and PCT using MAC@ZSM-5 composite was examined to understand the most pre-eminent sorption mechanism. The tests were carried out at various temperatures (298, 303, 308, and 313 K). Thermodynamic parameters such as change in entropy (ΔS0), enthalpy (ΔH0), and Gibb's energy (ΔG0) were calculated using equations reported by (Ahmad et al., 2014, Fu et al., 2015, Elamin et al., 2019). The enthalpy and entropy were calculated using the slopes and intercepts of the Van't Hoff plots generated by plotting ln KL versus 1/T. At various solution temperatures of 298, 303, 308, and 313 K, KL values were obtained using the relationship ln qe/ce, and the results are presented in Table 6. According to Tran and co-workers, a negative value of ΔH° (ΔH0 < 0) implies an exothermic process that results in the decrease of the adsorption capacity at higher temperatures. The positive (ΔH0 > 0) observed in Table 6 indicates an endothermic process, which is consistent with other studies reported in the literature (Tran et al., 2021). This behaviour could be explained by an increase in the rate of adsorbate diffusion through the external boundary layer and internal pores of the adsorbent. The positive ΔS0 values indicate that the degree of freedom increased during adsorption at the solid–liquid interface. The positive values also suggest the randomness at the solid–liquid interface, reflecting the adsorbate's affinity towards the adsorbent. The negative values for gibs energy change indicate the adsorption of ASP, IBP, and PCT onto MAC@ZSM-5 composite was spontaneous and occurred favourably.
Analytes
T(K)
ΔG°(KJ/mol)
ΔH° (KJ/mol)
ΔS° (J mol/K)
ASP
298
−12.59°
31.6
52.9
303
−12.71
308
−12.86
313
−12.94
IBP
298
−14.25
29.0
54.5
303
−14.58
308
−14.67
313
−14.92
PCT
298
−13.35
36.6
55.8
303
−13.57
308
−13.60
313
−13.85
The MAC@ZSM-5 composite demonstrated significantly greater sorption capacities for the targeted analytes than Ref (Pirvu et al., 2022). However, other studies (Lung et al., 2021; Aydin et al., 2023) have reported higher sorption capacities for the analytes of interest. This discrepancy may be attributed to the adsorbents' surface characteristics and design variations. The MAC@ZSM-5 sorption efficiency was comparable with other adsorbents used in previous reports for the adsorptive removal of ASP, IBP, and PCT in aqueous solution samples, as presented (Table 7). It is also important to highlight that the MAC@ZSM-5 composite exhibited high affinity towards all the targeted analytes.
Adsorbent
Analytes
qe (mg/g)
Refs
Na-montmorillonite
Paracetamol
244
(Aydin et al., 2023)
CNT-COOH/MnO2/Fe3O4
Ibuprofen, paracetamol
81–103
(Lung et al., 2021)
Activated carbon
Ibuprofen, paracetamol
0.70–0.85
(Pirvu et al., 2022)
MIP and NIP
paracetamol
72–191
(Mpayipheli et al., 2021)
MAC@ZSM-5
Paracetamol, ibuprofen and aspirin
71.4–98.0
This work
3.4.4 Mechanism of adsorption
The nature of the target analyte and the material's surface chemistry may influence the adsorption process. The point of zero charge was performed using a salt addition method. It was found to be 8.9, suggesting that the surface of MAC@ZSM-5 is positively charged at a pH < pHpzc and negatively charged at a pH > pHpzc. From the Pareto chart results, pH was identified as the most significant factor affecting the sorption process of the target analytes. The optimal pH was obtained at 6.5. Sample pH values > 9 decreased the adsorption efficiency (Fig. 8 (A&E). This might be attributed to changes in the adsorbent's surface charge and the distribution of the species of the analytes of interest in solution. The adsorption mechanism of the target analytes onto the surface of the adsorbent was found to be pH-dependent. At pH values ranging from 2 to 3.4, ASP, IBP, and PCT adsorption mechanisms involved π-cation interaction between the analytes NSAIDs and the positively charged MAC@ZSM-5 composite (Baile et al., 2019). At pH values ranging from 5 to 8.8, the adsorption of ASP and IBP was controlled by electrostatic interaction between the positively charged MAC@ZSM-5 composite and the anionic ASP and IBP molecules. At the same time, the adsorption of PCT onto the composite was governed by π-cation interaction since it had the most considerable pKa value. Above the pHpzc, the adsorption efficiency of the adsorbent decreases due to the electrostatic repulsion between the analyte's negatively charged adsorbent and anionic forms. Additionally, the target analytes' functional groups are similar, even though their pKa values varied, and their adsorption onto the MAC@ZSM-5 composite was almost the same. Therefore, no significant changes occurred in the spectra before and after adsorption, indicating a physisorption mechanism (Fig. 9).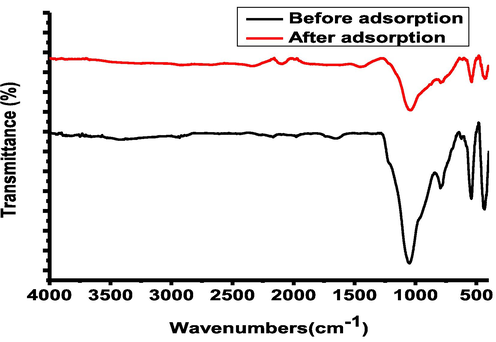
FTIR Spectra before and after adsorption.
3.5 Reusability, leaching and regeneration studies
The reusability studies were evaluated by performing a sequence of extraction and elution cycles (Fig. S9). Elution of the selected pharmaceutical compounds was executed using HPLC-grade acetonitrile. The adsorbed analytes were eluted by dispersing 104 mg of MAC@ZSM-5 composite in 1044.8 µL of acetonitrile solution and sonicated for 20 min. Separation was carried out using a centrifuge to separate the supernatant. After separating, the adsorbent was washed thrice with ethanol–water and dried in an oven at 70 °C. The MAC@ZSM-5 composite was applied after being separated, purified, and dried in an oven. The adsorption/desorption cycles of the composite material slightly decreased after the 5th cycle, which means that the MAC@ZSM-5 composite could be reused for up to the 5th cycle without significant changes in sorption efficiencies. The saturated MAC@ZSM-5 adsorbent decreased sorption capacity after the fifth cycle, and the washing and centrifugation of the sorbent could result in a slight loss after the fourth cycle. The spent adsorbent was also characterised by XRD (Fig. S10). The results showed that the MAC@ZSM-5 adsorbent did not lose its crystallinity. The leaching of some elements (Cu, Zn, As, Cr, and Sr) detected using XRF in the raw materials was monitored. This investigated whether these elements had completely leached out during preparation to avoid secondary contamination. Cu, Zn, As, Cr and Sr concentrations were determined to use ICP-OES. The results showed that these elements were found below the detection limits, suggesting that the preparation process effectively eliminated the aspects that could lead to secondary contamination. This adsorbent was recognised as a stable, efficient, porous material with high reusability properties.
3.6 Method performance
The analytical performance of the method was examined using the reproducibility, repeatability, robustness, linear dynamic range, limit of detection, limit of quantification, enrichment factor, and matrix effect. The standard solutions containing the analytes of interest ranging from 0-1000 µg/L were preconcentrated using the developed method, and then after spiking, the recovery test was performed using river water. The seven calibration points for the analytes of interest were constructed to determine the linearity. The calibration curve was linear over the concentration range 0.1–800 µg/L for ASP, 0.2–1000 µg/L for IBP and 0.1–750 µg/L for PCT with coefficients of determination of 0.9989, 0.9991 and 0.9978 for ASP, IBP and PCT which showed good linearity. The LODs and LOQs are 0.017–0.064 µg/L and 0.057–0.21 µg/L, respectively. The repeatability (intraday, % RSD) and reproducibility (interday, % RSD) were determined using a spiking recovery test and were < 5 %. Matrix effect: the presence of other compounds in a sample can either enhance or suppress the signal of the analytes of interest, and this is referred to as the matrix effect. The extracts of both matrix-matched samples and pure standard solutions were used to assess the matrix effect. The results from Table 8 showed that the percentage of matrix effect values for IBP, ASP, and PCT varied between −4.3 %, −14.8 %, and −19.7 %, suggesting that there was little to no observable suppression or enhancement in signal response after the samples were pre-treated with the UA-µSPE method. The matrix effect was then calculated using the following equations.
Analytical parameters
ASP
IBP
PCT
Linearity (µg/L)
0.1–800
0.2–1000
0.1–750
Regression equation
y = 1.356 x + 2.7817
y = 1.4112 x + 0.143
y = 1.929 x + 0.815
Correlation coefficient (R2)
0.9989
0.9991
0.9978
LODs (µg/L)
0.023
0.064
0.017
LOQs (µg/L)
0.077
0.21
0.057
Enrichment factor
66.4 ± 3.5
81.8 ± 2.6
54.3 ± 3.8
Intraday precision (n = 10)
3.11
2.18
2.95
Interday precision (n = 6)
4.91
3.43
4.87
Recovery (%)
82.7 ± 3.7
95.8 ± 2.9
89.1 ± 4.1
Matrix effect
−14.8
−4.3
−19.7
Where the slope (matrix-matched standard) depicts the slope of the calibration curve constructed using a matrix-matched matrix, and the slope (ultrapure water standard) is the slope of a calibration curve obtained using standards prepared in ultrapure water. All these standards were processed using the developed method.
3.7 Analysis of real sample
The developed method was applied for the preconcentration and extraction of ASP, IBP, and PCT from real wastewater samples. Samples collected from Baviaanspoort wastewater treatment plant effluent and Pianaar River were spiked at two concentration levels. As seen in Table 9, IBP and PCT were detected in the effluent wastewater in a concentration range of 5.89–7.66 µg/L. IBP and PCT were also detected in Pianaar's river water samples at a concentration range (1.38–2.38 µg/L). Pienaars River is close to the Baviaanspoort WWTP and receives effluent wastewater from this WWTP. ASP was found below the detection limit. The results in Table 9 illustrate the method's effectiveness in isolation and preconcentration of the analytes of interest in real water samples.
Analytes
Added (µg/L)
Baviaanspoort effluent
%R
Pienaars River
%R
ASP
0
<LOQ
<LOQ
1
0.931 ± 0.031
93.1 ± 3.3
0.955 ± 0.013
95.5 ± 1.4
5
4.72 ± 0.14
94.4 ± 3.0
4.88 ± 0.08
97.6 ± 1.6
IBP
0
5.89 ± 0.22
−
1.38 ± 0.06
−
1
6.85 ± 0.12
96.0 ± 1.8
2.32 ± 0.09
94.0 ± 3.9
5
10.8 ± 0.3
98.2 ± 2.8
6.17 ± 0.22
95.8 ± 3.1
PCT
0
7.66 ± 0.12
−
2.38 ± 0.09
−
1
8.59 ± 0.23
93.1 ± 2.7
3.35 ± 12
97.2 ± 3.6
5
12.45 ± 0.18
95.8 ± 1.4
7.51 ± 0.15
103 ± 2
3.8 Comparison of UA-µSPE with other sample preparation techniques
A comprehensive investigation compared the developed method with other methods reported in previous studies for similar compounds in environmental samples. The performance of the developed method was examined using various analytical measurements such as the linear dynamic range, detection limit, and relative standard deviation (Table 10). These measurements assessed the differences between the current work and the literature-reported studies. The results showed that the developed method was comparable to some reported methods for extracting and preconcentrating targeted analytes using chromatographic techniques. The detection limits achieved by this method were comparable to those reported by other authors, although some authors reported lower LODs (Korkmaz et al., 2022) and higher LODs (Doğan et al., 2020; Hashemi et al., 2020). Moreover, the established method exhibited a wider linear dynamic range and greater sensitivity. It also demonstrated robustness, as indicated by the percentage relative standard deviation, making it advantageous for routine analysis of pollutants in environmental aqueous samples.
Analytes
Analytical method
Matrix
Linearity (µg/L)
LOD (µg/L)
%RSD
Refs
Paracetamol
SA-DES-ME
Synthetic urea
50–800
14.9
<3.3
(Doğan et al., 2020)
Ibuprofen and paracetamol
Biodegradation-RP-HPLC
wastewater
0.5–100
0.03
< 2
(Encarnação et al., 2020)
Ibuprofen
LLE-SPE-HPLC
sea water
−
0.015
6
(Korkmaz et al., 2022)
Aspirin and ibuprofen
SPE-GC–MS
wastewater effluent
−
0.030–0.143
(Thalla and Vannarath, 2020)
Paracetamol
VA-d-µMISPE
wastewater
0.630–500
0.19
< 5
(Mpayipheli et al., 2021)
Paracetamol
Pipette tip µSPE
seawater
1.0–1000
0.3
3.0
(Hashemi et al., 2020)
Aspirin, paracetamol and ibuprofen
Ultrasonic assisted-µSPE-HPLC-DAD
River water
0.1–1000
0.023–0.064
< 5
This work
4 Conclusion
The fabrication of MAC@ZSM-5 composite using the residual carbon enriched from coal gasification slag and ZSM-5 from coal fly ash was successfully executed by chemical, thermal and hydrothermal methods. The combination of MAC and ZSM-5 resulted in a porous and large surface area adsorbent, which proved to be effective in extracting and removing ASP, IBP and PCT from aqueous solutions. The application of ultrasound power enhanced the adsorption process due to accelerated mass transfer, the enhanced affinity between adsorbent and adsorbate and the quick attainment of the equilibrium. The equilibrium results from the isotherm models demonstrated that the sorption fitted well on the Freundlich model, indicating the predominance of the physisorption on the material's surface. The pseudo-second-order model best described the kinetic data, which suggested that chemisorption predominated the adsorption process. The enthalpy, entropy, and Gibbs energy thermodynamic parameters demonstrated the spontaneity of the sorption process. The synthesised composite was also used to extract and preconcentrate ASP, IBP and PCT from real wastewater, effluent, and river water samples through the UA-µSPE method. Results indicated that the MAC@ZSM-5 composite can be used for wastewater and water treatment.
Declaration of competing interest
The authors declare that none of the work described in this paper appears to have been influenced by any known competing financial interests or personal relationships.
CRediT authorship contribution statement
Xoliswa Cingo: Conceptualization, Data curation, Formal analysis, Investigation, Methodology, Validation, Visualization, Writing – original draft. Azile Nqombolo: Data curation, Formal analysis, Investigation, Methodology, Validation, Visualization, Writing – review & editing. Anele Mpupa: Data curation, Formal analysis, Methodology, Validation, Visualization, Writing – review & editing. Luthando Nyaba: Conceptualization, Supervision, Validation, Visualization, Writing – review & editing. Odwa Mapazi: Conceptualization, Supervision, Validation, Visualization, Writing – review & editing. Philiswa Nosizo Nomngongo: Conceptualization, Data curation, Formal analysis, Funding acquisition, Project administration, Resources, Software, Supervision, Validation, Visualization, Writing – review & editing.
Acknowledgements
The authors wish to acknowledge the financial support from Mintek and the Department of Science and Innovation-National Research Foundation South African Research Chair Initiative (DSI-NRF SARChI) funding instrument, grant no. 91230. They wish to thank the University of Johannesburg, Faculty of Science, and Department of Chemical Sciences for laboratory space.
References
- Kinetic, equilibrium and thermodynamic studies of synthetic dye removal using pomegranate peel activated carbon prepared by microwave-induced KOH activation. Water Resour. Ind.. 2014;6:18-35.
- [CrossRef] [Google Scholar]
- Fly ash-based adsorbent for adsorption of heavy metals and dyes from aqueous solution: A review. J. Mater. Res. Technol.. 2021;14:2751-2774.
- [CrossRef] [Google Scholar]
- Effective removal of selected pharmaceuticals from sewerage treatment plant effluent using natural clay (Na-montmorillonite) Appl. Water Sci.. 2023;13:1-14.
- [CrossRef] [Google Scholar]
- A comprehensive review on current technologies for removal of endocrine disrupting chemicals from wastewaters. Environ. Res.. 2022;207:112196
- [CrossRef] [Google Scholar]
- Zeolites and zeolite-based materials in extraction and microextraction techniques. Analyst. 2019;144:366-387.
- [CrossRef] [Google Scholar]
- Determination of point of zero charge of natural organic materials. Environ. Sci. Pollut. Res.. 2018;25:7823-7833.
- [CrossRef] [Google Scholar]
- Physical, chemical, and geotechnical properties of coal fly ash: A global review. Case Stud. Constr. Mater.. 2019;11:e00263.
- [CrossRef] [Google Scholar]
- Adsorption of crystal violet dye onto a mesoporous ZSM-5 zeolite synthetized using chitin as template. J. Colloid Interface Sci.. 2017;508:313-322.
- [CrossRef] [Google Scholar]
- Optimization of crystal growth of sub-micron ZSM-5 zeolite prepared by using Al(OH) 3 extracted from fly ash as an aluminum source. J. Hazard. Mater.. 2018;349:18-26.
- [CrossRef] [Google Scholar]
- Determination of paracetamol in synthetic urea and pharmaceutical samples by shaker-assisted deep eutectic solvent microextraction and spectrophotometry. Microchem. J.. 2020;154:104645
- [CrossRef] [Google Scholar]
- Insight to aspirin sorption behavior on carbon nanotubes from aqueous solution: Thermodynamics, kinetics, influence of functionalization and solution parameters. Sci. Rep.. 2019;9:1-10.
- [CrossRef] [Google Scholar]
- Development and validation of a RP-HPLC method for the simultaneous analysis of paracetamol, ibuprofen, olanzapine, and simvastatin during microalgae bioremediation. MethodsX. 2020;7
- [CrossRef] [Google Scholar]
- Water reuse for aquaculture: Comparative removal efficacy and aquatic hazard reduction of pharmaceuticals by a pond treatment system during a one year study. J. Hazard. Mater.. 2022;421
- [CrossRef] [Google Scholar]
- Adsorption of methylene blue by a high-efficiency adsorbent (polydopamine microspheres): Kinetics, isotherm, thermodynamics and mechanism analysis. Chem. Eng. J.. 2015;259:53-61.
- [CrossRef] [Google Scholar]
- Recent applications of organic molecule-based framework porous materials in solid-phase microextraction for pharmaceutical analysis. J. Pharm. Biomed. Anal.. 2022;221:115040
- [CrossRef] [Google Scholar]
- Amine functionalized egg albumin hydrogel with enhanced adsorption potential for diclofenac sodium in water. J. Hazard. Mater.. 2020;393:122417
- [CrossRef] [Google Scholar]
- Modified seeding method to produce hierarchical nanocrystalline ZSM-5 zeolite. Mater. Today Commun.. 2020;25:101308
- [CrossRef] [Google Scholar]
- Application of molecularly imprinted polymer pipette tip micro-solid phase extraction of nalidixic acid and acetaminophen from pills and seawater samples and their determination by spectrophotometry. Chem. Pap.. 2020;74:4009-4023.
- [CrossRef] [Google Scholar]
- A modeling analysis for the assessment of ibuprofen adsorption mechanism onto activated carbons. Chem. Eng. J.. 2015;277:360-367.
- [CrossRef] [Google Scholar]
- Jawad, A.H., Saud Abdulhameed, A., Wilson, L.D., Syed-Hassan, S.S.A., ALOthman, Z.A., Rizwan Khan, M., 2021. High surface area and mesoporous activated carbon from KOH-activated dragon fruit peels for methylene blue dye adsorption: Optimization and mechanism study. Chinese J. Chem. Eng. 32, 281–290. doi: 10.1016/j.cjche.2020.09.070.
- Evaluation modified luffa with silver nanoparticles (LF/AgNPs) for removal of a nonsteroidal anti-inflammatory (IBUPROFEN) from aqueous media. Environ. Nanotechnol. Monit. Manag.. 2023;20:100823
- [CrossRef] [Google Scholar]
- Water remediation for pharmaceutical and personal care products (PPCPs) with metal organic frameworks: A review. Results Chem.. 2023;6:101223
- [CrossRef] [Google Scholar]
- Fate and toxicity of pharmaceuticals in water environment: An insight on their occurrence in South Asia. J. Environ. Manage.. 2020;271:111030
- [CrossRef] [Google Scholar]
- Occurrence, sources and environmental risk assessment of pharmaceuticals in the Sea of Marmara, Turkey. Sci. Total Environ.. 2022;819
- [CrossRef] [Google Scholar]
- Efficient detection and treatment of pharmaceutical contaminants to produce clean water for better health and environmental. J. Clean. Prod.. 2023;387:135798
- [CrossRef] [Google Scholar]
- Review of the characteristics and graded utilisation of coal gasification slag. Chinese J. Chem. Eng.. 2021;35:92-106.
- [CrossRef] [Google Scholar]
- Synthesis of ZSM-5 zeolite from fly ash and its adsorption of phenol, quinoline and indole in aqueous solution. Mater. Res. Express. 2020;7:55506.
- [CrossRef] [Google Scholar]
- Evaluation of CNT-COOH/MnO2/Fe3O4 nanocomposite for ibuprofen and paracetamol removal from aqueous solutions. J. Hazard. Mater.. 2021;403:123528
- [CrossRef] [Google Scholar]
- Enrichment and utilization of residual carbon from coal gasification slag: A review. Process Saf. Environ. Prot.. 2023;171:859-873.
- [CrossRef] [Google Scholar]
- Removal of triclosan, ibuprofen, amoxicillin and paracetamol using organic residues under a bibliometric-statistical analysis. Bioresour. Technol. Reports. 2023;23
- [CrossRef] [Google Scholar]
- Vortex-assisted dispersive molecularly imprinted polymer-based solid phase extraction of acetaminophen from water samples prior to hplc-dad determination. Separations. 2021;8
- [CrossRef] [Google Scholar]
- Spent tea waste extract as a green modifying agent of chitosan for aspirin adsorption: Fixed-bed column, modeling and toxicity studies. Int. J. Biol. Macromol.. 2023;253:126501
- [CrossRef] [Google Scholar]
- Overview of nanosorbents used in solid phase extraction techniques for the monitoring of emerging organic contaminants in water and wastewater samples. Trends Environ. Anal. Chem.. 2020;25
- [CrossRef] [Google Scholar]
- Toxicity of the Non-Steroidal Anti-Inflammatory Drugs (NSAIDs) acetylsalicylic acid, paracetamol, diclofenac, ibuprofen and naproxen towards freshwater invertebrates: A review. Sci. Total Environ.. 2020;740:140043
- [CrossRef] [Google Scholar]
- Analytical methodologies for the determination of pharmaceuticals and personal care products (PPCPs) in sewage sludge: A critical review. Anal. Chim. Acta. 2019;1083:19-40.
- [CrossRef] [Google Scholar]
- Treatment of wastewater containing nonsteroidal anti-inflammatory drugs using activated carbon material. Materials (Basel). 2022;15:1-10.
- [CrossRef] [Google Scholar]
- Exhaust emission control of SI engines using ZSM-5 zeolite supported bimetals as a catalyst synthesized from coal fly ash. Fuel. 2023;340:127380
- [CrossRef] [Google Scholar]
- Study on recovery of residual carbon from coal gasification fine slag and the influence of oxidation on its characteristics. Energy. 2023;279:128099
- [CrossRef] [Google Scholar]
- S, D.S., Vishwakarma, V., 2021. Recovery and recycle of wastewater contaminated with heavy metals using adsorbents incorporated from waste resources and nanomaterials-A review. Chemosphere 273, 129677. doi: 10.1016/j.chemosphere.2021.129677.
- Adsorption of ibuprofen from wastewater using activated carbon and graphene oxide embedded chitosan–pva: Equilibrium, kinetics, and thermodynamics and optimization with central composite design. Desalin. Water Treat.. 2020;179:396-417.
- [CrossRef] [Google Scholar]
- Thermochemical treatment of fly ash for synthesis of mesoporous activated carbon. J. Therm. Anal. Calorim.. 2015;122:1191-1201.
- [CrossRef] [Google Scholar]
- Method optimisation and application based on solid phase extraction of non steroidal anti-inflammatory drugs, antiretroviral drugs, and a lipid regulator from coastal areas of Durban, South Africa. SN Appl. Sci.. 2022;4
- [CrossRef] [Google Scholar]
- Singgih, M.F., Huldani, Achmad, H., Sukmana, B.I., Carmelita, A.B., Putra, A.P., Ramadhany, S., Putri, A.P., 2020. A review of nonsteroidal anti-inflammatory drugs (NSAIDs) medications in dentistry: Uses and side effects. Syst. Rev. Pharm. 11, 293–298. doi: 10.31838/srp.2020.5.43.
- Development of fruit waste derived bio-adsorbents for wastewater treatment: A review. J. Hazard. Mater.. 2021;416:125848
- [CrossRef] [Google Scholar]
- Enrichment of residual carbon in coal gasification fine slag via wet sieving separation with ultrasonic pretreatment. ACS Omega. 2022;7:40306-40315.
- [CrossRef] [Google Scholar]
- Response to letter to the editor on the paper “occurrence and environmental risks of nonsteroidal anti-inflammatory drugs in urban wastewater in the southwest monsoon region of India”. Environ. Monit. Assess.. 2020;192
- [CrossRef] [Google Scholar]
- Antibiotic residues in wastewaters from sewage treatment plants and pharmaceutical industries: Occurrence, removal and environmental impacts. Sci. Total Environ.. 2021;788:147811
- [CrossRef] [Google Scholar]
- Impact of prenatal acetaminophen exposure for hippocampal development disorder on mice. Mol. Neurobiol. 2023
- [CrossRef] [Google Scholar]
- Preparation of hierarchical porous activated carbons for high performance supercapacitors from coal gasification fine slag. J. Mater. Sci. Mater. Electron.. 2022;33:14722-14734.
- [CrossRef] [Google Scholar]
- Adsorption of trimethoprim and sulfamethoxazole using residual carbon from coal gasification slag: Behavior, mechanism and cost-benefit analysis. Fuel. 2023;348:128508
- [CrossRef] [Google Scholar]
- Yu, W., Zhang, H., Wang, X., Rahman, Z. ur, Shi, Z., Bai, Y., Wang, G., Chen, Y., Wang, J., Liu, L., 2022. Enrichment of residual carbon from coal gasification fine slag by spiral separator. J. Environ. Manage. 315, 115149. doi: 10.1016/j.jenvman.2022.115149.
- Synthesis and adsorption performance of ultra-low silica-to-alumina ratio and hierarchical porous ZSM-5 zeolites prepared from coal gasification fine slag. Chemosphere. 2022;303:134839
- [CrossRef] [Google Scholar]
- Preparation and application of porous materials from coal gasification slag for wastewater treatment: A review. Chemosphere. 2022;287:132227
- [CrossRef] [Google Scholar]
Appendix A
Supplementary material
Supplementary data to this article can be found online at https://doi.org/10.1016/j.arabjc.2024.105838.
Appendix A
Supplementary material
The following are the Supplementary data to this article:Supplementary Data 1
Supplementary Data 1


