

Translate this page into:
Valorization of pectic polysaccharides from Gardenia jasminoides Ellis flower: Physicochemical, structural, rheological, and functional properties
⁎Corresponding authors. yyzzhang2002@zafu.edu.cn (Youzuo Zhang), guangzhi@zafu.edu.cn (Guangzhi Xu)
-
Received: ,
Accepted: ,
This article was originally published by Elsevier and was migrated to Scientific Scholar after the change of Publisher.
Abstract
Gardenia jasminoides Ellis is a widely cultivated garden plant, but its flower resources are underutilized. In this study, three pectic polysaccharides extracted from Gardenia flowers (GFPPs) were obtained, including acid-extracted pectin (ACP), hot water-extracted pectin (HWP), and alkaline-extracted pectin (ALP). The physicochemical, structural, rheological, and functional properties of GFPPs were compared and analyzed. The results showed that the yield of all GFPPs exceeded 21%, and the proportion of the rhamnogalacturonan I (RG-I) regions ranged from 42.20% to 54.66%. The GFPPs were identified as low-methoxyl pectin with a semi-crystalline and amorphous structure. Among them, ACP had the highest molecular weight and neutral sugar content, while ALP had the highest content of galacturonic acid and protein. Rheologically, all three GFPPs exhibited pseudoplastic behavior with thixotropic properties, particularly ACP. Storage at low temperatures increased the apparent viscosity of ACP and HWP, while that of ALP was decreased. Importantly, emulsions prepared with 2% GFPPs and 10% medium-chain triglycerides remained stable at 4 °C and 25 °C for 21 days. Moreover, the ALP-based emulsion demonstrated excellent emulsifying capability, maintaining stability at 60 °C for 21 days with an emulsion appearance. These findings suggest that GFPPs hold promise as a pectin source for hydrocolloids and can be used in various food applications.
Keywords
Gardenia jasminoides Ellis
Physicochemical composition
Structural characterization
Rheological property
Emulsifying capacity

1 Introduction
Gardenia jasminoides Ellis (referred to as Gardenia) is an evergreen flowering plant of the family Rubiaceae, cultivated for more than 2,000 years. It originates from central China and has been widely cultivated in some Asian countries and regions because of its lush branches and leaves, pure white flowers, and strong aroma (Zhang et al., 2018). As a well-known edible medicinal plant, Gardenia is widely used in traditional medicines in China, Korea, and Japan (Chen et al., 2020a,b). Gardenia flowers (GFs) are traditionally used as landscape plants for people to watch. As well as its ornamental properties, GF was separately applied in traditional Chinese medicine for a variety of uses (Zhang et al., 2018). GFs have been used as a remedy for cough and epistaxis anxiolytic (Zhang et al., 2020a,b) and anti-inflammatory effects (Zhang et al., 2022), its flower is also used as an edible vegetable in folk China (Wang et al., 2017). The active ingredients in GF include flower essential oils, iridoids, and triterpenoids, which have shown anti-inflammatory, antibacterial, antioxidant, and anticancer properties (Ragasa et al., 2007, Zhang et al., 2017, Zhang et al., 2018, Zhang et al., 2022). However, compared with these reported bioactive components, other components in GF have received less attention, such as non-starch polysaccharides, and their chemical composition and functional properties are rarely reported.
Food textures present the complex interactions between different components in food matrices. It plays a crucial role in appealing to consumers in the formulation, production, and processing of food (Day and Golding 2016, Aguilera 2019). Hydrocolloids are high-molecular-weight (MW) hydrophilic polymers that form colloidal dispersions in water. It can greatly influence the structure and functionalities of modern foods via interactions with other components of food. In terms of market value, pectin is one of the most important hydrocolloids (Yang et al., 2020, Seisun and Zalesny 2021). As a family of heteropolysaccharides, pectin is found predominantly in the walls of terrestrial plants and serves as a hydrating agent and as a cementing agent for the cellulose network (Caffall and Mohnen 2009, Chan et al., 2017). It is constituted by polymers rich in D-galacturonic acid (GalA) and containing significant amounts of L-rhamnose (Rha), D-arabinose (Ara), and D-galactose (Gal), and 17 different monosaccharides along with these (Naqash et al., 2017, Neckebroeck et al., 2021). Recently, many natural emulsifiers like pectin are increasingly being reported and utilized. Pectin extracted from citrus and beet could stabilize emulsion through spatial and electrostatic interaction, hydrophobic groups, and so on (Verkempinck et al., 2018, Liu et al., 2019). Furthermore, pectin's bioactivity is also used in the biomedical field and pharmaceutical industry, such as tissue engineering, drug delivery, and wound healing (Dranca and Oroian 2018).
Presently, most studies focus on extracting pectin from the by-products of fruit and vegetable processing (Belkheiri et al., 2021). In most cases, commercial pectin is extracted from citrus peel and apple pomace, and synthetic commercial pectin has not been reported. Additionally, some plant-sourced pectins including Nicandra physalodes (Linn.) Gaertn., Premna microphylla turcz, and creeping fig, have attracted much attention (Yang et al., 2022a,b). Pectin from different plants has different structural characteristics (Dranca and Oroian 2018). In addition, the same pectin can be obtained by different extraction methods (Belkheiri et al., 2021, Chen et al., 2021a,b). Commonly, commercial pectin is produced by mineral acid extraction of apple pomace and citrus peel at pH 1–3, for 0.5–6 h with continuous stirring. However, organic acids are frequently used as pectin extractants due to environmental concerns (Dranca and Oroian 2018). Incidentally, organic acids are generally less destructive and produce less proton-catalyzed polymerization of pectin structures. Especially citric acid-extracted pectin showed higher MW and noticeable viscosity (Cho et al., 2019). Meanwhile, alkali extraction has also attracted increasing interest, partly due to the higher extraction rate, lower MW and esterification degree, and more importantly, the RG-I region to be retained (Wandee et al., 2019). Our previous study reveals that GF is rich in pectic polysaccharides (18%) and the obtained pectic polysaccharides exhibited a favorable antioxidant activity (Chen et al., 2020a,b). Based on the aforementioned reports, the extraction of pectin from GF by different extraction methods is effective and can improve the utilization of this resource.
In this study, three different extractants (citric acid, water, sodium hydroxide) were used to extract GF pectic polysaccharides. The physicochemical properties including chemical composition, MW, rheological properties, and emulsification, were systematically investigated. These results can provide foundational insights for the application of Gardenia flower pectic polysaccharide as an emulsifier or gelling agent in the food industry. This study aims to enrich the diversity of raw materials for pectin production and improve the comprehensive utilization of GFs.
2 Materials and methods
2.1 Materials and chemicals
Gardenia jasminoides var. fortuniana flowers were harvested from the campus of Zhejiang A&F University (Hangzhou, China) in June 2020. The fresh GFs were immediately boiled in 95% ethanol at 75 °C for 3 min to inactive endogenous pectin hydrolase. After drying in a hot air oven at 50 °C for 3 d, the flowers were milled and passed through a 200 mesh sieve (about 74 μm in diameter) to obtain a fine powder. The pigments, lipids, peptides, and other low-MW compounds of GF power were removed by washing with 80% ethanol overnight at room temperature three times. The resulting residues were dried at room temperature and stored at 4 °C.
Monosaccharide standards (galacturonic acid-GalA, glucose-Glc, glucuronic acid-GluA, mannose-Man, arabinose-Ara, rhamnose-Rha, xylose-Xyl, and galactose-Gal) were purchased from Tokyo Chemical Industry Development Co., Ltd (Tokyo, Japan). 1-pheny-3-methyl-5-pyrazolone (PMP) (99%) was purchased from Sigma-Aldrich Trading Co., Ltd (Shanghai, China). The analytical-pure reagents, including acetonitrile, chloroform, and methanol, were purchased from TEDIA Co., Ltd (Ohio, USA). All other chemical reagents used in this study were of analytical grade (Sinopharm Chemical Reagent Co., Ltd, Shanghai, China).
2.2 Pectin extraction
The GF pectic polysaccharide extraction process was conducted as follows: (1) Citric acid extraction (ACP): Deionized water was mixed with GF flour at a ratio of 30:1 (w/w), and the pH was adjusted to 2.0 with 1.0 M citric acid. The mixture was extracted at 70 °C for 90 min. (2) Hot water extraction (HWP): Deionized water was mixed with GF flour at a ratio of 30:1 (w/w) and extracted at 70 °C for 90 min. (3) Alkaline extraction (ALP): Deionized water was mixed with GF flour at a ratio of 30:1 (w/w), and the pH was adjusted to 12 with 1.0 M NaOH. The mixture was extracted at 70 °C for 90 min.
The extraction was carried out in a 1 L conical flask using a magnetic stirrer. After extraction, the mixture was cooled to room temperature (25 °C) and centrifuged at 9600g for 10 min at 4 °C (Wang et al., 2016a,b). The supernatant was collected and precipitated by adding three times the volume of 95% ethanol at 4 °C overnight. After centrifugation for 10 min, the GFPPs were redissolved in an appropriate volume of deionized water and dialyzed using a dialysis bag (8 kDa cut-off) with deionized water (replacement every 12 h) until the pH value was neutral. The obtained three pectins were then freeze-dried and stored at 4 °C.
The pectin yield was calculated by using the below equation:
2.3 Physicochemical properties
2.3.1 Analysis of protein content and monosaccharide composition
The protein content was determined by an automatic Kjeldahl instrument (Kjeltec 2300, Foss, Sweden). Monosaccharide composition was analyzed by a reversed-phase HPLC system (Chen et al., 2020a,b).
2.3.2 Metal element analysis
The metal elements in pectin were determined by Inductively Coupled Plasma Mass Spectrometry (ICP-MS 720ES, Agilent, USA). A total of 100 mg of pectin was mixed with 0.5 mL of 30% hydrogen peroxide solution and 4 mL nitric acid. After storing for 15 min at room temperature, pectins were digested with a Graphite digester (SH220N, Haineng Instrument Technology Co., Ltd, Yantai, China) according to the digestion procedure. The digested samples were diluted to 10 mL with ultrapure water and analyzed with ICP-MS720ES (Agilent, USA) under the following condition: plasma flow for 15.0 L/min, auxiliary flow for 1.50 L/min, and nebulizer flow for 0.75 L/min.
2.3.3 MW distribution
The MW distribution was carried out by using an Agilent high-performance gel permeation chromatography (HPGPC) system (Agilent infinity 1260, MO, USA) equipped with a refractive index detector (RI-201H) and analyzed with PL aqua gel-OH Mixed column (7.5 × 300 mm, Agilent, USA). The sample solution (1 mg/mL) was filtered through a 0.45 μm membrane filter and injected into the column through a 100 μL loop. The mobile phase was 0.1 M NaNO3 and 0.05% NaN3 with a flow rate of 1 mL/min at 30 °C. A standard curve was established by calibrating the column with PEO (polyethylene oxide) standards.
2.4 Preliminary structural characterization
2.4.1 FT-IR (Fourier transform infrared spectroscopy) and esterification analysis
The structural characteristics of extracted samples were investigated using an FT-IR spectrometer (Thermo Scientific Nicolet 10, USA) (Muñoz-Almagro et al., 2021). Sample powders were dried at 105 °C for 6 h, mixed with KBr powder (1:100, w/w), and compressed into a pellet using a hydraulic press. Next, samples were scanned 32 times at a frequency range of 4000–400 cm−1 with a resolution of 4 cm−1. The resultant spectra were smoothed to remove the noise. After spectral baseline correction and peak intensity normalization, the degree of methylation (DM) of pectin was calculated in accordance with the following equations (Morales-Contreras et al., 2020).
2.4.2 X-ray diffraction (XRD) analysis
The X-ray diffraction (XRD) pattern was performed by using an X-ray Cu Ka radiation diffractometer (Smartlab 9kw, Japan). The pectin powder was scanned with a diffraction angle (2θ) from 5° to 90° (0.02° angle gradient).
2.4.3 NMR (Nuclear magnetic resonance) analysis
1H NMR spectra of samples were conducted using a Bruker 600 MHz NMR spectrometer (Bruker, Rheinstetten, Germany). Briefly, 10 mg of constant-weight sample was dissolved into 1 mL of 99.98% D2O, and then the 1H NMR spectrum was recorded.
2.4.4 Scanning electron microscopy (SEM) analysis
The surface morphology of the sample was observed by scanning electron microscope (Zeiss Sigma 300, UK). The sample was fixed and coated with gold under vacuum conditions. The surface morphology was photographed with an accelerating voltage of 4 kV and magnification of 20,000× and 200×.
2.5 Rheological properties
All rheological measurements were carried out on a DHR-1 rheometer (TA Instruments, USA) with a peltier system (Feng et al., 2019). The parallel plate geometry (40 mm diameter, 1000 μm gap) was used for both steady shear, oscillatory tests, and thixotropy. The experimental rheological data were obtained directly from the TA Rheology data analysis software.
2.5.1 Apparent viscosity
Samples were dissolved in deionized water at room temperature with magnetic stirring for 12 h. The sample solution was subjected to steady shearing at 25 °C soak time 60 s, the shear rates ranged from 0.1 s−1 to 100 s−1. Besides, emulsion and freeze–thaw variation on the apparent viscosity were also investigated at the same shear rate. Silicone oil (viscosity: 20mpa.s) was employed in the exposed sample edge to prevent water loss.
2.5.2 Viscoelasticity characterization
Viscoelastic properties were investigated by the frequency and temperature sweep. Firstly, vibration sweeps were performed under a strain range of 0.01–1000% at 1 Hz (25 °C) to determine the linear viscoelastic region. Thereafter, the frequency sweeps of pectin and emulsion were carried out at 25 °C in the frequency range of 0.1–100 Hz within the linear viscoelastic region (1.0% strain). Secondly, temperature sweeps were performed at a frequency of 1 Hz and strain of 1.0% with heating (20–100 °C) and subsequent cooling (100–20 °C) at a rate of 5 °C/min. Silicone oil (20 MPa.s) was employed in the exposed sample edge to prevent water loss.
2.5.3 Thixotropic property
The relationship between shear stress and shear rate can be used to determine thixotropic effects (Mierczynska et al., 2017). The apparent viscosity curves were recorded by increasing the shear rate from 1 s−1 to 100 s−1 and then decreasing from 100 to 1 s−1. A closed changing curve was used to represent the formed thixotropy area. The closed area was calculated with the rheometer software (TA Instruments Trios v5.0).
2.6 Emulsifying properties
2.6.1 Preparation of emulsion and emulsifying capability
The sample was dispersed in water (2% final concentration) and hydrated for 12 h, with 0.1% sodium benzoate as a preservative. MCT oil was absorbed with a syringe and stirred with a magnetic stirrer for 2 min (1800 rpm) to make a crude emulsion. MCT oil was added during stirring. The final concentration of MCT was 10%, and the crude emulsion was homogenized by a homogenizer for 2 min to fully integrate the oil and pectin solution, and the emulsion was completed.
The emulsion stability (ES) of samples was analyzed by a reported method (Liu et al., 2019). The emulsion was heated at 80 °C for 30 min, cooled in a water bath for 20 min, and then centrifuged at 2516g for 15 min. The emulsifying activity (EA) was assessed from the particle size, which was detected by a dynamic light scattering device (Zetasizer Nano ZS, Malvern Instruments, Malvern, England). Each emulsion was diluted 500 times with ultrapure water to avoid multiple scattering effects (Wandee et al., 2019).
2.6.2 Emulsion storage stability
The prepared emulsion was stored at 4, 25, and 60 °C for 21 d, and the photos before storage and day 21 of storage were taken with a digital camera, and the height of the layer was measured. The average particle size was measured once a week.
2.7 Statistical analysis
All statistical experiments were performed in three replicas. The statistics were analyzed by variance (ANOVA) using SPSS software (Version 19.0) and represented as mean ± SD. The difference was considered to be statistically significant when p<0.05. Figures were plotted by Origin software (Version 2018).
3 Results and discussion
3.1 Preliminary chemical composition
As shown in Table 1, the yield of HWP was 21 ± 0.57%, slightly higher than the yield we reported previously (18.04 ± 1.81%) (Chen et al., 2020a,b). Moreover, the yield of ALP was highest (25 ± 1.88%), following the research on grapefruit peel pectin, i.e., alkaline extraction was significantly more efficient than acid extraction for preparing pectin polysaccharides (Wandee et al., 2019). Reasonably, the alkaline extraction environment could destroy the cross-linked polymer network structure between pectin and cellulose and hemicellulose, contributing to the pectin release from the cell wall (Broxterman and Schols 2018, Cui et al., 2020a,b). The yield of GCFFs obtained was significantly higher than that of pectin extracted from apple pomace (19.8%) (Wikiera et al., 2016) and pectin from Althaea officinalis L. flower (9.0%) (Tabarsa et al., 2017). In addition to the yield, different extraction also affected the protein content of GFPPs. Protein content in ALP was highest (3.11 + 0.01%, Table 1) and that in ACP was lowest (1.36 ± 0.02%, Table 1), which could be due to the protein denaturation under acidic conditions (Cui et al., 2020a,b). Studies have shown that the protein content is proposed as one of the important structural elements for the emulsifying capacity of pectin (Alba and Kontogiorgos 2017, Du et al., 2021). The proteinaceous moieties of pectin can act as hydrophobic anchors and facilitate the reduction of interfacial tension. Therefore, ALP with the highest protein content might exhibit better emulsification (Du et al., 2021). Since the composition and amount of mineral elements in pectin could affect its rheology and emulsion stability through electrostatic stabilization (Pi et al., 2019), the primary mineral composition of three GFPPs was determined (Table 1). As can be seen, Ca was the prominent mineral in GFPPs with the range of 3.35 ± 0.08– ∼ 5.63 ± 0.12 mg/g. Notably, the content of Ca was comparable with that of pectin from peach, blackcurrant, raspberry, strawberry, plum, carrot (Mierczynska et al., 2017) and fruit seeds of the creeping fig (Chen et al., 2021a,b). Interestingly, K in ALP and HWP was up to 15.38 ± 0.13 mg/g and 8.89 ± 0.01 mg/g, respectively, which was much higher than that of ACP (0.81 ± 0.08 mg/g). This might be due to the strong metal ion chelating capability of citric acid (Reichembach et al., 2021). Compared with Ca and K, the relative contents of Fe, Mg, and Na were lower. The superscript letters of different values indicate that there are significant differences among the three groups of values in each line (p<0.05).
Category
ACP
ALP
HWP
Yield* (%)
23.00 ± 1.24ab
25.00 ± 1.88b
21.00 ± 0.57a
Protein (%)
1.36 ± 0.02c
3.11 + 0.01a
2.41 ± 0.12b
Degree of methylation (%)
42.73 ± 1.64a
42.40 ± 3.47a
46.54 ± 2.13a
Metal element (mg/g)
Ca
5.63 ± 0.12c
3.70 ± 0.07b
3.35 ± 0.08a
Fe
0.03 ± 0.01a
0.05 ± 0.00b
0.06 ± 0.01b
K
0.81 ± 0.08a
15.38 ± 0.13c
8.89 ± 0.01b
Mg
0.77 ± 0.01b
0.81 ± 0.04b
0.60 ± 0.01a
Na
0.31 ± 0.03a
4.23 ± 0.08c
0.49 ± 0.02b
3.2 Monosaccharide composition
The monosaccharide composition of GFPPs was shown in Table 2 and Fig. S1. All three GFPPs were composed of eight monosaccharides, namely mannose (Man), rhamnose (Rha), glucuronic acid (GlcA), glucose (Glc), galacturonic acid (GalA), galactose (Gal), xylose (Xyl), and arabinose (Ara). Similar to other pectins, the GalA proportion in GFPPs was the highest, ranging from 40.96 ± 0.02 to 52.73 ± 0.16 mol%. Additionally, ACP had a lower GalA content (40.96 ± 0.02 mol%) than that of ALP (50.49 ± 0.14 mol%) and HWP (52.73 ± 0.16 mol%). Interestingly, the GalA content in GFPPs was comparable with that of pectin from blueberry wine pomace (44.14 mol%) (Feng et al., 2019), Campomanesia xanthocarpa Berg (32.5%) (Barbieri et al., 2019) and Gardenia jasminoides J. Ellis (41.05 ± 0.59%) (Chen et al., 2020a,b), but lower than the quality standard of pectin following FAO and EU regulations (GalA content ≥65%) (Reichembach and Lúcia de Oliveira Petkowicz 2021). Moreover, all GFPPs had high total neutral monosaccharides (46.98 ± 0.49–59.33 ± 0.97%). Among them, Gal was dominant, followed by Ara, Glc, and Rha. Small amount of GlcA, Xyl, and Man also was presented in three GFPPs. The detected Glc (4.65 ± 0.02–6.34 ± 0.21%) could indicate that the extracted GFPPs contained other glucose-containing polymers, such as hemicelluloses and cellulose (Chen et al., 2020a,b). Notably, the monosaccharide composition of GFPPs, i.e., the alkaline-soluble pectin had a higher GalA content and lower Gal and Ara content than that of acid-soluble pectin, was inconsistent with many reported results, which could be partly due to the unstable property of the linkages between GalA units in alkaline condition (Cui et al., 2021). This result could be demonstrated by a report on the monosaccharide composition of pectin obtained from tea leaves (Zhang et al., 2020a,b). Considering the diverse structure of pectin (Mzoughi and Majdoub 2021), it is not surprising that extractants have different effects on the monosaccharide composition of pectins. GalA and GalA-Rha units constitute the backbone of the HG and RG-I region of pectin, respectively, while Ara and Gal are the main neutral monosaccharides (NMs) of side chains of the RG-I region (Chan et al., 2017). The GalA/Rha ratio is applied to identify the structure type of pectin (Wang et al., 2020). The (Gal + Ara)/Rha ratio is usually used to indicate the number of NM residues attached to the RG-I backbone (Wang et al., 2020). As shown in Table 2, All GFPPs had a GalA/Rha ratio greater than 0.05, indicating they contained HG and RG-I groups (Wang et al., 2020). The Gal + Ara)/Rha ratio of ACP, ALP, and HWP was 15.68 ± 0.53, 12.52 ± 0.12, and 13.08 ± 0.14, respectively, indicating that they all had long side chains. The HG and RG-I regions of pectin were further calculated as the molar amount of GalA-Rha and 2Rha + Ara + Gal, respectively (Caffall and Mohnen 2009). As shown in Table 2, all of GFPPs had a considerable content of RG-I region. In addition, the content of RG-I region in ACP was the highest (54.66 ± 1.00%), and the content of HG was the lowest (37.82 ± 0.19%), indicating that pectin extracted by citric acid had more “hairy regions” structure. Increasing the number of branches on the main chain and the number of side chains can give more sites for bonding chains and intermolecular interaction through hydrogen bonds and hydrophobic interactions, contributing to the an improved viscosity and viscoelasticity for pectins (Yuliarti and Mardyiah Binte Othman, 2018, Slavov et al., 2020). The superscript letters of different values indicate that there are significant differences among the three groups of values in each line (p < 0.05).
Monosaccharides (mol%)
ACP
HWP
ALP
Mannose (Man)
0.40 ± 0.00a
0.64 ± 0.01b
0.66 ± 0.00c
Rhamnose (Rha)
3.09 ± 0.13a
2.80 ± 0.04b
3.11 ± 0.05a
Glucuronic acid (GlcA)
0.38 ± 0.01a
0.48 ± 0.01b
0.48 ± 0.01b
Glucose (Glc)
6.34 ± 0.21c
5.61 ± 0.08b
4.65 ± 0.02a
Galacturonic acid (GalA)
40.96 ± 0.02a
52.73 ± 0.16c
50.49 ± 0.14b
Galactose (Gal)
29.39 ± 0.52b
23.39 ± 0.33a
23.98 ± 0.22a
Xylose (Xyl)
1.03 ± 0.01a
1.33 ± 0.03b
1.40 ± 0.00c
Arabinose (Ara)
19.08 ± 0.27c
13.21 ± 0.03c
15.01 ± 0.13b
NM#
59.33 ± 0.97c
46.98 ± 0.49a
48.80 ± 0.38b
Rha/GalA
0.076 ± 0.003c
0.053 ± 0.009a
0.062 ± 0.003b
(Gal + Ara)/Rha
15.68 ± 0.53b
13.08 ± 0.14a
12.52 ± 0.12a
HG*
37.82 ± 0.19a
49.94 ± 0.19c
47.37 ± 0.19b
RG-I&
54.66 ± 1.00c
42.20 ± 0.41a
45.22 ± 0.44b
3.3 MW distribution
MW is an indispensable factor in investigating the structure–function nexus of polysaccharides (Zhu et al., 2021, Zhu et al., 2022). The MW distribution analysis (Fig. 1A, B) showed that the MWs of ACP, ALP, and HWP were all relatively homogeneous, with a wide MW distribution range (Table 3). Specifically, ACP (597 ± 36 kDa) and HWP (540 ± 24 kDa) displayed a relatively higher MW than that of ALP (192 ± 10 kDa). However, their PDIs did not show significant differences, suggesting that different extractants had limited effects on the MW distribution of GFPPs. Comparatively, ACP's higher MW might be due to better preservation of its side chain structure during acid extraction (Zhang et al., 2021). On the contrary, the glycosidic bond adjacent to the methoxylated GalA unit was easily broken by β-elimination reaction under alkaline conditions, thus making the pectin easy to hydrolyze (Wandee et al., 2019, Cui et al., 2021). High MW is a promising property for pectin which was proposed to facilitate the formation of gel with high viscosity and conducive to the long-term stability of emulsion (Ngouémazong et al., 2015, Yang et al., 2022a,b). Different letters represent a significant difference among multiple groups (p < 0.05). Mw, weight-average MW; Mn, number-average MW; and PDI, polydispersity index.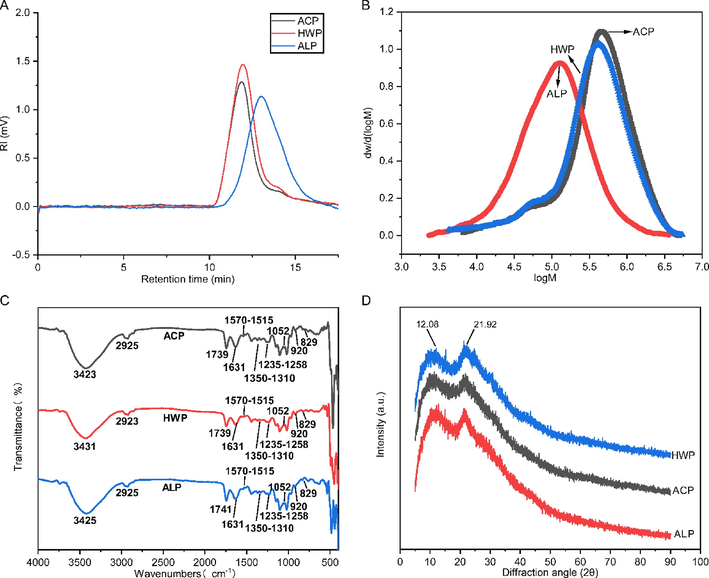
HPGPC chromatography (A), molecular weight distribution (B), FT-IR spectra, and XRD (D) analysis of ACP, HWP, and ALP.
Category
ACP
ALP
HWP
Mw (kDa)
597 ± 36b
192 ± 10a
540 ± 24b
Mn (kDa)
155 ± 20b
53 ± 4a
162 ± 54b
PDI (Mw/Mn)
3.87 ± 0.31a
3.63 ± 0.47a
3.55 ± 1.0a
3.4 Structure characterization
3.4.1 FT-IR analysis
FT-IR spectra of GFPPs in the range of 4000–500 cm−1 (Fig. 1C) were analyzed further to gain an insight into structural information by functional group. The result showed that all extracted GFPPs had similar spectra. The intense and wide absorption peaks near 3400 cm−1 were associated with the OH stretching, which mainly arose from the hydrogen bonding of glucopyranose hydroxyl groups (Zhu et al., 2019). The weak peak in appropriately 2900 cm−1 was attributed to the aliphatic CH absorption, including the stretching and bending vibration of CH2 and CH3 (Zhu et al., 2020a,b). The peak at around 1739 cm−1 and 1632 cm−1 was due to C⚌O stretching vibration of methyl esterified carboxyl groups (C⚌O) and C⚌O stretching vibration of carboxylate ion(COO–) (Chen et al., 2020a,b). The DM of pectin can be quantified by the peak area of corresponding functional groups (Manrique and Lajolo 2002). As a result, the calculated DMs for ACP, ALP, and HMP were 42.73, 42.40, and 46.54%, respectively, indicating that they belonged to LMP (Chen et al., 2020a,b). Commercial pectin primarily extracted from low-cost sources, such as citrus peel and apple pomace, is mainly in the form of high-methoxyl pectin (HMP). HMP typically requires a deesterification process to convert it into low-methoxyl pectin (LMP) (Wan et al., 2019). The currently obtained GFPPs belong to LMP, and their prepared methods are both cost-effective and environmentally friendly. Additionally, a particular focus was placed on the absorption bands associated with proteinaceous materials. The peak in the range of 1350–1310 cm−1 was assigned to the stretching of amide III band C—N (Zhu et al., 2020a,b), and the peak at 1570–1515 cm−1 was attributed to the N—H bending in the protein of amide II band (Wang et al., 2021). The result indicated that the proteinaceous materials in GFPPs might be cross-linked with pectin via covalent bonds (Yang et al., 2019). The region from 1250 to 800 cm−1 was proposed to be characteristic fingerprint regions of pectin. The weak bands in the range of 1235–1258 cm−1 for ACP, ALP, and HAP were due to the stretching vibration of C—O in the ester or carboxyl groups, indicating the presence of uronic acids (Ji et al., 2020). The peak at 1052 cm−1 indicated the presence of Ara (Coimbra et al., 1998). Moreover, the peak at 920 cm−1 was regarded as the absorption of D-glucopyranosyl, and 829 cm−1 was the absorption of α-D-mannopyranose (Lin et al., 2021).
3.4.2 NMR and XRD analysis
1H NMR spectrum is mainly used to reflect the configuration information of glycosidic bonds. Generally, those with a chemical shift value greater than δ 4.95 ppm are α-type glycosides, otherwise they are β-type (Zhu et al., 2020a,b). The signal intensity of methyl ester (COOCH3) and 6-position deoxysugar methyl proton is δ 3.0–3.8 and 0.8–1.4, respectively (Yang et al., 2022a,b). As shown in Fig. 2, a strong and sharp signal at 3.75 ppm was derived from methyl groups binding to carboxyl groups of GalA, and a weak signal at 1.17/1.18 or 1.25/1.26/1.27 ppm was ascribed to the 6-position deoxysugar methyl proton (Yang et al., 2022a,b). Further, five primary signals of pectin, including 5.01 ppm (H-1), 3.63 ppm (H-2), 3.92 ppm (H-3), 4.05 ppm (H-4), and 4.38 ppm (H-5), were assigned as esterified D-GalA as reported by Yang et al. (Yang et al., 2022a,b). Notably, an extremely weak signal at 4.88 ppm (H-1) was presented, suggesting the three GFPPs might also contain a small amount of β-type glycosidic bonds. The chemical shift of H-1 of three GFPPs indicated that the anomeric hydrogen configuration of D-galacturonic acid remained intact (Wang et al., 2016a,b).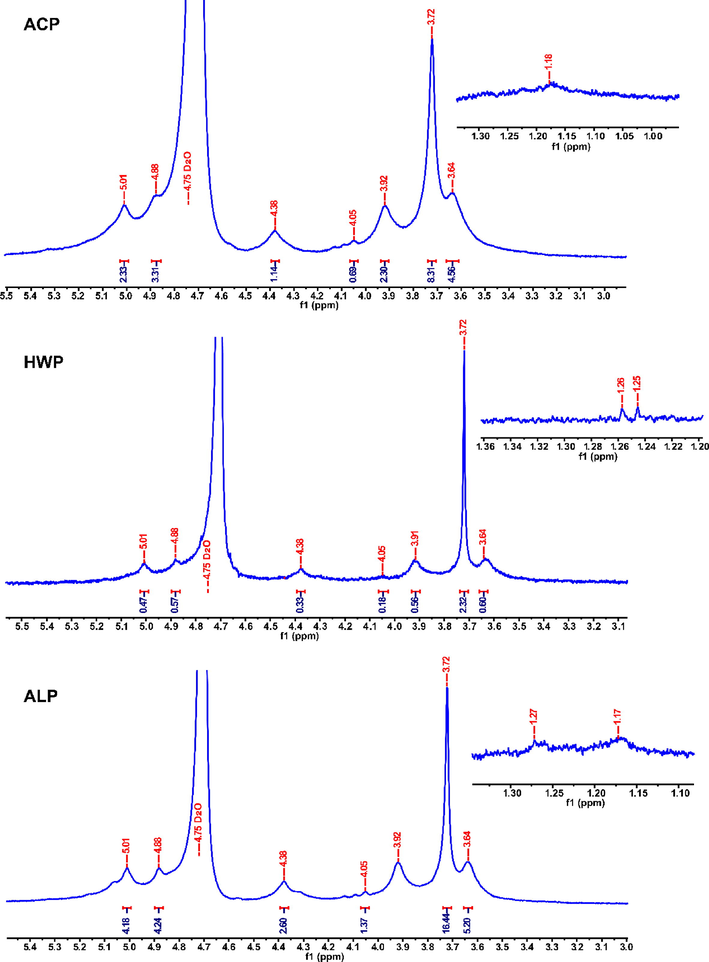
1H NMR spectra of ACP, HWP, and ALP.
X-ray diffraction can be used to characterize the crystalline structure (crystalline or amorphous) of polysaccharides. As shown in Fig. 1D, three GFPPs had two obvious characteristic diffraction peaks at around 12.10° and 21.90°, indicating that they had a mixed structure of semi-crystalline and amorphous (Guo et al., 2021).
3.4.3 Surface morphological characteristics
A scanning electron micrograph (SEM) was applied to observe the surface morphology of three GFPPs (Fig. 3). After magnifying of 20,000× (Fig. 3A), ALP had the thinnest cross-section, but three GFPPs exhibited a curly sheet shape. Additionally, ALP showed a loose structure with more voids, while ACP pectin had a smooth surface with fewer voids (Fig. 3B, C). Generally, pectin with porous and wrinkled surfaces had better solubility than pectin with a layered structure. Meanwhile, a smoother layered structure contributed to the better gel strength of pectin, which might be related to the increase of pectin-bearing area on the smooth surface (Cui et al., 2020a,b). Smooth surfaces allow pectin to withstand more uniform forces and help pectin resist deformation (Zhang et al., 2021).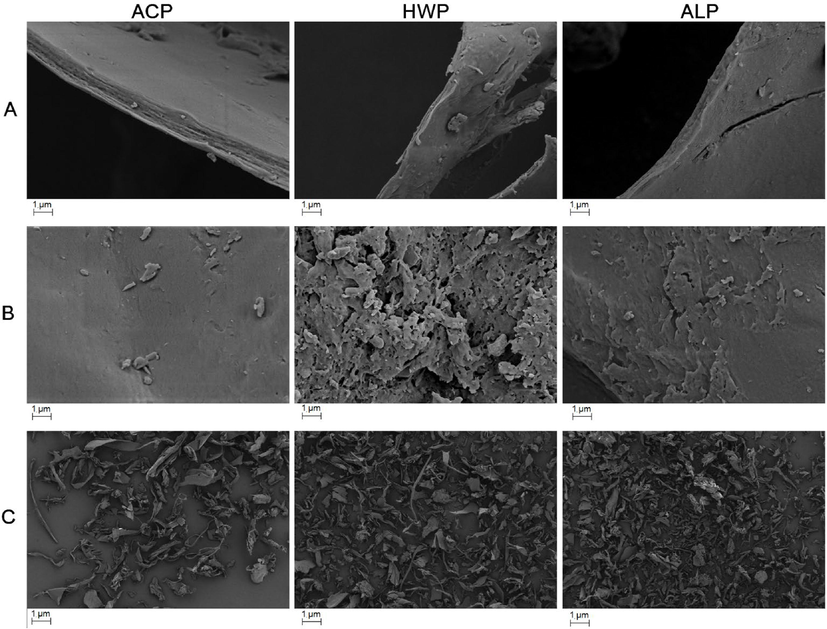
SEM images of under 20,000× (A, B) and 200× (C).
3.5 Rheological analysis
3.5.1 Apparent viscosity analysis
The apparent viscosity of different concentrations (1, 2, 4, and 5% w/v) of GFPPs was investigated under the shear rate range from 0.1 to 10 00 s−1. As shown in Fig. 4A, all GFPPs showed a drop of apparent viscosity along with the shear rate increasing, and their rheological behavior exhibited a pseudo-plasticity like other pectins. With the concentration raising, the apparent viscosity increased enhanced the shear-thinning behavior of the pectin solution, which was mainly attributed to the decrease of the inter-entanglement of macromolecular chains along with the increased shear rate (Li et al., 2020). In addition, some molecules easily reoriented with the flow direction also led to a significant decrease in apparent viscosity (Zhou et al., 2021). Meanwhile, the apparent viscosity of ACP was significantly greater than that of HWP and ALP, which might be partially due to its larger MW and higher RG-I content (Chan et al., 2017, Yang et al., 2020).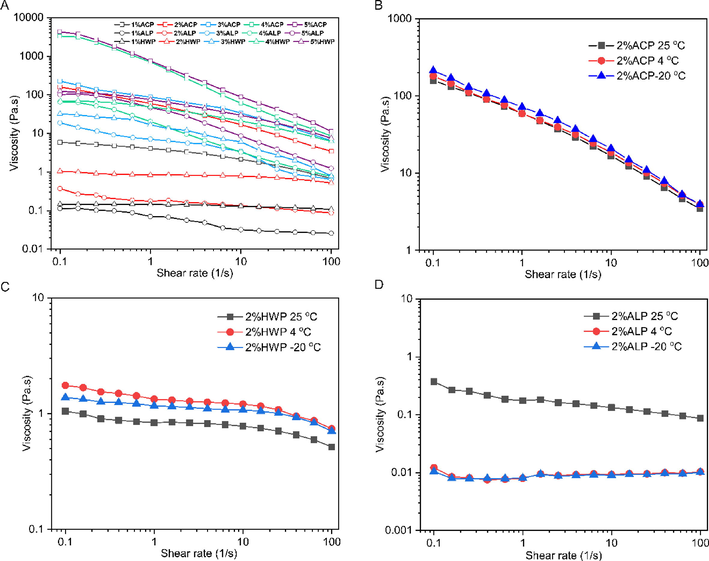
Steady shear flow curves of different GFPP solutions (A), freeze–thaw temperature variation curves of ACP (B), HWP (C), and ALP (D).
The freeze–thaw property of polysaccharides is a vital parameter for its application in cold chain storage food. The prepared GFPP solution (2%, w/v) was stored at −20 °C, 4 °C, and 25 °C, respectively, for 24 h. After equilibrium at room temperature for 6 h, the apparent viscosity was measured. As illustrated in Fig. 4B–D, the apparent viscosity of ACP was not influenced by the freeze–thaw temperature variation (Fig. 4B), while the apparent viscosity of HWP was dramatically improved after freeze–thaw temperature cycle at 4 °C and −20 °C (Fig. 4C). This observation was consistent with the results of the freeze–thaw temperature variation of a polysaccharide from Mesona chinensis the syneresis (Lin et al., 2018). By contrast, the apparent viscosity of ALP was compromised by the freeze–thaw cycle compared with that of the control (Fig. 4D). It is well known that the change of apparent viscosity reflects the interaction variation of polysaccharide solution between macromolecular-macromolecule or macromolecule-water (Pongsawatmanit and Srijunthongsiri, 2008). The low-temperature storage might promote entanglement and incomplete thawing for macromolecules, thus increasing apparent viscosity (Lin et al., 2018). On the other hand, low temperatures might also be conducive to the rearrangement of hydrophobic structures of macromolecules (Zhao et al., 2020, Xie et al., 2022), thereby weakening their interaction. The structural difference of GFPPs leads to the variation of macromolecular interactions at low temperatures, which may be the reason for the apparent rheological difference of pectin with different extractants.
3.5.2 Thixotropy property analysis
Thixotropy, as one of the critical rheological properties of a non-Newtonian fluid, is defined as a rheological phenomenon in which the apparent viscosity decreases under shear stress, followed by a gradual recovery when the stress is removed (Zhao et al., 2020). The hydrocolloids with thixotropic properties are desired for their application in some foods, such as mayonnaise, and ice cream, which need flow during processing but should stiffen afterward (Zhao et al., 2020).
Hysteresis loop can be used to investigate the thixotropy, in which symmetry of up- and down-curves can be achieved with the shear rate “upward” and “downward”, and the area enclosed by the up- and down-curve is referred to as hysteresis loop (Wei et al., 2015, Alghooneh et al., 2018). The thixotropy of GFPPs was investigated by using the hysteresis loop method (Wei et al., 2015), and the result was presented in Fig. 5. All GFPPs showed hysteresis loops at a concentration of 4% and 5% (w/v), and ACP had the largest hysteresis loop area (Fig. 5A), followed by that of ALP (Fig. 5B). By contrast, the hysteresis loop of HWP was simply presented until the concentration up to 5% (w/v), but with less area (Fig. 5C). This result indicated that GFPP solutions exhibited the thixotropic behavior in a concentration-dependent manner, which could be attributed to the disentanglement–entanglement processes and the alignment of the polymer chains with corresponding to the direction of shear (Wei et al., 2015, Alghooneh et al., 2018). Thixotropy requires a microstructure that can be reversibly altered by moderate stresses, and significant viscosity changes are induced in such a manner (Alghooneh et al., 2018). The presence of a thixotropic effect might also indicate the complex structure of the materials (Mierczynska et al., 2017). The pectin extracted from citric acid usually has a high MW and apparent viscosity (Cho et al., 2019). It was reported that the pectin-enriched fractions from peach, blackcurrant, raspberry, strawberry, plum, and carrot extracted by citric acid also displayed thixotropic properties (Mierczynska et al., 2017). Our results showed that GFPP extracted by citric acid had excellent thixotropic properties, indicating a preferential application in food processing.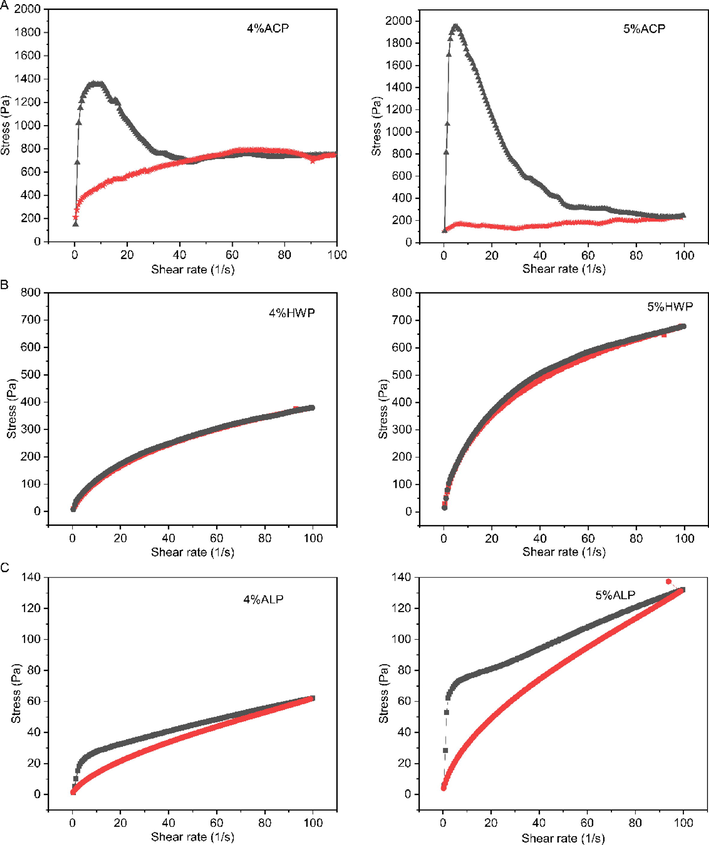
Thixotropic characteristics of ACP (A), HWP (B), and ALP (C) at different concentrations.
3.5.3 Viscoelastic property analysis
Viscoelastic properties of GFPPs were investigated by the frequency and temperature sweep. The storage modulus (G′) and the loss modulus (G″) reflected the elastic and viscous character of viscoelastic material, respectively, whereas the damping factor (tan δ, G″/G) was used as an index to determine the predominance of solid or liquid character. As shown in Fig. 6A, the storage modulus (G′) and loss modulus (G″) of GFPPs were increased with the frequency increasing in a dose-dependent manner. Specifically, the storage modulus (G′) of ACP was always greater than the loss modulus (G″) with the damping factor (tan δ, G″/G′) values between 0.1 and 1.0, indicating its “weak gel” properties (Lin et al., 2018). As for HWP, the storage modulus (G′) was lower than that of the loss modulus (G″) in low frequency (nearly 10 Hz), the G″ and G′ cross-over could be observed, and G′ surpassed G″ at a frequency higher than appropriately 15 Hz, indicating an observed viscous characteristic of HWP (Wang et al., 2018). Although the storage modulus (G′) and loss modulus (G″) of ACP were complex, it had an observed elastic property at 0.1–2.51 Hz, a viscous property at 2.51–39.81 Hz, and an elastic property at 39.81–100 Hz. The viscoelastic property of ALP showed no regularity and was similar to a mechanical characteristic of pectin from Cerasus humilis (Zhang et al., 2021).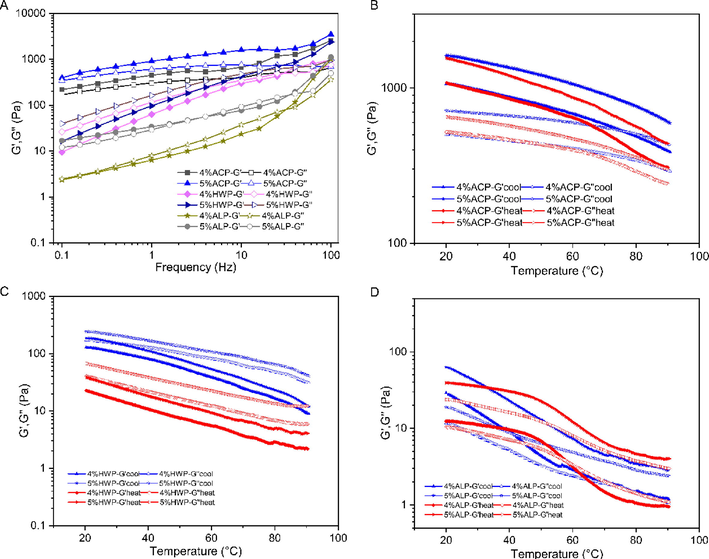
Viscoelastic properties of different concentrations of GFPPs in frequency sweep (A) and temperature sweep (B-D, B-ACP, C-HWP, and D-ALP), temperature blue (cooling): 90–20 °C; red (heating): 20–90 °C.
In order to evaluate the thermo-mechanical structural characteristics of GFPPs, temperature sweeps were carried out and the results were shown in Fig. 6B–D. The G′ and G″ of all GFPPs were decreased during heating and were increased during cooling regardless of the concentration. The storage modulus (G′) of ACP was dominant in either heating or cooling process (Fig. 6B). In contrast, the storage modulus (G′) of HWP was less than the loss modulus (G″), presenting a fluidic character (Fig. 6C). As for ALP, G′ was higher than G″ in cooling and gel point was observed at two moduli of 4% ALP at 58.33 °C in the heating scan, which indicated that the system underwent phase transition and changed from elastic to adhesive characteristics (Fig. 6D). In addition, the storage modulus (G′) of 5% ALP was higher than the loss modulus (G″), and the modulus of ALP temperature change was consistent with the result of frequency sweep, which was embodied as elastic property from 0.1 to 2.51 Hz before frequency sweep. As a result, 5% ALP had better stability between 20 °C and 90 °C. For 4% or 5% ACP, its G′′ was always dominant whether heating or cooling. Numerous studies have shown that the side chains of pectin molecules further tighten their network structure through entanglement and topological constraints at high concentrations (Feng et al., 2019, Lin et al., 2021). More side chains and short chain structures in ACP (Table 2) provide stable structural support during heating and cooling.
3.6 Emulsifying property analysis
3.6.1 Emulsifying capability and emulsifying stability
In order to evaluate the emulsifying property of GFPPs, different concentrations (1.5, 2.0, and 2.5% w/v) of samples were mixed with 10% (w/v) of MCT to prepare the emulsion, and their average particle size and emulsification stability were examined. As shown in Fig. 7A, the average particle size of all GFPP emulsions was in the range of 1–3 μm. Among them, the emulsion prepared with ALP had the smallest average particle size (appropriately 1 μm), followed by that of ACP and HWP, implying that ALP might have the strongest emulsifying capability. The emulsifying function of pectin can be influenced by its structural properties, including the extraction method used and the presence of hydrophobic groups. Pectin extracted by different methods may have variations in its structural properties, leading to differences in emulsifying ability. In the case of ALP, its high emulsifying ability can be mainly attributed to its high protein content and small-MW distribution. Wang et al. found that the lower-MW pectin after sonication showed better emulsifying properties (Wang et al., 2016a,b). Furthermore, studies have indicated that pectin polysaccharides with an MW between 100 × 103 g mol−1 and 200 × 103 g mol−1 are more favorable for emulsification and can provide long-term stability (Alba and Kontogiorgos 2017). The small MW of ALP resulted in lower interfacial tension, resulting in smaller droplets and higher emulsifying capacity. As for protein content, Funami et al. discovered that removing proteins from pectin molecules using protease resulted in a significant increase in emulsion particle size and a decline in stability, indicating the crucial role of protein in pectin's emulsification process (Funami et al., 2007). The protein attached to pectin can quickly adsorb on the surface of oil droplets and form a viscoelastic film to prevent oil droplets from focusing (Niu et al., 2022). As expected, the average particle size of emulsions also decreased with the increase in pectin concentration. The larger average particle size caused by a high concentration of pectin might be related to the higher protein content contained in the sample.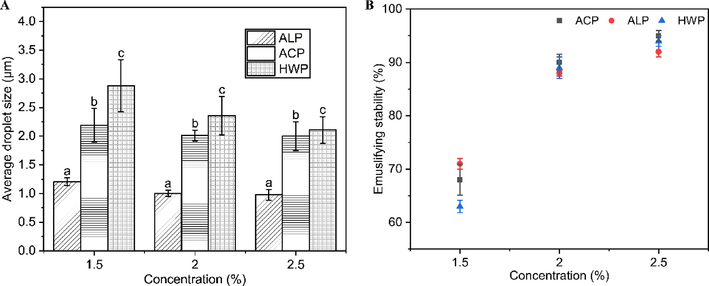
Emulsifying capability and emulsifying stability of GFPPs. A. Average particle size of emulsions; B. Emulsion stability.
The stability of GFPP emulsions was further evaluated by incubating at 80 °C for 30 min. As shown in Fig. 7B, the emulsification stability exhibited a positively correlated with the concentration. The emulsification stability was increased from 60–70 to 90% along with the concentration from 1.5 to 2.5%, while the emulsification stability of GFPPs did not show a significant difference. Since the emulsification stability of GFPPs was about 90% at a concentration of 2%, the concentration of 2% was selected for subsequent experiments.
3.6.2 Rheological properties of emulsion
In order to gain an insight into the emulsifying mechanism of GFPPs, the apparent viscosity and viscoelasticity properties of sample emulsions were assessed at the concentration of 2%. As presented in Fig. 8A, the emulsification resulted in a significant increase in the apparent viscosity of ALP and HWP, with almost 100 times larger than pure solutions at a stress rate of 0.1 s−1. In contrast, the emulsifying could only slightly increase the apparent viscosity of ACP. The strong shear stress for emulsion preparation might lead to the rearrangement of droplets, which not only magnified the steric hindrance between emulsion droplets but also increased the intermolecular friction of pectin, increasing viscosity. This result was also consistent with that of pomegranate pectin (Yang et al., 2018) and persimmon pectin (Jia et al., 2022). Usually, increasing the viscosity of the continuous phase is one of the primary methods to enhance the stability of the emulsion (Yang et al., 2018), and higher viscosity can give the emulsions better stability (Jiang et al., 2020).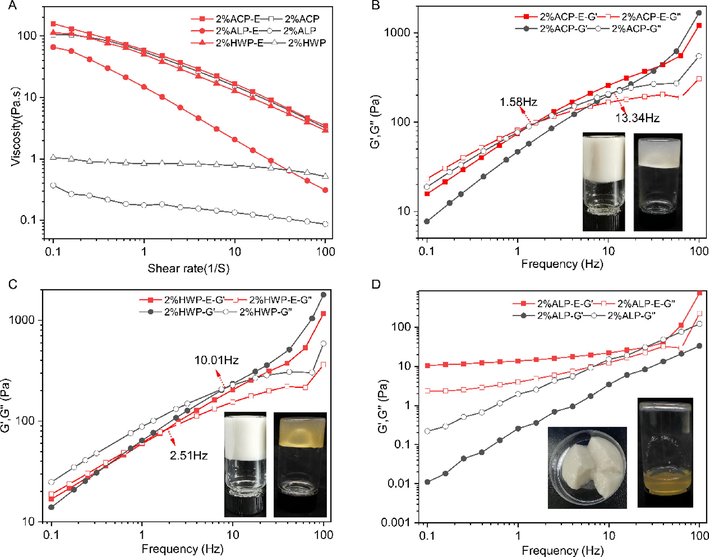
Apparent viscosity for solutions and emulsions prepared with GFPPs at 2% (w/v) pectin (A). Frequency dependence of storage modulus and loss modulus for solutions and emulsions (B-HWP, C-ACP, and D-ALP).
The frequency sweep experiments were performed at the constant strain of 1%, which was in the linear viscoelastic region (Fig. 8B–D). The G′ and G″ cross-over points were found in HWP and ACP but in a reversed manner. Moreover, G″ of HWP was higher than that of G′ at low frequency, and the cross-over point was presented at 10 Hz and 2.51 Hz for the HWP solution and HWP emulsion, respectively (Fig. 8B). For ACP, the G″ was lower than that of G′ at low frequency, whereas the cross-over point of ACP solution and ACP emulsion was at 13.34 Hz and 1.58 Hz, respectively (Fig. 8C). The G′ of ALP solution was less than that of G″, while the G′ of ALP emulsion was higher than that of G″ (Fig. 8D). Interestingly, the ALP emulsion had a creaming-like appearance (Fig. 8D, inner), which was similar with the emulsion from watermelon rind pectin (Mendez et al., 2021) and Camellia oil-based oleo gels prepared by polyphenol-palmitate and citrus pectin (Luo et al., 2019). Emulsion gel is a viscoelastic colloid that can confine emulsified oil droplets to a biopolymer three-dimensional network.
3.6.3 Emulsion storage stability
Oil-in-water emulsion stabilized by GFPP solution (2%, wt%) at an oil fraction of 10% v/v was prepared and stored at 4 °C, 25 °C, and 60 °C for 21 days. As shown in Fig. 9 A-C, the average particle size of the GFPP emulsions gradually increased with time, and ALP always had the smallest average particle size. On the one hand, the particle size was consistent with the stability behavior of the lotion. The emulsion stored at 4 °C and 25 °C had higher kinetic stability than that stored at 60 °C. The main reason for this was that the increase in temperature not only increased the free energy of the colloidal system but also reduced the viscosity of the polymer at the water–oil interface, which led to emulsion destabilization (Santiago et al., 2018).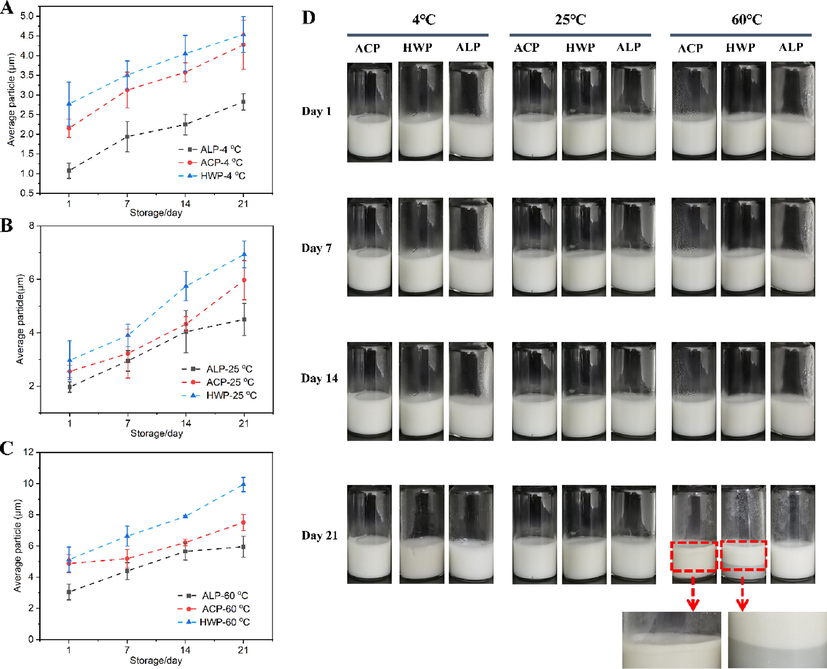
Droplets diameter of the GFPP emulsions on the 1st day, 7th day, 14th day, and 21st day (A, 4 °C; B, 25 °C, and C, 60 °C). Macroscopic examination of GFPP emulsions during storage at room temperature for 21 days (D). Red arrows indicate a phase separation.
The physical stability of emulsions was inspected visually using digital photos, and photographs of the emulsions by freshly-preparation and storage for 21 days at 4 °C, 25 °C, and 60 °C were presented in Fig. 9D. All emulsions showed no demulsification or phase-separation after preparation at 4 °C and 25 °C. However, after being stored at 60 °C for 21 days, a small amount of continuous phase was precipitated from HWP and ACP, especially HWP showed obvious phase separation (red arrows in Fig. 9D). In contrast, ALP showed no demulsification or phase separation.
The emulsifying properties of pectin were affected by their structure, neutral sugar side chain, and hydrophobic groups (Ngouémazong et al., 2015, Alba and Kontogiorgos 2017, Niu et al., 2022). Three GFPPs exhibited favorable emulsifying properties, which might be explained by the following reasons: (i) The amount of RG-I region of GFPPs was in the range of 42–54%. The hairy structure of RG-I and RG-II domains drove the long main chain to be adsorbed on the oil–water interface, while the other parts swelled in the water phase. Besides, the hydrophobic effect derived from the carbon atoms drove the polymer chain adsorption, while the solvent effect from the hydroxyl group generated the polymer swelling (Neckebroeck et al., 2020). At the same time, the thick interfacial layer could provide a stronger steric hindrance and was important for the long-term stability of the emulsion (Zhang et al., 2021). (ii) The protein content of GFPPs was 1.36–3.11%. Pectin and protein might form a pectin–protein conjugate through covalent and non-covalent interactions, which improved the surface activity of pectin and made the emulsions more resistant to environmental stress (Ngouémazong et al., 2015, Niu et al., 2022). However, ALP had stronger emulsification stability than ACP or HWP, especially because it could maintain the emulsion stability at 60 °C for 21 d (Fig. 9D). It was proposed by Alba and Kontogiorgos (Alba and Kontogiorgos 2017) that pectin with protein content in the range of 3%, with a degree of acetylation greater than 10%, MW between 100 and 200 kDa and enriched in RG-I segments were more likely to perform well as an emulsifier. The MW, protein content, esterification degree, and amount of RG-I region of ALP were 192 kDa, 3.11, 42.40, and 42.20%, respectively. Therefore, the strongest emulsification capability of ALP could be partly attributed to its unique structure and chemical composition.
4 Conclusion
In this study, three extractants were used to extract pectic polysaccharides from Gardenia flower. Our results showed that the structure and properties of three pectin polysaccharides could be influenced by different extractants. Compared with pectins by alkaline extraction (ALP) and hot water extraction (HWP), the pectin by citric acid extraction (ACP) had higher MW, higher branched chain degree and smooth surface morphology, and was rich in arabinose and galactose, all of which belonged to the property of RG-I type. In addition, three pectins had typical shear thinning behavior and showed better apparent viscosity to form a weak gel at a certain concentration. In terms of emulsifying performance, three pectins showed strong emulsifying capability, especially ALP, its emulsion gel formed was more conducive to the emulsion stability. The current study is helpful in further understanding the relationship between the structure and properties of Gardenia flower pectin, and it promotes the application of functional pectin in the food industry. However, this study did not analyze the structure of three pectin polysaccharides in detail, nor did it delve into the underlying mechanism behind their excellent emulsifying performance. Further investigations should be conducted to explore the structural characteristics and emulsification mechanism of these pectin polysaccharides in order to enhance their application potential in the food industry.
Acknowledgments
This research was funded by the Scientific Research Foundation of Zhejiang A&F University (2013FR039). We thank Chao Yu from the College of Horticulture, Zhejiang A&F University, for her excellent technical assistance in laser rheological experiments. We also thank LetPub (www.letpub.com) for its linguistic assistance during the preparation of this manuscript.
Declaration of Competing Interest
The authors declare that they have no known competing financial interests or personal relationships that could have appeared to influence the work reported in this paper.
References
- The food matrix: implications in processing, nutrition and health. Crit. Rev. Food Sci.. 2019;59:3612-3629.
- [CrossRef] [Google Scholar]
- Pectin at the oil-water interface: Relationship of molecular composition and structure to functionality. Food Hydrocolloid.. 2017;68:211-218.
- [CrossRef] [Google Scholar]
- Hydrocolloid clustering based on their rheological properties. J. Texture Stud.. 2018;49:619-638.
- [CrossRef] [Google Scholar]
- Pectins from the pulp of gabiroba (Campomanesia xanthocarpa Berg): Structural characterization and rheological behavior. Carbohyd. Polym.. 2019;214:250-258.
- [CrossRef] [Google Scholar]
- Extraction, characterization, and applications of pectins from plant by-products. Appl. Sci.. 2021;11:6596.
- [CrossRef] [Google Scholar]
- Interactions between pectin and cellulose in primary plant cell walls. Carbohyd. Polym.. 2018;192:263-272.
- [CrossRef] [Google Scholar]
- The structure, function, and biosynthesis of plant cell wall pectic polysaccharides. Carbohyd. Res.. 2009;344:1879-1900.
- [CrossRef] [Google Scholar]
- Pectin as a rheology modifier: Origin, structure, commercial production and rheology. Carbohyd. Polym.. 2017;161:118-139.
- [CrossRef] [Google Scholar]
- Extraction temperature is a decisive factor for the properties of pectin. Food Hydrocolloid.. 2021;112:106160
- [CrossRef] [Google Scholar]
- Gardenia jasminoides Ellis: Ethnopharmacology, phytochemistry, and pharmacological and industrial applications of an important traditional Chinese medicine. J. Ethnopharmacol.. 2020;257:112829
- [CrossRef] [Google Scholar]
- The influence of pH and monovalent ions on the gelation of pectin from the fruit seeds of the creeping fig plant. Food Hydrocolloid.. 2021;111:106219
- [CrossRef] [Google Scholar]
- Physicochemical and rheological characterization of pectin-rich polysaccharides from Gardenia jasminoides J. Ellis flower. Food Sci. Nutr.. 2020;8:3335-3345.
- [CrossRef] [Google Scholar]
- Green process development for apple-peel pectin production by organic acid extraction. Carbohyd. Polym.. 2019;204:97-103.
- [CrossRef] [Google Scholar]
- Multivariate analysis of uronic acid and neutral sugars in whole pectic samples by FT-IR spectroscopy. Carbohyd. Polym.. 1998;37:241-248.
- [CrossRef] [Google Scholar]
- The structure–property relationships of acid- and alkali-extracted grapefruit peel pectins. Carbohyd. Polym.. 2020;229:115524
- [CrossRef] [Google Scholar]
- Alkali + cellulase-extracted citrus pectins exhibit compact conformation and good fermentation properties. Food Hydrocolloid.. 2020;108:106079
- [CrossRef] [Google Scholar]
- Pectins from fruits: Relationships between extraction methods, structural characteristics, and functional properties. Trends Food Sci. Tech.. 2021;110:39-54.
- [CrossRef] [Google Scholar]
- Food structure, rheology, and texture. In: Encyclopedia of Food Chemistry. Oxford: Academic Press; 2016. p. :125-129.
- [Google Scholar]
- Extraction, purification and characterization of pectin from alternative sources with potential technological applications. Food Res. Int.. 2018;113:327-350.
- [CrossRef] [Google Scholar]
- The interfacial covalent bonding of whey protein hydrolysate and pectin under high temperature sterilization: Effect on emulsion stability. Colloid Surf. B. 2021;206:111936
- [CrossRef] [Google Scholar]
- Physicochemical and rheological characterization of pectin-rich fraction from blueberry (Vaccinium ashei) wine pomace. Int. J. Biol. Macromol.. 2019;128:629-637.
- [CrossRef] [Google Scholar]
- Effects of the proteinaceous moiety on the emulsifying properties of sugar beet pectin. Food Hydrocolloid.. 2007;21:1319-1329.
- [CrossRef] [Google Scholar]
- Gelation of Nicandra physalodes (Linn.) Gaertn. polysaccharide induced by calcium hydroxide: A novel potential pectin source. Food Hydrocolloid.. 2021;118:106756
- [CrossRef] [Google Scholar]
- Comparison of structural characterization and antioxidant activity of polysaccharides from jujube (Ziziphus jujuba Mill.) fruit. Int. J. Biol. Macromol.. 2020;149:1008-1018.
- [CrossRef] [Google Scholar]
- Confirmation and understanding the potential emulsifying characterization of persimmon pectin: From structural to diverse rheological aspects. Food Hydrocolloid.. 2022;131:107738
- [CrossRef] [Google Scholar]
- Structural characterization of pectin-bismuth complexes and their aggregation in acidic conditions. Int. J. Biol. Macromol.. 2020;154:788-794.
- [CrossRef] [Google Scholar]
- Composition, physicochemical properties, and anti-fatigue activity of water-soluble okra (Abelmoschus esculentus) stem pectins. Int. J. Biol. Macromol.. 2020;165:2630-2639.
- [CrossRef] [Google Scholar]
- Structural and rheological characterization of pectin from passion fruit (Passiflora edulis f. flavicarpa) peel extracted by high-speed shearing. Food Hydrocolloid.. 2021;114:106555
- [CrossRef] [Google Scholar]
- An acidic heteropolysaccharide from Mesona chinensis: Rheological properties, gelling behavior and texture characteristics. Int. J. Biol. Macromol.. 2018;107:1591-1598.
- [CrossRef] [Google Scholar]
- Characterization of the structural and emulsifying properties of sugar beet pectins obtained by sequential extraction. Food Hydrocolloid.. 2019;88:31-42.
- [CrossRef] [Google Scholar]
- Camellia oil-based oleogels structuring with tea polyphenol-palmitate particles and citrus pectin by emulsion-templated method: Preparation, characterization and potential application. Food Hydrocolloid.. 2019;95:76-87.
- [CrossRef] [Google Scholar]
- FT-IR spectroscopy as a tool for measuring degree of methyl esterification in pectins isolated from ripening papaya fruit. Postharvest Biol. Tec.. 2002;25:99-107.
- [CrossRef] [Google Scholar]
- Understanding the different emulsification mechanisms of pectin: Comparison between watermelon rind and two commercial pectin sources. Food Hydrocolloid.. 2021;120:106957
- [CrossRef] [Google Scholar]
- Rheological and chemical properties of pectin enriched fractions from different sources extracted with citric acid. Carbohyd. Polym.. 2017;156:443-451.
- [CrossRef] [Google Scholar]
- Apple pomace from variety “Blanca de Asturias” as sustainable source of pectin: Composition, rheological, and thermal properties. LWT-Food Sci. Technol.. 2020;117:108641
- [CrossRef] [Google Scholar]
- Extraction optimization and structural characterization of pectin from persimmon fruit (Diospyros kaki Thunb. Var. Rojo brillante) Carbohyd. Polym.. 2021;272:118411
- [CrossRef] [Google Scholar]
- Pectic polysaccharides from edible halophytes: Insight on extraction processes, structural characterizations and immunomodulatory potentials. Int. J. Biol. Macromol.. 2021;173:554-579.
- [CrossRef] [Google Scholar]
- Emerging concepts in the nutraceutical and functional properties of pectin—A Review. Carbohyd. Polym.. 2017;168:227-239.
- [CrossRef] [Google Scholar]
- Advanced insight into the emulsifying and emulsion stabilizing capacity of carrot pectin subdomains. Food Hydrocolloid.. 2020;102:105594
- [CrossRef] [Google Scholar]
- Structural and emulsion stabilizing properties of pectin rich extracts obtained from different botanical sources. Food Res. Int.. 2021;141:110087
- [CrossRef] [Google Scholar]
- The emulsifying and emulsion-stabilizing properties of pectin: A review. Compr. Rev. Food Sci. F.. 2015;14:705-718.
- [CrossRef] [Google Scholar]
- Relationships between the behavior of three different sources of pectin at the oil-water interface and the stability of the emulsion. Food Hydrocolloid.. 2022;128:107566
- [CrossRef] [Google Scholar]
- Chicory root pulp pectin as an emulsifier as compared to sugar beet pectin. Part 1: Influence of structure, concentration, counterion concentration. Food Hydrocolloid.. 2019;89:792-801.
- [CrossRef] [Google Scholar]
- Influence of xanthan gum on rheological properties and freeze–thaw stability of tapioca starch. J. Food Eng.. 2008;88:137-143.
- [CrossRef] [Google Scholar]
- Pectins from alternative sources and uses beyond sweets and jellies: An overview. Food Hydrocolloid.. 2021;118:106824
- [CrossRef] [Google Scholar]
- Process-induced water-soluble biopolymers from broccoli and tomato purées: Their molecular structure in relation to their emulsion stabilizing capacity. Food Hydrocolloid.. 2018;81:312-327.
- [CrossRef] [Google Scholar]
- Strides in food texture and hydrocolloids. Food Hydrocolloid.. 2021;117:106575
- [CrossRef] [Google Scholar]
- Pectic polysaccharides extracted from pot marigold (Calendula officinalis) industrial waste. Food Hydrocolloid.. 2020;101:105545
- [CrossRef] [Google Scholar]
- Rheological behavior and antioxidant activity of a highly acidic gum from Althaea officinalis flower. Food Hydrocolloid.. 2017;69:432-439.
- [CrossRef] [Google Scholar]
- Emulsion stabilizing properties of citrus pectin and its interactions with conventional emulsifiers in oil-in-water emulsions. Food Hydrocolloid.. 2018;85:144-157.
- [CrossRef] [Google Scholar]
- Physiochemical, rheological and emulsifying properties of low methoxyl pectin prepared by high hydrostatic pressure-assisted enzymatic, conventional enzymatic, and alkaline de-esterification: A comparison study. Food Hydrocolloid.. 2019;93:146-155.
- [CrossRef] [Google Scholar]
- Yield and structural composition of pomelo peel pectins extracted under acidic and alkaline conditions. Food Hydrocolloid.. 2019;87:237-244.
- [CrossRef] [Google Scholar]
- Manothermosonication (MTS) treatment by a continuous-flow system: Effects on the degradation kinetics and microstructural characteristics of citrus pectin. Ultrason. Sonochem.. 2020;63:104973
- [CrossRef] [Google Scholar]
- Characterization and functional properties of mango peel pectin extracted by ultrasound assisted citric acid. Int. J. Biol. Macromol.. 2016;91:794-803.
- [CrossRef] [Google Scholar]
- Characterization of pectin from grapefruit peel: A comparison of ultrasound-assisted and conventional heating extractions. Food Hydrocolloid.. 2016;61:730-739.
- [CrossRef] [Google Scholar]
- Investigation into the polymerization and changes of physicochemical properties of sugar beet pectin through controlled dry-heating. Food Hydrocolloid.. 2021;110:106212
- [CrossRef] [Google Scholar]
- Antioxidant activities of aqueous extracts from 12 Chinese edible flowers in vitro and in vivo. Food Nutr. Res.. 2017;61
- [CrossRef] [Google Scholar]
- Physicochemical, functional, and biological properties of water-soluble polysaccharides from Rosa roxburghii Tratt fruit. Food Chem.. 2018;249:127-135.
- [CrossRef] [Google Scholar]
- The flow behavior, thixotropy and dynamical viscoelasticity of fenugreek gum. J. Food Eng.. 2015;166:21-28.
- [CrossRef] [Google Scholar]
- Endo-xylanase and endo-cellulase-assisted extraction of pectin from apple pomace. Carbohyd. Polym.. 2016;142:199-205.
- [CrossRef] [Google Scholar]
- Pectins of different resources influences cold storage properties of corn starch gels: Structure-property relationships. Food Hydrocolloid.. 2022;124:107287
- [CrossRef] [Google Scholar]
- An overview of classifications, properties of food polysaccharides and their links to applications in improving food textures. Trends Food Sci. Tech.. 2020;102:1-15.
- [CrossRef] [Google Scholar]
- Optimization of ultrasound-microwave assisted acid extraction of pectin from potato pulp by response surface methodology and its characterization. Food Chem.. 2019;289:351-359.
- [CrossRef] [Google Scholar]
- Pomegranate peel pectin can be used as an effective emulsifier. Food Hydrocolloid.. 2018;85:30-38.
- [CrossRef] [Google Scholar]
- Structure, physicochemical characterisation and properties of pectic polysaccharide from Premma puberula pamp. Food Hydrocolloid.. 2022;128:107550
- [CrossRef] [Google Scholar]
- Gelation behaviors of some special plant-sourced pectins: A review inspired by examples from traditional gel foods in China. Trends Food Sci. Tech.. 2022;126:26-40.
- [CrossRef] [Google Scholar]
- Temperature dependence of acid and calcium-induced low-methoxyl pectin gel extracted from Cyclea barbata Miers. Food Hydrocolloid.. 2018;81:300-311.
- [CrossRef] [Google Scholar]
- Essential oils of Gardenia jasminoides J. Ellis and Gardenia jasminoides f. longicarpa Z.W. Xie & M. Okada flowers: Chemical characterization and assessment of anti-Inflammatory effects in alveolar macrophage. Pharmaceutics. 2022;14:966.
- [CrossRef] [Google Scholar]
- Chemical constituents from the flowers of wild Gardenia jasminoides. J. Ellis. Chem Biodivers.. 2017;14:1600437.
- [CrossRef] [Google Scholar]
- Physicochemical characterization and emulsifying properties evaluation of RG-I enriched pectic polysaccharides from Cerasus humilis. Carbohyd. Polym.. 2021;260:117824
- [CrossRef] [Google Scholar]
- Chemical composition of essential oil from flower of 'Shanzhizi' (Gardenia jasminoides Ellis) and involvement of serotonergic system in its anxiolytic effect. Molecules. 2020;25:4702.
- [CrossRef] [Google Scholar]
- Three new 3,4-seco-cycloartane triterpenoids from the flower of Gardenia jasminoides. Phytochem. Lett.. 2018;23:172-175.
- [CrossRef] [Google Scholar]
- Improving viscosity and gelling properties of leaf pectin by comparing five pectin extraction methods using green tea leaf as a model material. Food Hydrocolloid.. 2020;98:105246
- [CrossRef] [Google Scholar]
- Effects of sucrose on the structure formation in high-methoxyl apple pectin systems without acidifier. Food Hydrocolloid.. 2020;105:105783
- [CrossRef] [Google Scholar]
- Impact of pectin characteristics on lipid digestion under simulated gastrointestinal conditions: Comparison of water-soluble pectins extracted from different sources. Food Hydrocolloid.. 2021;112:106350
- [CrossRef] [Google Scholar]
- Comparison and structural characterization of polysaccharides from natural and artificial Se-enriched green tea. Int. J. Biol. Macromol.. 2019;130:388-398.
- [CrossRef] [Google Scholar]
- Preparation, physicochemical characterization and identification of two novel mixed ACE-inhibiting peptides from two distinct tea alkali-soluble protein. Eur. Food Res. Technol.. 2020;246:1483-1494.
- [CrossRef] [Google Scholar]
- Comparative analysis of existence form for selenium and structural characteristics in artificial selenium-enriched and synthetic selenized green tea polysaccharides. Int. J. Biol. Macromol.. 2020;154:1408-1418.
- [CrossRef] [Google Scholar]
- Valorization of polysaccharides obtained from dark tea: Preparation, physicochemical, antioxidant, and hypoglycemic properties. Foods. 2021;10
- [CrossRef] [Google Scholar]
- Preparation, physicochemical and hypoglycemic properties of natural selenium-enriched coarse tea glycoproteins. Plant Foods Hum. Nutr.. 2022;77:258-264.
- [CrossRef] [Google Scholar]
Appendix A
Supplementary material
Supplementary material to this article can be found online at https://doi.org/10.1016/j.arabjc.2023.105116.
Appendix A
Supplementary material
The following are the Supplementary material to this article:Supplementary Fig. S1
Supplementary Fig. S1


