

Translate this page into:
Visual authentication of steroidal saponins in Allium macrostemon Bge. and Allium chinense G. Don using MALDI-TOF imaging mass spectrometry and their structure activity relationship
⁎Corresponding authors at: Department of Pharmacy, the First Affiliated Hospital of Zhengzhou University, Zhengzhou 450052, China. jingyang_0101@163.com (Jing Yang), qzf1989@163.com (Zifei Qin) jingyang_0101@163.com (Zifei Qin) qzf1989@163.com (Zifei Qin)
-
Received: ,
Accepted: ,
This article was originally published by Elsevier and was migrated to Scientific Scholar after the change of Publisher.
Peer review under responsibility of King Saud University.
Abstract
Allium macrostemon Bge. (AMB) and Allium chinense G. Don (ACGD), both named Allii Macrostemonis Bulbus or Xiebai in Chinese, belong to the same genus. They are both used as edible vegetables and medicinal herbs for the treatment of atherosclerosis. So far, comparative analysis of the spatial metabolomes and platelet aggregation function of steroidal saponins has rarely been performed. In this study, high mass resolution matrix-assisted laser desorption/ionization time-of-flight imaging mass spectrometry (MALDI-TOF MSI) were performed on the fresh bulbs of these two herbs for the spatial distribution of steroidal saponins, and ultra-high-performance liquid chromatography tandem triple quadrupole mass spectrometry (UHPLC/TQD-MS) was used to quantify their content levels. Platelet inhibitory activity induced by arachidonic acid, adenosine diphosphate and collagen were fully investigated. A total of 53 differential variables with compounds were identified or tentatively characterized between AMB and ACGD samples by UHPLC/TQD-MS. Furthermore, these steroidal saponins were almost distributed in tunic and outer scale regions of AMB, while they were rich in tunic and whole leaf scale, and rarely in developing flower bud of ACGD bulbs. Quantitative results demonstrated several saponins were the unique components for AMB (macrostemonoside I, timosaponin B-II, macrostemonoside F, etc.) and ACGD (chinenoside I, chinenoside II, chinenoside IV, etc.). Moreover, spirostanol saponins exhibited stronger inhibitory platelet activity than furostanol saponins, and the structure activity relationship was further summarized. In conclusion, high-mass resolution MALDI full-scan MSI provides abundant spatial distribution information of steroidal saponins in AMB and ACGD. And we finished the discussion of their activity characteristics. These findings would benefit the understanding of safety and effectiveness for their edible and medicinal use.
Keywords
Mass spectrometry imaging
Allium macrostemon
Allium chinense
Steroidal saponins
Spatial distribution
Platelet inhibitory activity

1 Introduction
Due to high medicinal and edible properties, Allii Macrostemonis Bulbus, also named Xiebai in Chinese, has attracted increasing interests in botanical classification, active compounds and pharmacological activity (Meng et al., 2019; Yao et al., 2016). Allium macrostemon Bge. (AMB) and Allium chinense G. Don (ACGD) are its two original medicinal plants (Yao et al., 2016). AMB is widely distributed in East Asian countries (including China, Japan, Korea, Mongolia) and the Russian Far East (He et al., 2018), whereas ACGD is native to China and also naturalized in other parts of Asia as well as North America and Europe (Choi et al., 2012; Shahrajabian et al., 2020). In China and Japan, the dry bulbs of these two herbs are the important drugs possessing antiplatelet aggregation, lipid-lowering, anti-atherosclerosis, cardiovascular protection, and anti-bacterial activities (Li et al., 2014; Yao et al., 2016). In addition, ACGD is also called as Ganoderma lucidum in vegetables owing to its rich nutritional values as intestinal tonic and stomachic (Duke, 2021).
The significant benefits of AMB and ACGD had attracted intense attention on the isolation and identification of active compounds in these two herbs. Until now, about 100 chemical compounds have been isolated from AMB and ACGD bulbs (Chen et al., 2010; Kim et al., 2017; Peng et al., 1996). They share quite similar chemical component profiles, typically with steroidal saponins nitrogenous compounds as the two most abundant compound species. Ultra-high-performance liquid chromatography tandem mass spectrometry (UHPLC/MS)-oriented qualitative and quantitative results also supported these results (Qin et al., 2016a; Qin et al., 2018; Qin et al., 2016b). Furthermore, laxogenin and its corresponding glycosides are considered as the representative chemotaxonomic markers of ACGD, while the major chemical diversity of AMB originates from different sapogenins (including smilagenin, sarsasapogenin, tigogenin, etc.) and their derivatives (Yao et al., 2016). Meanwhile, a small portion of smilagenin-related steroidal saponins is also present in ACGD samples (Yao et al., 2016).
Although the chemical similarities and differences of AMB and ACGD have been investigated extensively, comparative analysis of spatial distribution of steroidal saponins in the bulbs have been only scarcely reported. In the past decade, spatial metabolome using high mass resolution matrix-assisted laser desorption/ionization time-of-flight imaging mass spectrometry (MALDI-TOF MSI) has been a developing and rapidly expanding field which provides a direct connection between tissue distribution and individual compounds (Cui et al., 2022; Huang et al., 2022). The elucidation of spatial metabolome in AMB and ACGD is particularly important in the fields of plant taxonomy, chemical authentication and quality control because it provides visual spatial distribution information of secondary metabolites in the fresh bulbs of these two species. The sample preparation, spatial resolution, and physico-chemical properties of each steroidal saponin would influence the intensity/mass of target compounds (Cui et al., 2022; Huang et al., 2022).
In addition, previous researches have reported that several saponins showed significant concentration-dependant inhibitory activity towards platelet aggregation induced by adenosine diphosphate (ADP) (Feng et al., 2019; Ling et al., 2021; Ou et al, 2012). For example, macrostemonoside A, macrostemonoside F, xiebai saponin I, and smilaxin A in AMB and/or ACGD were identified as the potential inhibitors for rabbit platelet aggregation with IC50 values of 65.0, 20.0, 78.0 and 82.0 nM, respectively (He et al., 2003; Peng et al., 1993; Peng et al., 1992). Further, macrostemonoside A was considered as a potential anti-obese agent due to its remarkable effects on decreasing the blood sugar, triglyceride, cholesterol and low density lipoprotein levels in mice with hyperglycemia, hyperlipidemia and visceral obesity (Xie et al., 2008; Zhou et al., 2007). Meanwhile, macrostemonoside A possibly have therapeutic relevance for the treatment of human colorectal cancer (Wang et al., 2013). However, the structure activity relationship or active soft spots of steroidal saponins in AMB and ACGD still remains unclear.
In the present work, we established a multi-step analysis strategy to perform the visual authentication and active soft spots of steroidal saponins in AMB and ACGD (Fig. 1). First, chemical characterization and metabolomics were performed by UHPLC/MS-MS for the identification of differential variables between AMB and ACGD samples. Then, the spatial-chemical distribution of these variables in bulb sections of these two species was explored by MALDI-TOF MSI approach. Third, comparative analysis of content levels of the differential compounds was investigated by UHPLC/MS-MS. Finally, the soft spots or structure activity relationship of these saponins towards anti-platelet aggregation activity in AMB and ACGD were summarized. Taken together, we hope that this study could provide deeper insights for the quality control, biological function and dietary supplement development of steroidal saponins in AMB and ACGD samples.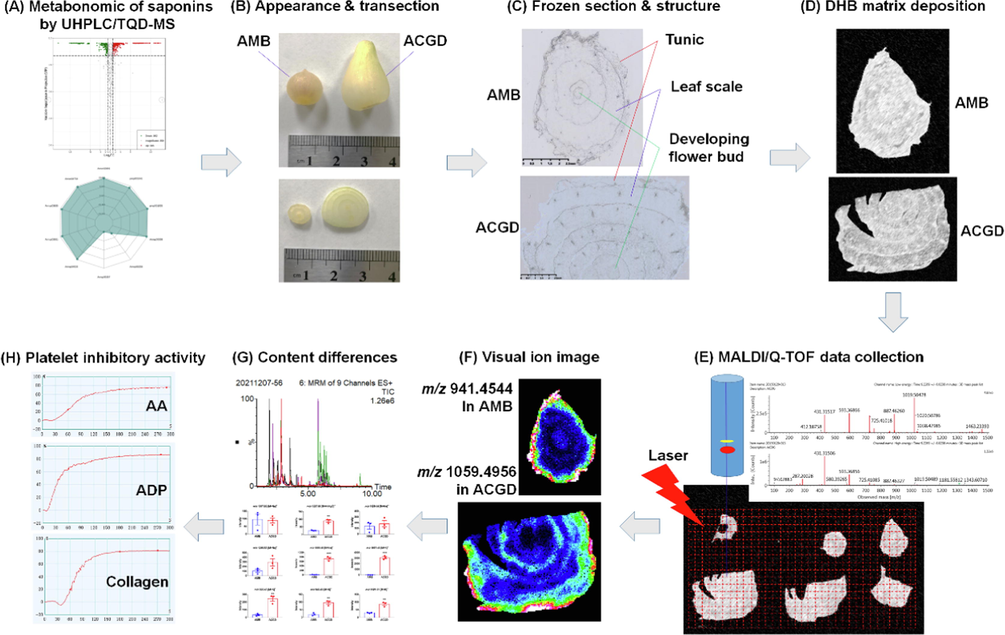
The schematic workflow of visual authentication and activity evaluation of steroidal saponins in AMB and ACGD.
2 Material and methods
2.1 Chemicals and plant samples
A total of thirty and thirty-two batches of Allium macrostemon Bge. (AMB, n = 30) and Allium chinense G. Don (ACGD, n = 32) samples were collected from different regions of China, respectively (Table S1). And they were taxonomically identified by Professor Xinsheng Yao who works in the College of Pharmacy, Jinan University, China, and stored at −80 °C before use. Diosgenin, gitogenin, laxogenin, sarsasapogenin and tigogenin, were purchased from Fans Biotechnology Co., ltd (Guangzhou, China). Other authentic standards including macrostemonoside A, macrostemonoside B, macrostemonoside E, chinenoside I, chinenoside II, were isolated from AMB and ACGD in our laboratory (Chen et al., 2010; Qin et al., 2016a; Qin et al., 2018). These standards were stored at −20 °C in our standard sample library at Jinan University, Guangzhou, China. 2,5-dihydroxybenzoic acid (DHB) and lithium trifluoroacetic acid (LiTFA) were obtained from Sigma-Aldrich (Shanghai, China). Liquid chromatography mass spectrometry grade acetonitrile, methanol, water and formic acid were obtained from Fisher Scientific (Fair Lawn, NJ). Other chemical reagents were of analytical grade.
2.2 Sample preparation
The extraction procedure was performed as described previously (Liang et al., 2022). In brief, the AMB and ACGD samples were first freeze-dried by vacuum freeze-dryer, and crushed using a mixer mill with a zirconia bead (30 Hz, 1.5 min). The lyophilized powder (0.1 g) was dissolved with 70 % methanol solution (1.0 mL), and the mixture was vortexed for 30 s every 30 min for 6 times in total. The sample was placed in a refrigerator at 4 °C overnight, and centrifugated at 12000 rpm for 10 min. The supernatant was filtrated with a 0.22 μm membrane and injected into UHPLC-MS/MS analysis.
2.3 Quantitative analysis
A UHPLC-MS/MS quantitative method for the main compounds in AMB and ACGD was developed and validated based on the limit of detection (LOD), limit of quantification (LOQ), linearity, precision, repeatability, stability, and recovery tests (AOAC international, 2002; Qin et al., 2016a, 2016b; Ren et al., 2022). The LOD and LOQ values were determined as 3 ∼ 5-fold and 8 ∼ 10-fold of the ratio of signal-to-noise (S/N), respectively. In addition, the calibration curves were developed from the respective peak area of each compound versus a set of seven concentrations of each analyte. Traditionally, the correlation coefficients (R2) over 0.9990 were satisfactory. Further, the accuracy of the instrument was evaluated after the test solution was continuously injected six times within 24 h. And the identical samples were prepared and injected six times for repeatability analysis. The stability tests were finished through placing the samples at room temperature for 0, 4, 8, 12 and 24 h. Moreover, the recovery test was carried out by adding known amounts at a ratio of 1:1, and recoveries were obtained based on the equation: recovery (%) = (observed amount − original amount) / spiked amount × 100.
2.4 UHPLC-MS/MS conditions
The chromatographic separation was performed using an UHPLC system (Waters Acquity UHPLC I-Class) on an HSS T3 column (2.1 mm × 50 mm, 1.7 µm) with mobile phase of pure water (A) and acetonitrile (B) both with 0.1 % formic acid. The gradient programs were 5 % B from 0 to 0.5 min, 5–18 % B from 0.5 to 1.0 min, 18–20 % B from 1.0 to 5.0 min, 20 % B from 5.0 to 7.0 min, 20–30 % B from 7.0 to 10.0 min, 30–55 % B from 10.0 to 15.0 min, 55–80 % B from 15.0 to 16.0 min, 80–100 % B from 16.0 to 17.0 min, 100 % B from 17.0 to 18.0 min. The flow rate was set as 0.5 mL/min and the column oven was set to 35 °C. The injection volume was 4 μL.
UHPLC analysis was coupled to a triple quadrupole mass spectrometer (Waters Xevo TQ-D). The operation parameters were as follows: capillary voltage 3.5 kV (ESI + )/1.5 kV (ESI-); cone voltage 50 V (ESI + and ESI-); desolvation gas flow 650 L/h; source temperature 350 °C. A series of multiple reaction monitoring (MRM) transitions were monitored for each period according to the steroidal saponins eluted within this period (Table S2). All data were processed on platform of Masslynx 4.1.
2.5 Multivariate statistical analysis
Unsupervised principal component analysis (PCA) between AMB and ACGD groups was performed by the prcomp statistics function within R platform (https://www.r-project.org) after obtained experiment data was unit variance scaled. Then, the data was processed with log transform (log2) and mean centering analysis for orthogonal partial least squares discrimination analysis (OPLS-DA). VIP values were derived from OPLS-DA results, which also provided the score plots and permutation plots. A total of 200 permutations test was performed to avoid overfitting. The compounds which were defined as the most important variables between these two plants need meet three factors of VIP values ≥ 1, log2FC (fold change) ≥ 1 and p < 0.05 (Huang et al., 2022).
2.6 Sample preparation for MALDI MSI assays
The fresh bulbs were first crosscut. For cryosectioning, the crosscut zone of bulbs was directly fixed in three drops of distilled water. The samples were cross-sectioned at 12 μm thickness at −20 °C using a Leica CM1950 cryostat (Wetzlar, Germany). Afterwards, the sections were placed on electrically conductive slides coated with indium tin oxide (ITO), and the slides were dried in a vacuum desiccator for 30 min. DHB solution (15 mg/mL) was prepared and the solvent was 90 % methanol–water solution containing 0.1 % LiTFA. Then DHB matrix solution was sprayed evenly on the ITO slide using TM-Sprayer matrix spray apparatus. The parameters were as follows: temperature 75 °C, flow rate 0.1 mL/min, pressure 8 psi. A total of 24 cycles were sprayed, and drying time between each cycle was 10 s.
2.7 MALDI MS imaging measurements
MALDI timsTOF MSI measurements were achieved on a prototype Bruker timsTOF flex MS system (Bremen, Germany) equipped with a 10 kHz smart beam 3D laser. The corresponding laser power was set to 80 % and then fixed throughout the whole assays. The mass range were from m/z 200 to m/z 1300 Da in positive ion mode. The spatial images were acquired at a 100 μm laser step size, and each mass spectrum consisted of 500 laser shots. All RAW data were imported into Bruker SCiLS Lab software, and normalized with the Root Mean Square. Then, the signal intensity in each visual image represented the normalized intensity. The red and blue spots represented the high and low content of one ion in the image, respectively.
2.8 Platelet aggregation inhibitory activity
Light transmission aggregometry (LTA) was classical and well-recognized approach to measure platelet aggregation rate (Lu et al., 2017). First, blood samples were collected into vacuum blood collection tube (containing 0.1 mL 109 mM citrate sodium) from healthy subjects. Differential centrifugation was applied to prepare platelet rich plasma (PRP) and platelet poor plasma (PRP) at room temperature. The blood samples were centrifugated at 950 rpm for 10 min, and the supernatant was PRP samples. Then, the residual blood samples were separated by centrifuging at 3200 rpm for 20 min to obtain PPP samples. Automatic platelet aggregation instrument AG800 (Shandong, China) was used to investigate the platelet aggregation rate. The transmittance of PPP sample was 100 % as a control group. Different inducers including arachidonic acid (AA), adenosine diphosphate (ADP) and collagen, and tested compounds (100 μM or 50 μM) were added into PRP samples, and their transmittance was dynamically measured and recorded. Platelet aggregation curve and maximum aggregation rate (%) were used to reflect the platelet aggregation inhibitory function of tested compounds.
2.9 Statistical analysis
All data were shown as mean ± standard deviation (n = 3). The differences between treatment and control groups were obtained by Student’s t-test. And the levels of significant difference were set at p < 0.05 (*), p < 0.01 (**) and p < 0.001 (***).
3 Results
3.1 Chemical characterization of steroidal saponins in AMB and ACGD bulbs by UHPLC-MS/MS
In our previous study, we have performed the chemical profiles of AMB and ACGD by UHPLC/Q-TOF-MS (Qin et al., 2018; Qin et al., 2016b). Based on the optimized MRM transitions, a comprehensive profile of steroidal saponins in these two herbs was achieved by UHPLC-MS/MS (Fig. S1 and Table S2). A total of 77 steroidal saponins were detected in AMB and ACGD samples, of which 47 compounds were identified with authentic standards. Obviously, several compounds were characteristic components for AMB (Fig. S1A) and ACGD (Fig. S1B), respectively.
3.2 Identification of differential compounds between AMB and ACGD groups
As shown in Fig. S2A, AMB samples (n = 30) were markedly separated with ACGD samples (n = 32) in unsupervised PCA plot. These indicated there were significant differences among the structural type and intensity values of their compounds. Then, the volcano plot (Fig. S2B) gave the similar results that 36 variables and 30 compounds obviously up-regulated and down-regulated in AMB group compared with ACGD group, respectively. Further, 53 compounds (Table S3) in total with VIP values over 1.0 were identified as differential variables between AMB and ACGD groups in VIP plot (Fig. S2C).
3.3 Comparative analysis of spatial distribution of steroidal saponins in AMB and ACGD bulbs by MALDI MSI
As displayed in Fig. 1B, transverse sections showed the morphology and sizes of AMB accounted for no more than those 50 % of ACGD. And they have similar anatomical structure including tunic, leaf scale and developing flower bud as illustrated in Fig. 1C. Due to the morphology and sizes, ACGD have more leaf scales than AMB. Each leaf scale orderly and alternately arranged. The leaf scales of AMB and ACGD both occupied over 90 % of the whole transverse section.
Spatial distribution patterns of several main differential steroidal saponins in these two species are demonstrated in Fig. 2 and Table 1. Each visual image represented the adduct ions including [M + H-H2O]+, [M + H]+, [M + Na]+ and [M + K]+ of steroidal saponins in AMB and ACGD bulbs. Overall, the steroidal saponins derived in AMB were observed mainly in tunic, showing a great contrast with the widely distributed saponins in ACGD. For example, the adduct ions at m/z 1075.4706 ([M + K]+) and m/z 1059.4956 ([M + Na]+) beard some similarities in ACGD and were not detected in AMB, which were mainly observed in the tunic and leaf scale regions (Fig. 2A). This was because these compounds were particular in ACGD, not in AMB. Similar results were obtained for the characterization of Chinenoside II and its derivatives in Fig. 2D. When investigated further, several steroidal saponins with molecular formulas of C45H74O18 or C45H76O19 were the common compounds with the same ions at m/z 903.4939 and 959.4648, which were also detected in these two herbs (Fig. 2C). In Fig. 2F, the weak visualization of common ion m/z 755.4229 illustrated the intensity/mass of macrostemonoside S in AMB and compounds 17 and 18 in ACGD were low. In addition, the adduct ions at m/z 943.4335 (Fig. 2B), m/z 915.4634 and m/z 971.4244 (Fig. 2E) were all observed in AMB tunic and ACGD bulbs, although compounds 26 and 27 were unique in ACGD, while macrostemonoside I was particular in AMB. Note: The number of identified compounds was same as the detailed information in Supporting Information Table S1. AMB and ACGD meant Allium macrostemon Bge. and Allium chinense G. Don, respectively.![Matrix-assisted laser desorption/ionization coupled MS images of AMB (left) and ACGD (right). Visual ion images of m/z 1075.4706 ([Chinenoside I + K]+) and m/z 1059.4956 ([Chinenoside I + Na]+) (A), m/z 943.4335 ([Comp27 + K]+) (B), m/z 903.4939 ([Timosaponin B-II + H-H2O]+) and m/z 959.4648 ([Timosaponin B-II + K]+) (C), m/z 1041.4867 ([Chinenoside II + Na]+) (D), m/z 915.4634 ([Macrostemonoside I + H-H2O]+) and m/z 971.4244 ([Macrostemonoside I + K]+) (E), m/z 755.4229 ([Comp18 + H-H2O]+) (F). Visual ion images were detected and recorded with a step size of 100 μm. The mass accuracy was no>5 ppm. See Supporting Information Table S1 for more detailed information on the compound characterization.](/content/184/2022/15/10/img/10.1016_j.arabjc.2022.104138-fig2.png)
Matrix-assisted laser desorption/ionization coupled MS images of AMB (left) and ACGD (right). Visual ion images of m/z 1075.4706 ([Chinenoside I + K]+) and m/z 1059.4956 ([Chinenoside I + Na]+) (A), m/z 943.4335 ([Comp27 + K]+) (B), m/z 903.4939 ([Timosaponin B-II + H-H2O]+) and m/z 959.4648 ([Timosaponin B-II + K]+) (C), m/z 1041.4867 ([Chinenoside II + Na]+) (D), m/z 915.4634 ([Macrostemonoside I + H-H2O]+) and m/z 971.4244 ([Macrostemonoside I + K]+) (E), m/z 755.4229 ([Comp18 + H-H2O]+) (F). Visual ion images were detected and recorded with a step size of 100 μm. The mass accuracy was no>5 ppm. See Supporting Information Table S1 for more detailed information on the compound characterization.
No.
Compounds
Formula
Adduct
ion
Theoretical
value
Measured
value
Error
(ppm)
Origin
57/58
25(S)-Chinenoside I / Chinenoside I
C49H80O23
[M + Na]+
1059.4988
1059.4956
−3.0
ACGD
[M + K]+
1075.4727
1075.4706
−2.0
ACGD
26/27
26-O-β-d-glucopyranosyl-3β,22,26-tridyroxy-25(S)-5α-furostan-6-one-3-O-
α-l-arabinopyranosyl-(1 → 6)-β-d-glucopyranoside /
26-O-β-d-glucopyranosyl-3β,22,26-tridyroxy-25(R)-5α-furostan-6-one-3-O-α-l-arabinopyranosyl-(1 → 6)-β-d-glucopyranosideC44H72O19
[M + K]+
943.4305
943.4335
3.2
ACGD
31/32/35/36
Timosaponin B-II / 25(R)-Timosaponin B-II /
25(S)-26-O-β-d-glucopyranosyl-5α-furost-3β,26-didyroxy-3-O-{O-β-d-glucopyranosyl-(1 → 2)-β-d-glucopyranosyl-(1 → 4)-β-d-galactopyranoside} / 25(R)-26-O-β-d-glucopyranosyl-5α-furost-3β,26-didyroxy-3-O-{O-β-d-glucopyranosyl-(1 → 2)-β-d-glucopyranosyl-(1 → 4)-β-d-galactopyranoside}C45H76O19
[M + H-H2O]+
903.4953
903.4939
−1.5
AMB/ACGD
[M + K]+
959.4618
959.4648
3.1
AMB/ACGD
38
Macrostemonoside I
C45H72O20
[M + H-H2O]+
915.4590
915.4634
4.8
AMB
[M + K]+
971.4254
971.4244
−1.0
AMB
59/60/61
25(S)-Chinenoside II / Chinenoside II / 25(R)-3β-hydroxy-5α-spirostan-6-one-3-O-{O-β-d-glucopyranosyl-(1 → 3)-O-β-d-xylopyranosyl-(1 → 4)-O-[α-l-arabinopyranosyl-(1 → 6)]}-β-d-glucopyranoside
C49H78O22
[M + Na]+
1041.4882
1041.4867
−1.4
ACGD
[M + K]+
1057.4622
1057.4646
2.3
ACGD
17/18
26-O-β-d-glucopyranosyl-3β,22α,26-trihydroxy-25(S)-5α-furostan-6-one-3-O-β-d-glucopyranoside / 26-O-β-d-glucopyranosyl-3β,22α,26-trihydroxy-25(R)-5α-furostan-6-one-3-O-β-d-glucopyranoside
C39H64O15
[M + H-H2O]+
755.4218
755.4229
1.5
ACGD
28/29
25(S)-Chinenoside III / Chinenoside III
C44H70O18
[M + K]+
925.4199
925.4240
4.4
ACGD
62/63
25(S)-Chinenoside IV / Chinenoside IV
C50H80O23
[M + H]+
1049.5108
1049.5118
1.0
ACGD
51/52/53/54
[26-O-β-d-glucopyranosyl-3β,22,26-tridyroxy-25(S)-5α-furostan-6-one-3-O-α-l-arabinopyranosyl-(1 → 6)-β-d-glucopyranoside]-Acetylation /
[26-O-β-d-glucopyranosyl-3β,22,26-tridyroxy-25(R)-5α-furostan-6-one-3-O-α-l-arabinopyranosyl-(1 → 6)-β-d-glucopyranoside]-Acetylation /
[26-O-β-d-glucopyranosyl-3β,22,26-tridyroxy-25(S)-5α-furostan-6-one-3-O-β-d-xylopyranosyl-(1 → 4)-O-β-d-glucopyranoside]-Acetylation /
[26-O-β-d-glucopyranosyl-3β,22,26-tridyroxy-25(R)-5α-furostan-6-one-3-O-β-d-xylopyranosyl-(1 → 4)-O-β-d-glucopyranoside]-AcetylationC46H74O20
[M + H]+
947.4852
947.4852
0.0
ACGD
4
Laxogenin
C27H42O4
[M + H]+
431.3161
431.3166
1.2
ACGD
40/41
Macrostemonoside G / 25(R)-Macrostemonoside I
C45H74O20
[M + Na]+
957.4671
957.4676
0.5
AMB
[M + H-H2O]+
917.4746
917.4776
3.3
AMB
43/44/45/47
Elephanoside E / 25(R)-12α-OH-Timosaponin B-II / Macrostemonoside J / Macrostemonoside P
C45H76O20
[M + H-H2O]+
919.4903
919.4873
−3.3
AMB
[M + K]+
975.4567
975.4567
0.0
AMB
22
25(R)-12β-hydroxy-Timosaponin A-III
C39H64O14
[M + H]+
757.4374
757.4404
4.0
AMB
33/34/37
Timosaponin B-III / Macrostemonoside F /
25(S)-5α-spirostane-3β-ol-3-O-{O-β-d-glucopyranosyl-(1 → 2)-O-β-d-glucopyranosyl-(1 → 4)-β-d-galactopyranoside}C45H74O18
[M + H]+
903.4953
903.4939
−1.5
AMB/ACGD
[M + Na]+
925.4773
925.4774
0.1
AMB/ACGD
[M + K]+
941.4512
941.4544
3.4
AMB/ACGD
12/13
Laxogenin-3-O-{β-d-xylopyranosyl-(1 → 4)-β-d-glucopyranoside} /
Laxogenin-3-O-{α-l-arabinopyranosyl-(1 → 6)-β-d-glucopyranoside}C38H60O13
[M + H]+
725.4112
725.4114
0.3
ACGD
25
Laxogenin-3-O-{β-d-xylopyranosyl-(1 → 4)-O-[α-l-arabinopyranosyl-(1 → 6)]-β-d-glucopyranoside}
C43H68O17
[M + K]+
895.4094
895.4054
−4.5
ACGD
39
20(22)-ene-Macrostemonoside I
C45H72O20
[M + H]+
915.4590
915.4634
4.8
AMB
30/48/49/50
Macrostemonoside O /
25(S)-5α-spirostane-2α,3β-diol-3-O-{O-β-d-glucopyranosyl-(1 → 2)-O-β-d-glucopyranosyl-(1 → 4)- β-d-galactopyranoside} /
25(R)-5α-spirostane-2α,3β-diol-3-O-{O-β-d-glucopyranosyl-(1 → 2)-O-β-d-glucopyranosyl-(1 → 4)-β-d-galactopyranoside} /
Macrostemonoside LC45H74O19
[M + H]+
919.4903
919.4873
−3.3
AMB/ACGD
14/15/16
Timosaponin B-IIa / 25(R)-Timosaponin B-IIa /25(R)-Timosaponin A-III
C39H64O13
[M + H]+
741.4425
741.4443
2.4
AMB/ACGD
42
25(27)-ene-12β-hydroxy-Macrostemonoside B
C57H94O30
[M + K]+
1297.5467
1297.5458
−0.7
AMB
19
Macrostemonoside S
C39H62O14
[M + H]+
755.4218
755.4229
1.5
AMB
23/24
Chinenoside VII / 25(R)-5α-spirostan-3-O-{O-(4-O-acetyl-α-l-rabinopyranosyl)-(1 → 6)-β-d-glucopyranoside}
C40H62O14
[M + H]+
767.4218
767.4189
−3.8
ACGD
55
25(27)-ene-Macrostemonoside Q
C45H74O21
[M + H]+
951.4801
951.4808
0.7
AMB
[M + K]+
989.4360
989.4366
0.6
AMB
56
Macrostemonoside Q
C45H76O21
[M + H-H2O]+
935.4852
935.4822
−3.2
AMB
[M + H]+
953.4957
953.4950
−0.7
AMB
8/9
26-O-β-d-glucopyranosyl-3β,26-dihydroxy-25(R)-5α-furostan-20(22)-en-6-one / Laxogenin-3-O-β-d-glucopyranoside
C33H52O9
[M + H]+
593.3690
593.3693
0.5
ACGD
1
Diosgenin
C27H42O3
[M + H]+
415.3212
415.3227
3.6
AMB/ACGD
74/75
25(S)-Macrostemonoside B / Macrostemonoside B
C57H96O29
[M + K]+
1283.5674
1283.5733
4.6
AMB/ACGD
[M + H-H2O]+
1227.6010
1227.5991
−1.5
AMB/ACGD
20/21/46
Pentandroside F /Macrostemonoside R/12β-hydroxy-Macrostemonoside B
C57H96O30
[M + K]+
1299.5623
1299.5561
−4.8
AMB/ACGD
68/69/70/71
Macrostemonoside D / Macrostemonoside A-Acetylation
C53H86O24
[M + Na]+
1129.5407
1129.5401
−0.5
AMB/ACGD
[M + K]+
1145.5146
1145.5184
3.3
AMB/ACGD
6/7
Asparagoside B / 25(R)-Asparagoside B
C33H56O9
[M + H-H2O]+
579.3897
579.3924
4.7
AMB/ACGD
5
Gitogenin
C27H44O4
[M + H]+
433.3318
433.3337
4.4
AMB/ACGD
2/3
Sarsasapogenin / Tigogenin
C27H44O3
[M + H]+
417.3369
417.3355
−3.4
AMB/ACGD
72/73
25(S)-5(6)-ene-Macrostemonoside B / 5(6)-ene-Macrostemonoside B
C57H94O29
[M + Na]+
1265.5778
1265.5748
−2.4
AMB/ACGD
10
Macrostemonoside N
C33H54O12
[M + K]+
681.3252
681.3250
−0.3
AMB
11
Macrostemonoside M
C33H56O12
[M + Na]+
667.3669
667.3660
−1.3
AMB
[M + K]+
683.3409
683.3400
−1.3
AMB
64/65
25(S)-26-O-β-d-glucopyranosyl-5α-furost-3β,26-didyroxy-3-O-{O-β-d-glucopyranosyl-(1 → 2)-O-β-d-glucopyranosyl-(1 → 4)-β-d-galactopyranoside} / 25(R)-26-O-β-d-glucopyranosyl-5α-furost-3β,26-didyroxy-3-O-{O-β-d-glucopyranosyl-(1 → 3)-O-β-d-glucopyranosyl-(1 → 4)-β-d-galactopyranoside}
C51H86O24
[M + K]+
1121.5146
1121.5166
1.8
AMB/ACGD
66
Macrostemonoside A
C51H84O23
[M + Na]+
1087.5301
1087.5290
−1.0
AMB/ACGD
[M + K]+
1103.5040
1103.5031
−0.8
AMB/ACGD
67
Borivilianoside G
C51H82O24
[M + H]+
1079.5274
1079.5281
0.6
AMB/ACGD
76/77
25(S)-Macrostemonoside E / Macrostemonoside E
C57H94O28
[M + H]+
1227.6010
1227.5991
−1.5
AMB/ACGD
[M + Na]+
1249.5829
1249.5832
0.2
AMB/ACGD
[M + K]+
1265.5569
1265.5548
−1.7
AMB/ACGD
To better reveal the pathway of sapogenin-related higher sugar moieties substitution, a series of visual ion images including several saponins and their glycosides were performed in Fig. 3. Sarsasapogenin and tigogenin were selected as the examples, and their visual [M + H]+ ion at m/z 417.3355 in Fig. 3F, which were rich in AMB tunic and ACGD tunic and leaf scale. Their mono-glycosides with [sapogenin + Gal/Glc + H]+ at m/z 579.3924 showed similar spatial distribution in both these two species (Fig. 3E). With the increase of sugar moieties, several main ions at m/z 741.4443 ([sapogenin + Gal + Glc + H]+) (Fig. 3D), m/z 1103.5031 ([sapogenin + Gal + 3 × Glc + K]+) (Fig. 3B), and m/z 1249.5832 ([sapogenin + Gal + 4 × Glc + Na]+) (Fig. 3A) were obviously observed in ACGD developing flower buds, while the ion at m/z 941.4544 ([sapogenin + Gal + 2 × Glc + K]+) (Fig. 3C) was also could be barely observed in developing flower bud of AMB bulbs.![MALDI MSI images of sarsasapogenin/tigogenin-related steroidal saponins in AMB (up) and ACGD (down) bulbs. Visual ion images of m/z 1249.5832 ([sapogenin + Gal + 4 × Glc + Na]+) (A), m/z 1103.5031 ([sapogenin + Gal + 3 × Glc + K]+) (B), m/z 941.4544 ([sapogenin + Gal + 2 × Glc + K]+) (C), m/z 741.4443 ([sapogenin + Gal + Glc + H]+) (D), m/z 579.3924 ([sapogenin + Gal/Glc + H]+) (E), m/z 417.3355 ([sarsasapogenin/tigogenin + H]+) (F). The scanning step size was set as 100 μm for these visual ion images. The errors of these detected ions were<5 ppm. Gal and Glc meant Galactose and Glucose, respectively. The details for compounds identification were show in Supporting Information Table S1.](/content/184/2022/15/10/img/10.1016_j.arabjc.2022.104138-fig3.png)
MALDI MSI images of sarsasapogenin/tigogenin-related steroidal saponins in AMB (up) and ACGD (down) bulbs. Visual ion images of m/z 1249.5832 ([sapogenin + Gal + 4 × Glc + Na]+) (A), m/z 1103.5031 ([sapogenin + Gal + 3 × Glc + K]+) (B), m/z 941.4544 ([sapogenin + Gal + 2 × Glc + K]+) (C), m/z 741.4443 ([sapogenin + Gal + Glc + H]+) (D), m/z 579.3924 ([sapogenin + Gal/Glc + H]+) (E), m/z 417.3355 ([sarsasapogenin/tigogenin + H]+) (F). The scanning step size was set as 100 μm for these visual ion images. The errors of these detected ions were<5 ppm. Gal and Glc meant Galactose and Glucose, respectively. The details for compounds identification were show in Supporting Information Table S1.
In addition, laxogenin and its derivatives were particular compounds in ACGD samples. Visual ion images of the adduct ion at m/z 1057.4646 ([M + K]+) in tunic and leaf scale indicated the compounds were chinenoside II and its isomers (Fig. 4A). Subsequently, chinenoside II lost one sugar group of 132 Da (xylose or arabinose) or 162 Da (glucose) to produce the fragment ions at m/z 925.4240 ([M + K]+) (Fig. 4B) and m/z 895.4054 ([M + K]+) (Fig. 4C), respectively. These ions were identified as chinenoside III and compound 25 (both containing their isomers), respectively. Similarly, we obtained the ion images of m/z 725.4114 ([M + H]+) in whole ACGD bulbs (Fig. 4D). Due to the presence of the ions at m/z 593.3693 (Fig. 4E) and m/z 431.3166 (Fig. 4F) detected in AMB, their ion images were both observed in ACGD and AMB samples. Moreover, other visual ion images of differential variables and non-differential saponins in AMB and ACGD bulbs were demonstrated in Fig. S3-S5 and Table 1. In total, the steroidal saponins in AMB were mainly distributed in bulb tunic, whereas they were mainly detected in ACGD tunic and leaf scales, and rarely in developing flower buds.![Visual MALDI MSI images of laxogenin-related steroidal saponins in AMB (up) and ACGD (down) samples. MALDI MSI images of m/z 1057.4646 ([sapogenin + 2 × Glc + Xyl + Ara + K]+) (A), m/z 925.4240 ([sapogenin + 2 × Glc + Xyl/Ara + K]+) (B), m/z 895.4054 ([sapogenin + Glc + Xyl + Ara + K]+) (C), m/z 725.4114 ([sapogenin + Glc + Xyl/Ara + H]+) (D), m/z 593.3693 ([sapogenin + Glc + H]+) (E), m/z 431.3166 ([laxogenin + H]+) (F). Ara, Glc and Xyl meant Arabinose, Glucose and Xylose, respectively. The visual ion images were detected with a step size of 100 μm, and the errors was no>5 ppm. The detailed MS data were displayed in Supporting Information Table S1.](/content/184/2022/15/10/img/10.1016_j.arabjc.2022.104138-fig4.png)
Visual MALDI MSI images of laxogenin-related steroidal saponins in AMB (up) and ACGD (down) samples. MALDI MSI images of m/z 1057.4646 ([sapogenin + 2 × Glc + Xyl + Ara + K]+) (A), m/z 925.4240 ([sapogenin + 2 × Glc + Xyl/Ara + K]+) (B), m/z 895.4054 ([sapogenin + Glc + Xyl + Ara + K]+) (C), m/z 725.4114 ([sapogenin + Glc + Xyl/Ara + H]+) (D), m/z 593.3693 ([sapogenin + Glc + H]+) (E), m/z 431.3166 ([laxogenin + H]+) (F). Ara, Glc and Xyl meant Arabinose, Glucose and Xylose, respectively. The visual ion images were detected with a step size of 100 μm, and the errors was no>5 ppm. The detailed MS data were displayed in Supporting Information Table S1.
3.4 Comparative analysis of content levels of differential saponins in AMB and ACGD samples by UHPLC-MS/MS
The quantitative method validation results demonstrated that this method was sensitive and practical with LOD values ranging from 5.0 to 50.0 ng/mL and LOQ values between 25.0 and 200.0 ng/mL (Table S4). In addition, acceptable linear correlation with correlation coefficients values (R2) from 0.9990 to 0.9999 within the test ranges of each compound (Table S4). The relative standard deviation (RSD) values for precision, repeatability and stability were all no>3.7 % (Table S5), suggesting that the quantitative method was stable and repeatable, and the sample solution was stable at room temperature for 24 h. The recovery results were ranging from 98.1 % to 104.3 % with RSD values no>3.6 % (Table S5), indicating sufficient reliability and accuracy of the developed method.
As clear shown in Fig. S6, the major differential variables were particular in AMB or ACGD samples. For example, compounds 58, 27, 60, 18 and 12 were all rich in ACGD bulbs as well as compounds 32, 38, 31, 40, 44 and 33 in AMB samples (Fig. S6). And the content levels of these compounds were over 0.1 mg/g. In addition, several common compounds including compounds 20, 74 and 73 were all abundant in these two species (Fig. S6). Obviously, content determination results were more objective than the intensity/mass of several adduct ions derived from visual ion images for the authentication of steroidal saponins in AMB and ACGD.
3.5 Structure activity relationship of main steroidal saponins in AMB and ACGD samples
A series of steroidal saponins with different sapogenins and multiple sugar moieties substitution in AMB as well as laxogenin-related saponins in ACGD were selected for the structure activity relationship of platelet aggregation inhibitory activity (Fig. S7). As displayed in Fig. 5A and 5D, when the tested compounds were 100 μM (50 μM for sapogenins), the maximum platelet aggregation rates of compounds 66, 16, 34 in AMB and compounds 9, 12, 13, 25 in ACGD were all less than 50 % of the negative control. In addition, the inhibitory data of these compounds were fitted to log (inhibitor) and normalized response equations to obtain the IC50 values (Fig. S8). The IC50 values of compounds 66, 16, 34, 9, 12, 13 and 25 for the inhibitory effects of AA-induced platelet aggregation activity were 31.7, 41.6, 50.8, 35.8, 53.0, 25.1 and 40.5 μM, respectively (Table 2). Similarly, the inhibitory effects of these compounds towards ADP or collagen-induced platelet aggregation activity were also investigated (Fig. 5), their dose-independent inhibitory curves (Fig. S9 and S10) and IC50 values were further obtained (Table 2). Based on the tested activity, the active “soft spots” or structure activity relationship of main steroidal saponins in AMB and ACGD were shown in Fig. 6A and 6B, respectively. Note: The number of compounds was same as the information in Supporting Information Table S1. AA and ADP meant arachidonic acid and adenosine diphosphate, respectively. AMB and ACGD meant Allium macrostemon Bge. and Allium chinense G. Don, respectively.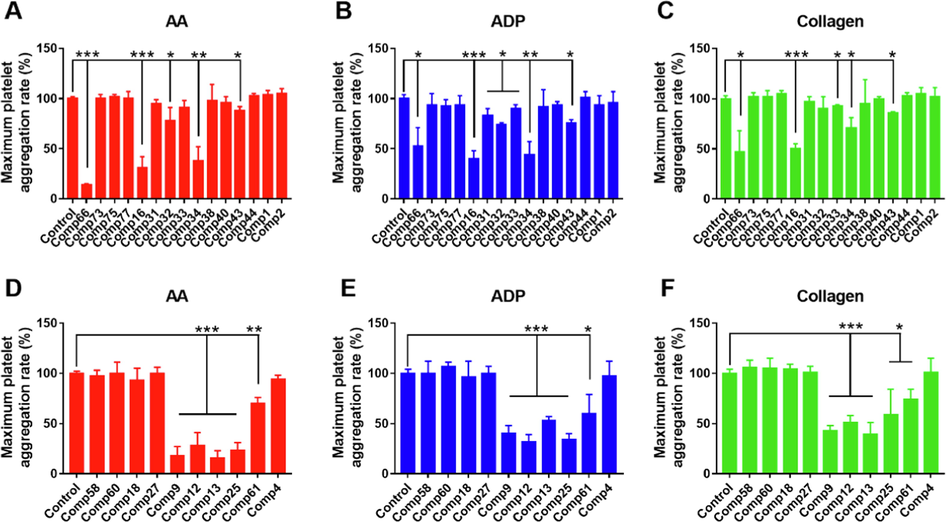
Evaluation of inhibitory platelet aggregation activity of major steroidal saponins in AMB and ACGD samples. The inhibitory effects of main saponins in AMB against arachidonic acid (AA, A), adenosine diphosphate (ADP, B) and collagen (C) inducing platelet aggregation. The inhibitory effects of steroidal saponins in ACGD against AA (D), ADP (E) and collagen (F) inducing platelet aggregation. The inhibitory activity was evaluated in the absence (control, 0 μM) and presence of tested compounds (50 μM or 100 μM) at room temperature. Data was represented as mean ± standard deviation of triplicate. The number of compounds was same as the information in Supporting Information Table S1. (*compared with those of control, * p < 0.05, * p < 0.01 and * p < 0.001).
No.
Compound
Origin
Inducer
IC50 values
(μM)
Comp16#
25(R)-Timosaponin A-III
AMB
AA
41.6 ± 6.9
ADP
68.3 ± 13.5
collagen
>100
Comp31#
Timosaponin B-II
AMB
ADP
>100
Comp32#
25(R)-Timosaponin B-II
AMB
AA
>100
ADP
>100
Comp33#
Timosaponin B-III
AMB
ADP
>100
collagen
>100
Comp34#
Macrostemonoside F
AMB
AA
50.8 ± 13.5
ADP
62.8 ± 12.6
collagen
84.5 ± 22.1
Comp43#
Elephanoside E
AMB
AA
>100
ADP
>100
collagen
>100
Comp66#
Macrostemonoside A
AMB/ACGD
AA
31.7 ± 7.4
ADP
91.1 ± 24.9
collagen
>100
Comp9#
Laxogenin-3-O-β-d-glucopyranoside
ACGD
AA
35.8 ± 7.0
ADP
73.8 ± 9.6
collagen
88.3 ± 12.4
Comp12#
Laxogenin-3-O-{β-d-xylopyranosyl-(1 → 4)-β-d-glucopyranoside}
ACGD
AA
53.0 ± 11.7
ADP
61.7 ± 9.4
collagen
84.7 ± 14.9
Comp13#
Laxogenin-3-O-{α-l-arabinopyranosyl-(1 → 6)-β-d-glucopyranoside}
ACGD
AA
25.1 ± 4.5
ADP
>100
collagen
60.0 ± 10.9
Comp25#
Laxogenin-3-O-{β-d-xylopyranosyl-(1 → 4)-O-[α-l-arabinopyranosyl-(1 → 6)]-β-d-glucopyranoside}
ACGD
AA
40.5 ± 7.9
ADP
61.4 ± 10.4
collagen
>100
Comp61#
25(R)-3β-hydroxy-5α-spirostan-6-one-3-O-{O-β-d-glucopyranosyl-(1 → 3)-O-β-d-xylopyranosyl-(1 → 4)-O-[α-l-arabinopyranosyl-(1 → 6)]}-β-d-glucopyranoside
ACGD
AA
>100
ADP
>100
collagen
>100
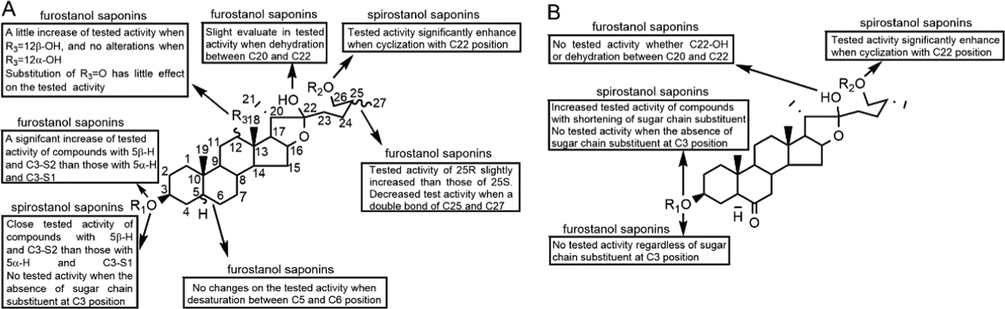
Structure activity relationship involving in inhibitory platelet aggregation activity of furostanol saponins and spirostanol saponins in AMB (A) and ACGD (B) samples.
4 Discussion
Modern analytical techniques including HPLC, UHPLC, LC-MS/MS were widely applied to qualify and quantify the chemical components in herbal medicines or food supplements (Cui et al., 2022; Qin et al., 2016a). Recently, visual MALDI MSI approach has been broadly used in plant taxonomy, biomarker discovery, and drug tissue distribution (Alexandrov, 2020). In this study, we performed MALDI MSI method to depict molecular images of steroidal saponins in AMB and ACGD bulbs. Although they belong to one plant species (Allii Macrostemonis Bulbus or Xiebai in China), fresh AMB bulbs are usually used as medicinal plant, while ACGD bulbs are mainly regarded as edible foods (Yao et al., 2016). The application of MALDI MSI modes allow us to visualize the common and differential steroidal saponins in these two species. About 77 saponins were observed on the bulb sections, along with their visual tissue-specific distribution. The saponins beard similar distribution patterns that saponins in AMB were mainly in bulb tunic and outer leaf scale regions, while they were distributed in ACGD whole bulbs mainly in tunic and all leaf scales (Figs. 2-4). Notably, isomeric saponins cannot be efficiently separated for individual ion image, resulting that each ion image is an overlap visual image of two or more isomers of saponins. This is also one major limitation of MALDI MSI application.
Although MALDI MSI method could provide in situ detection of mapping the spatial distribution of multiple components in tissues, the major reason of its limited application is that visual MALDI MSI detection is lack of efficient chromatographic separation of complex mixture (Dong et al., 2020). This brings a huge obstacle to distinguish the adduct ions with the same m/z value, further causing ambiguity understanding in the identification and characterization of spatial distribution of individual components (Dong et al., 2020). In this study, the visual ion images of many isomers were detected, especially chinenoside I and 25(S)-chinenoside I in ACGD (Fig. 2A), timosaponin B-II and 25(R)-timosaponin B-II in AMB (Fig. 2C). For this limitation, several scholars employed the MS/MS imaging experiment to distinguish the isomers with minor distinct fragment ions in MS/MS spectra (Li et al., 2021). Due to the difficulty in the fragmentation of Na+ and K+ adduct ions, lithium trifluoroacetic acid and DHB were applied for the MS/MS imaging assays (Li et al., 2021). Two minor differences of the fragment ions at m/z 255.11 and m/z 253.13 were the characteristic diagnostic ions for paeoniflorin and albiflorin, respectively (Li et al., 2021). This approach could partially solve the characterization of isomers in AMB and ACGD.
For the steroidal saponins with C25-R or C25-S configuration in AMB and ACGD, the MS/MS imaging is not applicable due to their same parent and fragment ions. Another solution is that the target components with gradient concentration was prepared and sprayed evenly on the tissue sections for further MALDI MSI imaging. And the established standard curve is used to determine the absolute content level (ng/mm2) of target components in the interesting region of tissue sections. This approach has been successfully applied to the discovery of biomarkers (Hulme et al., 2020). Several scholars also properly combine the MALDI MSI imaging and conventional quantitative methods to elucidate the connotation of characteristic compounds (Wang et al., 2021). In this study, the saponin isomers could be efficiently separated and quantified in UHPLC/MS-MS (Fig. S1). The absolute quantitative results of each saponin (Fig. S6) support the relative intensity/mass results from MALDI-TOF MSI.
In addition, MALDI MSI approach provides an ideal tool to visualize the specific biosynthetic pathway of secondary metabolites and their spatial distribution transference (Li et al., 2021; Tong et al., 2022; Zhang et al., 2022). This spatial information involving in the biosynthesis of secondary metabolites would benefit the understanding of the potential functional link among these metabolites (Dong et al., 2020). In this study, the sapogenins and their glycosides with different sugar moieties substitution in AMB and ACGD were visualized with MALDI-TOF MSI for the first time (Figs. 3 and 4). These saponins were mainly distributed in tunic and outer leaf scales and rarely in developing flower bud of ripe AMB and ACGD bulbs. Steroidal saponins are a category of active and functional compounds in these two species (Fig. 5). The present visual ion images results could provide deeper insights to better understand the edible and medicinal benefits of saponins.
Moreover, this is the first time for the structure activity relationship or active soft spots of steroidal saponins in AMB and ACGD towards AA, ADP and collagen-induced platelet aggregation (Fig. 6). Their active characteristics are summarized as follows: (1) for the sapogenins (tigogenin, sarsasapogenin, laxogenin, diosgenin, etc.), the spirostanol saponins with C3-sugar chain displayed potent inhibitory effects, and no significant activity when the absence of sugar substituent at C3 position; (2) for spirostanol saponins in ACGD, increased activity was detected with shortening of C3-sugar substituent; (3) for furostanol saponins in AMB, no changes of the test activity were detected whether or not desaturation between C5 and C6 position, C12 = α-OH or C12 = O; (4) for furostanol saponins in AMB, a slight elevation of test activity was founded when C12 = β-OH, dehydration between C20 and C22 positions, or C25-R configuration; (5) for furostanol saponins in AMB, decreased activity was obtained when a double bond between C25 and C27 positions; (6) for furostanol saponins in AMB, a significant increase of activity when saponins with 5β-H and C3-gal-glc than those with 5α-H and C3-gal-glc-glc-glc. The general feature was that spirostanol saponins exhibited stronger inhibitory effects than furostanol saponins.
5 Conclusion
In summary, this study finished the metabonomic analysis and found 53 differential saponins between AMB and ACGD samples by UHPLC/MS-MS. Further, visual spatial distribution of these variables was investigated by MALDI-TOF MSI approach for the first time. The steroidal saponins were mainly distributed in outer leaf scale and tunic of AMB bulbs, while they were founded in whole tunic and leaf scales and rarely in developing flower buds. In addition, comparative analysis of absolute content levels of these saponins in these two species were performed by UHPLC/MS-MS. Moreover, the structure activity relationship of these saponins towards platelet aggregation inhibitory activity by AA, ADP, and collagen were summarized for the first time. Taken together, the present works investigated the similarities and differences of steroidal saponins in chemical profiles, spatial distribution, content levels, and activity evaluation between these two species. This study would benefit the further and deeper functional characterization of AMB and ACGD.
Author contributions
Zifei Qin and Jing Yang conceived and designed the experiments. Shuyi Duan and Xinqiang Li performed the experiments. Shuyi Duan, Zhihong Yao and Xiaojian Zhang analyzed the data. Shuyi Duan, Jing Yang, Zifei Qin and Xinsheng Yao wrote and revised the paper. All authors have read and agreed with the manuscript.
Acknowledgements
This study was financially supported by the National Key R&D Program of China (2020YFC2008300 and 2020YFC2008304), Young Elite Scientists Sponsorship Program by Henan Association for Science and Technology (2022HYTP045). The authors would thank Wuhan Metware Biotechnology Co. Ltd. for their contribution and assistance in this study.
Declaration of Competing Interest
The authors declare that they have no known competing financial interests or personal relationships that could have appeared to influence the work reported in this paper.
References
- Spatial Metabolomics and Imaging Mass Spectrometry in the Age of Artificial Intelligence. Annu. Rev. Biomed. Data Sci.. 2020;3(1):61-87.
- [CrossRef] [Google Scholar]
- AOAC International, 2002. AOAC Guidelines for Single-Laboratory Validation of Chemical Methods for Dietary Supplements and Botanicals. Gaithersburg, MD, 1-38.
- New Steroidal Glycosides Isolated as CD40L Inhibitors of Activated Platelets. Molecules. 2010;15(7):4589-4598.
- [CrossRef] [Google Scholar]
- Systematics of disjunct northeastern Asian and northern North American Allium (Amaryllidaceae) Botany. 2012;90(6):491-508.
- [CrossRef] [Google Scholar]
- Integrated approach on UPLC-QTOF/MS based active plasma component and metabolomics analysis of Gan Mai Da Zao decoction on the treatment of Alzheimer's disease in rats plasma and urine. Arab. J. Chem.. 2022;15(7):103879
- [CrossRef] [Google Scholar]
- High mass resolution, spatial metabolite mapping enhances the current plant gene and pathway discovery toolbox. New Phytol.. 2020;228(6):1986-2002.
- [CrossRef] [Google Scholar]
- Duke, 2021. Dr. Duke's Phytochemical and Ethnobotanical Databases. https://data.nal.usda.gov/dataset/dr-dukes-phytochemical-and-ethnobotanical-databases.
- Effect of Furostanol Saponins from Allium Macrostemon Bunge Bulbs on Platelet Aggregation Rate and PI3K/Akt Pathway in the Rat Model of Coronary Heart Disease. Evid. Based Complement. Alternat. Med.. 2019;2019:9107847.
- [CrossRef] [Google Scholar]
- Comparative study on the composition of free amino acids and derivatives in the two botanical origins of an edible Chinese herb “Xiebai”, i.e., Allium chinense G. Don and Allium macrostemon Bunge species. Food Res. Int.. 2018;106:446-457.
- [CrossRef] [Google Scholar]
- Study on the active spirostanol saponins of Gualou xiebai baijiutang. Yao xue xue bao = Acta Pharm. Sin.. 2003;38(6):433-437.
- [CrossRef] [Google Scholar]
- Quality analysis combined with mass spectrometry imaging reveal the difference between wild and cultivated Phyllanthus emblica Linn.: From chemical composition to molecular mechanism. Arab. J. Chem.. 2022;15(6):103790
- [CrossRef] [Google Scholar]
- Microbiome-derived carnitine mimics as previously unknown mediators of gut-brain axis communication. Sci. Adv.. 2020;6(11):eaax6328.
- [Google Scholar]
- Allimacrosides A-E, new steroidal glycosides from Allium macrostemon Bunge. Steroids. 2017;118:41-46.
- [CrossRef] [Google Scholar]
- Unveiling spatial metabolome of Paeonia suffruticosa and Paeonia lactiflora roots using MALDI MS imaging. New Phytol.. 2021;231(2):892-902.
- [CrossRef] [Google Scholar]
- Metabonomic analysis of Allium macrostemon Bunge as a treatment for acute myocardial ischemia in rats. J. Pharm. Biomed. Anal.. 2014;88:225-234.
- [CrossRef] [Google Scholar]
- Study on flavonoid and bioactivity features of the pericarp of Citri Reticulatae ‘chachi’ during storage. Arab. J. Chem.. 2022;15:103653
- [CrossRef] [Google Scholar]
- Allium macrostemon Saponin Inhibits Activation of Platelet via the CD40 Signaling Pathway. Front. Pharmacol.. 2021;11:570603
- [CrossRef] [Google Scholar]
- Spirostanol saponins from Ypsilandra parviflora induce platelet aggregation. Steroids.. 2017;123:55-60.
- [CrossRef] [Google Scholar]
- Xuezhitong capsule, an extract of Allium macrostemon Bunge, exhibits reverse cholesterol transport and accompanies high-density lipoprotein levels to protect against hyperlipidemia in ApoE(-/-) mice. Ann. Transl. Med.. 2019;7(11):239.
- [Google Scholar]
- Inhibition of Platelet Activation and Aggregation by Furostanol Saponins Isolated From the Bulbs of Allium macrostemon Bunge. Am. J. Med. Sci.. 2012;344(4):261-267.
- [CrossRef] [Google Scholar]
- Two new steroidal saponins from Allium macrostemon. Yao xue xue bao = Acta Pharm. Sin.. 1992;27(12):918-922.
- [CrossRef] [Google Scholar]
- Studies on two new furostanol glycosides from Allium macrostemon Bunge. Yao xue xue bao = Acta Pharm. Sin.. 1993;28(7):526-531.
- [CrossRef] [Google Scholar]
- Furostanol glycosides from bulbs of Allium Chinese. Phytochemistry. 1996;41(1):283-285.
- [CrossRef] [Google Scholar]
- Study on chemical profiles and metabolites of Allii Macrostemonis Bulbus as well as its representative steroidal saponins in rats by ultra-performance liquid chromatography coupled with quadrupole time-of-flight tandem mass spectrometry. Food Chem.. 2016;192:499-515.
- [CrossRef] [Google Scholar]
- Quantification and semiquantification of multiple representative components for the holistic quality control of Allii Macrostemonis Bulbus by ultra high performance liquid chromatography with quadrupole time-of-flight tandem mass spectrometry. J. Sep. Sci.. 2016;39(10):1834-1841.
- [CrossRef] [Google Scholar]
- Diagnostic ion-oriented identification and simultaneous quantification of chemical components in Allium chinense G. Don. J. Sep. Sci.. 2018;41(23):4253-4271.
- [CrossRef] [Google Scholar]
- Qualitative and quantitative analysis of multi-components in Xing-Su-Ning Capsules for quality improvement. Arab. J. Chem.. 2022;15:103825
- [CrossRef] [Google Scholar]
- Chinese onion (Allium chinense), an evergreen vegetable: A brief review. Pol. J. Agron.. 2020;42:40-45.
- [Google Scholar]
- Biosynthesis-based spatial metabolome of Salvia miltiorrhiza Bunge by combining metabolomics approaches with mass spectrometry-imaging. Talanta.. 2022;238(Pt2):123045
- [CrossRef] [Google Scholar]
- Anti-colorectal cancer activity of macrostemonoside A mediated by reactive oxygen species. Biochem. Biophys. Res. Commun.. 2013;441(4):825-830.
- [CrossRef] [Google Scholar]
- Visualizing the distribution of strawberry plant metabolites at different maturity stages by MALDI-TOF imaging mass spectrometry. Food Chem.. 2021;345:128838
- [CrossRef] [Google Scholar]
- Novel effects of macrostemonoside A, a compound from Allium macrostemon Bung, on hyperglycemia, hyperlipidemia, and visceral obesity in high-fat diet-fed C57BL/6 mice. Eur. J. Pharmacol.. 2008;599(1–3):159-165.
- [CrossRef] [Google Scholar]
- Phytochemistry and pharmacology of Allii Macrostemonis Bulbus, a traditional Chinese medicine. Chin. J. Nat. Med.. 2016;14(7):481-498.
- [CrossRef] [Google Scholar]
- Stereoselective toxicity mechanism of neonicotinoid dinotefuran in honeybees: New perspective from a spatial metabolomics study. Sci. Total Environ.. 2022;809:151116
- [CrossRef] [Google Scholar]
- Macrostemonoside A Promotes Visfatin Expression in 3T3-L1 Cells. Biol. Pharm. Bull.. 2007;30(2):279-283.
- [CrossRef] [Google Scholar]
Appendix A
Supplementary data
Supplementary data to this article can be found online at https://doi.org/10.1016/j.arabjc.2022.104138.
Appendix A
Supplementary data
The following are the Supplementary data to this article:Supplementary data 1
Supplementary data 1


