

Translate this page into:
Volatile characterization of crude and refined walnut oils from aqueous enzymatic extraction by GC-IMS and GC-MS
⁎Corresponding authors at: School of Food and Health, Beijing Technology and Business University, No. 33 Fu Cheng Road, Beijing 100048, People’s Republic of China (Y. Jia) Hebei Yangyuan Zhihui Beverage Co., Ltd., New Zone 6 Road Fuyang 4 Road, North District of Hebei Hengshui Economic Development Zone, Hengshui 053000, China (J. Xia). yangyuanshengjibu@hbyangyuan.com (Junxia Xia), jiayingmin@btbu.edu.cn (Yingmin Jia)
-
Received: ,
Accepted: ,
This article was originally published by Elsevier and was migrated to Scientific Scholar after the change of Publisher.
Abstract
The aroma characteristics of crude walnut oil (CWO) and soft-refined walnut oil (RWO) were analyzed using gas chromatography-ion mobility spectrometry (GC-IMS) and headspace gas chromatography-mass spectrometry (HS-SPME-GC-MS). CWO was obtained from walnut samples of seven varieties in Yunnan using aqueous enzymatic extraction (AEE), while RWO was produced by deacidifying and dehydrating CWO. Comprehensive analyses using both GC-IMS and HS-SPME-GC-MS were performed to discern the volatile compounds in CWO and RWO. Chemometric techniques including hierarchical clustering analysis (HCA), principal component analysis (PCA), stepwise linear discriminant analysis (PLS-DA), and orthogonal partial least square discriminant analysis (OPLS-DA) were employed for the characterization and classification of the oils. The results indicated that GC-IMS served as an excellent complementary technique to GC-MS for aroma characterization. Additionally, PLS-DA was found to be effective for categorizing walnut oil based on HS-GC-IMS. Through GC-MS and OPLS-DA, a clear distinction between CWO and RWO samples was established. The outcomes indicated that both CWO and RWO contained distinct volatile compounds, and the refining process impacted the composition of volatile compounds in the oils. This research sheds light on the volatile substances in walnut oils and their changes during the refining process, enhancing insights into moderate processing of walnut oil.
Keywords
Walnut oil
GC-MS
GC-IMS
Volatile compounds
Chemometric analysis

1 Introduction
Juglans regia L., commonly known as walnut, is a significant woody oil tree species of the Juglandaceae family in China. China is recognized as the world's primary walnut producer, contributing 33 % of global production in 2020, as per FAO (Food and Agriculture Organization of the United Nations) statistics. Yunnan province, a crucial production region, accounts for 30 % of China's overall walnut production (Gao et al., 2019). Walnuts are renowned for their rich nutritional profile and health benefits (Ni et al., 2021). Scholars have concentrated on studying the functional properties and nutritional advantages of walnut, including antioxidant and anticancer activities, as well as their potential to reduce cardiovascular risk (Catanzaro et al., 2018; Chauhan & Chauhan, 2020; Ros et al., 2018).
In the realm of walnut oil extraction, traditional methods of extracting crude walnut oil (CWO), such as mechanical pressing, supercritical CO2 extraction, and organic solvent extraction, have encountered challenges due to high pressure, temperature requirements and the toxic effects of solvents (Ferreira et al., 2022; Rébufa et al., 2022). As an eco-friendly approach, aqueous enzymatic extraction (AEE) is suggested as a method that utilizes water as the extraction solvent and operates under relatively mild conditions (Xu et al., 2021). AEE has shown promise in preserving the original composition of flavor compounds and improving the extraction of beneficial compounds, rendering it an appealing choice for the production of premium-quality edible oils (Ma et al., 2022; Hu et al., 2020). Refined walnut oil (RWO) is produced by eliminating unwanted substances such as waxes, free fatty acids, and pigments from CWO. Recent consumer preferences lean towards virgin oils, which preserve the authentic taste, aroma, and nutrients of the raw materials. While refining is deemed essential for many oils, it comes with certain disadvantages (Zhou et al., 2023). The refining process involves high temperatures, leading to the release of numerous volatile compounds from the oil, altering its aroma.
Aroma compounds play a pivotal role in evaluating food quality. Recently, there has been a preference for virgin oils as they retain the raw materials' tastes, smells, and nutrients. To characterize, classify, and detect adulteration in walnut and walnut oil, volatile profiles have been analyzed using headspace solid-phase microextraction gas chromatography-mass spectrometry (HS-SPME-GC-MS) (Abdallah et al., 2015; Wang et al., 2020). The quality of walnuts and walnut oil is notably impacted by lipid oxidation, which is further exacerbated by external factors and various treatment methods, including thermal treatments and low-temperature storage (Rébufa et al., 2022). Identifying reliable markers for tracking this oxidation is imperative, as noted by Grilo & Wang (2021). Zhou et al. (2018) found that 2-heptenal and 1-octen-3-ol could be utilized as potential indicators of walnut oil quality. Additionally, Kalogiouri et al. suggested an HS-SPME-GC-MS method for evaluating the volatile metabolome and classifying walnut oil from conventional and organic farming. They further introduced the sparse partial least squares-discriminant analysis (sPLS-DA) model to differentiate between varying levels of adulteration (Kalogiouri et al., 2021).
Ion mobility spectrometry (IMS) is a robust analytical techniuqe that operates on gas-phase ions with ultra-high separation precision (Mota et al., 2021; Wang et al., 2020). Currently, HS-GC-IMS is extensively used to oversee vegetable oil refining, identify adulteration, and categorize based on origin and variety (Chen et al., 2019; Contreras et al., 2019). Oil prices can vary depending on their processing techniques and refining degrees. Consequently, effectively differentiating these oils is pivotal for ensuring quality and informing consumers. In efforts to distinguish olive oil varieties, combining IMS with various chemometric tools has shown encouraging outcomes (Contreras et al., 2019; Garrido-Delgado et al., 2011). The integration of mass spectrometry and IMS can significantly improve the overall assessment, even though GC-MS technology seems to be more advanced (Yin et al., 2021). To determine the volatile profile of both cold-pressed oils and hot-pressed walnut oils, comprehensive two-dimensional gas chromatography-olfactory-mass spectrometry and GC-IMS were utilized, revealing specific key aroma-active compounds in these samples (Xu et al., 2023). This analysis uncovered distinct key aroma-active compounds unique to each type of oil. Such insights offer direction for enhancing the quality of walnut oil based on its aromatic properties.
The combination of GC-IMS and GC-MS has revolutionized aroma research (Xi et al., 2024). These techniques provide detailed aroma profiles for various foods. While GC-IMS rapidly traces volatile signatures, emphasizing unique aroma nuances, GC-MS meticulously pinpoints individual compounds. Together, they offer a comprehensive view, vital for assessing product quality, adulteration, and consumer preference. Nevertheless, there is a limited number of studies comparing the volatile characterization of CWO and RWO from AEE using both GC-MS and GC-IMS techniques. The primary goal of this study was to thoroughly investigate the volatile constituents of walnut oils derived from seven different varieties using techniques like HS-SPME-GC-MS and GC-IMS. Additionally, we sought to comprehend the influence of the soft-refining procedure on the aromatic attributes of walnut oils and to distinguish between CWO and RWO through the utilization of various chemometric techniques.
2 Materials and methods
2.1 Materials
During the 2021 harvest season in Yunnan province, China, samples of seven different walnut varieties were collected. Macha and Tongziguo were harvested in October, while Niangqing, Boluoguo, Jidanpi, Dapao, and Santai were collected in September. The corresponding codes for these walnut varieties can be found in Table S1. Petroleum ether (30 to 60 °C), ethyl ether, isopropyl alcohol, phenolphthalein indicator, potassium hydroxide, anhydrous ethanol, sodium sulfate, acetic acid, sodium thiosulfate, and chloroform were sourced from Shanghai Sinopharm Chemical Reagent Company, Ltd. Methanol (HPLC grade) was obtained from Dikma Technologies Inc., USA. Flavourzyme was supplied by LYK Biotech Beijing Co., Ltd., while Alcalase 2.4L alkaline protease was procured from Novozymes China Inc. (Wuxi, China). High-purity nitrogen gas (≥99.999 %) was acquired from Shijiazhuang Xisanjiao Practical Gas Co., Ltd. All reagents were used as received without further processing.
2.2 Instruments
FE 28 pH meter was sourced from Mettler-Toledo Inc., Shanghai, China. BSA224S electronic analytical balance was provided by Sartorius Scientific Instruments (Beijing) Co. LTD. GZX-9030MBE Electric heating air drying oven was obtained from Shanghai Boxun Industry & Commerce Co., Ltd., Shanghai, China. SOX406 Soxhlet extractor was procured from Shandong Hanon Scientific Instrument Co., Ltd., Shandong, China. JMS-130A hydrocolloidal Mill was acquired from Huiyou Machinery Co., LTD, Hebei, China. Model 105 three-roller mill was supplied by Lvyuan Fine Grinding Equipment Co., LTD, Anhui, China. TGL-20000-CR high-speed centrifuge was sourced from Shanghai Anting Scientific Instrument Factory, Shanghai, China. Agilent 8860–5977B gas chromatography-mass spectrometer was produced by Agilent Technologies, Santa Clara, CA, USA. FlavourSpec® was manufactured by G.A.S. Instrument, Shandong Hanon Scientific Instrument Co., Ltd., Shandong, China.
2.3 Preparation of CWO and RWO
Walnuts were soaked in a 0.5 mol/L NaOH solution for 4 min at room temperature, then peeled using a high-pressure water gun at 0.4 MPa for 3 min, and subsequently crushed. The walnut kernel was processed in an anhydrous colloid mill for an initial breakage, and the resulting paste was then subjected to a single pass through a three-roller grinder. For enzymatic hydrolysis, 1.5 kg of crushed samples were combined with water at a solid–liquid ratio of 1:2. The dosages for enzyme preparations were as follows: Flavourzyme was added at 1 ‰ of the walnut mass, and the equivalent proportion was used for Alcalase 2.4L alkaline protease. The enzymatic hydrolysis was carried out at pH 8.0 and 50 °C for 5 h. The enzymolysis product was then centrifuged at 9000 g for 10 min. The extracted walnut oil was weighed and stored in a polypropylene bottle at 4 °C until further analysis.
The refining process was slightly modified from the procedure described by Damiani et al. (2020). Deacidification was a critical step of oil refining that directly influenced the final walnut oil quality (Xin et al., 2022). Initially, 500 mL of CWO was added to a beaker and heated to 40 °C. Subsequently, a 10 % NaOH solution was mixed into the CWO and maintained at a stirring speed of 70 r/min for 0.5 h. The mixture was subsequently heated to 75 °C and stirred at 40 r/min for 15 min. Following this, the deacidified oil was allowed to cool to room temperature before being centrifuged at 9000 g for 10 min. The required amount of the NaOH solution was determined using the formula (1) provided below.
Then, the deacidified oil was vacuum-dried to remove residual moisture at 90 °C and −0.1 MPa for 2 h. The obtained RWO was stored at 4 °C and protected from light.
In order to calculate the oil extraction yield, the following formula (2) was used:
To determine the oil content of the walnut kernel, the Soxhlet extraction method was utilized in accordance with the Chinese National Standard GB 5009.6–2016. The acid value (AV) and peroxide value (PV) of CWO and RWO, recognized as essential indicators of oil quality, were assessed in accordance with Chinese National Standards GB 5009.229–2016 and GB 5009.227–2016, respectively.
2.4 Volatile components analyzed by GC-MS
The methodology used to analyze the volatile components of walnut oil was based on the approach outlined by Kalogiouri et al. (2021), with minor modifications. For the HS-SPME procedure, 1 mL of walnut oil was mixed in a 15 mL headspace flask and allowed to equilibrate at 60 °C for 40 min with magnetic stirring at 300 rpm. A 50/30 µm DVB/CAR/PDMS solid-phase microextraction head was adsorbed at 40 °C for 30 min. The GC-MS analysis was conducted using an HP-5MS column (30 m × 0.32 mm × 0.25 µm), with high-purity helium (99.999 %) used as the carrier gas at a flow rate of 1.0 mL/min in splitless mode. The inlet temperature was maintained at 270 °C, and the heating program began at 35 °C for 5 min, followed by a temperature increase at 3 °C/min to 100 °C for 4 min. Subsequently, the temperature was raised at 5 °C/min to 250 °C and held for 5 min. The ion source temperature and quadrupole temperature were set to 250 °C and 150 °C, respectively. The mass scanning was carried out in the m/z 35–350 range, and the volatile components were identified using the NIST 17 Standard Reference Database. Compounds with similarity values above a threshold were screened, with citronellol used as the internal standard in the experiment. The internal standard approach was employed to determine the relative content of each volatile component.
2.5 GC-IMS analysis
An oil sample of 1 mL was placed into a 20 mL headspace vial and subjected to equilibration at 90 °C for 10 min at a shaker speed of 500 rpm. An injection volume of 200 µL was used with an injector temperature of 95 °C. The GC-IMS flavor analyzer (FlavourSpec ®) with a WAX column (30 m × 0.53 mm, 1.0 µm film thickness) was employed for the separation, and the column temperature was maintained at 40 °C. High-purity nitrogen gas (99.999 % purity) served as the carrier gas under the following programmed flow: 2 mL/min holding for 2 min, gradually increased from 2 mL/min to 10 mL/min within 8 min, then from 10 mL/min to 100 mL/min within 10 min, and maintained at 100 mL/min for the next 20 min. The drift gas (high-purity nitrogen gas) was set to 150 mL/min, and the IMS detector temperature was set at 45 °C. The NIST library and IMS library were employed to identify differences among the oil samples.
2.6 Data analysis
The presented data consists of mean values and corresponding standard deviations obtained from at least two independent measurements. Statistical significance was determined at a significance level of p < 0.05. The HCA was performed using Origin 2021 software (Origin Lab). The multivariate data analysis, including PCA (principal component analysis), PLS-DA (partial least squares-discriminant analysis), and OPLS-DA (orthogonal projections to latent structures-discriminant analysis), was conducted using SIMCA-P software (version 14.1, Umetrics).
3 Results and discussion
3.1 Quality comparison of CWO and RWO obtained by AEE
The present study utilized Flavourzyme and alkaline protease-assisted AEE to obtain CWO. The low oil yield in AEE oil production, mainly attributed to insufficient cell wall breakdown and incomplete liberation of fat from plant cells, represents a significant challenge in commercial production (Li et al., 2016). To address this issue, it was essential to reduce both the particle size of the material and the emulsification during the process. Walnuts were prepared by soaking, peeling, and mechanical processing, followed by a 5-hour enzymatic hydrolysis at 50 °C using Flavourzyme and alkaline protease. Anhydrous colloid grinding and three cylindrical roll crushers were employed to process the walnut kernel, resulting in the destabilization of the cream emulsion through enzymatic treatment and the release of oil droplets into water (Li et al., 2016). After 5 h of enzymatic hydrolysis, the mean yield of CWO from the seven cultivars studied was 87.3 %, as shown in Table S1. This suggested that the combined use of Flavourzyme, alkaline protease, and the mechanical processing methods was effective in maximizing oil extraction (Ferreira et al., 2022).
The assessment of oil quality often relies on the AV and PV. The highest AV and PV for CWO, as shown in Table S1, were recorded as 0.94 mg/g and 0.15 g/100 g, respectively. However, these values were lower than the Chinese National Standard (GB/T 22327–2019) for second-class walnut oil and the limit specified in the Chinese National Standard (GB 2716–2018). Conversely, the mean water content of CWO obtained was 0.15 %, exceeding the permissible threshold of 0.1 %. Excess moisture can lead to a shorter shelf life and potential microbial growth, possibly necessitating further dehydration. Previous research (Sorita et al., 2023) has demonstrated that AEE-derived walnut oil exhibits superior oxidative stability and overall quality compared to traditionally extracted oils. Crude oil derived from AEE requires less refining, and the protein can be easily recycled (Balvardi et al., 2015). The degree of refinement significantly influences the final quality of walnut oil. Two crucial steps in the oil-refining process are deacidification and dehydration, both of which directly influence the quality of the final walnut oil. The deacidification process dramatically reduced the AV of CWO, with an average AV reduction of RWO to 0.05 mg/g, while there was no significant change in the PV of RWO, with an average value of 0.15 g/100 g. High moisture content in walnut oil can lead to rancidity and unpleasant odors and flavors. The dehydration step successfully reduced the average moisture content of walnut oil to 0.08 %. The findings underscore the essential nature of these refining procedures in the quest for a high-quality walnut oil product (Wen et al., 2023).
Refining vegetable oil can extend its shelf life, but this process has some disadvantages, including nutrient depletion and the production of unwanted compounds (Gharby, 2022). Numerous studies have aimed to investigate the effects of refining on the nutrient content of oils (Cavanna et al., 2020; Tata et al., 2022). Despite the significance of the oil aroma, few studies have focused on the effects of the refining process on it (Kesen et al., 2022). This study aims to investigate the effects of the soft-refining process on the aroma of walnut oils.
3.2 Comparison of volatile compounds in walnut oil identified by GC-MS and GC-IMS
The volatile components of CWO and RWO were analyzed using HS-SPME-GC-MS and GC-IMS. These methods exhibited varying abilities in identifying volatile compounds in walnut oil. By employing GC-MS, 66 volatile components were identified in seven categories, including alcohols, aldehydes, ketones, alkenes, and esters, within the CWO and RWO of seven walnut oil samples (Table S2, Fig. 1). On the other hand, HS-GC-IMS identified 52 chemicals (Table S3). Both HS-SPME-GC-MS and HS-GC-IMS identified a total of 13 common compounds, such as benzaldehyde, 2-heptanone, heptanal, 1-hexanol, 3-methylbutyl acetate, nonanal, D-limonene, (E)-2-heptenal, 1-octen-3-one, hexanal, (E)-2-hexenal, 1-pentanol, and α-pinene, as shown in Fig. 1A.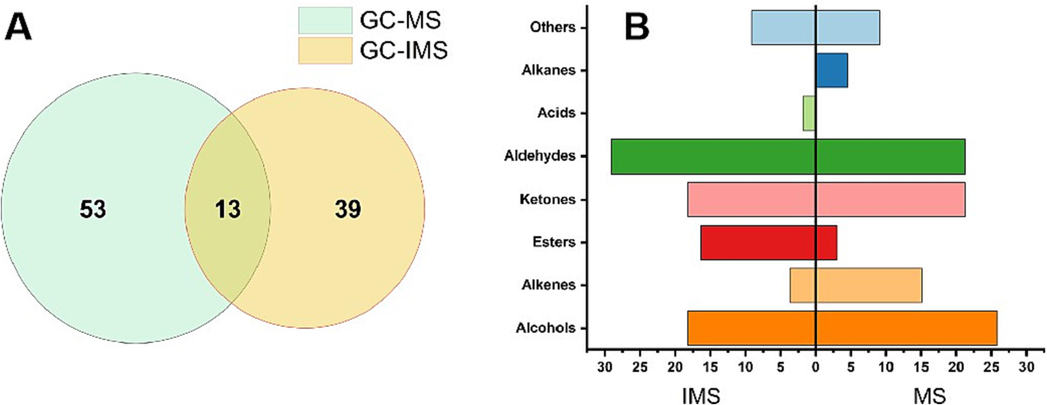
Comparison of Venn diagrams of volatile compounds analyzed using GC–MS and GC-IMS (A). Comparison of pyramid diagrams of relative contents of volatile compounds identified by GC–MS and GC-IMS (B).
GC-MS analysis revealed differences in the relative levels of various volatile compounds, including alcohols, aldehydes, ketones, alkenes, alkanes, and esters (Fig. 1B), consistent with prior studies (Hao et al., 2020; Natasa et al., 2021). Alcohols, aldehydes, ketones, and alkenes were identified as the major constituents, constituting 83.3 % of the volatile compounds found in walnut oil samples. On the other hand, GC-IMS rapidly captures volatile fingerprints, highlighting distinctive aromas (mainly aldehydes, alcohols, ketones, and esters as shown in Fig. 1B) in walnut oil samples. The integration of GC-IMS and GC-MS technologies provides a comprehensive approach to exploring the aroma of walnut oil (Xi et al., 2024). GC-IMS possesses the ability to detect volatile components with smaller molecular weight due to its fast response and ultra-high sensitivity. According to Cai et al. (2022), GC-IMS exhibits a higher affinity for molecules with strongly electronegative or proton-affinity functional groups. However, as an emerging technique, IMS has an incomplete database. In this study, IMS detected a total of 134 peaks (refer to Fig. S2-S3), of which 71 peaks for 52 compounds were identified using the NIST library (Table S3). These findings underscore the value of GC-IMS as a complementary technique to GC-MS in comprehensive characterization of the aroma in samples (Chen et al., 2021).
3.3 Characterization and classification of CWO and RWO by GC-MS
In order to observe the differences of volatile profile between CWO and RWO, we determined the relative content of volatile compounds in both types of walnut oil using GC-MS (Table S4). The refining process led to a significant reduction in the level of volatiles. The average aldehyde content decreased from 35328.34 µg/L to 7756.39 µg/L, with (E)-2-heptenal, hexanal, benzaldehyde, and nonanal being the most abundant. Given the recognized low sensory thresholds of aldehydes, they significantly influence the overarching aroma profile of walnut oil. Their formation is primarily attributed to the Maillard reaction and Strecker oxidative degradation (Hao et al., 2020). Diving deeper into specific volatile constituents, Xu et al. (2023) identified n-pentane, nonanal, and (E, E)-2,4-decadienal as the predominant volatile components in CWO. Concurrently, another scholarly exploration discerned hexanal and 2-heptenal as the predominant compounds in CWO across three distinct cultivars, namely Santai, Xiangling, and Qingxiang (Zhou et al., 2018). Table S4 shows that the hexanal content in RWO (average 1388.71 µg/L) was significantly lower than in CWO (average 8748.76 µg/L). Hexanal, characterized by a fresh, green, fatty, aldehydic, grassy, leafy, and fruity aroma, is an oxidation product of linoleic acid (Mu et al., 2019). (E)-2-Heptenal was the most abundant volatile compound in C3, C5, and C6, while hexanal prevailed in other samples. These results suggested that high-temperature pretreatment may lead to an increase in the amount of (E)-2-heptenal (Bi et al., 2022), with cultivar variations also playing a significant role in determining the volatile characteristics of walnut oil.
Alcohol is a crucial component of walnut oil aroma, primarily resulting from the breakdown of fatty acids. Among the alcohols, 1-hexanol, characterized by its herbal aroma (Natasa et al., 2021), dominated in CWO. Hao et al. found that 1-hexanol accounted for a large proportion of the alcohol family in raw and processed walnuts (Hao et al., 2020). Additionally, 1-octen-3-ol has been identified as a potential quality indicator for walnut oil (Mu et al., 2019). The higher 1-octen-3-ol in J1, J2 and J7 compared to CWO may be attributed to the oxidation of linoleic acid (Grilo & Wang, 2021). D-limonene, known for imparting a lemon flavor, is an important flavor component in foods (Grilo and Wang, 2021; Grosso et al., 2018). A previous study suggested that the content of D-limonene decreases after hot air drying and baking (Hao et al., 2020). Corroborating this, our analysis revealed a decline in the D-limonene content in CWO post-refinement, which could be attributed to the elevated temperatures facilitating the release of D-limonene. Additionally, 1-octen-3-one with an odor threshold of 10 µg/kg may also contribute to a distinctive oil flavor (Grilo & Wang, 2021).
Based on the quantitative analysis of detected volatile compounds, both PCA and HCA were employed to investigate the similarities and differences among volatile compounds present in various walnut oils. The hierarchical clustering heatmap was generated to elucidate the distribution and relative abundances of volatile components within CWO and RWO samples. The hierarchical clustering was executed using Euclidean distance and the Ward algorithm. In the clustering heatmap, the transition from green to red signifies relative intensity changes from low to high. As demonstrated in the cluster heatmap (Fig. 2), the 66 volatile components were categorized into three primary categories. (E)-2-Heptenal stood out distinctly from the other volatile components. Nonanal, D-limonene, benzeneacetaldehyde, (E,E)-2,4-heptadienal, 2,7-dimethyl-4,5-octanediol, 1-octen-3-one, hexanal, benzaldehyde, 1-octen-3-ol, and 1-hexanol were situated in another category, in proximity to (E)-2-heptenal. The 14 walnut oil samples were divided into three primary categories as well. The first category comprised eight distinct oil samples, labeled J1, J2, J3, J4, J5, J6, J7, and C1. The second category included four different oil samples, namely C2, C7, C3, and C4. The third group consisted of two oil samples (C5 and C6). An intricate interplay of factors delineates the aroma differences between CWO and RWO. Predominantly, aroma compounds synthesized through Maillard reactions, lipid oxidation processes, sugar decomposition, and protein degradation play pivotal roles in this differentiation (Xu et al., 2023). The results from hierarchical clustering demonstrated that there were no significant differences in volatile profiles between C1 and RWO samples.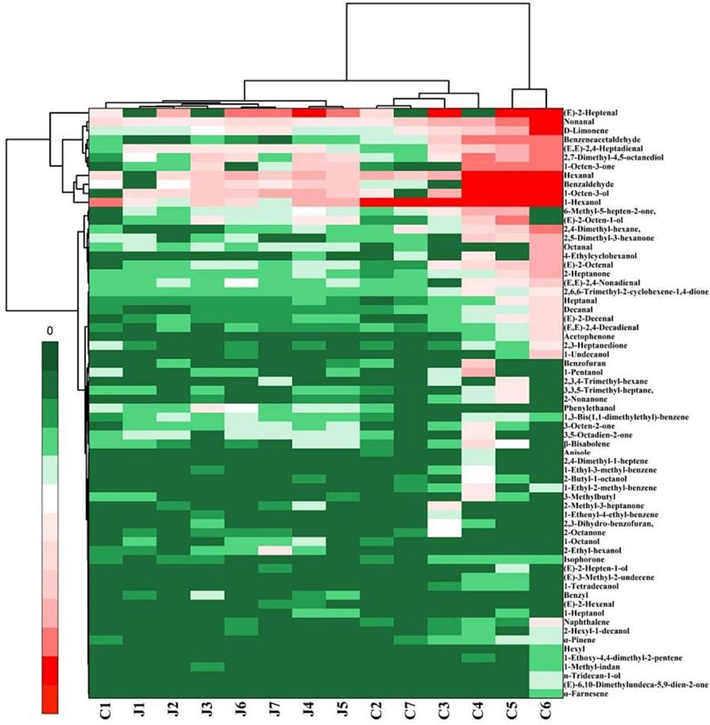
Hierarchical clustering of volatile components detected by GC–MS.
Using SIMCA-P, we undertook PCA on the GC-MS data to elucidate the distribution patterns of the volatile components. As an unsupervised pattern recognition approach, PCA serves to distill a plethora of indicators into a concise set of comprehensive ones. The R2X values of the first two principal components were 0.631 and 0.212, indicating a good fit for the model. However, the PCA model was incapable of categorizing the samples into distinct groups according to refining grade, with a Q2(cum) value of 0.27, as depicted in Fig. S1A.
To further enhance discrimination, we employed supervised chemometric techniques, namely PLS-DA and OPLS-DA. The PLS-DA model was applied to all volatile components, demonstrating improved discrimination compared to PCA (Fig. S1B). Component 1 accounts for 16.8 % of the total variance, while component 2 accounts for 35.6 % of the total variance. This analysis allowed for the clear differentiation of RWO samples from CWO. However, it's worth noting that the dispersion among CWO samples was higher than that among RWO samples. The OPLS-DA biplot, visually presented in Fig. 3, distinctly separated CWO and RWO into two groups. Several markers were suggested as significant for sample classification, with VIP (Variable Importance in Projection) score exceeding 1.2. These markers included 1-hexanol, phenylethanol, benzeneacetaldehyde, α-pinene, (E)-2-hexenal, isophorone, and 2,4-dimethyl-hexane.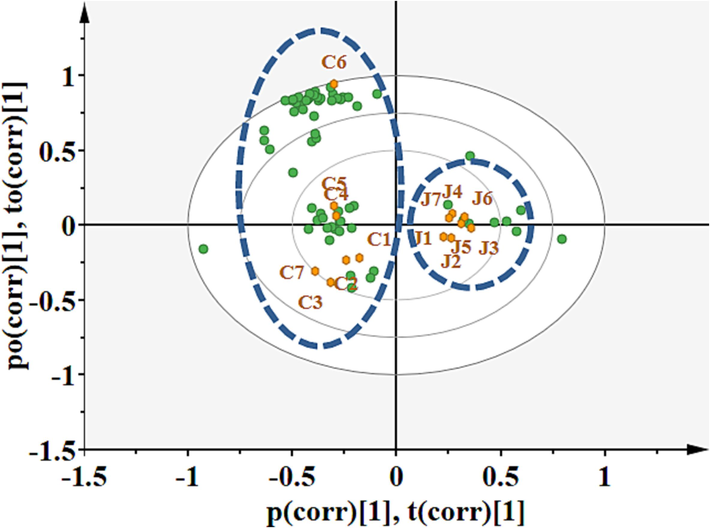
OPLS-DA bi-plot based on volatile components analyzed by GC–MS of CWO and RWO.
3.4 Characterization and classification of CWO and RWO by GC-IMS
The variations in volatile compounds in walnut oil before and after refining were examined using HS-GC-IMS. To effectively compare the differences among diverse samples, topographic difference plots were employed (Fig. 4). These plots utilize the corresponding RWO plot as a reference for deduction. In the plots, red spots indicated that the content of the compounds exceeded that of the reference sample, with darker red hues representing higher content. Conversely, blue dots signify that the compound concentration is lower than that of the reference samples, with darker blue shades indicating lower sample content. The majority of the red signals (samples C1 to C6) before the refining process appeared around 800 s and 1200 s retention time and had a drift time of 1.0–1.5. However, the red signals for C7 were located within the 200–500 s range compared to J7.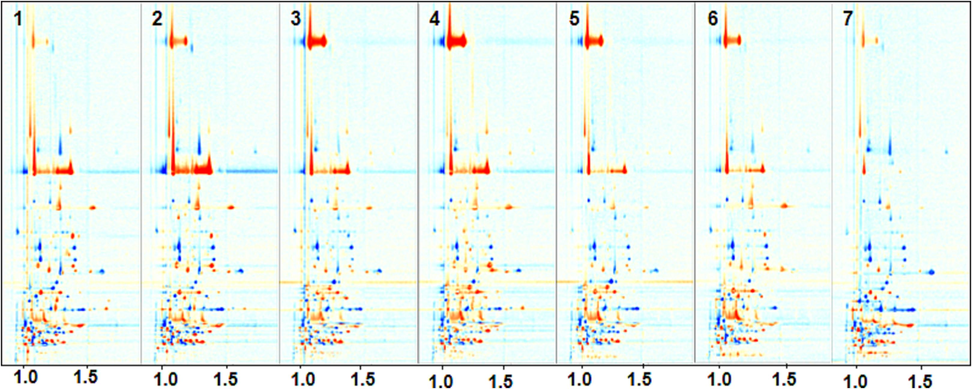
Topographic difference plots of CWO compared to RWO.
Figure S2 provides qualitative results of the IMS, with various substances being analyzed and identified based on the retention time and migration time of each material signal. The identification results for the 71 absorption peaks in the spectrum are displayed in Table S3, where M, D, and P represent monomer, dimer, and trimer, respectively. The retention time and drift time corresponding to the characteristic peaks of GC-IMS can be employed for qualitative analysis. Xu et al. (2023) found 46 signal peaks for 36 compounds in pressed walnut oil by GC-IMS, which differs from the findings presented here. This discrepancy may be attributed to variations in cultivar and different process parameters.
CWO and RWO possess distinct quality characteristics and unique aroma profiles. To provide a clear visual distinction between the volatiles that contribute to the aroma of walnut oil, we employed a gallery plot to analyze the fingerprint profiles of CWO and RWO samples. Despite differences in raw materials, a comparative analysis of walnut oil fingerprints obtained through two processing methods for seven varieties reveals the presence of common volatile organic compounds in both methods of oil production (Fig. S3). Seven CWO samples contain acetic acid, 3-hydroxy-2-butanone, 3-methyl-1-butanol, and 2-methyl-1-butanol as distinguishing components. On the other hand, (E)-2-hexenal, (E)-2-heptanenal, and (E)-2-pentanal are commonly found in RWO. It is known that ketones, especially in walnut oil, arise chiefly from thermal oxidative degradation of polyunsaturated fatty acids and the catabolism of amino acids (Li et al., 2022). Delving into the GC-MS analysis complemented by flavor dilution factor evaluation, as presented by Xu et al. (2023), it was discerned that 3-methyl-2-butanone held a paramount influence over the aroma profile of CWO.
To delve deeper into the aroma profile variations across different walnut oil cultivars, we generated a gallery plot depicting the volatile organic compounds in both CWO and RWO, as shown in Fig. 5. This visualization aids in discerning the disparities in volatile organic compounds and their signature flavor molecules across the samples. The characteristic compounds of C7, including ethyl pentanate, butyl acetate, and three unidentified compounds, were identified in the first red compartment (1) (Fig. 5A). The region 2 highlighted the characteristic organic compounds of C6, including methyl 2-methylbutanoate, dimethyl sulfide, pentanal, hexanal, and 2-heptanone, among others. In the red compartment designated 3, (E)-2-heptenal was identified as the most important C5 marker compound. C4 crude oil exhibited notably higher concentrations of 2-methyl-1-propanol, acetic acid, butanol, 1-octene-3-one, and ethyl butyrate than other types of crude oil. Region 7 was identified as containing characteristic C3 volatile compounds, such as 2-butanol, 1-penten-3-one, and 2-methylpropanal. Region 8 showed that cyclopentanone, 3-hydroxy-2-butanone, and the monomer and dimer of tetrahydrofuran had substantially higher C2 concentrations than the other samples. In region 9, the C1 flavor compounds, including heptanal, diacetyl, isoamyl acetate, and isobutyl acetate, were identified. Moreover, the fingerprint analysis revealed a notable abundance of characteristic volatile flavor compounds in C4 walnut oil compared to other samples, as shown in the results, with higher concentrations of butanal, butan-2-one, and 3-methyl-1-butanol in both C4 and C6 of Area 5, while 3-methyl-2-butenal and 1-penten-3-one exhibited stronger signals in C3 and C4 of Area 6. As shown in Fig. 5B, each oil variety from J1 to J7 is distinguished by its unique compounds. Notably, J4 stands out in area 6, showcasing elevated concentrations of specific compounds, with D-limonene being a prime example, distinguishing it from other samples. A significant observation is the superior aromatic richness of No. 4 oil from Boluoguo when juxtaposed with other varieties. The overlapping feature compounds among different samples may be attributed to the variation in the raw materials' variety (Abdallah et al., 2015).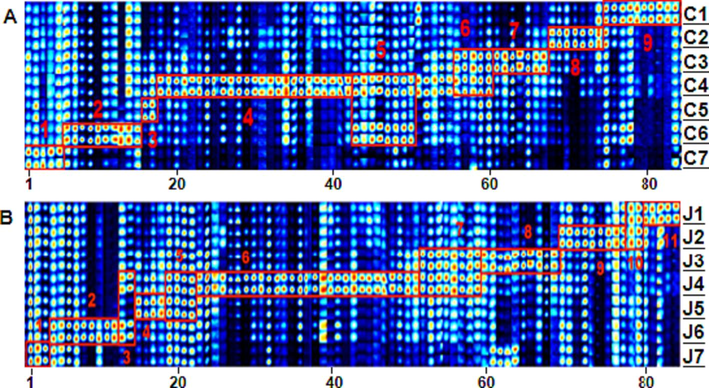
Representative fingerprints of CWO (A) and RWO (B) samples as analyzed by Gallery Plot.
The relative volatile component obtained through GC-IMS was initially subjected to PCA to assess the differences between CWO and RWO. However, PCA did not reveal any clear clustering across samples, likely due to the considerable heterogeneity among the various types (Fig. S4). Consequently, PLS-DA was employed to model the relationships between CWO and RWO. According to the PLS-DA bi-plot, the 14 samples could be distinguished into two separate clusters. Samples C1-C7 were clustered on the positive side, while samples J1-J7 were clustered on the negative side. The loading plot (green dots in Fig. 6) displayed the discriminant volatile compositions responsible for separating the two clusters. Components 1 and 2 accounted for 39.1 % and 24.1 % of the total variance, respectively. The Q2(cum) of the model was 0.96, indicating that the model had good predictive ability. VIP is a weighted sum of squares of the PLS-DA loadings, taking into account the amount of explained Y-variation in each dimension. Generally, variables with VIP > 1 are considered important variables (Shi et al., 2019). Higher VIP value signify more significant difference in the volatile compound among different groups of oils. Among the 29 compounds with VIP values greater than 1 (Fig. S5), the majority were alcohols, aldehydes, ketones, and esters. Notable examples include pentyl acetate, 2-methyl-2-pentenal, ethyl acetate, butyraldehyde, and butanol. Therefore, the PLS-DA model based on HS-GC-IMS has been confirmed as suitable for classifying walnut oil.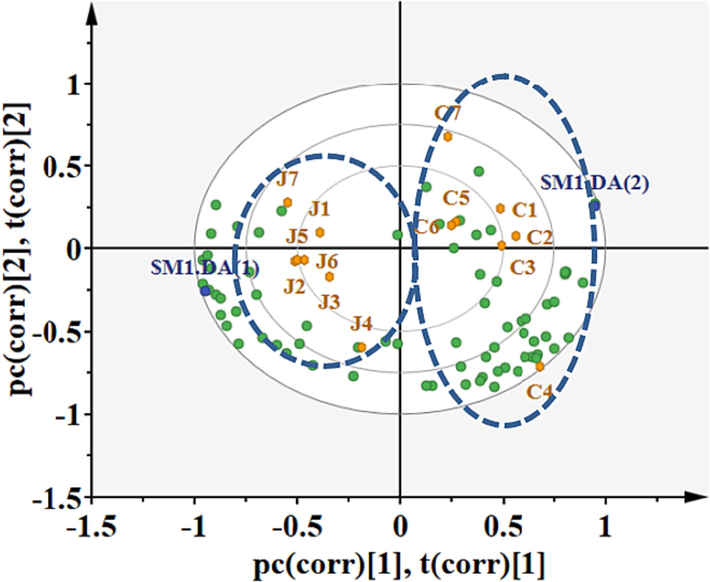
PLS-DA bi-plot based on volatile components from GC-IMS of CWO and RWO.
Both GC-IMS and GC-MS are instrumental in detecting and identifying volatile compounds present in food products (Cecchi et al., 2021). These compounds play a pivotal role in determining the quality, safety, and sensory attributes of the products. GC-IMS offers advantages such as rapid responses, high sensitivity, user-friendly operations, and cost-effectiveness. On the other hand, GC-MS boasts high resolution, precise identification capabilities, and extensive databases. Combining these two techniques is anticipated to yield valuable insights in the realms of food quality assessment, food safety, and contamination analysis (Alikord et al., 2022).
4 Conclusion
This study offered an in-depth investigation into the quality and aroma characteristics of CWO and RWO. By combining GC-MS and GC-IMS techniques, we achieved a holistic assessment of volatile compounds present in both CWO and RWO. GC-MS identified 66 volatile components in 7 categories, primarily alcohols, aldehydes, ketones, alkenes, and esters, in walnut oil samples. The additional insights from GC-MS highlighted its synergistic value alongside GC-MS. It offered a broader perspective by detecting 71 signal peaks corresponding to 52 unique unique chemical compounds. Notably, this dual-technique approach significantly enhanced our knowledge of the diverse range of volatile compounds in walnut oil. HCA, PCA and PLS-DA served as valuable tools for discerning the distinctive features among the walnut oil samples. The data effectively distinguished RWO from CWO, primarily due to the refining process's influence on aroma profiles. Certain marker compounds, such as 1-hexanol, phenylethanol, and (E)-2-hexenal, were crucial in the classification of samples, shedding light on the intricacies of aroma characterization. Importantly, the findings underscore the potential of HS-GC-IMS as a discerning tool for in-depth walnut oil analysis. Future research should explore a broader range of walnut cultivars from different production years and delve into diverse processing techniques to deepen our understanding of walnut oil production and refine the chemometric methods presented in this study.
CRediT authorship contribution statement
Jiankang Deng: Methodology, Investigation, Project administration, Supervision, Writing – review & editing. Huibo Zhao: Methodology, Investigation, Project administration, Supervision, Writing – review & editing. Bing Qi: Methodology, Investigation. Di Wang: Investigation. Yanbing Wu: Investigation. Shengxing Dai: Investigation. Junxia Xia: Project administration, Supervision. Min Lu: Investigation. Kuizhang Yao: Supervision. Aijin Ma: Project administration, Supervision. Yingmin Jia: Project administration, Supervision.
Acknowledgements
This work was supported by the National Key Research and Development Program of China (2022YFD2100805); Hebei Industrial Innovation and Entrepreneurship Team Project (215A7102D); Post-doctoral Research Program of Hebei Province (B2022003050); Academician Workstation and Academy Cooperation Key Units Project from Hebei Science and Technology Department (V1679624813508); Innovation Capability Enhancement Program of Hebei Province (22567667H); Scientific Research Project of Hengshui University (2023ZRZ02).
Declaration of competing interest
The authors declare that they have no known competing financial interests or personal relationships that could have appeared to influence the work reported in this paper.
References
- Content of carotenoids, tocopherols, sterols, triterpenic and aliphatic alcohols, and volatile compounds in six walnuts (Juglans regia L.) varieties. Food Chem.. 2015;173:972-978.
- [CrossRef] [Google Scholar]
- Food safety and quality assessment: comprehensive review and recent trends in the applications of ion mobility spectrometry (IMS) Crit. Rev. Food Sci. Nutr.. 2022;62(18):4833-4866.
- [CrossRef] [Google Scholar]
- Optimization of the aqueous enzymatic extraction of oil from Iranian wild almond. J. Am. Oil Chem. Soc.. 2015;92(7):985-992.
- [CrossRef] [Google Scholar]
- Roasting pretreatment of walnut (Juglans regia L.) Kernels: improvement of the oil flavor profile and correlation with the chemical composition. Food Funct.. 2022;13(21):10956-10969.
- [CrossRef] [Google Scholar]
- Insights into the aroma profile of sauce-flavor baijiu by GC-IMS combined with multivariate statistical analysis. J. Anal. Methods Chem.. 2022;2022:1-14.
- [CrossRef] [Google Scholar]
- Natural products to fight cancer: a focus on Juglans regia. Toxins. 2018;10(11):469.
- [CrossRef] [Google Scholar]
- A non-targeted high-resolution mass spectrometry study for extra virgin olive oil adulteration with soft refined oils: preliminary findings from two different laboratories. ACS Omega. 2020;5(38):24169-24178.
- [CrossRef] [Google Scholar]
- Virgin olive oil volatile compounds: composition, sensory characteristics, analytical approaches, quality control, and authentication. J. Agric. Food Chem.. 2021;69(7):2013-2040.
- [CrossRef] [Google Scholar]
- Beneficial effects of walnuts on cognition and brain health. Nutrients. 2020;12(2):550.
- [CrossRef] [Google Scholar]
- Characteristic fingerprints and volatile flavor compound variations in liuyang douchi during fermentation via HS-GC-IMS and HS-SPME-GC-MS. Food Chem.. 2021;361:130055
- [CrossRef] [Google Scholar]
- Gas chromatography-ion mobility spectrometry detection of odor fingerprint as markers of rapeseed oil refined grade. J. Anal. Methods Chem.. 2019;2019:1-8.
- [CrossRef] [Google Scholar]
- A robustness study of calibration models for olive oil classification: targeted and non-targeted fingerprint approaches based on GC-IMS. Food Chem.. 2019;288:315-324.
- [CrossRef] [Google Scholar]
- GC-IMS and FGC-Enose fingerprint as screening tools for revealing extra virgin olive oil blending with soft-refined olive oils: a feasibility study. Microchem. J.. 2020;159:105374
- [CrossRef] [Google Scholar]
- Green emerging extraction technologies to obtain high-quality vegetable oils from nuts: a review. Innov. Food Sci. Emerg. Technol.. 2022;76:102931
- [CrossRef] [Google Scholar]
- Comparative study of chemical compositions and antioxidant capacities of oils obtained from two species of walnut: Juglans regia and Juglans sigillata. Food Chem.. 2019;279:279-287.
- [CrossRef] [Google Scholar]
- Direct classification of olive oils by using two types of ion mobility spectrometers. Anal. Chim. Acta. 2011;696(1–2):108-115.
- [CrossRef] [Google Scholar]
- Refining vegetable oils: chemical and physical refining. Scientific World Journal. 2022;2022:1-10.
- [CrossRef] [Google Scholar]
- Walnut (Juglans regia L.) volatile compounds indicate kernel and oil oxidation. Foods. 2021;10(2):329.
- [CrossRef] [Google Scholar]
- Antioxidant activity displayed by phenolic compounds obtained from walnut oil cake used for walnut oil preservation. J. Am. Oil Chem. Soc.. 2018;95(11):1409-1419.
- [CrossRef] [Google Scholar]
- HS-SPME GC–MS characterization of volatiles in processed walnuts and their oxidative stability. J. Food Sci. Technol.. 2020;57(7):2693-2704.
- [CrossRef] [Google Scholar]
- Oil extraction from tiger nut (Cyperus esculentus L.) Using the combination of microwave-ultrasonic assisted aqueous enzymatic method - design, optimization and quality evaluation. J. Chromatogr. A. 2020;1627:461380
- [CrossRef] [Google Scholar]
- Exploring the volatile metabolome of conventional and organic walnut oils by solid-phase microextraction and analysis by GC-MS combined with chemometrics. Food Chem.. 2021;363:130331
- [CrossRef] [Google Scholar]
- Comparison of aroma, aroma-active, and phenolic compounds of crude and refined hazelnut oils. J. Am. Oil Chem. Soc.. 2022;99(3):265-275.
- [CrossRef] [Google Scholar]
- Dynamic changes in volatile flavor components during enzymatic hydrolysis of walnut (Juglans regia L.) protein. Sci. Technol. Food Ind.. 2022;43(06):41-49.
- [CrossRef] [Google Scholar]
- Effects of roasting temperatures and grinding type on the yields of oil and protein obtained by aqueous extraction processing. J. Food Eng.. 2016;173:15-24.
- [CrossRef] [Google Scholar]
- Optimization of aqueous enzymatic microwave assisted extraction of macadamia oil and evaluation of its chemical composition, physicochemical properties, and antioxidant activities. Eur. J. Lipid Sci. Technol.. 2022;124(1)
- [CrossRef] [Google Scholar]
- Gas chromatography - mass spectrometry for characterisation, assessment of quality and authentication of seed and vegetable oils. TrAC Trends Anal. Chem.. 2021;138:116238
- [CrossRef] [Google Scholar]
- Study on the volatile oxidation compounds and quantitative prediction of oxidation parameters in walnut (Carya cathayensis Sarg.) oil. Eur. J. Lipid Sci. Technol.. 2019;121(6):1800521.
- [CrossRef] [Google Scholar]
- Exploring the volatile metabolome of conventional and organic walnut oils by solid-phase microextraction and analysis by GC-MS combined with chemometrics. Food Chem.. 2021;363:130331
- [CrossRef] [Google Scholar]
- Exploration of walnut components and their association with health effects. Crit. Rev. Food Sci. Nutr.. 2021;62(19):5113-5129.
- [CrossRef] [Google Scholar]
- Walnut (Juglans regia L.) oil chemical composition depending on variety, locality, extraction process and storage conditions: a comprehensive review. J. Food Compos. Anal.. 2022;110:104534
- [CrossRef] [Google Scholar]
- Beneficial effects of walnut consumption on human health. Curr. Opin. Clin. Nutr. Metab. Care. 2018;21(6):498-504.
- [CrossRef] [Google Scholar]
- A metabolomics-based approach investigates volatile flavor formation and characteristic compounds of the dahe black pig dry-cured ham. Meat Sci.. 2019;158:107904
- [CrossRef] [Google Scholar]
- Aqueous extraction processing: an innovative and sustainable approach for recovery of unconventional oils. Trends Food Sci. Technol.. 2023;133:99-113.
- [CrossRef] [Google Scholar]
- Detection of soft-refined oils in extra virgin olive oil using data fusion approaches for LC-MS, GC-IMS and FGC-Enose techniques: the winning synergy of GC-IMS and FGC-Enose. Food Control. 2022;133:108645
- [CrossRef] [Google Scholar]
- Recent progress in food flavor analysis using gas chromatography–ion mobility spectrometry (GC–IMS) Food Chem.. 2020;315:126158
- [CrossRef] [Google Scholar]
- Edible vegetable oils from oil crops: preparation, refining, authenticity identification and application. Process Biochem.. 2023;124:168-179.
- [CrossRef] [Google Scholar]
- Characterization and metabolism pathway of volatile compounds in walnut oil obtained from various ripening stages via HS-GC-IMS and HS-SPME-GC–MS. Food Chem.. 2024;435:137547
- [CrossRef] [Google Scholar]
- An efficient deacidification process for safflower seed oil with high nutritional property through optimized ultrasonic-assisted technology. Molecules. 2022;27(7):2305.
- [CrossRef] [Google Scholar]
- Comparison of aroma active compounds in cold- and hot-pressed walnut oil by comprehensive two-dimensional gas chromatography-olfactory-mass spectrometry and headspace-gas chromatography-ion mobility spectrometry. Food Res. Int.. 2023;163:112208
- [CrossRef] [Google Scholar]
- Physicochemical properties, fatty acid compositions, bioactive compounds, antioxidant activity and thermal behavior of rice bran oil obtained with aqueous enzymatic extraction. LWT. 2021;149:111817
- [CrossRef] [Google Scholar]
- Application and development trends of gas chromatography–ion mobility spectrometry for traditional chinese medicine, clinical, food and environmental analysis. Microchem. J.. 2021;168:106527
- [CrossRef] [Google Scholar]
- Identification of volatile oxidation compounds as potential markers of walnut oil quality. J. Food Sci.. 2018;83(11):2745-2752.
- [CrossRef] [Google Scholar]
- Electrostatic field as an emergent technology in refining crude oils: a review. Crit. Rev. Food Sci. Nutr.. 2023;1–13
- [CrossRef] [Google Scholar]
Appendix A
Supplementary material
Supplementary data to this article can be found online at https://doi.org/10.1016/j.arabjc.2023.105404.
Appendix A
Supplementary material
The following are the Supplementary data to this article:Supplementary data 1
Supplementary data 1


