

Translate this page into:
Volatilomics for halal and non-halal meatball authentication using solid-phase microextraction–gas chromatography–mass spectrometry
⁎Corresponding author at: Department of Food Science and Technology, IPB University, 16680 Bogor, Indonesia. nancy_dewi@apps.ipb.ac.id (Nancy Dewi Yuliana)
-
Received: ,
Accepted: ,
This article was originally published by Elsevier and was migrated to Scientific Scholar after the change of Publisher.
Abstract
The adulteration of beef meatballs with wild boar (Sus scrova) meat or chicken may be undertaken for economic reasons. This adulteration is a very sensitive issue, particularly for Muslim consumers, as the consumption of wild boar is strictly prohibited by Islamic law. This study aimed to discriminate volatile compounds in meatballs made from beef, chicken, and wild boar and mixtures thereof using solid-phase microextraction–gas chromatography–mass spectrometry (SPME/GC–MS) and multivariate data analysis. SPME is a non-destructive method for the extraction of volatile compounds and does not alter the original chemical composition of the volatiles. A validated partial least squares discriminant analysis (PLS-DA) model with three classes was used to uncover the discriminating volatiles of each type of meatball. The results indicated that β-cymene, 3-methyl-butanal, and 2-pentanol were among the positive discriminating volatiles with the highest variable importance in projection (VIP) values among the chicken meatballs. The highest VIP positive discriminating volatiles in the beef meatballs were 5-ethyl-m-xylene, benzaldehyde, and 3-ethyl-2-methyl-1,3-hexadiene. The mixed meatballs exhibited an interesting profile, with all appearing in the same group as the pure wild boar meatballs. However, the discriminating volatiles derived from a separate PLS-DA model indicated that they contained different compounds. In the pure wild boar meatballs, six compounds (pentanal, 2,6-dimethylcyclohexanone, 1-undecanol, cyclobutanol, 2,4,5-trimethyl-thiazole, and 5-ethyl-3-(3-methyl-5-phenyl pyrazol-1-yl)-1,2,4-triazol-4-amine) were identified as discriminating volatile compounds with the highest VIP values. These compounds were consistently found as significant discriminating volatile compounds in mixture meatballs group although with different VIP value. This research demonstrated that SPME-GC/MS combined with multivariate data analysis was a fast and reliable method for differentiating meatballs made from beef, chicken, and wild boar meat based on their volatile compound contents.
Keywords
Volatiles
Metabolomics
Halal
Meat
Adulteration
PLS-DA

1 Introduction
Beef meatballs are one of the most popular processed meat products in Indonesia. Since beef prices are rather high, meatballs are often adulterated by mixing beef with cheaper meats, such as wild boar (Sus scrova) or chicken, to illegally obtain economic benefits (Guntarti et al., 2017). This adulteration is a disadvantage for consumers, particularly Muslim ones, who are strictly prohibited from consuming wild boar meat. Wild boars are frequently obtained from recreational animal hunting since they are considered pests of plantation crops. They have larger carcass fatness and loin areas, darker meat color, and leaner and less tender meat compared with those of domestic pigs (Sales and Kotrba, 2013). This makes their meat visually more similar to beef.
Fast, sensitive, and affordable analytical methods are necessary to monitor the enforcement of regulations related to meatball consumer protection and support efforts to control the circulation of processed meat products with inappropriate labels. The two most commonly used methods to detect the contamination or adulteration of meat products are polymerase chain reaction (PCR) and enzyme-linked immunosorbent assay (ELISA). PCR is a DNA-based method and has high sensitivity, being able to detect 0.001–0.1 ng DNA from adulterant species (Sultana et al., 2018). Unlike PCR, ELISA uses a specific protein or peptide from each species as a test target. Several other instruments and methods aimed at detecting meat adulterant have also been developed, especially for halal-testing, including liquid chromatography–mass spectrometry (LC-MS) and Fourier transform infrared spectroscopy (FTIR; Kurniawati et al., 2014; Masiri et al., 2016; Rohman et al., 2020; Xu et al., 2012). However, these techniques are not without limitations. In particular, they require rigorous sample preparation and high technical skills, making them less than ideal for routine analysis.
Several previous studies have focused on the profile discrimination of volatiles to assess meat quality. Extracting volatiles from meat can be achieved using several techniques. In one study, 33 volatiles from chicken breast were successfully identified using distillation in dichloromethane (Ayseli et al., 2014). This method has limitations, as it can potentially lead to the loss of thermally unstable compounds. In addition, FTIR coupled with multivariate data analysis has been reported as a rapid and non-destructive yet powerful technique for determining meat types in meatballs (Rahmania et al., 2015). However, the information that can be obtained from FTIR is limited, as the spectra show only absorption bands attributable to the characteristic frequencies of different functional groups. Gas chromatography–mass spectrometry (GC–MS) provides more detailed information, as the spectra exhibit the specific mass spectrum of the compounds present in the samples, which are eluted at different retention times (Sim et al., 2014).
Solid-phase microextraction–GC–MS (SPME/GC–MS) is a rapid and straightforward technique integrating volatile compound extraction and analysis (Wang et al., 2018). Recently, SPME/GC–MS combined with principal component analysis (PCA) and orthogonal partial least squares discriminant analysis (OPLS-DA) was used to assess compounds related to pork volatiles during storage. This method revealed that ethanol, 2,3-butanediol, and 2-ethyl-1-hexanol can potentially serve as indicators of pork quality during storage (Song et al., 2021). A similar technique was used to study discriminating volatiles of minced beef and pork (Pavlidis et al., 2019) and raw and cooked beef (Wang et al., 2018).
The objective of the present work was to determine discriminating volatiles of beef, chicken, wild boar meat, and meatballs made from mixtures thereof. In Indonesia, consumers commonly buy ready-to-cook meatballs rather than raw ones. These meatballs have to be re-boiled for few minutes before they are consumed. Cases of adulteration occur often with these ready-to-cook meatballs and are difficult to trace because the modified meatballs have similar physical appearances to the unmodified ones. SPME/GC–MS combined with PCA and PLS-DA was here used to analyze discriminating volatiles in different types of meatball samples. We used PCA as a first-pass unsupervised tool in our volatilomics data, whereas sample classification patterns in score-space are the sole basis for further analysis using supervised methods, such as PLS-DA (Worley and Powers, 2016). PCA is commonly used to assess classification patterns within data sets containing unlabeled data. In addition to PCA and PLS-DA, soft independent modeling of class analogy (SIMCA) may also be used. SIMCA is a supervised method used to extract features and obtain classification tasks, according to which the training data are labeled, and the method is then separately applied to each data class. SIMCA has been demonstrated to be a superior method when working with larger data sets, whereas PCA and PLS-DA are more suitable for classification tasks when one has limited access to data (Nejadgholi and Bolic, 2015). PLS-DA is often used in metabolomics research to build predictive classification models and/or discover biomarkers. In PLS-DA, the ideal number of the modeled class is between two and four. When PLS-DA is used to model more than four classes, the classification results may be difficult to interpret (Eriksson et al., 2006)
In this study, PCA was initially used to observe the classification pattern of the meat samples. Once the PCA model had demonstrated satisfactory performance based on cross-validation parameters, a supervised PLS-DA model was developed. Discriminating volatile selection from the validated PLS-DA was performed based on the variable importance in projection (VIP) value and correlation coefficients.
2 Materials and methods
2.1 Meat sample collection
All samples were collected in December 2019. The wild boar meat samples used in this experiment were obtained from three male wild boars (40–50 kg) originating from Jambi Forest in Sumatera, Indonesia. The meat samples were chopped from the flanks, ribs, and shanks in equal amounts, tightly packed, and then sealed in plastic bags, put in an icebox, and transported to Bogor. The beef samples were obtained from three cattle (Brahman crossbred cattle, 400–550 kg) and taken from the flank only since this is most commonly used by meatball sellers in Indonesia. Three fresh broiler chicken meat samples were obtained from the local slaughterhouse in Bogor. All meat samples were immediately transported to the laboratory and kept in a freezer (−33 °C) prior to analysis.
2.2 Preparation of meatball samples
The meatballs were prepared according to the cooking method commonly used by meatball sellers in Indonesia, though we did not use any spices or taste enhancers, to avoid masking effects. The meat samples were homogenized using a Phillips ProMix hand blender (HR2533), and the meatballs were made by mixing 200 g of minced meat with 20 g of tapioca flour (Cap Pak Tani, Bogor, Indonesia) and 50 g of ice cubes. The dough was then formed by hand into balls with 3–4 cm diameters, put in water at a temperature of 80 °C–100 °C and boiled for 15 mins. The beef, chicken, and wild boar meatballs were each made in triplicate. Similar steps were conducted to prepare the mixed meatballs. The mixed meatballs also contained 200 g of chicken along with wild boar and with beef in the following ratios: 20:80, 40:60, 60:40, and 80:20. In addition, meatballs made of a combination of beef, chicken, and wild boar with a ratio of 40:40:20 were also prepared. Each mixed meatball was made in duplicate. A total of 31 meatball samples were used in this study (Table 1). For SPME analysis, the meatballs were crushed with a porcelain mortar and pestle. The crushed meatball samples (8 g) were put in a closed headspace vial with 5 mL of distilled water for exposure to SPME fiber.
No.
Chicken (g)
Beef (g)
Wild boar (g)
Tapioca (g)
Ice cube (g)
Code
Replication
1
100
0
0
10
25
C
3
2
0
100
0
10
25
B
3
3
0
0
100
10
25
W
3
4
80
0
20
10
25
CW82
2
5
60
0
40
10
25
CW64
2
6
40
0
60
10
25
CW46
2
7
20
0
80
10
25
CW28
2
8
0
80
20
10
25
WB82
2
9
0
60
40
10
25
WB64
2
10
0
40
60
10
25
WB46
2
11
0
20
80
10
25
WB28
2
12
20
40
40
10
25
WBC244
2
13
40
20
40
10
25
WBC424
2
14
40
40
20
10
25
WBC442
2
2.3 Analysis of volatile compounds
2.3.1 Headspace solid-phase microextraction procedure
The SPME fiber (DVB/CAR/PDMS, Supelco, Bellefonte, PA, USA) was cleaned before use by heating in a GC–MS injector at 250 °C for 5 mins. The pre-extraction process was carried out by placing the clean SPME fibers into the sample headspace in the vial for 10 mins. The vial was put on a heating plate at a constant temperature of 40 °C. The extraction continued for another 30 mins at the same temperature and with the same vial sample and fiber sphere positions as in the pre-extraction process. This procedure was previously described by Pavlidis et al. (2019). The samples were not stirred, and no NaCl was added.
2.3.2 Gas chromatography–mass spectrometry analysis
GC–MS analysis was carried out by inserting the fiber that had been exposed to the samples (as described in Section 2.3.1) into the GC–MS injection port. Sample injection was carried out in the split mode (split ratio: 1:2) at 250 °C. The separation of the compounds was carried out in a capillary DB-WAX column with 30 × 0.25 mm dimensions and a film thickness of 0.25 μm, (Agilent Technologies, Santa Clara, USA). The oven temperature was maintained at 40 °C for 5 mins and then increased at 4 °C/min until it reached 150 °C. Next, the temperature was further raised to 250 °C (30 °C/min) and held for 5 mins. The interface temperature was set at 280 °C. The mass spectrometer was operated in the electron ionization mode with the electron energy set at 70 eV and a scanning range of 29–350 m/z (speed: 4.37 scans/s; gain factor: 1). The ion source and quadrupole analyzer temperatures were set at 230 °C and 150 °C, respectively. This procedure was previously described (Pavlidis et al., 2019) with small differences, including a different column. Here the DB-WAX column was used instead of the HP-5MS column.
2.3.3 Identification of volatile compounds and data pretreatment
The identification of all volatile compound analytes was estimated using the mass spectra along with the built-in NIST MS 14.0 library as a reference. The compounds were then confirmed using the linear retention index (LRI) from the database and previous reports. To determine the LRI of each analyte, a homologous series of a n-alkane solution (C10-40, Polyscience, Niles, IL, USA; 5 mg/L) was used in dichloromethane under the same chromatographic conditions as those used for the samples. The LRI was calculated using the following equation, as described elsewhere (Dool and Kratz, 1962): Here, LRI (compound) is the LRI of the compound, tr is the retention time, and n and N are the numbers of carbon atoms in the eluting alkanes before and after the product is produced, respectively. Finally, z is the discrepancy in the number of carbon atoms in the smaller and larger alkanes.
Multivariate data analysis was performed using the SIMCA-P software (v. 16.0, Sartorius-Umetric, Umeå, Sweden). PCA was used to assess the classification patterns among the different types of meat and meatballs. The PCA performance was evaluated based on the value of the predictive coefficient Q2X. Next, PLS-DA was used to fine-tune the classification pattern obtained from the PCA. PCA and PLS-DA model validations were conducted by cross-validation, response permutation tests. Cross-validation assesses the reproducibility and the predictive power of PCA and PLS-DA models based on R2 and Q2 value, respectively. In PLS-DA, R2Y represents the goodness of fit, whereas Q2Y is the accuracy of the prediction parameters. In PCA, the same indicator is represented by the R2X and Q2 value. Generally, R2X, Q2, R2Y, and Q2Y values of at least 0.5 are considered acceptable (Eriksson et al., 2006). In some cases, 0.4 has been considered acceptable (Worley and Powers, 2016). Additionally, response permutation testing was also conducted since sometimes invalid model might have a high cross-validation Q2 value. In permutation testing, a reliable model should have a significantly larger Q2 value than Q2 values generated from random models using the same data set (Worley and Powers, 2012). All of the validation indicators were also calculated using the SIMCA-P software (v. 16.0, Sartorius-Umetric, Umeå, Sweden).
3 Results and discussion
3.1 Volatile profiling by gas chromatography–mass spectrometry
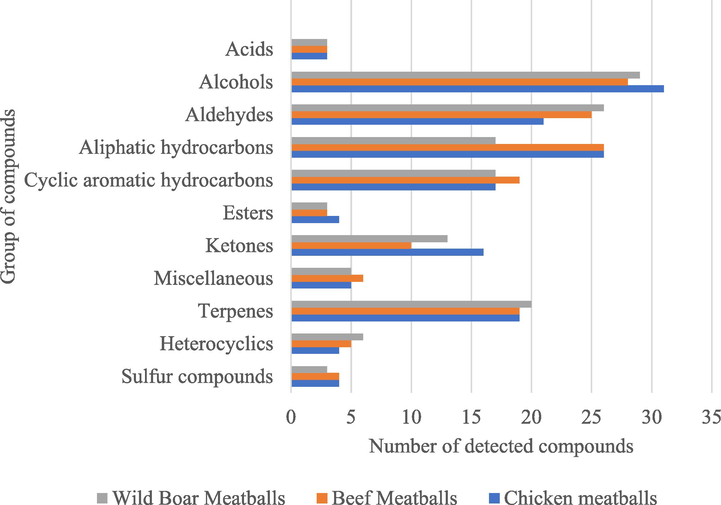
Table 2 presents the volatile compounds with known molecular formulas that were identified in the meatball samples. Only compounds detected in the control samples are listed, and data from the mixed meatballs are not presented. Overall, 150 volatile compounds were found in the chicken meatballs; 148, in the beef meatballs; and 141, in the wild boar meatballs. These volatiles consisted mainly of aldehydes, ketones, alcohols, acids, esters, aliphatic hydrocarbons, aromatic hydrocarbons, terpenes, and miscellaneous compounds (Table 2 and Fig. 1). They may have been formed as the result of lipid oxidation, the Maillard reaction, interactions between Maillard reaction products and lipid oxidation products, and/or the thermal degradation of thiamine that occurs during the cooking process (Kosowska et al., 2017). The oxidation of lipids produces a wide range of aliphatic compounds, including saturated and unsaturated hydrocarbons, alcohols, aldehydes, ketones, acids, and esters (Ayseli et al., 2014). At the same time, the Maillard reaction may include many heterocyclic compounds including sulfur and nitrogen compounds (Dashdorj et al., 2015). The data in Table 2 indicate that most of the volatiles detected in this study were the result of lipid oxidation (alcohols, hydrocarbons, aldehydes, and ketones), whereas a few were based on thiamin degradation (sulfur compounds) and the Maillard reaction (acetoin and aldehydes). Some compounds might also have resulted from an interaction of these three processes.
Volatilomes
LRI
Method Identificationa
Peak Area (×104)
Chicken Meatballs
Beef Meatballs
Wild Boar Meatballs
Acids
2-Amino-6-methylbenzoic acid
1813
M
10
9.69
1.84
2-Amino-5-methylbenzoic acid
1843
M
3.63
8.44
292
Caproic acid
1845
L
1.80
87
–
Lauric acid
2066
M
–
–
1.98
Alcohols
2-Ethylbutanol
1114
M
1.12
866
862
2-Butanol, 3-methyl-
1133
L
857
360
427
2-Pentanol
1146
L
1.16
380
137
2-Ethylcyclobutanol
1146
M
–
–
98
3-Methylbutanol
1215
M
–
34
–
2-Pentanol, 4-methyl-
1275
L
1.61
311
215
1-Pentanol
1289
L
3.07
76
1.48
3-Methyl-3-butenol
1265
L
539
–
649
6-Methyl-2-heptanol
1302
L
4.10
221
265
1-Undecanol
1328
M
1.01
74
1.50
1-Hexanol
1350
L
402
279
933
1-Octanol, 3,7-dimethyl-
1389
M
592
494
–
2-Butoxyethanol
1404
L
281
387
–
Ethanol, 2-(dodecyloxy)-
1440
M
93
93
171
1-Octanol, 2-butyl-
1447
M
67
1.99
–
1-Octen-3-ol
1451
L
2.35
–
2.09
1-Heptanol
1461
L
1.22
550
61
5-Hepten-2-ol, 6-methyl-
1476
L
87
762
194
7-Octen-2-ol, 2,6-dimethyl-
1471
L
129
30
54
2-Cyclohexen-1-ol
1511
L
98
–
–
2-Ethylhexanol
1523
L
–
39
–
Cyclobutanol
–
M
2.23
1.74
10
Cyclohexanol, 2-tert-butyl-
1529
M
127
–
–
1-Octanol
1558
M
1.28
1.03
368
1-Terpinenol
1576
L
44
–
24
Terpinen-4-ol
1602
L
213
54
135
Cyclooctanol
1610
L
128
85
52
2-Octen-1-ol, (E)-
1613
L
141
180
32
2-Nonen-1-ol, (E)-
1620
M
230
169
400
2-Methyl-1-indanol
1644
M
33
6
–
Phenol, 4-(2-propenyl)-
1694
M
176
–
–
5-Hexen-2-ol
1784
M
–
–
8
Phenol, 3,5-dimethoxy-
1936
M
189
273
25
1-Dodecanol
1982
L
211
369
117
m-Ethylphenol
1998
M
42
59
139
2,4-Di-tert-butylphenol
1994
M
601
729
494
Aldehydes
Glutaraldehyde
1073
M
3.30
2.07
259
Pentanal
–
M
2.48
2.22
2.98
Hexanal
1078
L
39.8
25.1
46.3
Heptanal
1170
L
6.78
5.21
1.02
5-Methylhexanal
1182
M
–
–
164
Octanal
1260
L
5.71
3.52
564
2-Heptenal, (Z)-
1313
L
1.06
272
2.83
Nonanal
1369
L
9.79
1.17
1.86
2-Dodecenal
1400
M
279
246
612
2-Undecenal
1412
M
927
149
62
2-Octenal, (E)-
1432
L
157
100
201
Undecanal
1429
M
–
20
408
2,4-Heptadien-1-al
1480
L
466
98
18
Decanal
1492
L
376
492
688
Benzaldehyde
1501
L
1.8
3.1
237
2-Nonenal, (E)-
1511
M
–
250
–
2-Tridecenal, (E)-
1523
M
–
–
335
2-Decenal, (E)-
1633
L
79
88
96
2-Octenal, 2-butyl-
1669
L
–
507
267
Benzaldehyde, 3-ethyl-
1688
M
1.1
1.05
425
2-Dodecenal, (E)-
1738
M
169
35
50
2-Undecenal, (E)-
1746
L
27
54
8
2,4-Decadienal
1760
L
14
8
18
2,4-Decadienal, (E,E)-
1803
L
–
–
27
Butanal, 3-methyl-
–
M
1.67
800
–
Tetradecanal
1927
L
57
498
–
Benzaldehyde, 4-pentyl-
1998
L
146
158
107
Heptadecanal
2000
M
302
266
47
17-Octadecenal
2025
M
24
124
19
Octadecanal
2015
M
–
138
253
Aliphatic hydrocarbons
5-Ethyl-2-methyloctane
1053
L
2.3
1.34
613
Undecane, 3-methyl-
1101
M
1.11
840
2.59
2,4-Dimethylhexane
1105
M
1.05
537
406
Undecane, 5-methyl-
1129
M
2.02
1.04
176
Undecane, 3,4-dimethyl-
1135
M
1.41
549
133
Dodecane
1177
L
1
–
403
3,5-Dimethylheptane
1193
M
738
56
–
4-Ethylcyclohexene
1211
M
–
–
70
2,4,6-Trimethyloctane
1196
M
697
189
265
Tridecane
1206
M
–
58
–
2-Methyltridecane
1210
L
611
141
–
3,8-Dimethyldecane
1216
M
1.31
114
–
3-Methyldodecane
1221
M
679
292
–
3,6-Dimethylundecane
1234
M
461
327
–
3,7-Dimethylnonane
1252
M
971
52
–
Undecane, 4,7-dimethyl-
1273
M
1.34
280
49
3,6-Dimethyldecane
1278
M
736
538
–
Hexane, 2,3,4-trimethyl-
1286
M
1.01
–
–
Hexane, 3-ethyl-4-methyl-
1284
M
886
194
–
Undecane, 3,7-dimethyl-
1348
M
168
–
–
3-Ethyl-2-methyl-1,3-hexadiene
1387
M
532
369
83
1-Octene, 3,7-dimethyl-
1393
M
–
–
38
Tetradecane
1396
L
487
256
53
1,3-Hexadiene, 3-ethyl
1396
M
–
190
–
1-Tetradecene
1425
L
150
77
21
2-Methyldecane
1456
M
87
156
1.18
1-Hexene, 3,5,5-trimethyl-
1485
M
170
113
–
2-Decanone
1489
L
165
206
64
Pentadecane
1603
M
–
25
–
2-Undecene, 8-methyl-, (Z)-
1540
M
824
1.08
–
3,5-Dimethyl-1-hexene
1564
M
–
–
–
Hexadecane
1596
L
88
192
96
1-Decene, 3,4-dimethyl-
1775
L
–
–
16
Cyclic aromatic hydrocarbons
Ethylbenzene
1111
L
4.13
2.75
1.1
o-Xylene
1117
L
1.95
1.02
–
m-Xylene
1123
L
1.76
344
314
p-Xylene
1152
L
534
118
80
Furan, 2-pentyl-
1201
L
2.06
1.21
966
Mesitylene
1247
M
1.26
34
137
Benzene, 1,2,3-trimethyl-
1256
L
959
208
588
Cyclooctane, methyl-
1295
M
301
–
–
cis-2-Methylcyclopentanol
1285
M
–
126
–
m-Xylene, 5-ethyl
1298
L
1.44
3.12
127
Benzene, 2-propenyl-
1349
M
277
289
83
2,6-Dimethylcyclohexanone
1359
L
536
–
127
Cyclopentane, nonyl-
1448
M
–
–
172
Acridine, 9-methyl-
1515
M
1.30
1.05
348
Isopropylcyclohexane
1550
M
–
22
301
4-Ethylbenzaldehyde
1652
L
40
20
12
Cyclopropane, nonyl
1658
M
61
84
4
Naphthalene
1703
L
939
155
550
Azulene
1731
M
–
22
–
Methyl ethyl cyclopentene
1754
M
–
6
–
Butylated Hydroxytoluene
1910
L
57
142
–
Cyclodecasiloxane, eicosamethyl-
2005
M
–
–
26
Indole
2048
M
2.79
1.74
1.18
Esters
Methyl caprylate
1354
L
416
106
50
Methyl caprate
1571
L
61
90
–
Methyl salicylate
1749
L
29
–
6
Methyl palmitate
1995
M
86
13
303
Heterocyclics
Thiophene, 2-pentyl-
1494
L
248
223
51
1,2,4-Triazol-4-amine phenylpyrazol-1-yl)-
1546
M
380
243
584
3-Methyl-2-thiophenecarboxaldehyde
1765
L
–
4
61
Thiazole, 2,4,5-trimethyl-
1867
L
–
32
698
Tetrahydrothiopyran-4-one
2006
M
–
–
2
Thiophene, 2-butyl-5-ethyl-
1999
M
22
–
14
Thiophene, 2-ethyl-5-isopentyl-
1996
M
41
11
–
Ketones
Nonane, 3-methyl-
1095
M
4.17
886
–
6-Dodecanone
1213
M
945
–
424
2-Heptanone, 6-methyl-
1224
L
175
168
120
2,3-Octanedione
1318
L
537
211
747
2-Methyl-3-octanone
1323
L
202
–
240
2,5-Octanedione
1330
L
1.49
138
98
5-Hepten-2-one, 6-methyl-
1334
L
474
–
129
2-Nonanone
1385
L
285
–
257
6,7-Dodecanedione
1527
M
11
137
195
4-Nonanone
1526
M
18
–
–
2-Undecanone
1576
L
11
–
11
11-Dodecen-2-one
1596
M
7
27
65
Acetophenone
1630
L
313
85
43
3-Tridecanone
1771
L
74
12
19
Nona-3,5-dien-2-one
1885
M
240
44
–
γ-Nonalactone
1999
L
85
50
44
Sulfuric Compounds
Disulfide, dimethyl
1068
L
1.99
1.06
439
Disulfide, di-tert-dodecyl
1316
M
729
182
–
Dimethyl trisulfide
1353
L
1.85
1.79
144
Benzothiazole
1952
L
331
623
70
Terpenes
o-Cresol
1142
M
1.10
604
195
1,4-Cineol
1159
L
1.41
570
259
D-Limonene
1165
L
1.01
744
250
γ-Terpinen
1226
M
948
123
–
β-Cymene
1230
L
1.95
432
117
Styrene
1237
L
897
67
210
o-Cymene
1240
L
1.16
228
246
2-Carene
1251
M
683
303
–
α-Terpinolene
1265
L
1.08
125
84
Copaene
1421
L
200
111
107
p-Cymenene
1492
M
–
–
199
1,3,8-p-Menthatriene
1466
M
321
119
–
(+)-2-Bornanone
1485
L
58
120
62
L-Camphor
1688
M
–
–
46
Fenchol
1580
L
35
154
21
β-Terpineol
1626
L
–
–
49
3-p-Menthol
1637
L
67
104
46
dl-Menthol
1641
L
–
–
49
Isoborneol
1653
L
10
9
15
o-Xylenol
1998
M
56
68
6
p-Cresol
2070
M
53
33
114
m-Cresol
1997
M
158
71
88
cis-Isoeugenol
1997
M
92
17
202
Miscellaneous
Acetoin
1294
L
1.21
129
321
2-Ethoxyethyl ether
1418
M
136
70
–
Benzyl nitrile
1920
L
239
127
–
5-Methyl-2-phenylindole
2068
M
–
28
45
3-Methyl-2-formyl
2051
M
46
88
–
p-Vinylguaiacol
2021
M
209
203
454
Diethyltoluamide
2090
M
–
–
475
Composition of the volatile compounds detected in each type of control meatball.
The volatile compounds found in each type of meatball were grouped based on their functional groups (Fig. 1). It can be seen that all the meatballs had a similar composition of volatile components. However, compounds from the ketone group were more common in the chicken meatballs, whereas aldehyde compounds were least present in the chicken. In fact, ketones and aldehydes are major contributors to the “chicken-like” scent (Kerler and Grosch, 1997). A number of compounds, including nonane; 3-methyl-, 2,3-octanedione, 4-nonanone, acetophenone, 6-dodecanone, 2-heptanone, 6-methyl-,2-methyl-3-octanone, 2,5-octanedione 5-hepten-2-one, 6-methyl-,2-nonanone, 6,7-dodecanedione, 2-undecanone, 11-dodecen-2-one, 3-tridecanone, and nona-3,5-dien-2-one, were detected in the chicken meatballs. A few of the aforementioned compounds, such as 4-nonanone and acetophenone, have previously been identified in boiled chicken (Kerler and Grosch, 1997), and 2,3-octanedione has been found in raw chicken breast (Ayseli et al., 2014).
Only a few previous reports on the composition of the volatile compounds in fresh or boiled wild boar meat were found. Sales and Kotrba (2013) reported that fried wild boar meat contained 48 volatile compounds, including 16 aldehydes, 5 ketones, 6 alcohols, 8 acids, 4 sulfur compounds, 8 pyrazines, 2 furanones, 1 pyrrole, and 3 aromatic compounds. In the present study, 141 volatile compounds were found in the wild boar meatballs, including 2 sulfur compounds, 6 heterocyclics, 20 terpenes, 13 ketones, 3 esters, 3 acids, 29 alcohols, 26 aldehydes, 17 aliphatic hydrocarbons, 17 cyclic aromatic hydrocarbons, and 5 miscellaneous compounds. Alcohol was the most abundant chemical family in the wild boar meatballs. One of the compounds, 1-octen-3-ol, is an important volatile compound and product related to meat fatty acid autoxidation (Mottram, 1998), leading to a mushroom-like scent (Lammers et al., 2009). Other alcohol compounds found in samples of fresh wild boar meat (Sales and Kotrba, 2013) and fried wild boar meat (Lammers et al., 2009) include 1-pentanol, 1-hexanol, 1-heptanol, and 1-octanol.
The volatile compounds detected in the raw and cooked beef were categorized into eight groups: hydrocarbons, alcohols, aldehydes, acids, esters, ketones, furans, and sulfur compounds. The alcohols, acids, and esters were less diverse in the cooked beef as compared with those in the raw beef. By contrast, the aldehydes and ketones were more diverse in the beef after cooking. In particular, the aldehyde diversity increased from four compounds before cooking to 20 compounds after cooking, with hexanal being one of the most abundant (Wang et al., 2018). Overall, 30 aldehydes were detected in the beef meatballs, with butanal being the most abundant (Table 2).
3.2 Volatilomics
Volatilomics is a term for volatilome analysis aimed at the detection, characterization, and quantification of volatile metabolites from organics (Lytou et al., 2019). The volatilome is defined as the group of all volatile organic compounds produced by a living organism (plants, animals, etc.), an ecosystem, or a substrate (such as food), and it includes exogenously derived compounds (organic and inorganic; Lytou et al., 2019). The volatilomic approach has recently been applied in various research fields, for applications such as plant analysis (Lytou et al., 2019) and the discrimination of beef and pork (Pavlidis et al., 2019). Most volatilomics studies have employed GC–MS and electronic nose methods. Multivariate data analysis has also been used to analyze the resulting high-dimensional data. Various multivariate methods can be used to extract information from large amounts of volatilomics data, with PCA, PLS-DA, and OPLS-DA being the most common (Worley and Powers, 2016).
To evaluate the meatball classification pattern based on the volatile compound composition, unsupervised PCA was performed on the GC–MS data (chromatographic relative peak area) using unit-variance (UV) scaling. In UV scaling, the scaling weight is 1/sk, where sk is the standard deviation of parameter k. Thus, in UV scaling, all variables have an equal opportunity to influence the data, making it more objective than other scaling methods (Eriksson et al., 2006). Multiplicative signal correction (MSC) filtering was applied to remove the signal noise. The main objective of using MSC filtering is to remove artifacts and interference that are not correlated to the presence of the target analytes (Eriksson et al., 2006). After excluding three sample outliers (one 100%-chicken meatball sample, one mixed chicken–wild boar meatball sample with a 4:6 ratio, and one mixed chicken–wild boar meatball sample with a 6:4 ratio), a PCA model with three principal components explaining 59.8% of the variation was obtained using Hotelling’s T2 analysis with a 95% confidence interval. PC1, PC2, and PC3 of the PCA explained 43.8%, 9.14%, and 6.81% of the variation, respectively. Only the first two components are presented (Fig. 2). The aforementioned results are consistent with the minimum requirements for the model mentioned by Worley and Powers (2016), which includes Q2 = 0.41. The score plot revealed three distinct groups: beef meatballs (B1–B3), chicken meatballs (C1–C2; C3 was excluded because it was located outside the 95% confidence interval), and meatballs made from 100% wild boar meat or a mixture of wild boar with beef and/or chicken (Fig. 2). Notably, all meatballs made from a mixture of wild boar with beef and/or chicken at different ratios were clustered together with the 100%-wild boar meatballs. This may have occurred because of the strong influence of the volatile components present in wild boar meat. The loading plot revealed several volatiles responsible for the three groupings (Fig. 2). For the beef meatball group, the discriminating compounds were 2-amino-5-methylbenzoic acid, 2-amino-6-methylbenzoic acid, benzaldehyde, dimethyl trisulfide, and 1-octanol. For the chicken meatball group, 5-hepten-2-ol, 6-methylnonane, 3-methyl, and 2-ethylbutanol were among those predominant discriminating compounds. Lauric acid, 2,4-di-tert-buthyl-phenol, and furan 2-pentyl were the discriminating compounds for the wild boar meatballs and wild boar-containing meatballs.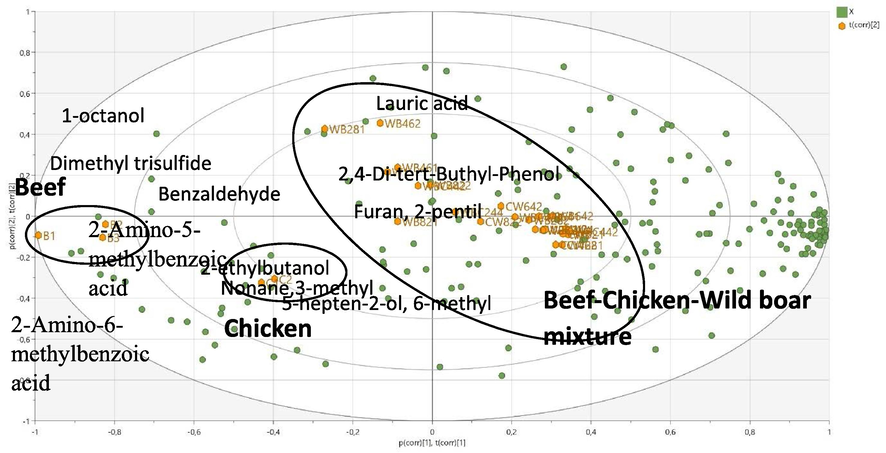
PCA loading biplot of meatballs made from 100% beef (B1–B3), 100% chicken (C1–C3), 100% wild boar (W1–W3), and mixtures thereof (WB: wild boar–beef, WC: wild boar–chicken, and WBC: wild boar–beef–chicken). The loading biplot illustrates several markers of the beef, chicken, and mixed meatballs. The numbers after the letters represent the percentages of the respective meats. The last number represents the number of replications.
To obtain a clearer classification pattern, a supervised multivariate data analysis method (PLS-DA) was employed. Further analysis using a supervised method is only recommended when the PCA model for the same set of data has an acceptable predictive coefficient (Q2 of at least 0.4; Worley and Powers, 2016), which was fulfilled by the aforementioned PCA model. The PLS-DA score plot exhibited better performance than the PCA. The PLS-DA model with three classes (class 1: chicken meatballs, class 2: beef meatballs, and class 3: wild boar and wild boar–beef–chicken meatballs) had good performance, with a cumulative explained variance of R2X = 0.69, R2Y = 0.99, and Q2 = 0.84 (Zhang et al., 2020). Here, the beef and chicken samples were clustered separately from each other. Again, the wild boar meatballs and meatballs made from mixtures of wild boar with chicken and/or beef at different ratios were grouped separately from the beef and chicken samples (Fig. 3).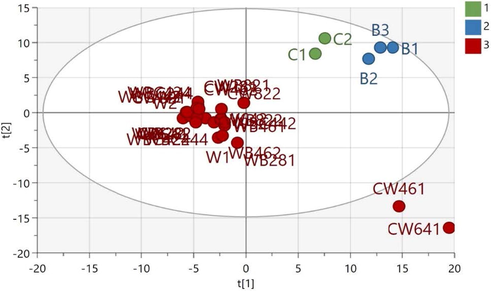
PLS-DA plot score of meatball samples (C: chicken, B: beef, W: wild boar, WB: wild boar–beef, CW: chicken–wild boar, and WBC: wild boar–beef–chicken). The number represents the ratio of each meat and replication number.
Further validation with 100 random permutations was performed. As illustrated in Fig. 4, the values of R2Y (green circles) and Q2Y (blue squares) from the permuted analysis (bottom-left corner) were lower than the associated initial values (top-right corner), indicating the stability of the model and the absence of overfitting (Song et al., 2021). The p-value for the cross-validated analysis of variance (CV-ANOVA) was less than 0.005 (2.6 × 10⁻⁴), demonstrating the model validity (Eriksson et al., 2008).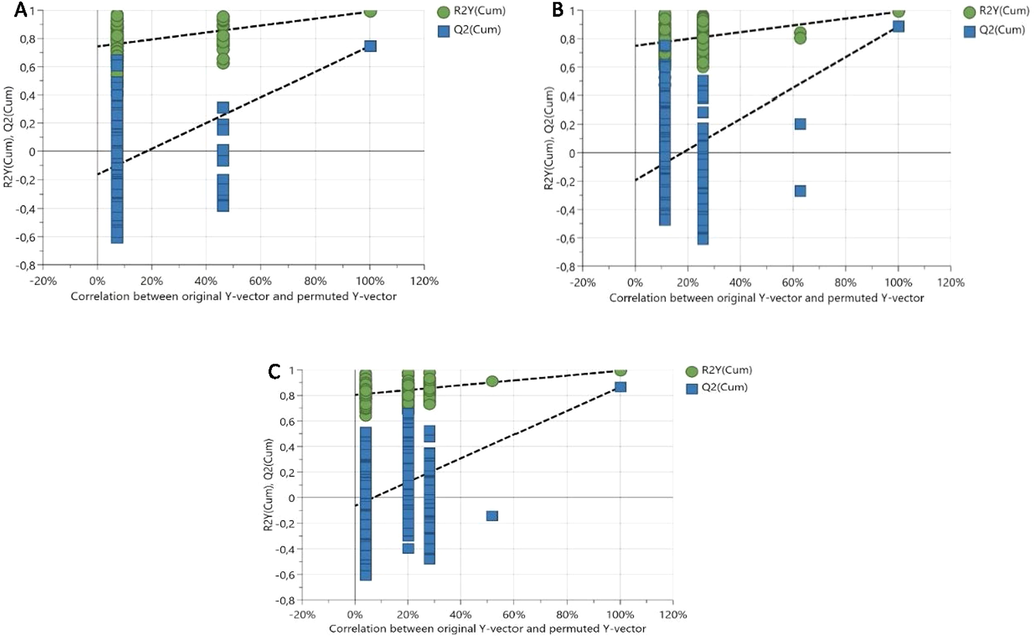
Permutation test for the PLS-DA model for (A) chicken meatballs, (B) beef meatballs, and (C) wild boar and beef–wild boar–chicken meatballs.
3.3 Potential volatile marker of wild boar meatballs
To elucidate the volatile compounds that serve as markers for each PLS-DA class, a correlation coefficient and the VIP values were used. The compounds that were positively or negatively correlated with the groupings could be determined using the coefficient, whereas the VIP value has only a positive value. Fifteen compounds with both positive and negative correlation values and the largest VIP values were selected from each PLS-DA class (Table 3).
PLS-DA Class 1 (Chicken Meatballs)
No.
Positive compound
VIP
Chemical group
No.
Negative compound
VIP
Chemical group
1
β-Cymene
2.08
terpenes
1
Benzaldehyde
1.95
aldehydes
2
Butanal, 3-methyl-
2.04
aldehydes
2
3-Ethyl-2-methyl-1,3-hexadiene
1.74
aliphatic hydrocarbons
3
1-Pentanol
1.98
alcohols
3
Benzaldehyde, 4-pentyl-
1.55
cyclic aromatic hydrocarbons
4
2-Pentanol
1.84
alcohols
4
Undecane, 5,7-dimethyl-
1.34
aliphatic hydrocarbons
5
3,8-Dimethyldecane
1.76
aliphatic hydrocarbon
5
Pentanal
1.27
aldehydes
6
Mesitylene
1.75
cyclic aromatic hydrocarbons
6
2-Amino-5-methylbenzoic acid
1.21
acids
7
3-Methyl-3-butenol
1.74
alcohols
7
2-Octenal, 2-butyl-
1.14
aldehydes
8
1,4-Cineol
1.7
terpenes
8
5-Hepten-2-ol, 6-methyl-
1.12
alcohols
9
Undecane, 3,4-dimethyl-
1.69
aliphatic hydrocarbons
9
1-Dodecanol
1.08
alcohols
10
Tridecane
1.56
aliphatic hydrocarbons
10
Decanal
1.04
aldehydes
11
2-Methyltridecane
1.47
aliphatic hydrocarbons
11
Butylated hydroxytoluene
0.99
cyclic aromatic hydrocarbons
12
3,5-Dimethylheptane
1.47
aliphatic hydrocarbons
12
2-Undecenal
0.86
aldehydes
13
Disulfide, dimethyl
1.36
sulfur compounds
13
Azulene
0.85
cyclic aromatic hydrocarbons
14
Undecane, 3,4-dimethyl-
1.3
aliphatic hydrocarbons
14
2-Decanone
0.8
ketones
15
Styrene
1.2
terpenes
15
Phenol, 3,5-dimethoxy-
0.70
alcohols
Class 2 (Beef meatballs)
No.
Positive compound
VIP
Chemical group
No.
Negative compound
VIP
Chemical group
1
m-Xylene, 5-ethyl
1.98
cyclic aromatic compounds
1
1-Pentanol
1.99
alcohols
2
Benzaldehyde
1.94
aldehydes
2
Mesitylene
1.75
cyclic aromatic hydrocarbons
3
3-Ethyl-2-methyl-1,3-hexadiene
1.74
aliphatic hydrocarbons
3
3-Methyl-3-butenol
1.74
alcohols
4
1-Octanol, 3,7-dimethyl-
1.63
alcohols
4
m-Xylene
1.70
cyclic aromatic hydrocarbons
5
Benzaldehyde, 4-pentyl-
1.54
aldehydes
5
2-Methyltridecane
1.47
aliphatic hydrocarbons
6
1-Octanol
1.42
alcohols
6
p-Xylene
1.45
cyclic aromatic hydrocarbons
7
1-Octanol, 2-butyl-
1.40
alcohols
7
Thiazole, 2,4,5-trimethyl-
1.43
heterocyclics
8
2-Nonenal, (E)-
1.36
aldehydes
8
Naphthalene
1.26
cyclic aromatic hydrocarbons
9
Dimethyl trisulfide
1.35
sulfur compounds
9
5-Hepten-2-one, 6-methyl-
1.21
ketones
10
Undecane, 5,7-dimethyl-
1.33
aliphatic hydrocarbons
10
Styrene
1.21
terpenes
11
2-Butoxyethanol
1.30
alcohols
11
Lauric acid
1.17
acids
12
5-Hepten-2-ol, 6-methyl-
1.21
alcohols
12
Terpinen-4-ol
1.11
alcohols
13
2-Amino-5-methylbenzoic acid
1.20
acids
13
Methyl palmitate
1.09
esters
14
Heptanal
1.16
aldehydes
14
4-Ethyl-o-xylene
1.03
cyclic aromatic hydrocarbons
15
Heptadecanal
1.16
aldehydes
15
Phenol, 4-(2-propenyl)-
0.94
alcohols
Class 3 (Wild boar and mixtures)
No.
Positive compound
VIP
Chemical group
No.
Negative compound
VIP
Chemical group
1
p-Xylene
1.40
cyclic aromatic compounds
1
β-Cymene
2.08
terpenes
2
Thiazole, 2,4,5-trimethyl-
1.40
heterocyclics
2
Butanal, 3-methyl-
2.05
aldehydes
3
6-Methyl-2-heptanol
1.31
alcohols
3
m-Xylene, 5-ethyl
1.93
cyclic aromatic hydrocarbons
4
Pentanal
1.27
aldehydes
4
2-Pentanol
1.85
alcohols
5
2-Octenal, 2-butyl-
1.14
aldehydes
5
3,8-Dimethyldecane
1.76
alyphatic hydrocarbons
6
Terpinen-4-ol
1.11
alcohols
6
3-Methyl-3-butenol
1.74
alcohols
7
4-Ethyl-o-xylene
1.03
cyclic aromatic compounds
7
o-Xylene
1.71
cyclic aromatic hydrocarbons
8
Indole
0.95
cyclic aromatic compounds
8
1,4-Cineol
1.7
terpenes
9
Phenol, 4-(2-propenyl)-
0.93
alcohols
9
Undecane, 3,4-dimethyl-
1.69
alyphatic hydrocarbons
10
2-Undecenal
0.86
aldehydes
10
Undecane, 5-methyl-
1.63
alyphatic hydrocarbons
11
Azulene
0.80
cyclic aromatic compounds
11
1-Octanol, 3,7-dimethyl-
1.63
alcohols
12
1,2,4-Triazol-4-amine, 5-ethyl-3-(3-methyl-5-phenylpyrazol-1-yl)-
0.80
heterocyclic compounds
12
Tridecane
1.56
alyphatic hydrocarbons
13
Copaene
0.80
terpenes
13
Disulfide, dimethyl
1.36
sulfur compounds
14
2-Decanone
0.79
ketones
14
Dimethyl trisulfide
1.20
sulfur compounds
15
1-Octen-3-ol
0.70
alcohols
15
Heptanal
1.16
aldehydes
The volatile with the highest VIP value in the chicken meatball class of the PLS-DA was β-cymene (Table 2). We could find no previous report on the occurrence of this compound in fresh or cooked chicken meat. However, a recent review indicated that cymene was found in essential oils, which are often added to poultry feed as natural antibiotics and immune-stimulants (Brenes and Roura, 2010). A previous study also reported that the second-strongest positive compound, 3-methylbutanal (an aldehyde), was detected in thermally processed chicken as a result of the Maillard reaction (Tian et al., 2007). This was also recently reported as one of the volatiles detected in Dezhou braised chicken (Duan et al., 2015) and grilled chicken (Ngamchuachit et al., 2015).
In the beef class, the most robust discriminator was 5-ethyl-m-xylene. Other discriminating volatiles, including benzaldehyde, octanol, 2-nonenal, and heptanal, have been found among the volatiles isolated from heat-treated beef, and 2-nonenal was also found in processed pork (Dwivedi and Brockmann, 1975). In this study, heptadecanal exhibited a significant contribution as a discriminating volatile in the beef, though it has been previously found in processed pork and ham (Dwivedi and Brockmann, 1975). Dimethyl trisulfide was also one of the potent odorants identified in stewed beef juice (Guth and Grosch, 1994).
In the wild boar and mixture meatballs group, xylene was identified as the strongest discriminator. This compound has previously been detected as a volatile in processed pork and ham (Dwivedi and Brockmann, 1975). The positive volatile with the second-highest VIP value in the wild boar and mixture meatball class was 2,4,5-trimethyl-thiazoles. Thiazoles have been reported as volatiles directly leading to a complex, meaty aroma (Piao et al., 2019). Pentanal has also been identified in cooked Iberian pigs (Estévez et al., 2003) and had a strong positive effect on the discrimination of minced pork from minced beef (Pavlidis et al., 2019).
As previously described, a strong discriminating volatile was assumed to be present in the 100% wild boar meatballs, which was responsible for clustering all the wild boar-containing meatballs in the same group. To address this, a PLS-DA model with three classes was created, including the meatballs made from 100% chicken, 100% beef, and 100% wild boar (Fig. 5). Although a CV-ANOVA indicated that the model was slightly overfitting, the R2Y and Q2Y values were 0.99 and 0.88, respectively. A further test with 200 random permutations also indicated an acceptable model (figure not shown). In this PLS-DA, 2-nonanone and pentanal were the two strongest positive discriminating volatiles from the wild boar group. Other discriminating compounds for 100% wild boar meatballs were summarized in Table 4. The compounds were compared with the 15 strongest positive discriminating volatiles when the wild boar meatballs were put in the same group with the meatballs made from a mixture of wild boar with beef and/or chicken at different ratios (Table 3; derived from the first PLS-DA model). As a result, six compounds (pentanal, 2,6-dimethylcyclohexanone, 1-undecanol, cyclobutanol, 2,4,5-trimethyl-thiazole, and 5-ethyl-3-(3-methyl-5-phenyl pyrazol-1-yl)-1,2,4-triazol-4-amine), were found as discriminating volatiles in mixture meatballs but with different VIP value (Table 3). However, the strongest pure wild boar meatballs discriminating volatiles (2-nonanone) was not found among volatiles that positively correlate with mixture meatballs grouping. This compound was reported as one of major ketones found in raw pork (Soncin et al., 2007), but there is no reports on its availability in wild boar.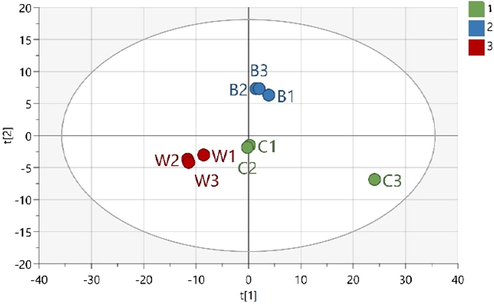
PLS-DA score plot of meatball volatiles' data. Only samples of 100% chicken (class 1; C1, C2, and C3), 100% beef (class 2; B1, B2, and B3), and 100% wild boar (class 3; W1, W2, and W3) are included.
No.
Positive Compound
VIP
Chemical Group
1
2-Nonanone
1.6
ketones
2
Pentanal
1.47
aldehydes
3
2,6-Dimethylcyclohexanone
1.34
cyclic aromatic hydrocarbons
4
1-Undecanol
1.29
alcohols
5
Cyclobutanol
1.28
alcohols
6
1-Hexanol
1.27
alcohols
7
3-Ethyl-2-methyl-1,3-hexadiene
1.21
aliphatic hydrocarbons
8
Decanal
1.19
aldehydes
9
Thiophene, 2-pentyl-
1.16
heterocylics
10
2-Dodecenal
1.14
aldehydes
11
1,2,4-Triazol-4-amine, 5-ethyl-3-(3-methyl-5-phenyl pyrazol-1-yl)-
1.00
heterocyclic compounds
12
Lauric acid
0.98
acids
13
2-Methyldecane
0.97
aliphatic hydrocarbons
14
Thiazole, 2,4,5-trimethyl-
0.93
heterocyclics
15
Copaene
0.89
terpenes
In the further analysis, we excluded 100% wild boar meatballs data to obtain another PLS-DA with 3 classes (100% chicken, 100% beef, and mixture meatballs) Fig. 6. Fifteen compounds with both positive and negative correlation values and the largest VIP values were selected from each PLS-DA class and summarized in Table 5. Six discriminating volatiles found in pure wild boar meatballs (pentanal, 2,6-dimethylcyclohexanone, 1-undecanol, cyclobutanol, 2,4,5-trimethyl-thiazole, and 5-ethyl-3-(3-methyl-5-phenyl pyrazol-1-yl)-1,2,4-triazol-4-amine) were consistently found as discriminating volatiles of mixture meatballs class in this new PLS-DA model, although with different VIP value. Similarly, the strongest discriminating compound, 2-nonanone, was not found. These data may partially support the hypothesis that several strong wild boar-discriminating volatiles heavily influenced the clustering of all wild boar-containing meatballs in the same group.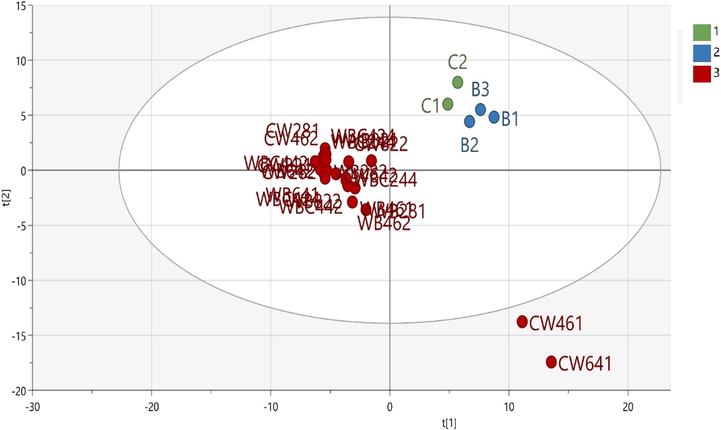
PLS-DA score plot of meatball volatile compounds data. Only samples of 100% chicken (class 1; C1, C2, and C3), 100% beef (class 2; B1, B2, and B3), and mixture meatballs (class 3; WB with different compositions) are included. Pure wild boar meatballs are excluded. Only the first two PC is presented (PC1 = 46.4%, PC2 16.4%, R2Y = 0.984, Q2Y = 0835).
PLS-DA Class 1 (Chicken meatballs)
No.
Positive Compound
VIP
Chemical Group
No.
Negative Compound
VIP
Chemical Group
1
Butanal, 3-methyl-
2.00
aldehydes
1
Benzaldehyde
1.92
aldehydes
2
1-Pentanol
1.77
alcohols
2
3-Ethyl-2-methyl-1,3-hexadiene
1.49
aliphatic hydrocarbons
3
1,4-Cineol
1.63
terpenes
3
2-Undecenal
1.38
aldehydes
4
o-Xylene
1.60
cyclic aromatic compounds
4
5-Hepten-2-ol, 6-methyl-
1.3
alcohols
5
2-Pentanol
1.54
alcohols
5
Pentanal
1.2
aldehydes
6
Mesitylene
1.53
cyclic aromatic hydrocarbons
6
2-Octenal, 2-butyl-
1.16
aldehydes
7
2-Methyltridecane
1.52
aliphatic hydrocarbons
7
Undecane, 5,7-dimethyl-
1.15
aliphatic hydrocarbons
8
3,8-Dimethyldecane
1.50
aliphatic hydrocarbon
8
Cyclobutanol
1.12
alcohols
9
m-Xylene
1.49
cyclic aromatic compounds
9
Thiophene, 2-pentyl-
1.02
heterocylics
10
3,5-Dimethylheptane
1.45
aliphatic hydrocarbons
10
1-Undecanol
0.89
alcohols
11
3-Methyl-3-butenol
1.45
alcohols
11
1,2,4-Triazol-4-amine, 5-ethyl-3-(3-methyl-5-phenylpyrazol-1-yl)-
0.88
heterocyclic compounds
12
Tridecane
1.42
aliphatic hydrocarbons
12
Decanal
0.87
aldehydes
13
Undecane, 3,4-dimethyl-
1.40
aliphatic hydrocarbons
13
Butylated Hydroxytoluene
0.85
cyclic aromatic hydrocarbons
14
Styrene
1.36
terpenes
14
2-Decanone
0.83
ketones
15
Disulfide, dimethyl
1.36
sulfuric compounds
15
1-Hexanol
0.79
alcohols
PLS-DA Class 2 (Beef meatballs)
No.
Positive Compound
VIP
Chemical Group
No.
Negative Compound
VIP
Chemical Group
1
m-Xylene, 5-ethyl
2.11
cyclic aromatic compounds
1
1-Pentanol
1.77
alcohols
2
Benzaldehyde
1.92
aldehydes
2
Mesitylene
1.53
cyclic aromatic hydrocarbns
3
Tetradecanal
1.84
aldehydes
3
2-Methyltridecane
1.52
aliphatic hydrocarbon
4
3-Ethyl-2-methyl-1,3-hexadiene
1.50
aliphatic hydrocarbons
4
m-Xylene
1.49
cyclic aromatic compounds
5
1-Octanol, 3,7-dimethyl-
1.49
alcohols
5
3,5-Dimethylheptane
1.49
aliphatic hydrocarbons
6
1-Octanol, 2-butyl-
1.48
alcohols
6
3-Methyl-3-butenol
1.45
alcohols
7
2-Amino-5-methylbenzoic acid
1.42
acids
7
Styrene
1.36
terpenes
8
2-Ethylbutanol
1.35
alcohols
8
p-Xylene
1.35
cyclic aromatic
9
5-Hepten-2-ol, 6-methyl-
1.3
alcohols
9
Nonanal
1.29
aldehydes
10
1-Octanol
1.24
alcohols
10
Thiazole, 2,4,5-trimethyl-
1.28
heterocyclics
11
Heptanal
1.19
aldehydes
11
6-Dodecanone
1.27
ketones
12
Benzaldehyde, 4-pentyl-
1.17
aldehydes
12
5-Hepten-2-one, 6-methyl-
1.19
ketones
13
Undecane, 5,7-dimethyl-
1.15
aliphatic hydrocarbons
13
Lauric acid
1.08
acids
14
Dimethyl trisulfide
1.09
sulfuric compounds
14
Terpinen-4-ol
1.02
alcohols
15
2-Nonenal, (E)-
1.08
aldehydes
15
Methyl palmitate
1.01
esters
PLS-DA Class 3 (Mixtures)
No.
Positive Compound
VIP
Chemical Group
No.
Negative Compound
VIP
Chemical Group
1
2-Undecenal
1.38
aldehydes
1
m-Xylene, 5-ethyl
2.11
cyclic aromatic compounds
2
p-Xylene
1.35
cyclic aromatic compounds
2
Butanal, 3-methyl-
1.99
aldehydes
3
Thiazole, 2,4,5-trimethyl-
1.26
heterocyclics
3
Benzaldehyde
1.92
aldehydes
4
Pentanal
1.2
aldehydes
4
1,4-Cineol
1.63
terpenes
5
2-Octenal, 2-butyl-
1.16
aldehydes
5
o-Xylene
1.6
cyclic aromatic compounds
6
Cyclobutanol
1.12
alcohols
6
2-Pentanol
1.54
alcohols
7
2,6-Dimethylcyclohexanone
1.05
cyclic aromatic hydrocarbons
7
1-Octanol, 3,7-dimethyl-
1.49
alcohols
8
2,4-Heptadien-1-al
1.04
aldehydes
8
5-Ethyl-2-methyloctane
1.48
aliphatic hydrocarbons
9
Cyclohexanol, 2-tert-butyl-
1.03
alcohols
9
3-Methyl-3-butenol
1.46
alcohols
10
1-Octen-3-ol
0.97
alcohols
10
Undecane, 5-methyl-
1.45
aliphatic hydrocarbons
11
Phenol, 4-(2-propenyl)-
0.96
alcohols
11
Undecane, 3,4-dimethyl-
1.40
aliphatic hydrocarbons
12
1-Undecanol
0.88
alcohols
12
Ethylbenzene
1.40
cyclic aromatic hydrocarbons
13
1,2,4-Triazol-4-amine, 5-ethyl-3-(3-methyl-5-phenylpyrazol-1-yl)-
0.88
heterocyclics
13
Disulfide, dimethyl
1.36
sulfuric compounds
14
Caproic acid
0.86
acids
14
2-Ethylbutanol
1.35
alcohols
15
Indole
0.86
cyclic aromatic hydrocarbons
15
2-Butoxyethanol
1.20
alcohols
Meat flavor formation during heating, especially when involving volatiles, is a complex process involving various reactions, including the Maillard and unsaturated lipid reactions. Compounds resulting from the Maillard reaction may also react with those from the unsaturated lipid degradation. The exact volatile composition of the meat flavor formed by these reactions depends on not only the types of precursors present in the meat but also the temperature and reaction time (Aaslyng and Meinert, 2017). Meatballs made from a mixture of different types of meat (chicken, beef, and wild boar) at different ratios may develop different volatiles, as concentrations of the precursors vary. This assumption might explain why the discriminatory volatiles of wild boar meatballs were not exactly the same with when clustered together with mixed meatballs as when separated from them.
This study did not include commercial meatballs in its analysis. Instead, the present work is a preliminary study with a very simple meatball formulation. Commercial meatballs typically have a much more complex formulation. Besides meat, flour, salt, and pepper, commercial meatballs may also contain garlic, beef flavor, or a taste enhancer, which could affect the selection of volatile markers. Further research using more complex meatball formulations resembling those of commercial meatballs and including samples of commercial meatballs themselves is required.
In addition, this study did not consider the effect of the animal feed, which can significantly contribute to meat's volatile composition. The volatile compounds in cooked meat can be directly diverted from animal feed into the tissue by the transformation of feed molecules through the action of ruminal microorganisms or by both the Maillard reaction and the oxidation of lipids during the heating process (Vasta and Priolo, 2006). An example of such a case is in a study by (Resconi et al., 2010), in which male Corriedale lambs that were only fed by pasture were found to have significantly lower levels of alkanals, alkadienals, and ketones compared with those of lambs fed by pasture and concentrate and concentrate-plus-lucerne hay.
4 Conclusion
This study revealed that it is possible to classify meatball products according to the different types of meat they contain based on volatile profiles, including halal (beef and chicken) and non-halal species (wild boar). The PLS-DA model with three classes indicated that β-cymene, 3-methyl-butanal, and 2-pentanol were among the positive discriminating volatiles with the highest VIP in the chicken meatball group, whereas benzaldehyde, 3-ethyl-2-methyl-1,3-hexadiene, and 4-pentyl-benzaldehyde were the three strongest negative discriminating volatiles in this group. In the beef meatball class, the highest VIP positive discriminating volatiles were 5-ethyl-m-xylene, benzaldehyde, and 3-ethyl-2-methyl-1,3-hexadiene, whereas the three highest VIP negative ones were 1-pentanol, mesitylene, and 3-methyl-3-butenol. The mixed meatballs exhibited an interesting profile, with all being clustered with the 100%-wild boar meatballs. Discriminating volatiles derived from a separate PLS-DA model pointed to a consistent 6 compounds, those are pentanal, 2,6-dimethylcyclohexanone, 1-undecanol, cyclobutanol, 2,4,5-trimethyl-thiazole, and 5-ethyl-3-(3-methyl-5-phenyl pyrazol-1-yl)-1,2,4-triazol-4-amine. These compounds were identified as significant discriminating compounds in pure wild boar meatballs and mixture meatballs, but with different VIP value in each PLS-DA models. Further study to link the volatile characteristics of each class with the respective aroma perceptions using gas chromatography–olfactometry (GC-O) is recommended.
Funding
This study was supported by the Ministry of Research and Technology/National Agency for Research and Innovation, Republic of Indonesia, through the Penelitian Dasar Unggulan Perguruan Tinggi 2020 scheme under contract number 1/AMD/E1/KP.PTNBH/2020.
CRediT authorship contribution statement
Agy Wirabumi Pranata: Investigation, Formal analysis, Writing - original draft. Nancy Dewi Yuliana: Conceptualization, Methodology, Funding acquisition, Writing - review & editing, Supervision. Lia Amalia: Formal analysis, Project administration. Noviyan Darmawan: Validation, Visualization, Writing - review & editing, Supervision.
Declaration of Competing Interest
The authors declare that they have no known competing financial interests or personal relationships that could have appeared to influence the work reported in this paper.
References
- Meat flavour in pork and beef – from animal to meal. Meat Sci.. 2017;132:112-117.
- [CrossRef] [Google Scholar]
- Evaluation of volatile compounds in chicken breast meat using simultaneous distillation and extraction with odour activity value. J. Food Nutr. Res.. 2014;53:137-142.
- [Google Scholar]
- Essential oils in poultry nutrition: main effects and modes of action. Anim. Feed Sci. Technol.. 2010;158(1-2):1-14.
- [CrossRef] [Google Scholar]
- Influence of specific taste-active components on meat flavor as affected by intrinsic and extrinsic factors: an overview. Eur. Food Res. Technol.. 2015;241(2):157-171.
- [CrossRef] [Google Scholar]
- A generalization of the retention index system including linear temperature programmes gas–liquid partition chromatography. J. Chromatogr.. 1962;11:461-471.
- [CrossRef] [Google Scholar]
- Analysis of volatiles in Dezhou Braised Chicken by comprehensive two-dimensional gas chromatography/high resolution-time of flight mass spectrometry. LWT – Food Sci. Technol.. 2015;60(2):1235-1242.
- [CrossRef] [Google Scholar]
- Eriksson, L., Johansson, E., Kettenah-Wold, N., Trygg, J., Wikström, C., Wold, S., 2006. Multi- and Megavariate Data Analysis. Umetrics AB, Umeå.
- CV-ANOVA for significance testing of PLS and OPLS models. J. Chemom.. 2008;22:594-600.
- [CrossRef] [Google Scholar]
- Analysis of volatiles in meat from Iberian pigs and lean pigs after refrigeration and cooking by using SPME-GC-MS. J. Agric. Food Chem.. 2003;51(11):3429-3435.
- [CrossRef] [Google Scholar]
- Analysis of beef meatball adulteration with wild boar meat using real-time polymerase chain reaction. Int. Food Res. J.. 2017;24:2451-2455.
- [Google Scholar]
- Identification of the character impact odorants of stewed beef juice by instrumental analyses and sensory studies. J. Agric. Food Chem.. 1994;42(12):2862-2866.
- [CrossRef] [Google Scholar]
- Character impact odorants of boiled chicken: changes during refrigerated storage and reheating. Eur. Food Res. Technol.. 1997;205(3):232-238.
- [CrossRef] [Google Scholar]
- Volatile compounds in meat and meat products. Food Sci. Technol.. 2017;37:1-7.
- [CrossRef] [Google Scholar]
- Analysis of lard in meatball broth using Fourier transform infrared spectroscopy and chemometrics. Meat Sci.. 2014;96(1):94-98.
- [CrossRef] [Google Scholar]
- A comparison of the volatile profiles of frying european and australian wild boar meat with industrial genotype pork by dynamic headspace-GC/MS analysis. J. Muscle Foods. 2009;20:255-274.
- [CrossRef] [Google Scholar]
- Volatilomics for food quality and authentication. Curr. Opin. Food Sci.. 2019;28:88-95.
- [CrossRef] [Google Scholar]
- Development and validation of a rapid test system for detection of pork meat and collagen residues. Meat Sci.. 2016;121:397-402.
- [CrossRef] [Google Scholar]
- Flavour formation in meat and meat products: a review. Food Chem.. 1998;62(4):415-424.
- [CrossRef] [Google Scholar]
- A comparative study of PCA, SIMCA and Cole model for classification of bioimpedance spectroscopy measurements. Comput. Biol. Med.. 2015;63:42-51.
- [CrossRef] [Google Scholar]
- View of comparison of dynamic headspace trapping on Tenax TA and eadspace stir bar sorptive extraction for analysis of vrilled Chicken (Yakitori) Volatiles. LWT – Food Sci. Technol.. 2015;60:1235-1242.
- [Google Scholar]
- A volatilomics approach for off-line discrimination of minced beef and pork meat and their admixture using HS-SPME GC/MS in tandem with multivariate data analysis. Meat Sci.. 2019;151:43-53.
- [CrossRef] [Google Scholar]
- M.Y. Piao H.J. Lee H.I. Yong S.-H. Beak H.J. Kim C. Jo K.G. Wiryawan M. Baik Comparison of reducing sugar content, sensory traits, and fatty acids and volatile compound profiles of the longissimus thoracis among Korean cattle, Holsteins, and Angus steers Asian-Australasian J. Anim. Sci. 32 1 2019 126 136 10.5713/ajas.18.0065
- The employment of FTIR spectroscopy in combination with chemometrics for analysis of rat meat in meatball formulation. Meat Sci.. 2015;100:301-305.
- [CrossRef] [Google Scholar]
- Relationship between odour-active compounds and flavour perception in meat from lambs fed different diets. Meat Science. 2010;85:700-706.
- [CrossRef] [Google Scholar]
- Review on analytical methods for analysis of porcine gelatine in food and pharmaceutical products for halal authentication. Trends Food Sci. Technol.. 2020;101:122-132.
- [CrossRef] [Google Scholar]
- Meat from wild boar (Sus scrofa L.): a review. Meat Sci.. 2013;94(2):187-201.
- [CrossRef] [Google Scholar]
- Synchronized analysis of FTIR spectra and GCMS chromatograms for evaluation of the thermally degraded vegetable oils. J. Anal. Methods Chem.. 2014;2014:1-9.
- [CrossRef] [Google Scholar]
- Preliminary study of the volatile fraction in the raw meat of pork, duck and goose. J. Food Compos. Anal.. 2007;20(5):436-439.
- [CrossRef] [Google Scholar]
- Screening of volatile decay markers of minced pork by headspace-solid phase microextraction–gas chromatography–mass spectrometry and chemometrics. Food Chem.. 2021;342:128341.
- [CrossRef] [Google Scholar]
- Multiplex PCR to discriminate bovine, porcine, and fish DNA in gelatin and confectionery products. LWT.. 2018;92:169-176.
- [CrossRef] [Google Scholar]
- Preparation of natural isovaleraldehyde by the Maillard reaction. Chinese Chem. Lett.. 2007;18(9):1049-1052.
- [CrossRef] [Google Scholar]
- Ruminant fat volatiles as affected by diet. A review. Meat Sci.. 2006;73(2):218-228.
- [CrossRef] [Google Scholar]
- Analysis of volatile compounds between raw and cooked beef by HS-SPME–GC–MS. J. Food Process. Preserv.. 2018;42(2):e13503.
- [CrossRef] [Google Scholar]
- PCA as a practical indicator of OPLS-DA model reliability. Curr. Metabolomics. 2016;4(2):97-103.
- [Google Scholar]
- Multivariate analysis in metabolomics. Curr. Metabolomics. 2012;1:92-107.
- [CrossRef] [Google Scholar]
- Rapid discrimination of pork in Halal and non-Halal Chinese ham sausages by Fourier transform infrared (FTIR) spectroscopy and chemometrics. Meat Sci.. 2012;92(4):506-510.
- [CrossRef] [Google Scholar]
- Classification of the botanical and geographical origins of Chinese honey based on 1H NMR profile with chemometrics. Food Res. Int.. 2020;137:109714.
- [CrossRef] [Google Scholar]


