

Translate this page into:
Water soluble gold-polyaniline nanocomposite: A substrate for surface enhanced Raman scattering and catalyst for dye degradation
⁎Corresponding author at: Department of Chemistry (UG & PG), Vivekananda Mahavidyalaya, Purba Bardhaman, West Bengal 713103, India. polchemvb2005@gmail.com (Palash Mondal)
-
Received: ,
Accepted: ,
This article was originally published by Elsevier and was migrated to Scientific Scholar after the change of Publisher.
Peer review under responsibility of King Saud University.
Abstract
In this work, a water-soluble gold nanoparticle-encapsulated polyaniline nanocomposite (AuNP-PANI) was prepared in the presence of an ionic surfactant such as cetyltrimethylammonium bromide (CTAB) using versatile two steps method. The prepared nanoparticles (AuNPs) were characterized by UV–Visible spectroscopy, Transmission Electron Microscope (TEM) and Dynamic Light Scattering (DLS). The nanocomposite (AuNP-PANI) were initially characterized using UV–Visible spectroscopy, Transmission Electron Microscope (TEM), Scanning Transmission Electron Microscope (STEM) and DLS. The structure and composition of AuNP-PANI further characterized using Fourier Transmission Infrared Spectroscopy (FTIR), X-ray diffraction study (XRD), Energy Dispersive X-ray Spectroscopy (EDS) and Thermogravimetric analysis (TGA). Electrochemical properties of AuNP-PANI were studied using Cyclic Voltammetry (CV). The prepared nanocomposite exhibited good surface enhanced Raman scattering (SERS) of 4-amino thiophenol (4-ATP) and 4- (dimethyl amino) pyridine (4-DMAP) for which the enhancement factor (EF) were found to be1.95 × 105 and 2.016 × 10⁵, respectively. The nanocomposite also showed excellent catalytic activity for the chemical degradation of Congo red (CR) and methylene blue (MB) as evidenced from the calculated rate constants which were determined to be 0.30 s−1 and 0.33 s−1, respectively.
Keywords
Gold nanoparticle-polyaniline nanocomposite
Cetyltrimethylammonium bromide
Surface enhanced Raman scattering
Catalytic activity
Organic dye

1 Introduction
Multifunctional metal nanoparticles such as gold (Bogdanović et al., 2014; Cui et al., 2012), copper (Bogdanović et al., 2015), silver (Blinova et al., 2009), palladium (Mullane et al., 2004), platinum (Islam et al., 2011) and nickel (Zhang et al., 2015) as well as graphene oxide (Zeng et al., 2018) have been recently reported to combined with polyaniline (PANI) to obtain new nanocomposites material. This type of nanocomposite materials is interesting as they combine the properties of both the inorganic and organic material with high surface area. PANI has drawn considerable attention in the last few years because of its unique chemical and physical properties, which are basically relative to its oxidation and protonation state (Wang et al., 2016) ranging from the fully reduced leucoemeraldine form to the half-oxidized emeraldine base form, and to the fully oxidized pernigraniline form. It is a promising material for many applications such as in rechargeable batteries, sensors, actuators, electromagnetic shielding, antistatic coatings, corrosion protection, and electro-optic and electrochromic devices (Zhang et al., 2004; Duan et al., 2006; Zhang et al., 2017).
Gold nanoparticles (AuNPs) have been achieved great attention as a convenient and suitable components for a range of applications including catalysis, photocatalysis, imaging, sensing, drug delivery and gene targeting owing to their unique properties such as electrical, optical, magnetic, chemical and redox property (Zeng et al., 2019). When PANI and AuNP are combined, nanocomposite materials can be created which possess the merits of both organic and inorganic materials. Incorporation of AuNPs into PANI improves the properties of electrochemical, electrocatalytic activities and sensing capabilities, as compared to those of pure PANI. Furthermore, the poor processability due to insolubility of PANI in common organic solvents and water may overcome after formation of PANI-AuNP nanocomposite in colloidal forms. Electrochemical and chemical methods (Lv et al., 2018) are generally two primary ways for the preparation of PANI-metal nanoparticle composites. Metal nanoparticles are incorporated electrochemically into PANI which is often achieved by the electrochemical reduction of the corresponding metal complex ions (such as AuCl4- and PtCl6-), which act as counterions in the predeposited PANI film via an ion exchange procedure (Lv et al., 2018). PANI-metal nanoparticle composites have been prepared chemically which often follows one of the two routes: (i) chemical polymerization of PANI with help of the preformed particles (Sarma and Chattopadhyay, 2004), or (ii) a “one-pot” approach where the aniline monomers act as reductant for the metal ions (Mallick et al., 2005). Under certain experimental conditions, the products of the one-pot method are in colloidal form which helping them to disperse well in the solution. Peng et al. (2006) reported the synthesis of PANI-Au nanocomposite using micelles of sodium dodecyl sulfate (SDS) by the direct oxidation of aniline where AuCl4- as the oxidant. The PANI-AuNP showing uniform morphology and well-defined inner structures as well as composite particles disperse well in water. Yukou Du and his co-workers (Zou et al., 2017; Wang et al., 2019) very recently reported the electrochemical synthesis of AuNPs/graphene and AuNPs/poly(3,4 ethylenedioxythiophene)(PEDOT) nanocomposite for sensors and electrocatalys respectively.
Surface enhanced Raman scattering (SERS) is becoming a promising technique in various fields of research such as single small molecule detection (Sharma et al., 2015), biological imaging (Dinh et al., 2005), investigation of living cells (Moreno et al., 2017), and trace analysis (Liu et al., 2011; Jiang et al., 2013). Very recent, for detection of such molecules, metallic nanoparticles (Ag, Cu, Au etc.) play very important role for SERS enhancement (Wang et al., 2012). Tian et al reported (Tian et al., 2014) the SERS activity on Rhodamine 6G using various kind of gold such as gold nanostar; nanotriangle and nanospheres. Surface functionalized AuNPs were used as a SERS substrate by Torul et al. (Torul et al., 2014) using 3-mercaptophenylboronic acid (3-MBA) and 1-decanethiol (1–DT) for the quantification of glucose. But the surface enhancement factor (EF) using only AuNPs or functionalized nanoparticles not show the promising result. Therefore, researchers are interested in increasing the EF for SERS substrate. The EF factor may be increased if the AuNPs embedded onto polymer matrix. Guo et al. (2015) reported the biocompatible SERS substrate using gold nanoparticle-based silk film where 4-(dimethylamino) pyridine and Rhodamine 6G were used for SERS analysis. Chen et al. (2016) reported that PANI when fabricating on the surface of gold nanorods (GNR) via one-pot oxidative polymerization showed the excellent SERS signals. In comparison with the conventional gold-based SERS probes (Wang et al., 2012; Zhang et al., 2013), the fabrication of GNR-PANI core-shell nanoparticles were easily fabricated in low-cost. Goldcorne-polanilineshell nanowires were prepared (Dutt et al., 2015) by swollen liquid crystals template (SLCs) method to study the SERS activity using methylene blue as well as catalytic degradation of organic dyes. Very few works have been reported on AuNPs-PANI for detection of substrate using SERS technique.
Dyes are the major product from the textile industry which cause significant pollution (Kumar and Chowdhury, 2018). Among the dye molecules, the Congo red (CR) and methylene blue (MB) are ionic dyes, and consumption of these dyes cause serious problem such as difficult breathing, burning sensation, abdominal and chest pain, severe headache, profuse sweating, mental confusion, painful micturition, and methemoglobinemia-like syndromes (Jain et al., 2007; Bhattacharyya and Sharma, 2005). Currently, different methods such as chemical reduction (Yang et al., 2018), photodegradation (Thongrom et al., 2014), reverse osmosis (Wilhelm and Stephan, 2007) and coagulation (Shi et al., 2007) have been reported in the literature for the safe disposal of these dyes. But all methods are very slow process and take a long time for degradation of dye molecules. Currently, noble metals such as Au, Pt and Ag are known to catalyse the chemical reduction of dyes, but the rate of degradation is not so high. Therefore, rate of degradation may be enhanced if the metallic nanoparticles (Au, Pt, Ag, Cu etc.) are embedded into the polymer matrix.
In the present study, we reported the synthesis of AuNP-PANI nanocomposite using two step methods where cetyl trimethylammonium bromide (CTAB) serves as the micelle in anilinium chloride medium to stabilize the PANI nanoparticles for preparing AuNP-PANI nanocomposite in the presence of prepared colloidal gold nanoparticles. The prepared nanocomposite (AuNP-PANI) is further shown to have good SERS enhancement and high rate of catalytic activity for dye degradation.
2 Experimental section
2.1 Materials
Gold(III) chloride hydrate (HAuCl4, xH2O), sodium citrate dihydrate (Na3C6H5O7, 2H2O), 4-(Dimethylamino) pyridine(4-DMAP), 4-Aminothiphenol (4-ATP), Congo red (CR), Methylene blue (MB), ammonium peroxydisulfate (APS) and cetyltrimethylammonium bromide (CTAB), all purchased from Sigma-Aldrich, were used as received. Aniline monomer (p.a., > 99.5%, Sigma-Aldrich) was distilled under reduced pressure and stored at room temperature, under argon atmosphere to use. All the working solution were prepared using Millipore filtered water.
2.2 Characterization techniques
The absorption spectra of Au NPs and AuNP-PANI nanocomposite were recorded using UV–Visible Spectrophotometer (UV-1601, Shimadzu). The size of the AuNPs and its composite were characterized using a Philips CM200-FEG high-resolution Transmission Electron Microscope (TEM) with a bias voltage of 200 kV. The TEM samples were prepared by dipping carbon-coated copper grids in the AuNP solution and AuNP-PANI solution, and then drying them in air for over two hours. An Accumet meter (AB 15, Fisher Scientific) was used to measure pH. The Fourier Transform Infrared (FTIR) were recorded using KBr pellets by using Bruker IFS66V/S. Thermo-gravimetric analysis (TGA) was made using a Pyris Diamond TG/DTA (Perkin Elmer) thermal analyser in nitrogen atmosphere at a heating rate of 10 ◦C/min. Electrochemical analysis was carried out under a nitrogen atmosphere using a handheld Potentiostat (CH Instrument). A conventional three-electrode cell was used for recording the cyclic voltammogram of AuNP-PANI nanocomposite. A glassy carbon working electrode (3 mm diameter) was prepared by successive polishing with 1.0, 0.3, and 0.05 µm alumina slurries, followed by sonication (5 min) in mili-Q water after each polishing step. The Ag/ AgCl reference electrode was prepared by immersing a silver wire into 1.0 M HCl, washing with acetonitrile, and air drying. A platinum wire was used as the counter electrode.
2.3 SERS experiments
SERS measurements were performed on a homemade Raman spectrometer with a 633-nm helium–neon excitation laser and triple-grating monochromator (Spectra Pro 300i, Action Research). The laser beam was focused onto the sample through a Mitutoyo M Plan Apo 50 X objective with 0.42 N.A. Measuring power at the samples was 1 mW, and all spectra were collected in single scan with exposure times of 30 s. The materials (1 mg/mL AuNP-PANI nanocomposite and PANI) were dispersed in 10 mL ethanolic solution of 0.1 mM 4-DMAP and 4-ATP separately for 12 h and were drop cast on quartz clean glass slides. Under similar condition PANI and AuNP-PANI were drop cast on quartz clean glass slides.
2.4 Catalytic study for dye reduction
The chemical reduction of MB and CR dyes using NaBH4 was tested in the presence of AuNP-PANI nanocomposite as catalysts using the procedure reported in the literature (Dutt et al., 2015; Shi et al., 2007). 1 mL of 10 mM NaBH4 solution was mixed with 1 mL of 1 mM MB and 1 mL of 1 mM CR separately and the mixture was made up to 10 mL using mili-Q water and then stirred for 10 min and the progress of the reaction was studied by recording the UV–visible absorption spectra at different time intervals. For reduction of dyes, AuNP-PANI nanocomposite acts as the catalyst, 40 µL of the catalyst which is dissolved in water (1 mg/mL) was added into 1 mL (1 mM) of MB or CR in the presence of 10 mM NaBH4 and sonicated for 5 min, and the progress of the reaction was monitored. The catalytic activity of the nanocomposite was compared with the activity of PANI nanostructure under similar condition.
3 Results and discussions
3.1 Characterization of AuNPs and AuNP-PANI nanocomposite
3.1.1 UV–Visible absorption spectroscopy and TEM imaging
AuNPs of various size were prepared using slightly modified ‘Turkevich method (Turkevich et al., 1951; Enustun and Turkevich, 1963) with varying concentration of sodium citrate where sodium citrate served as both the reducing agent as well as stabilizing agent. When the concentration of citrate increases the size of the AuNPs decreases which is clear evident from UV–Vis spectra (Fig. 1a) and TEM images (Fig. 2 a–d). To prepare AuNP-PANI nanocomposite, anilinium chloride (HCl medium) was taken in CTAB solution and injected into the 13-nm colloidal gold solution. The TEM image of prepared AuNP-PANI (Fig. 2f) indicates that the AuNPs are widely dispersed in PANI nanostructures.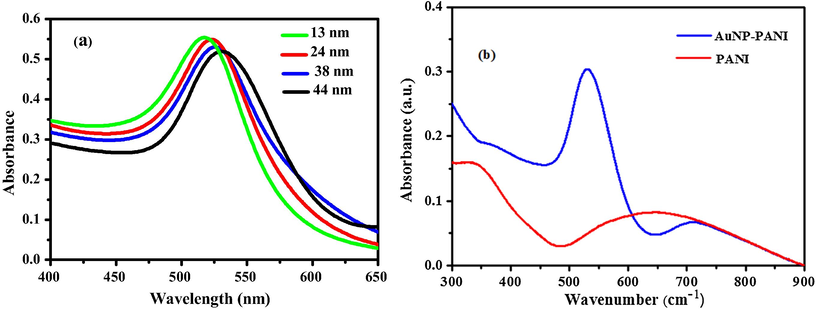
(a) Surface Plasmon absorption spectra of AuNPs of different diameters in aqueous solution, and (b) UV–Vis spectra of PANI nanostructure and AuNP-PANI nanocomposite.
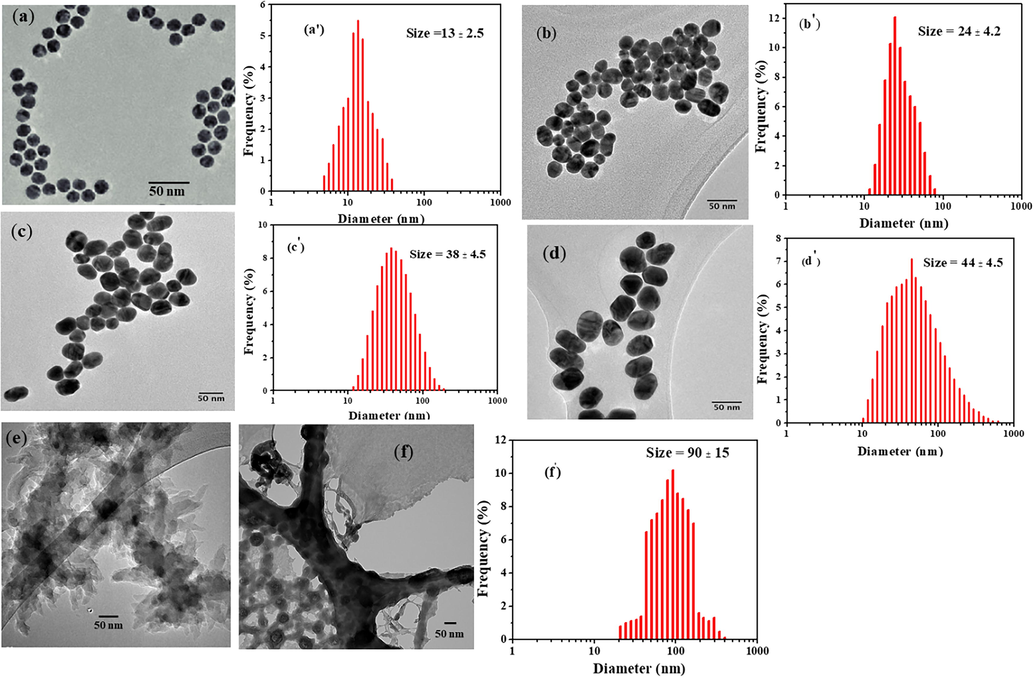
TEM images and size distribution curves of citrate capped gold nanoparticles after incubating 0.5 mL (a & a′), 1 mL (b & b′), 1.5 mL (c & c′) and 3 mL (d & d′) citrate solution; (e) Pure PANI nanostructure and (f & f′) AuNP-PANI nanocomposite.
For the preparation of PANI nanostructure, CTAB acts as a micelle to stabilize the PANI. In the presence of HCl, aniline molecules should be protonated. Thus, the aniline molecules would be mainly located in the outer region of the CTAB micelle. The electrostatic attraction made the negatively charged persulfate ions approach the outer surface of micelles and oxidize the aniline molecules, which encourage the polymerization and at the CTAB protects the aggregation PANI (Fig. 2e).
As AuNPs possess easily detectable optical properties due to their local surface plasmon resonances, we investigated the surface plasmon absorption behaviour of AuNPs in aqueous solutions (Fig. 1a) and its nanocomposite (Fig. 1b). From the experimental spectra (Fig. 1a), it is evident that the peak of SPR wavelength increases from 518 to 530 with the increases in size of AuNPs from 13 nm to 44 nm (Fig. 2 a–d) due to decrease of sodium citrate concentration. The UV–Vis spectra (Fig. 1b) of AuNP-PANI nanocomposite formed using 13 nm AuNPs colloid solution exhibits three absorption peaks at 710, 532 and 352 nm. The peak at 352 nm is attributable to polaron → π* transition (Jain et al., 2006), whereas weak broad band at ∼710 nm is associated with π → polaron band of the isolated (localized) polarons (Venugopal et al., 1995). These absorption peaks are characteristic absorption peaks of the emeraldine oxidation state of PANI (Huang et al., 2003). The presence of this peak indicates that PANI in the nanocomposite is in the conductive state (Mostafaei and Zolriasatein, 2012; Xu et al., 2010). But a distinct SPR band is observed of AuNPs in AuNP-PANI nanocomposite at 532 nm which is shifted from 518 nm. Thus, we may conclude that AuNPs are just dispersed in PANI nanostructure.
TEM images of AuNPs and their corresponding size distribution are shown in Fig. 2(a–d). From Fig. 2, one can see that the size of AuNPs increases with the decrease of citrate concentration and it has a good correlation with the increase of SPR band of AuNPs (Fig. 1a). To obtain further insight into the structural features of the AuNP–PANI nanocomposite, TEM was applied to study its surface morphology. Fig. 2e shows the typical TEM image of PANI alone and the AuNP–PANI (Fig. 2f). From the TEM image of pure PANI, we found that PANI is a nanostructure. AuNPs can be loaded onto the nanostructure of PANI, forming a relatively uniform AuNP-PANI nanocomposite with diameters between 75 and 105 nm. For further confirmation of nanocomposite (AuNP-PANI), the high-resolution selected area diffraction pattern (SAED), Scanning Transmission Electron Microscope (STEM) and Energy Dispersive X-ray Spectroscopy (EDS) elemental map of AuNP-PANI are shown in Fig. S-1 (Supporting Information).
In order to study the in-situ formation process of AuNP-PANI nanocomposite, UV–Visible spectra were recorded as a function of time (every 10 min) which tract the process (Fig. 3). From the UV–Vis spectra (Fig. 3) it is clearly that at the beginning of the reaction there is only one peak observed at 518 nm and this peak is the well-known surface plasmon resonance (SPR) band of AuNPs (Haiss et al., 2007). After addition of 10, 25 and 50 µL of anilinium chloride in CTAB to 13 AuNPs, the intensity of SPR band increased continuously and red shift of the absorption peak was observed from 518 to 528 nm (Fig. 3a–c) but no red shift was observed when the concentration of aniline is 10 µL (Fig. 3a). It is well known that, the intensity of the SPR band increases with growing particle size due to the increased mean free path of the electrons (Phan et al., 2013) as well as the change of chemical environment around the preformed AuNPs (Jain et al., 2006; Bogdanovic et al., 2015). The increasing intensity and red shift of SPR band of AuNPs may be due to after addition of aniline resulted in re-growth of the initially formed AuNPs without initiating of new particles. It should be noted that with increasing aniline volume, the particle growth process became faster (less time) and the final particle size became larger which is evident from TEM images (Insert, Fig. 3).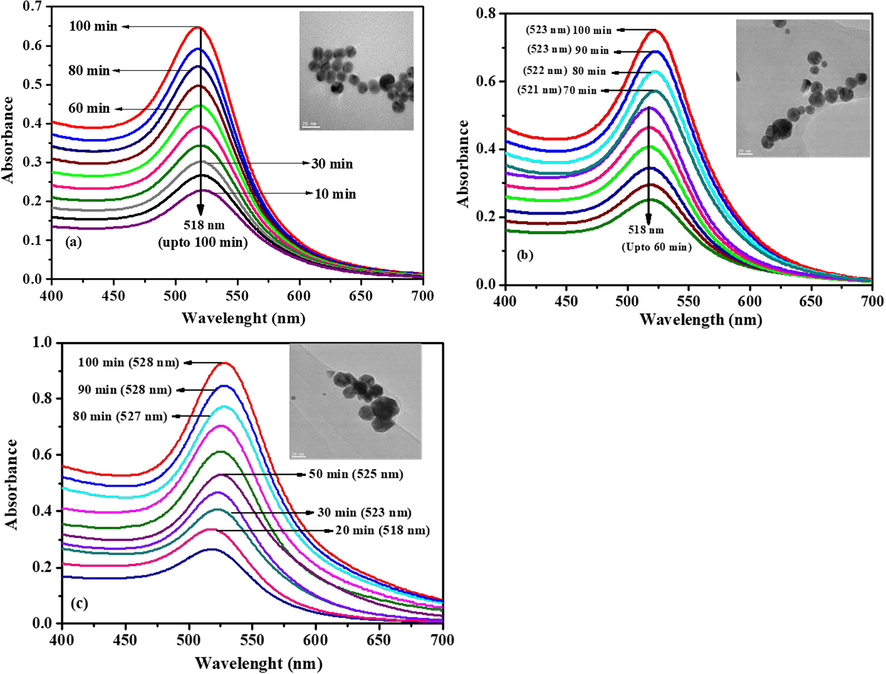
The time dependent AuNP-PANI growth using (a) 10 µL, (b) 25 µL and (c) 50 µL aniline. The spectra were recorded every 10 min. Insert showing the TEM images after adding (a) 10 µL, (b) 25 µL and (c) 50 µL aniline onto AuNPs. The scale bar is 20 nm.
3.1.2 FTIR spectra analysis
FTIR analysis was performed to characterize the samples of pure PANI nanostructure (Fig. 4a) and AuNP-PANI nanocomposites (Fig. 4b). In the IR spectrum of PANI (Fig. 4a), the prominent absorption peaks at 1622 and 1510 cm−1 are due to the quinoid and phenylene ring deformation of PANI (Pillalamarri et al., 2005). The peaks at 1192 cm−1 correspond to the in-plane bending of the C–H bonds in phenylene, and the band at 805 cm−1 is owing to the out of- plane C–H bending modes of the quinoid units (Venugopal et al., 1995). The peak at 1346 cm−1 related to protonation/doping level of PANI chain. The FTIR spectrum of AuNP-PANI nanocomposite (Fig. 5b) resembles that of pure PANI. The peak positions in the AuNP-PANI nanocomposites spectrum undergo shifting because of the AuNP assembled with the-PANI matrix. A very weak intense peak at 1452 cm−1 observe in AuNP-PANI which indicates the C–C stretching vibration of benzenoid (B) ring in NH-B-NH unit of PANI (Venugopal et al., 1995). N–H stretching vibration of PANI is observed at 3312 cm−1 shifted to 3340 cm−1 in AuNP-PANI nanocomposite. The spectral changes observed in the AuNP-PANI nanocomposite indicates that there are significant interactions between AuNP and PANI in the composite material.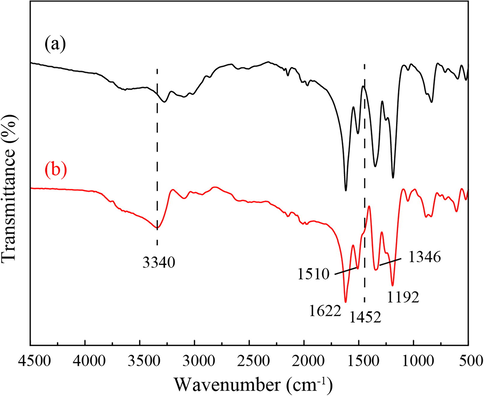
FTIR spectra of (a) PANI nanostructure and (b) AuNP-PANI nanocomposite.
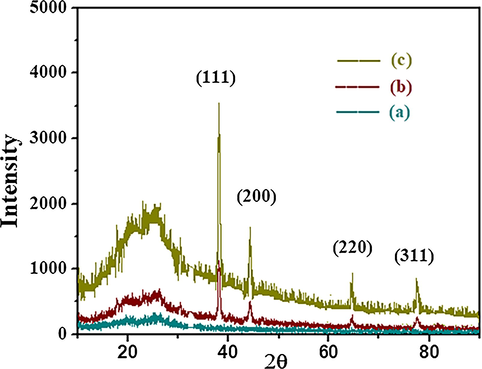
XRD pattern of (a) PANI, (b) AuNP-PANI and (c) AuNP rich AuNP-PANI.
3.1.3 X-ray diffraction analysis
Powder X-ray Diffraction (XRD) pattern of pure PANI nanostructure and AuNP-PANI nanocomposite are shown in Fig. 5. The XRD pattern of PANI nanostructure shows only two broad peaks (Fig. 5a) indicate PANI is in an amorphous state. On the other hand, the XRD pattern of AuNP-PANI nanocomposite gives new peaks (Fig. 5b). The broader peak of PANI nanostructure appearing at a 2θ value of 25° is due to the periodicity parallel to the polymer chains of PANI (Bogdanovic et al., 2015). The new peaks of AuNP-PANI nanocomposite at 2θ values at 38.2°; 44.2°, 64.7°, 77.7° and 81.72°, correspond to Bragg’s reflection from the (1 1 1), (2 0 0), (2 2 0), (3 1 1) and (2 2 2) planes of Au (Venugopal et al., 1995). These new peaks are in good agreement with previously reported data (Feng et al., 2006) and it properly matches with X’pert HighScore Plus Software. The XRD pattern of AuNP-PANI confirms the presence of AuNP embedded in a PANI matrix. The relative intensity of XRD peaks in AuNP-PANI increases when the amount of AuNP was increased.
3.1.4 Thermal analysis
Results of thermal gravimeter analysis of pure PANI nanostructure and AuNP-PANI nanocomposite are shown in Fig. 6. The PANI nanostructure (Fig. 6a) shows two stage degradation of weight loss while AuNP-PANI nanocomposite shows three stage degradation of weight loss. The first stage weight loss observed prior to 100 °C due to the loss of moisture from both the samples. The second stage weight loss occurs after 450 °C for PANI nanostructure which indicates the degradation of polymer. In case of AuNP-PANI nanocomposite, the second stage weight loss (150–550 °C) may be due to loss of AuNP from the PANI matrix. The third stage weight loss (>550 °C) of the nanocomposite may be due to degradation of PANI from the nanocomposite. From this analysis, it may be concluded that after incorporation of AuNP onto PANI the thermal stability of polymer is enhanced which indicates an interaction between AuNP and PANI matrix. Thus, the TGA results are in good agreement with the XRD pattern (Fig. 5) of PANI and AuNP-PANI with respect to the interaction between AuNP and PANI matrix.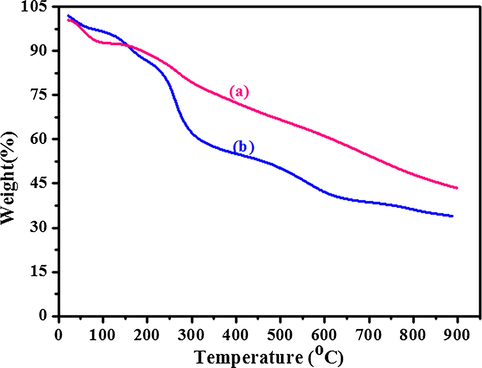
TGA analysis of (a) PANI nanostructure and (b) AuNP-PANI nanocomposite.
3.2 Electrochemical studies
The rate of electron transfer increases when strong electronic interaction occurs between conducting nanomaterials and PANI matrix (Tian et al., 2004). AuNP-PANI modified electrode exhibited a strong redox peak at 640 mV in 0.1 M PBS solution (Fig. 7c). No such strong peak was observed on the bare GCE (Fig. 7a) and bare GCE modified PANI electrode (Fig. 7b). Thus, PANI is inactive at pH 7.0 PBS solution. Thus, the present study shows that PANI retains its redox activity under acidic condition which is similar to the earlier (Pillalamarri et al., 2005). But AuNP-PANI nanocomposite is redox active at pH 7.0 due to high surface area which produces more active sites for charge transfer through the nanocomposites’ matrix (Pillalamarri et al., 2005). Fig. 8 shows the electrochemical responses of the AuNP-PANI nanocomposite modified electrode at various pH. In this case the redox peak at around 275 mV (Fig. 8), this can be attributed to the conversion of emeraldine form (half oxidised form) to pernigraniline (full oxidised form). Another peak at negative potential ranging around 650 mV is due to the conversion of leucoemeraldine to conductive emeraldine form.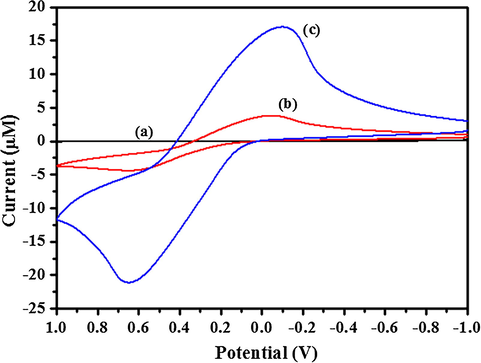
Cyclic Voltammogram (CV) of (a) bare GCE, (b) PANI and (c) AuNP-PANI modified electrode in 0.1 M PBS solution (pH = 7.0). The scan rate was 50 mV/s.
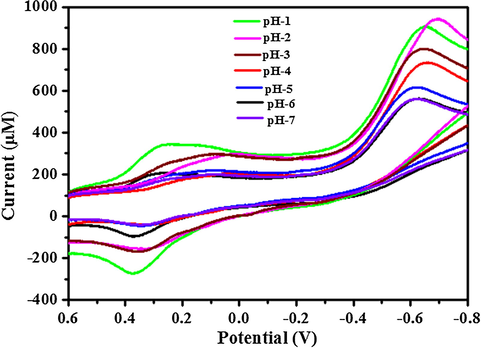
Cyclic Voltammograms of the AuNP-PANI modified electrode in 0.1 M PBS solutions of different pHs. The scan rate was 50 mV/s.
With an increase in pH of the solution (Fig. 8), the redox peaks move closer corresponds to the both leucoemeraldine/pernigraniline form of PANI. The intensity of redox peak current (ip) increases with the decrease of pH of the solution which indicates that the kinetics of the oxidation and reduction processes depend on the concentration of H+ ions in the solution. In other words, the proton is involved in the rate-determining step of the redox process. The electrochemical behaviour of the nanocomposites’ is similar to that of the pure PANI sample (Tang et al., 2008), which clearly suggests that the addition of AuNP does not influence the electrochemical behaviour of PANI.
3.3 SERS studies
4-ATP and 4-DMAP were used as reporter molecules to study the SERS activity by AuNP-PANI nanocomposite. Such molecules were chosen because of their strong affinity with AuNP surface and they show distinct Raman features. The Raman spectra of these two molecules immersed with pure PANI and AuNP-PANI are shown in Figs. 9a and 9b). The strong absorption band (Fig. 9a, red line) of bulk 4-ATP located at 1591, 1178, 1086, and 463 cm−1 which are assigned to the modes of υCC, δCH, υCS, and υCCC, respectively (Li et al., 2009) and these peaks were observed to be enhanced when 4-ATP was treated with AuNP-PANI surfaces. All the peaks assignments are presented in Table S1 (Supporting information). In the SERS spectrum, the band of υCS shifts from 1091 cm−1 to 1086 cm−1, and the intensity of the band at 1591 cm−1 increases largely, indicating that the thiol group of 4-ATP directly contacts with AuNP of AuNP-PANI nanocomposites.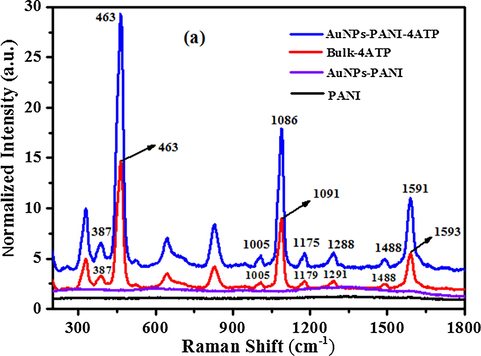
Raman Spectra of PANI (black line), AuNP-PANI (violet line), bulk 4-ATP (violet line) and SERS spectrum of 4-ATP absorbed on AuNP-PANI surface (blue line). AuNP-PANI was immersed in 0.1 mM 4-ATP solution (ethanol) and then dried in air.
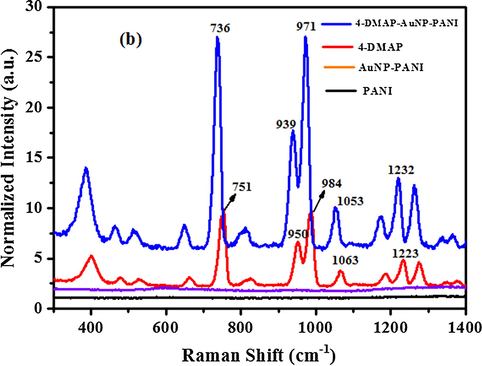
Raman Spectra of PANI (black line), AuNP-PANI (violet line), bulk 4-DMAP (violet line) and SERS spectrum of 4-DMAP absorbed on AuNP-PANI surface (blue line). AuNP-PANI was immersed in 0.1 mM 4-DMAP solution (ethanol) and then dried in air.
For further confirmation of SERS activity of AuNP-PANI molecule, we studied another molecule 4-DMAP (Fig. 9b) and its peaks assignment are presented in Table S2 (supporting information). The predominant strong band (Fig. 9b, blue line) of AuNP-PANI-4-DMAP at 736, 939, 973, 1053 and 1223 cm−1 are due to the C–N–C wagging, Ring breathing & CH3 rocking, trigonal bending and C–H out-plane bending, CH3 rocking and C–H in-plane bending respectively (Guo et al., 2015). The potential of AuNP-PANI substrate is demonstrated by considerable enhancement of intensities and the enhancement factor (EF) of intensity was calculated by using the following equation (Camargo et al., 2009; Chen et al., 2016)
3.4 Catalytic activity
The catalytic activity of AuNP-PANI nanocomposites for the reduction of organic dyes was monitored using UV–visible spectroscopy. The catalytic reduction of CR and MB was followed by using the procedure reported earlier (Zhizhchenko et al., 2018). The time-resolved UV–visible absorption spectra of CR and MB in the presence of the catalysts and the reducing agent are shown in Figs. 10a and 10b, respectively. The progress of the reduction of CR and MB is evident in Figs. 10a and 10b in the form of decrease in the intensity of the absorbance maximum(λmax) at 500 nm for CR and at 664 nm for MB, respectively. The characteristic peaks for the dyes disappear completely after 8 min, indicating the completion of the reaction. The reduction of the dyes in absence of catalyst (AuNP-PANI) is negligible after 8 min (Fig. S2, Supporting Information). The dye reduction data fitted well in a linear plot of ln(C0/Ct) versus reduction time. Ct and C0 are the concentrations of the dye at time t and t0 respectively. The reaction thus follows the first order kinetics as with respect to CR and MB as the concentration of NaBH4 (10 mM), was relatively larger than that of CR and MB (1 mM), which was reported earlier (Wang et al., 2012; Enustun and Turkevich, 1963). The kinetic curves for the reductive degradation of CR and MB in the presence and absence of the catalyst and comparison of first-order rates are shown in Fig. S3(a) and (b) (Supporting Information). The rate constant (k, s−1) was obtained from the linear plot and found to be 0.30 s−1 and 0.33 s-1for CR and MB respectively. Both these values are higher than the reported values with gold nanoparticles (Wang et al., 2012). A comparison of the catalytic activities of various catalysts for the chemical reduction of CR and MB is summarized in Table S-3 (Supporting Information). It is clear from the Table S-3 (Supporting Information) that the present AuNP-PANI nanocomposite is better than other known catalysts which have been reported in the literature (Sharma et al., 2016; Gan et al., 2013; Nadaf and Kanase, 2016; Subair et al., 2016).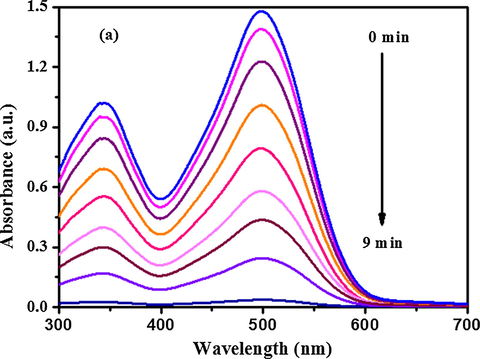
Time dependent UV–Visible absorption spectra of CR showing the dye reduction by NaBH4 in presence of AuNP-PANI nanocomposite. The spectra were recorded every 1 min.
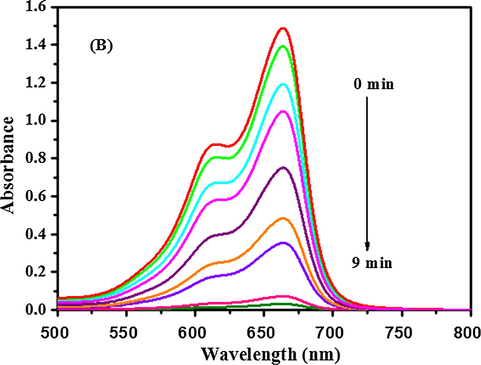
Time dependent UV–Visible absorption spectra of MB showing the dye reduction by NaBH4 in presence of AuNP-PANI nanocomposite. The spectra were recorded in every 1 min.
It has been reported that without any catalyst the reduction of dyes (CR & MB) in the presence of excess NaBH4 will not proceed (Enustun and Turkevich, 1963). In the present study, we also tested the catalytic activity of bulk PANI in the presence of NaBH4 under similar condition and the results are shown in Fig. S4 (Supporting Information), which clearly reveals that the bulk PANI does not catalyse the dye reduction. Thus, the catalytic reduction process mainly depends on the presence of gold in AuNP-PANI nanocomposite. Generally, the coin metal acts as an electron relay in the redox reactions (Enustun and Turkevich, 1963). The electrons are donated by NaBH4 to Au and the dye molecules capture the electrons from Au (Enustun and Turkevich, 1963). It is evident that the adsorption of dye molecules on the catalyst surface are required for the promotion of electron relay. The enhanced catalytic activity of the nanocomposite over Au nanoparticles may be due to the concentration of dyes molecules enriched onto the colloid gold nanoparticles in AuNP-PANI nanocomposite.
4 Conclusions
In summary, we have synthesized gold nanoparticles of various size by changing the concentration of sodium citrate. The smaller size (13 nm) of gold nanoparticles is used for the synthesis of AuNP-PANI nanocomposite in widely disperse form. The variation of size of AuNPs with respect to citrate concentration is characterized by UV–Visible spectroscopy and TEM images. The nanocomposite (AuNP-PANI) was initially characterized using UV–Visible spectroscopy, Transmission Electron Microscope (TEM), Scanning Transmission Electron Microscope (STEM) and the size of the corresponding AuNP-PANI from DLS properly matched with TEM image. The structure and composition of AuNP-PANI were further characterized using Fourier Transmission Infrared Spectroscopy (FTIR), X-ray diffraction study (XRD), Energy Dispersive X-ray Spectroscopy (EDS) and Thermogravimetric analysis (TGA). Electrochemical properties of AuNP-PANI were studied using Cyclic Voltammetry (CV). The formation of the nanocomposite reveals that increasing the concentration of aniline, accelerates the reaction, and increase the particle size. AuNP-PANI nanocomposite shows excellent SERS enhancement towards the reference molecules (4-DMAP & 4-ATP) and use as an efficient catalyst for the degradation of dye molecules. AuNP-PANI may be used for biosensors.
Acknowledgements
Palash Mondal thanks UGC, New Delhi, India for providing financial support in the form of “RAMAN FELLOWSHIP” [Sanctioned No. 5-103/2016(IC), Dated-10-02-2016] and Vivekananda Mahavidyalaya, Burdwan, West Bengal, India for granting study leave. Prof. Yarger would like to acknowledge funding from US Army Research Office under Grant No. W911NF-11-1-0263 and US Department of Defence Air Force Office of Scientific Research (FA9550-17-1-0282).
References
- Interfacial synthesis and characterization of gold/polyaniline nanocomposites. Synth. Met.. 2014;195:122-131.
- [Google Scholar]
- Au(III)-promoted polyaniline gold nanospheres with electrocatalytic recycling of self-produced reactants for signal amplification. Chem. Comm.. 2012;48:10307-10309.
- [Google Scholar]
- Nanomaterial with high antimicrobial efficacy−copper/polyaniline nanocomposite. ACS Appl. Mater. Interfaces. 2015;7:1955-1966.
- [Google Scholar]
- The oxidation of aniline with silver nitrate to polyaniline−silver composites. Polymer. 2009;50:50-56.
- [Google Scholar]
- Fabrication and electrocatalytic properties of polyaniline/Pt nanoparticle composites. Chem. Commun.. 2004;1606–1607
- [Google Scholar]
- In−situ synthesis of a palladium− polyaniline hybrid catalyst for a suzuki coupling reaction. J. Organomet. Chem.. 2011;696:2206-2210.
- [Google Scholar]
- Nickel-functionalized reduced graphene oxide with polyaniline for non-enzymatic glucose sensing. Microchim. Acta. 2015;182:625-631.
- [Google Scholar]
- Platinum nanozyme-catalyzed gas generation for pressure-based bioassay using polyaniline nanowires-functionalized graphene oxide framework. Anal. Chem.. 2018;90:12299-12306.
- [Google Scholar]
- Polyaniline (PANi) based electrode materials for energy storage and conversion. J. Sci.: Adv. Mater. Dev.. 2016;1(3):225-255.
- [Google Scholar]
- Synthesis of polyaniline nanofibers by “Nanofibers Seeding”. J. Am. Chem. Soc.. 2004;126:4502-4509.
- [Google Scholar]
- A nanofibrous composite membrane of PLGA-chitosan/PVA prepared by electrospinning. Euro. Polym. J.. 2006;42(9):2013-2022.
- [Google Scholar]
- Preparation, characterization, and electrochromic properties of nanocellulose-based polyaniline nanocomposite films. ACS Appl. Mater. Interfaces. 2017;9(19):16426-16434.
- [Google Scholar]
- Palindromic molecular beacon based z-scheme BiOCl-Au-CdS photoelectrochemical biodetection. Anal. Chem.. 2019;91:2447-2454.
- [Google Scholar]
- Anal. Chem.. 2018;90:7086-7093.
- One pot synthesis of nanoparticles of aqueous colloidal polyaniline. J. Phys. Chem. A. 2004;108:7837-7842.
- [Google Scholar]
- Polymerization of aniline by auric acid: Formation of gold decorated polyaniline nanoballs. Macromol. Rapid Commun.. 2005;26:232-235.
- [Google Scholar]
- Micelle-assisted one-pot synthesis of water-soluble polyaniline-gold composite particles. Langmuir. 2006;22:10915-10918.
- [Google Scholar]
- Electrochemical synthesis of gold nanoparticles decorated flower-like graphene for high sensitivity detection of nitrite. J. Colloids Interface Sci.. 2017;488:135-141.
- [Google Scholar]
- Anchoring gold nanoparticles on poly(3,4-ethylenedioxythiophene)(PEDOT) nanonet as three-dimensional electrocatalysts toward ethanol and 2-propanol oxidation. J. Colloids Interface Sci.. 2019;541:258-268.
- [Google Scholar]
- Surface-enhanced Raman scattering for medical diagnostics and biological imaging. J. Raman Spectros.. 2005;36(6–7):640-647.
- [Google Scholar]
- Nanoparticles for live cell microscopy: A surface-enhanced Raman scattering perspective. Sci. Rep.. 2017;7(1):4471-4479.
- [Google Scholar]
- Single molecule detection from a large-scale SERS-active Au79Ag21 substrate. Sci. Rep.. 2011;1:112-118.
- [Google Scholar]
- Surface enhanced Raman scattering with gold nanoparticles: effect of particle shape. Anal. Chem.. 2013;85:2809-2816.
- [Google Scholar]
- Phys. Chem. Chem. Phys.. 2012;14:5891-5899.
- Anal. Methods. 2014;6:9116-9123.
- Glucose determination based on a two component self-assembled monolayer functionalized surface enhanced Raman spectroscopy (SERS) probe. Anal. Methods. 2014;6:5097-5104.
- [Google Scholar]
- Gold nanoparticle doped silk film as biocompatible SERS substrate. RSC Adv.. 2015;5:1937-1942.
- [Google Scholar]
- Fabrication of graphene and AuNP core polyaniline shell nanocomposites as multifunctional theranostics platforms for SERS real-time monitoring and chemo-photothermal therapy. Theranostics. 2016;6:1096-1104.
- [Google Scholar]
- Noble metal coated single-walled carbon nanotubes for applications in surface enhanced Raman scattering imaging and photothermal therapy. J. Am. Chem. Soc.. 2012;134:7414-7422.
- [Google Scholar]
- Multifunctional gold nanorods with ultrahigh stability and tunability for in vivo fluorescence imaging, SERS detection, and photodynamic therapy. Angew. Chem. Int. Ed.. 2013;52:1148-1151.
- [Google Scholar]
- Goldcore–polyanilineshell composite nanowires as a substrate for surface enhanced Raman scattering and catalyst for dye reduction. New J. Chem.. 2015;39:902-908.
- [Google Scholar]
- Removal of the hazardous dye rhodamine B through photocatalytic and adsorption treatments. J. Environ. Manage.. 2007;85:956-964.
- [Google Scholar]
- Kinetics and thermodynamics of Methylene Blue adsorption on Neem (Azadirachta indica) leaf powder. Dyes Pigm.. 2005;65:51-59.
- [Google Scholar]
- Degradation characteristics of color index direct blue 15 dye using iron-carbon micro-electrolysis coupled with H2O2. Int. J. Env. Res. Pub Health.. 2018;15(7)
- [CrossRef] [Google Scholar]
- Photocatalytic degradation of dye by Ag/ZnO prepared by reduction of Tollen’s reagent and the ecotoxicity of degraded products. Korean J. Chem. Eng.. 2014;31(4):587-592.
- [Google Scholar]
- Photodegradation of rhodamine B in aqueous solution via SiO2@TiO2 nano-spheres. J. Photochem. Photobiol. A. 2007;185:19-27.
- [Google Scholar]
- Removal of direct dyes by coagulation: the performance of preformed polymeric aluminum species. J. Hazard. Mater.. 2007;143:567-574.
- [Google Scholar]
- A Study of the nucleation and growth processes in the synthesis of colloidal gold. Discuss. Faraday Soc.. 1951;11:55-63.
- [Google Scholar]
- Ultrafast cooling of photoexcited electrons in gold nanoparticle−thiolated DNA conjugates involves the dissociation of the gold−thiol bond. J. Am. Chem. Soc.. 2006;128:2426-2433.
- [Google Scholar]
- Photoinduced doping and photolithography of methyl−substituted polyaniline. Chem. Mater.. 1995;7:271-276.
- [Google Scholar]
- Polyaniline nanofibers: facile synthesis and chemical sensors. J. Am. Chem. Soc.. 2003;125(2):314-315.
- [Google Scholar]
- Synthesis and characterization of conducting polyaniline nanocomposites containing ZnO nanorods. Progr. Nat. Sci.: Mat. Int.. 2012;22(4):273-280.
- [Google Scholar]
- The preparation of polyaniline/gold nanocomposites by self-assembly and their electrochemical applications. React. Funct. Polym.. 2010;70:663-668.
- [Google Scholar]
- Determination of size and con-centration of gold nanoparticles from UV–vis spectra. Anal. Chem.. 2007;79:4215-4221.
- [Google Scholar]
- Surface plasmon resonances of protein-conjugated gold nanoparticles on graphitic substrates. Appl. Phys. Let.. 2013;103:63702-163711.
- [Google Scholar]
- Interfacial synthesis of gold–polyaniline nanocomposite and its electrocatalytic application. ACS Appl. Mater. Interfaces. 2015;7:28393-28403.
- [Google Scholar]
- One−pot synthesis of polyaniline−metal nanocomposites. Chem. Mater.. 2005;17:5941-5944.
- [Google Scholar]
- Poly(N-vinyl-2-pyrrolidone) (PVP)-capped dendritic gold nanoparticles by a one-step hydrothermal route and their high SERS effect. Langmuir. 2006;22:4384-4389.
- [Google Scholar]
- Polyaniline/gold nanoparticle multilayer films: assembly, properties, and biological applications. J. Mat. Chem.. 2004;16(21):4103-4108.
- [Google Scholar]
- Poly (N-vinyl Pyrrolidone) (PVP)-caped dendritic gold nanoparticles by a one-step hydrothermal route and their high SERS effect. Langmuir. 2008;24:1763-1768.
- [Google Scholar]
- Dimers of silver nanospheres: facile synthesis and their use as hot spots for surface-enhanced raman scattering. Nano Letters. 2009;9:485-490.
- [Google Scholar]
- Isolating and probing the hot spot formed between two silver nanocubes. Angew. Chem. Int. Ed.. 2009;48:2180-2184.
- [Google Scholar]
- Fabrication of graphene and AuNP core polyaniline shell nanocomposites as multifunctional theranostic platforms for SERS real-time monitoring and chemo-photothermal therapy. Theranostics. 2016;6:1096-1104.
- [Google Scholar]
- On-demand concentration of an analyte on laser-printed polytetrafluoroethylene. Nanoscale. 2018;10(45):21414-21424.
- [Google Scholar]
- Tuning the surface enhanced Raman scattering and catalytic activities of gold nanorods by controlled coating of platinum. J. Colloid Interf. Sci.. 2016;463:180-187.
- [Google Scholar]
- Controlled synthesis of Au-loaded Fe3O4@C composite microspheres with superior SERS detection and catalytic degradation abilities for organic dyes. Dalton Trans.. 2013;42:8597-8605.
- [Google Scholar]
- Biosynthesis of gold nanoparticles by Bacillus marisflavi and its potential in catalytic dye degradation. Arab. J. Chem. 2016:1-9.
- [Google Scholar]
- Polydopamine modified membranes within situ synthesized gold nanoparticles for catalytic and environmental applications. Chem. Eng. J.. 2016;295:358-369.
- [Google Scholar]
Appendix A
Supplementary material
Supplementary data to this article can be found online at https://doi.org/10.1016/j.arabjc.2019.05.004.
Appendix A
Supplementary material
The following are the Supplementary data to this article:Supplementary data 1
Supplementary data 1


