

Translate this page into:
Yogurt drink spoilage profiles: Characterization of physico-chemical properties and coliform potability analysis
⁎Corresponding author. saiful-z@ukm.edu.my (Saiful Irwan Zubairi), zainun@ukm.edu.my (Zainun Nurzahim)
-
Received: ,
Accepted: ,
This article was originally published by Elsevier and was migrated to Scientific Scholar after the change of Publisher.
Abstract
This study aims to determine the yogurt drink spoilage profiles and its physico-chemical properties correlation as to investigate the coliform potability level upon exposure to an open air (unsealed condition). The commercially available three induced contamination of fruit (berry) flavoured yogurt drinks (labelled as A0 (original-flavoured Farm Fresh™), A1 (Farm Fresh™), A2 (Marigold™) and A3 (Nestle®)) were created to pre-run a spoilage indicator model system with regards to the colony formation unit (cfu) and its physico-chemical properties. Physio-chemical analysis (e.g., Brix, pH, colour and contact angle) and microbiological analysis were performed at 30 min intermittently for up to 4.5 h as soon as the food sample was unsealed (room environment condition: 27 ± 2 °C; relative humidity (RH): 73 ± 1%). The results showed the presence of yeast and fungus in yogurt drinks after all samples were opened and exposed to the environment. The total formation of yeast colonies and fungi of all three-yogurt berry drink brands on DRBC agar were inevitably high during the treatment (p < 0.05). The amount of cfu/ml of yeast and fungus was higher than the total coliform colony (Escherichia coli) formed throughout the sampling period. The pH analysis showed a significant decrease throughout the treatment due to the accumulation of lactic acid which resulted in high acidity (p < 0.05). The colour profiles of A1 brand showed a significant improvement as compared to A2 brand due to the increasing redundancy degree (p < 0.05). However, the A3 brand has a significant low reduction value, which is the degree of yellowness due to the microorganism’s contamination. Finally, the contact angle analysis at 0:00–3:00 h, the range of contact angle of A1 (exclusively selected due to highly pathogenic spoilage) was 45.34–42.80° while at 3:30–4:30 h was 58.66–61.12° with diameter 0.9 and 0.7 cm respectively. In conclusion, the presence of yeast and mould was first detected in the samples as early as 0:30 h (1.4 × 10⁴ cfu/ml) and become unsatisfactory after being exposed to environment for 4 h and 30 min. The contact angle spoilage indicator exceeds from 45.34° (control) to 58.66° as to tangibly indicate the unsatisfactory values in terms of microbiological quality and potentially harmful to the consumers.
Keywords
Yogurt drink
PLLA
Physico-chemical
Coliform colony
Spoilage indicator

1 Introduction
Yogurt is an excellent substitute of snacks and it contributes variety for nutritious snacks in market and may provide good metabolism and energy balance (Fernandez et al., 2017). Yogurt drink with fortified probiotic is considered a product that contains living microorganisms which can improve human gastrointestinal tract function, helps digestion of lactose, reduces or prevents diarrhoea and strengthens immune system (Chandan et al., 2017). Yogurt drinks or stirred yogurt are generally preferred in Central Asia, Anatolia, Balkan as well Middle East countries and has total solid contents not exceeding 11%. The drinks have essentially undergone homogenization process to further reduce the viscosity with sweetener, flavouring and colouring ingredients are incorporated invariably (Yildiz, 2010). Different types of manufactured yogurt contain various compositional milk fat in them. For instance, yogurt drinks must contain >8.25% (w/w) soluble solids excluding milk fat; full fat yogurt with >3.25% (w/w) milk fat; non-fat yogurt with <0.5%, (w/w) milk fat and low-fat yogurt with 2.0% (w/w) milk fat before being added with other ingredients (Food and Drug Administration, 2011). Fermentation method was used to produce high quality of good microbes (e.g., probiotic) prior to addition in the yogurt-based product. However, during product manufacturing, bad sanitation and preparation could leads to unwanted contamination either through bacterial or yeast and mould. Yeast and mould can easily grow on foods with high sugar and salt content and cause food spoilage (Perricone et al., 2017; Altay et al., 2013). The presence of yeast and mould in milk culture turns the food to become more acidic, thus inhibits bacterial growth (Mayoral et al., 2005). The acidic resistant properties of yeast and mould makes them able to survive in extreme conditions, thus causes food spoilage and economic losses for some food products (Perricone et al., 2017). It is difficult for pathogens to survive in yogurt, because it has high acidity values (between pH 3.8–4.2). However, it can be damaged by the acidic organisms such as yeast and mould. For example, the lactose fermentation yeasts (Kluyveromyces fragilis) and yeast in fruit yogurt (Saccharomyces cerevisiae) are important for yogurt development. But, fungal yeast such as Geotrichum and fungi that grows on surfaces such as Mucor, Rhizopus, Aspergillus, Penicillium, and Alternaria can cause food damage. Guidelines for microbiological quality have suggested that yogurt should contain 108 cfu/g of initial contamination level, <1 cfu g coliform <1 cfu/g mold, and <10 cfu/g yeast. However, fruit yogurt may contain as much as 100 cfu/g yeast for it to remain in good quality (Adams & Moss, 2008). In order to assure the quality and safety of yogurt beverages, rapid detection methods, sensitive, cost-effective and easy-to-use tools are required (Poghossian et al. 2019). Recent studies have shown that super hydrophobic surface can be formed using a simple and cost-effective method of poly(L-lactic acid) (PLLA) polymers (Sousa et al., 2011). Surface properties play an important role in bacterial growth. Several materials have been used as substrates for cell immobilization such as stone, sand, latex and steel. There are several criteria used to characterize good substrate and surface for bacterial growth. Among the physicochemical criteria of the surface is its hydrophobicity. In biological systems, hydrophobic interactions are the strongest non-covalent interactions, thus become a factor in microbial adhesion on the surface (Sanin et al., 2003). The development of film made from PLLA, which is poly(L-lactic acid) can be carried out to detect the presence of microorganisms in yogurt drink products through the spoiled bio-fluid wetting behavioural (Yusof et al., 2018). However, bacterial strains can thrive on the surface of PLLA (Sousa et al., 2011) which could be a small drawback in developing such kit for rapid pathogenic detection as it could reduce the accuracy of the contact angle measurement (e.g., competing non-covalent interactions). Additionally, it is important to know how effective the PLLA thin film kit can detect the presence of microorganisms through contact angle measurement. Generally, contact angle was used to study the wetting properties in solid (PLLA)/liquid (milk) phase interaction whereby the components in microorganisms contributes to hydrophobicity of a cell surface against those phases, thus plays an important role in the attachment of microbes on the solid surface and the effect of the liquid-containing microbes contact angle (Che Johari et al., 2017; Zubairi et al., 2016; Krasowska & Sigler, 2014). For that reason, the objective of this study is to determine the spoilage profiles of different commercially available yogurt drinks and their physico-chemical properties correlation (mainly on contact angle profiles via PLLA thin film) as to analyse the coliform potability level upon exposure to an open air (unsealed condition).
2 Materials and methods
2.1 Materials
The commercially available natural flavoured yogurt drinks (Farm Fresh™), berry mixed yogurt drinks (Farm Fresh™), berry mixed yogurt drinks (Marigold™) and berry mixed yogurt drinks (Nestle®) were purchased from local Jaya Grocer supermarket at Bandar Baru Bangi, Malaysia. The pelletized poly(L-lactic acid) (PLLA) polymer was used to prepare the thin films with 98% purity and purchased from Sigma-Aldrich™ (M) Sdn. Bhd. Finally, the two main media ingredients used in analysing the growth of yeast and fungus from yogurt drinks were Violet Red Bile (VRB) agar and Dichloran Rose Bengal Chloramphenicol (DRBC) agar. Those microbial growth agars were of analytical grade and also purchased from Sigma Aldrich™ (M) Sdn. Bhd.
2.2 Preparation of yogurt drink
The commercially available original-flavoured (A0: Farm Fresh™) and fruit (berry) flavoured yogurt drinks from three different brands of: a) Farm Fresh™ (A1); b) Marigold™ (A2); c) Nestle® (A3) were coded and used in this experiment. The samples were bought on the experiment day and kept refrigerated at 4–8 °C to ensure its freshness. The yogurt was immediately transferred into five 100 ml Schott bottles with equal volume once unsealed and were left uncapped for 4 h and 30 min (Yusof et al., 2018). All analyses were carried out within 30 min time interval as soon as the packaging was unsealed and exposed to the environment (location: centralized air-conditioning dry processing room, Food Pilot Plant, UKM Bangi. Room environment condition: 27 ± 2 °C; relative humidity (RH): 73 ± 1%) for 4 h and 30 min. Finally, the physico-chemical analysis was carried out on an original flavoured (A0) and three different contaminated flavoured yogurt drinks (A1, A2 and A3) prior to correlation analysis.
2.3 Fabrication of PLLA thin film
The thin film PLLA was prepared based on the prior work with minor modifications (Yusof et al., 2018; Ab Kadir et al., 2017). Approximately 1 g of PLLA powder was added into 100 ml chloroform in a Schott bottle, heated at 60 °C and stirred by using magnetic stirrer at 100 rpm/min until fully dissolved. The PLLA solution was then transferred into two petri dishes with equal volume. Petri dishes were then dried in a desiccator overnight. The PLLA films were then formed and cut into a micro slide size (Dimension: 2.5 cm × 7.5 cm). The film was then glued onto a micro slide prior to contact angle analysis.
2.4 Contact angle analysis
The contact angle of all contaminated yogurt drinks was measured by using Simplified Experimental Setup (SES) (Ramlan et al., 2018; Ramlan et al., 2017; Zubairi et al., 2015a; Zubairi et al., 2015b) through the usage of Drop Sessile Analyser (DSA), Theta Lite (Biolin Scientific; China) with an accuracy of ±0.1° (±0.01 mN/m). Approximately 3 μL of yogurt drink was dropped onto a micro slide-glued PLLA thin film to measure its contact angle in the centralized air-conditioning dry processing room (room environment condition: 27 ± 2 °C; relative humidity (RH): 73 ± 1%). The reading was taken in quintuplicate (n = 4).
2.5 Brix analysis
Brix analysis was done using a portable refractometer (Master 53a, Japan). Approximately 25 μL of sample droplets was carefully titrated on the screen sensor of the instrument, followed by an instant reading towards visible light. The analysis was carried out in triplicate (n = 3).
2.6 Colour analysis
The Minolta colorimeter (CR400, Japan) was used for colour profiles analysis by using Hunterlab (USA) colour scale method as a full colour descriptor. The results were presented in CIE L* (lightness); a*(redness/greenness) and b* (yellowishness/bluishness). The instrument was calibrated using a white tile prior to measurement. The analysis was carried out in triplicate (n = 3).
2.7 The pH analysis
The pH of all contaminated, fresh and control samples were measured using a portable standard pH meter (MeterLab® PHM210, Japan). Pre-calibration was carried out by measuring standard solutions of pH 4 (acidic), pH 7 (neutral) and pH 9 (alkaline). The analysis was carried out in triplicate (n = 3).
2.8 Spoilage kinetic analysis
Microbiological analysis was carried out based on the prior work with a slight modification (Yusof et al., 2018). All samples were collected within 30 min time interval right after the packaging was unsealed and exposed to the environment. Approximately 10 ml of each sample was diluted in 90 ml of 0.85% (w/v) sterile saline solution to determine the number of yeast and mould (Dichloran Rose-Bengal Chloramphenicol Agar) [DRBC] and coliform bacteria (Violet Red Bile agar) [VRB]. Agar plates were incubated at 25 °C for 3–5 days and at 30 °C or 37 °C for 24 ± 2 h for yeast and mould and coliform bacteria respectively.
2.9 Statistical analysis
Minitab version 17 (Minitab Inc., Australia) were used to analyse the data obtained. One-way ANOVA, Tukey and Fischer test were carried out to compare the mean values with confidence interval level of 95% (p < 0.05). The coefficient of determination, R2 and Pearson’s correlation, r was carried out to measure the strength of relationship between contact angle and other variables.
3 Results and discussion
3.1 Physico-chemical profiles
3.1.1 Brix profiles
Fig. 1 shows the brix profiles of yogurt drink within 30 min time interval of more than 4 h of unsealed product exposure. The brix values of all berry-flavoured yogurt drinks were significantly different (p < 0.05) with natural flavoured yogurt drink (A0). The brix values also 200B200Bdisplayed significant changes (p < 0.05) between the initial time interval (0:30 h) and the end of the final measurement (4:30 h) with all samples exhibited the same gradual decline tendency. However, only A2 was considered to exhibit an early decrease in brix value (p < 0.05) at 3:30 h and later towards the end of the measurement. It was observed that the A2 and A3 samples were consistently lower than A0 sample throughout the four and a half hours exposure interval to indicate that the original formulation of A0 was probably used to produce the berry-flavoured sample (A1) of the same brand (p > 0.05). The changes in brix values of A0 and A1 of the same brand were seen at the intervals of 1:00, 2.30 and 4:30 h of exposure where A1 leads to an approximately 1.5 unit lower than A0 (p < 0.05). However, the prior work on UHT milk (Yusof et al., 2018) exhibited no changes throughout the whole exposure (oBx = 12–13) as to indicate that the viscosity changes during high pressure homogenization (HPH) process might have triggered the proteins and carbohydrates (e.g., milk sugar and sweetener) depolymerisation and eventually breaking them into smaller molecular sizes that could ease the degradation process (Mesa et al., 2020). Hence, the decreasing brix value indicate a decreasing accumulative number of total soluble solid (TSS) in the liquid which was due to the denaturation of depolymerised whey protein, sweetener, milk lactose and bacterial acidification in yogurt drink that enhances the autocatalytic degradation (Sichani et al., 2014; Trachoo, 2002).
Brix profiles of fresh (control) and contaminated yogurt drinks with 30 min of exposure interval. The commercially available original flavoured (A0: Farm Fresh™) and fruit (berry) flavoured yogurt drinks from three different brands of: a) Farm Fresh™ (A1); b) Marigold™ (A2); c) Nestle® (A3). a-dMean with different letters indicate significant difference (p < 0.05) between each of intermittent points of exposure.
3.1.2 Colour profiles
Colour plays an important factor to determine the yogurt physical quality which ultimately affect consumer acceptance (Sichani et al., 2014). Fig. 2 shows the colour profiles of L* values (lightness) of all yogurts brand within 30 min time interval after being unsealed and exposed for more than 4 h. Both A0 and A1 of the same brand showed that the L* values200B200B was significantly increased (p < 0.05) at time interval measured except for 2:30 and 3:00 h of exposure. Both samples of the same brand (A0 and A1) readings were in accordance to the prior work (Yusof et al., 2018) where the L* was more than 80 to indicate the samples were almost of the same brightness as in the UHT milk. For both A2 and A3, the brightness spectrum was found to significantly decreased (p < 0.05) at 1:00 and 2:30 onwards; and at 4:00 h of exposure respectively. The original dark purple colour became slightly darker towards the end of exposure interval. However, the (L*) colour profile of A0 at each of the 30-minute interval was considered higher than the other samples and increased towards the end of exposure intervals (p < 0.05). The result was in fact in accordance with the prior works that showed the lightness of barberry yogurt (original flavour) increased during storage (Mezquita et al., 2015; Ścibisz et al., 2019) with otherwise contrary to A2 and A3 profiles. Meanwhile, Fig. 3 and Fig. 4 showed the colour profiles of redness (a*) and yellowness (b*) where all sample profiles were significantly decreased (p < 0.05) in redness and yellowness towards the end of 4.5 h of exposure. The yellowness profiles of A0 and A1 (b* = 8–9) were similar as in the UHT milk yellowish spectral colour (Yusof et al., 2018). This was substantially higher than of that A2 and A3 (b* = 3–4) due to its less amount of berry fruit-based colouring substances (A1) which contain high red- and blue–purple colour pigmentation. Hence, the colour profile changes of lightness (L*), redness (a*) and yellowness (b*) were mainly caused by the degradation of anthocyanins whilst the decreasing of redness and yellowness was due the cleavages of polymerization compounds present in the yogurt broth (Ścibisz et al., 2019). The red- and blue–purple colour expression of berry yogurt is highly influenced by the concentration of anthocyanin. The high temperature, acidity (low pH value), water activity and light exposure interval can affect the stability of this bioflavonoid-based anthocyanin (Fadzilah et al., 2020; Mohd Azzimi et al., 2018). Besides, the microbial activity of lactic acid bacteria present in yogurt can also produce hydrogen peroxide (due to the oxidative reaction) and glycosidase enzymes, which accelerate the destruction of anthocyanin and colour pigment (Ścibisz et al., 2019).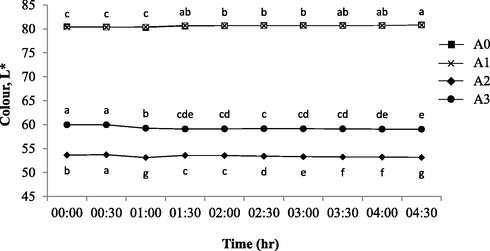
Colour (L*) profiles of fresh (control) and contaminated yogurt drinks with 30 min of exposure interval. The commercially available original flavoured (A0: Farm Fresh™) and fruit (berry) flavoured yogurt drinks from three different brands of: a) Farm Fresh™ (A1); b) Marigold™ (A2); c) Nestle® (A3). a-gMean with different letters indicate significant difference (p < 0.05) between each of intermittent points of exposure.

Color (a*) profiles of fresh (control) and contaminated yogurt drinks with 30 min of exposure interval. The commercially available original flavoured (A0: Farm Fresh™) and fruit (berry) flavoured yogurt drinks from three different brands of: a) Farm Fresh™ (A1); b) Marigold™ (A2); c) Nestle® (A3). a-fMean with different letters indicate significant difference (p < 0.05) between each of intermittent points of exposure.
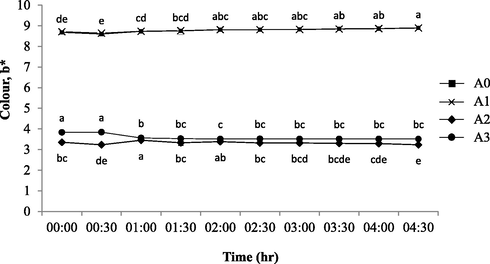
Color (b*) profiles of fresh (control) and contaminated yogurt drinks with 30 min of exposure interval. The commercially available original flavoured (A0: Farm Fresh™) and fruit (berry) flavoured yogurt drinks from three different brands of: a) Farm Fresh™ (A1); b) Marigold™ (A2); c) Nestle® (A3). a-eMean with different letters indicate significant difference (p < 0.05) between each of intermittent points of exposure.
3.1.3 The pH profiles
Fig. 5 shows the pH value profiles of all yogurt drink at 30 min time interval measurement after being exposed unsealed for more than 4 h. The A2 and A3 pH values was considered at low acidity threshold as compared to A0 (control) and A1 (p < 0.05) towards the end of the 4.5 h exposure. All samples progressively endured the same profiles with the prior work (Yusof et al., 2018) despite the UHT milk demonstrated lower acidity (pH = 6.80–6.85) than those commercialized yogurt drinks due to their freshly-prepared product with no added sugar and preservatives. Thus, the low acidity in A2 and A3 might have been due to the high sugar content (20% higher: which was stated in the nutritional content label) as compared to A0 and A1 that acts as natural preservatives. This condition will hinder bacteria in the yogurt drink to form lactic acid or any drastic changes to its acidity microenvironment and at the same time competing with the beneficial microbes available in the drink (Hartati, 2012). For that reason, the differences in pH values between all samples was mainly caused by the difference in sample composition, such as sugar and organic acids, fortification of natural or synthetic preservatives and types of microbes available in the product (Arican & Andic, 2011; Hassan et al., 2010).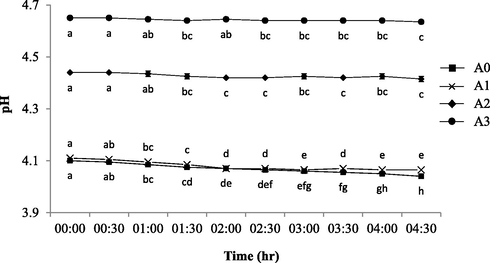
The pH profiles of fresh (control) and contaminated yogurt drinks with 30 min of exposure interval. The commercially available original flavoured (A0: Farm Fresh™) and fruit (berry) flavoured yogurt drinks from three different brands of: a) Farm Fresh™ (A1); b) Marigold™ (A2); c) Nestle® (A3). a-eMean with different letters indicate significant difference (p < 0.05) between each of intermittent points of exposure.
3.2 Spoilage kinetic profiles
Fig. 6 shows coliform kinetic profiles of 30 min of unsealed exposure intervals up to 4.5 h. The range of coliform for A1, A2 and A3 berry-flavoured yogurt drink were between 0.70 and 2.45, 0.70–3.15 and 0.70–2.85 cfu/ml respectively. The coliform number shows a progressively significant increased (p < 0.05) as early as at 0.30, 2.00 and 1.30 h respectively until to the end of the 4:30 h exposure interval. This result shows that all brands complied with good hygienic manufacturing practices and used natural preservatives (high in sugar content) even though are relatively contrary with the pH profiles that exhibit A1 as the highest producing lactic acid with the lowest acidity. Moreover, the results were in accordance to the prior work (UHT milk) where the spiking phase were attained in full swing from 2.30 to 3.00 h of exposure (Yusof et al., 2018) as to indicate the spoilage is strengthening fast. The amount of coliform in yogurt is considered safe and limited at <10 cfu/ml whilst it is worth noting that it should be less than 50 cfu/ml in raw milk (Food and Drug Administration, 2015; Malaysia Food Regulation, 1985). In fact, the coliform bacteria are the indicator for faecal contamination in milk, usage of contaminated water, improper sanitizing, equipment maintenance and improper washing (Banik et al., 2014). Thus, all samples were within the allowed maximum limit of FDA (2015) and Malaysian Food Regulation (1985) and considered as safe to be consumed upon exposing it unsealed of no more than 3 h.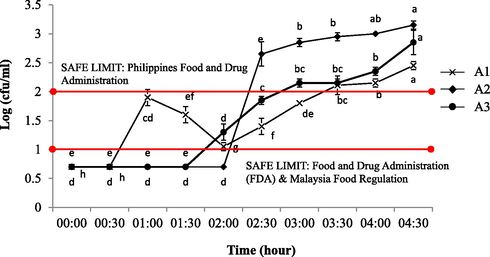
Total number of microbial colonies on VRBA agar of contaminated yogurt drinks with 30 min of exposure interval. The commercially available fruit-flavoured (berry) yogurt drinks from three different brands of: a) Farm Fresh™ (A1); b) Marigold™ (A2); c) Nestle® (A3). a-hMean with different letters indicate significant difference (p < 0.05) between each of intermittent points of exposure.
Meanwhile, Fig. 7 shows the yeast and mould microbial analysis and the range of yeast and mould colony formation for berry-flavoured yogurt drink of A1, A2, A3 and A0 (control) were in-between 0.35 × 10⁴–5.05 × 10⁴, 0.7 × 10⁴–2.4 × 10⁴, 1.7 × 10⁴–1.95 × 10⁴ and 2.2 × 10⁴–3.4.75 × 104 cfu/ml respectively. The A1 yogurt drink shows a drastic increased (p < 0.05) of yeast and mold colony across 4.30 h exposure, followed by A0 (control), A2 and A3 berry-flavoured yogurt drinks. The yeast and mould colony present reflects a poor hygiene practice and improper sanitation level during processing. The acceptable value of mould and yeast in beverages should be between 102 –103 cfu/ml and yogurt exceeding this range should be rejected from consumption as it indicates potential health hazards and imminent spoilage respectively (Philippines Food and Drug Administration, 2013). For that reason, all 4 samples of yogurt drink in this study were considered as unsafe to be consumed after more than 4 h of exposure even though the bacterial cfu profiles exhibited a safer limit for consumption (<10 cfu/ml). However, the severity of the bacterial contamination would continuously give more to a high level of food safety indicator than the yeast and mould contamination as this might not be the case of a severe food spoilage due to processing operational errors (e.g., sterilization and hygienic misconduct) (Adams & Moss, 2008) since the products itself came from a highly HACCP compliance companies that does not compromised on food safety regulations. For that reason, the air-borne microscopic contaminants (e.g., mould and fungus spores) that came out from the centralized air-conditioning vent throughout 4.5 h of exposure might have been the main spoilage indicator as the aforementioned results suggested a consistent severity profiles of the cross contamination (Fig. 9).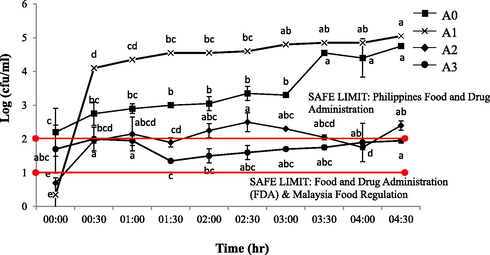
Total number of microbial (yeast and mould) colonies on DRBC agar of contaminated yogurt drinks with 30 min of exposure interval. The commercially available original flavoured (A0: Farm Fresh™) and fruit (berry) flavoured yogurt drinks from three different brands of: a) Farm Fresh™ (A1); b) Marigold™ (A2); c) Nestle® (A3). a-eMean with different letters indicate significant difference (p < 0.05) between each of intermittent points of exposure.
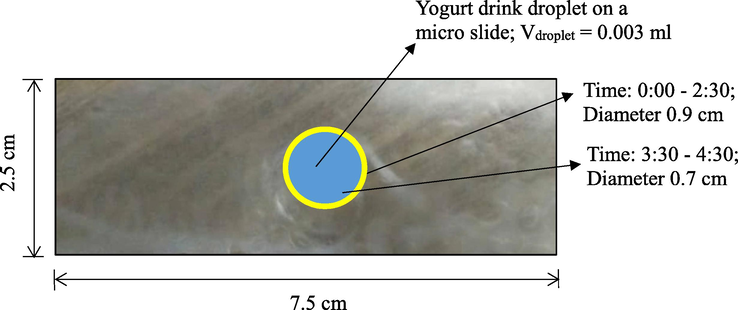
Contaminated Fresh Farm™ berry-flavoured yogurt drink (A1) spoilage indicators on PLLA thin films (aerial view) fabricated on a borosilicate micro slide.
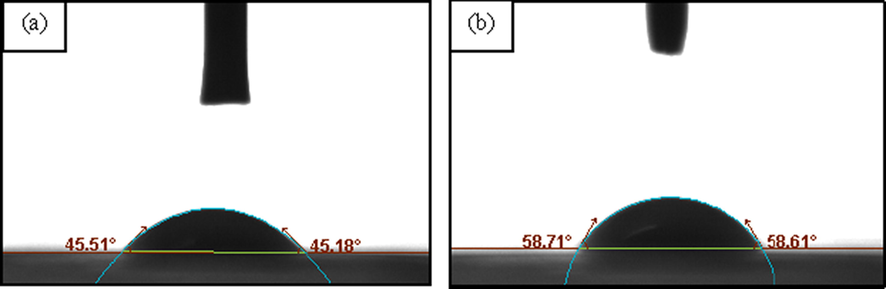
Transversal view of a droplet of: a) fresh (A0: control) and b) contaminated Farm Fresh™ berry-flavoured yogurt drink (A1) at 0:00 hr and 3:30 h with a contact angle of 45.34° and 58.66° respectively on the PLLA film surface.
3.3 Contact angle profiles and spoilage indicator
The contact angle profiles and spoilage indicator wetting profile on PLLA film of A1 berry-flavoured yogurt drink within 30 min of exposure intervals were shown in Table 1, Table 2, Fig. 8 and Fig. 9 respectively. The A1 brand was chosen for the spoilage indicator measurement because it has the highest colony count results of yeast and mould as per analysed in the spoilage kinetic analysis via DRBC. As shown in Table 1, the contact angle value was significantly 200B200Bincreased (p < 0.05) as it changes progressively towards hydrophobic regime (>60°) (Zubairi et al., 2015a) from 2:30 h of intermittent exposure onwards. Unlike prior work, the UHT milk abruptly moved towards hydrophobic regime within 1.00 h of exposure due to the fact that there were no added natural preservatives in the milk and the spoilage was indeed inevitable (Yusof et al., 2018). In fact, the widespread reduction of the droplet diameter (Table 2) indicate on how noticeably the changes were attained due to a drastic shifting of the non-covalent interactions between the yogurt drink and the PLLA film. The yogurt drink hydrophilicity began to shift to hydrophobic condition as it reaches at 3.30 h of exposure to indicate the breakages of a certain functional food that reduces the hydrogen bonding (Jurid et al., 2020; Krasowska & Sigler, 2014). The increasing number of yeast and mould colonies may have led to the decrease of some soluble solids and eventually causing the denaturation of whey protein and the continuity of the acidic process by existing bacteria in the yogurt drink might have also contributed to the affinity of the surface tension on top of the PLLA film (Ab Kadir et al., 2017; Arican & Andic, 2011; Hassan et al., 2010). a-eMean with different alphabet shows significant difference between samples (p < 0.05).
Time
cfu/ml
Contact angle (θ)
0:00 (Control)
0.7
45.34 ± 0.12a
1:30
4.1
42.43 ± 0.11b
2:30
4.6
42.80 ± 0.13c
3:30
4.8
58.66 ± 0.11d
4:30
5.0
61.12 ± 0.13e
Time (h)
Dependent variables
Diameter of circle indicator (cm)
Range of contact angle (θ)
Range of Brix (°Bx)
Range of colour (L*)
Range of pH
Colony count (cfu/ml)
0:00–2:30
45.34–42.80
13–12.05
80.33–80.67
4.11–4.07
0.7–4.6
0.9
3:30–4:30
58.66–61.12
11.95–11.45
80.69–80.81
4.07–4.07
4.8–5.0
0.7
3.4 Correlation between variables (physicochemical properties) and spoilage profiles
The Pearson’s correlation coefficient (r) was calculated between variables (e.g., brix, colour, pH and contact angle) and microbial growth/colony count (CC: cfu) between two-time intervals of 0:00–2:30 and 3:30–4:30 exposure interval of A1 as shown in Fig. 10. The intensity of the colour is proportional to the correlation coefficient so the stronger the correlation (i.e., the closer to −1 or +1), the darker the boxes. The probability values (p-values) were also calculated and the data points with p-values larger than 0.05 were marked with a strikethrough, indicating a lack of statistical confidence. From the r values it is observed how the variables are linearly correlated; they can be between +1 and −1 where a positive (negative) number indicates that variable A increases as variable B increases (decreases) (Jurid et al., 2020). Thus, it was observed that as the exposure time at room temperature increased, all physical parameters showed significant difference (p < 0.05) of responses that led to the increasing of contact angle and number of yeast and mould colonies. Fig. 10 shows the direct correlation between microbial growth (colony count) with pH, brix, colour (L*) and contact angle of A1 with 30 min interval. The correlation coefficient of R2 was 0.86, 0.87, 0.79 and 0.88 respectively. The value was very close to 1, thus, showed a strong positive correlation between microbial growth (CC) with pH, brix and colour (L*). In fact, these correlations were in accordance to prior work (Yusof et al., 2018) as the two UHT milk physical properties of contact angle and colour (L*) shown a strong positive interactions (0.62 and 0.57 respectively) against its spoilage profiles (CC). It was observed that the greater the number of colony formation, the lower the pH value of the sample. The samples turn more acidic due to the increasing growth of microbes and the formation of lactic acid formation throughout the exposure interval. The brix values 200B200Bindicate the density and viscosity of an object in a liquid. The result shows that the increasing number of yeast and mould colonies lead to decreasing brix or soluble solids value. This was caused by the denaturation of whey protein, sweetener, milk lactose (particulate depolymerisation due to high pressure homogenization process) and the continuity of the acidic process by bacteria in the yogurt drink. In terms of colour (L*), there was a significant increasing value of L* between the initial (0.00) and the final 4:30 h exposure interval. This indicates that there is no fat content in yogurt drinks promotes L* reduction in the sample. The correlation coefficient R2 is 0.79, which is slightly lower than the value of the correlation in pH and brix analysis. In addition, there was a significant increase of contact angle value between the exposure periods of 3:30–4:30 h. Thus, the A1 yogurt drink was selected in this test due to highest amount of colony formation. Finally, the affinity (hydrophilicity) between the yogurt drink droplets and PLLA film decrease over the exposure period as hydrogen bonding is no longer becoming the strongest non-covalent interaction due to proteins and carbohydrates depolymerisation broken linkages (Wang et al., 2014). The adhesion reduction makes the yogurt drink droplets become more rounded with higher contact angle value. The value of the correlation coefficient, R2 is 0.88, thus there was a strong positive correlation between log values of cfu/ml with contact angle value throughout the exposure interval and this could be the best milk-based product spoilage indicator of all.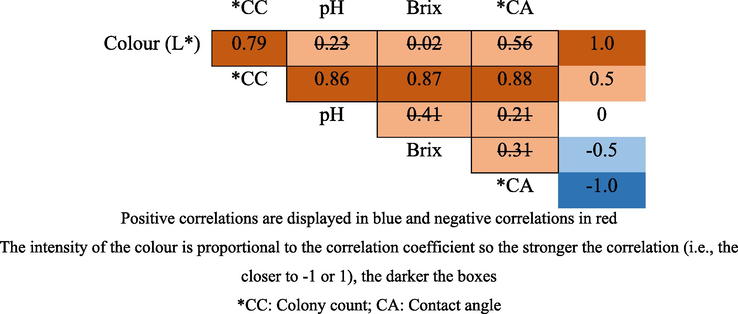
Pearson’s correlation coefficient (r) between all variables. Values marked with a strikethrough indicates that this p-value is not valid (p > 0.05).
4 Conclusion
In this research, the presence of spoilage microorganisms in the commercially-available yogurt drink had led to its physico-chemical changes and microbiological quality. In terms of colour, there is significance increase in brightness, redness and yellowness. Besides, all samples become more acidic and decreasing in brix across the exposure interval. Microbial analysis showed an increasing growth of colony formation unit with the presence of yeast and mould was detected as early as the first 30 min after exposed to room temperature of 24 ± 3 °C and relative humidity of 73 ± 1% (w/v). The presence of yeast and mould was 1.4 × 10⁴ cfu/ml and significantly increase (p < 0.05) at the end of 4:30 h of exposure interval. Spoilage in yogurt drinks can be detected through PLLA thin films and the presence of colonies in A1 at 3:30 h (4.8 log cfu/ml) increasing the contact angle to 58.66° with a strong correlation on the colony formation unit (R2 = +0.88) towards the ends of the exposure. Hence, the ambient exposure of the yogurt drink products of less than 5 h with unsatisfactory value of microbiological quality has proven to be potentially harmful to the consumers might possibly be due to the microscopic air-borne contaminants (e.g., mould and yeast spores) prowling in the room and definitively not from companies poor hygienic and sanitation preparation in the processing line as they are accredited with HACCP certification. Not to mention poor consumer’s awareness of an easily-spoiled and chilled products storage method enhances the chances of food spoilage once the product is opened unsealed for consumption.
Acknowledgements
We are grateful to Universiti Kebangsaan Malaysia (UKM) for the financial support (GUP-2018-057; GUP-2018-080), Ministry of Higher Education (Malaysia) (FRGS/1/2020/WAB04/UKM/02/4) and the Department of Food Sciences, Faculty of Science and Technology, UKM Bangi for allowing this study to be carried out at the Functional Food and Nutritional laboratory.
Data Availability Statement
No data were used elsewhere to support this study and it was entirely a new set of data.
Declaration of Competing Interest
The authors declare that they have no known competing financial interests or personal relationships that could have appeared to influence the work reported in this paper.
References
- Food Microbiology. Guildford, UK: University of Surrey; 2008. The Royal Society of Chemistry
- Physico-chemical properties of recycled refined, bleached and deodorized (RBDPO) palm olein: which cycle should the olein considered spoilage? Jurnal Teknologi (Sciences and Engineering). 2017;79(4):17-25.
- [Google Scholar]
- A review on traditional turkish fermented non-alcoholic beverages: microbiota, fermentation process and quality characteristics. Int. J. Food Microbiol.. 2013;167(1):44-56.
- [Google Scholar]
- Survival of E. Coli O157: H7 in yogurt incubated until two different pH values and stored at 4 oC. Kafkas Universitesi Veteriner Fakultesi Dergisi. 2011;17(4):537-542.
- [Google Scholar]
- Microbiological quality analysis of raw, pasteurized, UHT milk samples collected from different locations in Bangladesh assay. Stamford J. Microbiol.. 2014;4(1):5-8.
- [Google Scholar]
- Chapter 1 - Yogurt: Historical background, health benefits, and global trade. In: Shah N.P., ed. Yogurt in Health and Disease Prevention. Academic Press; 2017. p. :3-29.
- [Google Scholar]
- Chapter 28 - Role of yogurt in the nutrition and health of children and adolescents. In: Shah N.P., ed. Yogurt in Health and Disease Prevention. Academic Press; 2017. p. :491-505.
- [Google Scholar]
- Food and Drug Administration (FDA), 2011. Subchapter B - FOOD FOR HUMAN CONSUMPTION Part 131 - MILK AND CREAM. Subpart B - Requirements for Specific Standardized Milk and Cream. Code of Federal Regulations. U. S. Department of Health and Human Services, Sec. 131.200 (Yogurt). Washington, DC.
- Food and Drug Administration (FDA), 2015. Standards for grade A milk and milk products, in Grade A Pasteurized Milk Ordinance. U.S. Department of Health and Human Services, Public Health Service, Washington, DC, pp. 28–31.
- Fadzilah, M. F., Zubairi, S. I., Lazim, A., Mohd Kasim, Z., Zainal Abidin, N. Physico-chemical and sensory acceptance of Carica papaya leaves extract edible O/W emulsion as prospective natural remedies. Arabian J. Chem. 13(11), 7829–7842.
- Lactose and reduction sugar concentrations, pH and the sourness of date flavored yogurt drink as probiotic beverage. Jurnal Aplikasi Teknologi Pangan. 2012;1(1):1-3.
- [Google Scholar]
- Nutritional evaluation of yoghurt prepared by different starter cultures and their physiochemical analysis during storage. Afr. J. Biotechnol.. 2010;9(20):2913-2917.
- [Google Scholar]
- The effect of repetitive frying on physicochemical properties of refined, bleached and deodorized Malaysian tenera palm olein during deep-fat frying. Arabian J. Chem.. 2020;13(7):6149-6160.
- [Google Scholar]
- How microorganisms use hydrophobicity and what does this mean for human needs? Front. Cell. Infect. Microbiol.. 2014;4(2014):112.
- [Google Scholar]
- Regulation 39: Fifteenth Schedule (Table 1). Microorganisms and Their Toxins. Kuala Lumpur: MDC; 1985.
- Detection of kluyveromyces marxianus and other spoilage yeasts in yoghurt using a pcr-culture technique. Int. J. Food Microbiol.. 2005;105(1):27-34.
- [Google Scholar]
- Milks pigmentation with astaxanthin and determination of colour stability during short period cold storage. J. Food Sci. Technol.. 2015;52(3):1634-1641.
- [Google Scholar]
- Response surface optimization on the phenolic content and antioxidant activities of Sabah snake grass (Clinacanthus nutans) leaves extract. Int. Food Res. J.. 2018;25(Suppl. 1):S105-S115.
- [Google Scholar]
- High homogenization pressures to improve food quality, functionality and sustainability. Molecules. 2020;25:3305.
- [CrossRef] [Google Scholar]
- Chapter 5 - Yeasts. In: Bevilacqua A., Corbo M.R., Sinigaglia M., eds. The Microbiological Quality of Food. Woodhead Publishing; 2017. p. :121-131.
- [Google Scholar]
- Rapid methods and sensors for milk quality monitoring and spoilage detection. Biosens. Bioelectron.. 2019;140:111272.
- [CrossRef] [Google Scholar]
- Philippines Food and Drug Administration, 2013. Revised guidelines for the assessment of microbiological quality of processed food. FDA Circular No.: 2013-010. Republic of the Philippines, Department of Health Food and Drug Administration. Accessed on 03rd Feb 2020.
- Effect of plasma treatment (He/CH4) on the glass surface during drying to reduce powder flux adhesion. Sains Malaysiana. 2018;47(6):1147-1155.
- [Google Scholar]
- Effects of chemical surface coating (rain-ZTM) on the powder yield of spray-drying: a preliminary approach. Acta Hortic. (1152):165-174.
- [CrossRef] [Google Scholar]
- Effect of starvation on the adhesive properties of xenobiotic degrading bacteria. Process Biochem.. 2003;38(6):909-914.
- [Google Scholar]
- Color stability of fruit yogurt during storage. J. Food Sci. Technol.. 2019;56(4):1997-2009.
- [Google Scholar]
- The effect of cress seed gum and locust bean gum on textural properties of low fat set yoghurt. Indian J. Sci. Res.. 2014;5:439-445.
- [Google Scholar]
- Superhydrophobic poly(L-lactic acid) surface as potential bacterial colonization substrate. AMB Express. 2011;1(34)
- [CrossRef] [Google Scholar]
- Relationship between secondary structure and surface hydrophobicity of soybean protein isolate subjected to heat treatment. J. Chem.. 2014;2014 Article ID 475389, 10 pages
- [CrossRef] [Google Scholar]
- Rapid microbial detection model system in UHT milk products using poly(L-lactic acid) (PLLA) Thin Film. Sains Malaysiana. 2018;47(11):2677-2683.
- [Google Scholar]
- Chapter 1 - Overview of yogurt and other fermented dairy products. In: Yildiz F., ed. Development and manufacture of yogurt and other functional dairy products. CRC Press; 2010. p. :1-46.
- [Google Scholar]
- Polyhydroxyalkanoates (PHAs) for tissue engineering applications: biotransformation of palm oil mill effluent (POME) to value-added polymers. Jurnal Teknologi (Sciences and Engineering). 2016;78(1):13-29.
- [Google Scholar]
- The effect of surface heterogeneity on wettability of porous three dimensional (3-D) scaffolds of poly(3-hydroxybutyric acid) (PHB) and poly(3-hydroxybutyric-co-3-hydroxyvaleric acid) (PHBV) Jurnal Teknologi (Sciences and Engineering). 2015;75(1):305-312.
- [Google Scholar]
- A rapid approach to the pore interconnectivity analysis of porous three dimensional scaffolds of poly(3-hydroxybutyric acid) (PHB) and poly(3-hydroxybutyric-co-3-hydroxyvaleric acid) (PHBV) through non-invasive color staining method. Sains Malaysiana. 2015;44(9):1351-1356.
- [Google Scholar]


