

Translate this page into:
Two-dimensional liquid chromatographic analysis of ramelteon in human serum
⁎Corresponding author. Tel.: +90 212 4400000; fax: +90 212 440 0252. olcaysagirli@yahoo.com (Olcay Sagirli)
-
Received: ,
Accepted: ,
This article was originally published by Elsevier and was migrated to Scientific Scholar after the change of Publisher.
Peer review under responsibility of King Saud University.
Abstract
In this study, a selective and sensitive new 2D-LC method was developed for the determination of ramelteon in human serum. Separations were performed using the following systems: the first dimension consisted of a C18 (50 mm × 2.1 mm) pre-separation column and the mobile phase of 45% acetonitrile: 55% 10 mM ortho-phosphoric acid solution mixture and the second dimension consisted of a pentafluorophenyl propyl (150 mm × 4.6 mm) separating column and the mobile phase of 40% methanol: 60% 2.25 mM ortho-phosphoric acid solution mixture. Two systems were connected with a 6 port valve including 200 μL sample loop and separations were performed continuously through injections. Detection wavelength has been selected as 203 nm for both systems. Extraction of drug substance from serum samples was performed using protein precipitation method with methanol and the calibration curve was linear over a concentration range of 1–50 ng/mL. The accuracy and precision of the method were determined as 1.49–4.24% and 1.75–3.63% ranges for RSD and RME, respectively. The absolute recovery of the drug was found as 80.28%. The developed method was successfully applied for the determination of ramelteon in serum samples collected from a volunteer who had received 8 mg ramelteon orally.
Keywords
Ramelteon
Two-dimensional liquid chromatography
UV detection
Human serum
Validation

1 Introduction
Ramelteon (RMT) is chemically designated as (S)-N-[2-(1,6,7,8-tetrahydro-2H-indeno[5,4-b]furan-8-yl)ethyl]propionamide and contains one chiral center (Fig. 1). RMT is a tricyclic synthetic analog of melatonin that has shown both sleep-promoting and circadian rhythm phase-shifting properties in clinical trials that acts specifically on MT1 and MT2 melatonin receptors (Hegde and Schmidt, 2006). RMT has relatively short half-life (1.2 h). When administered orally, RMT is absorbed rapidly in fasting conditions and reaches its peak concentration in plasma in 45 min, averaging to 30 min to 1.5 h (Stevenson et al., 2004).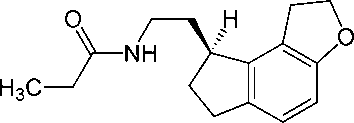
Chemical structure of RMT.
In the literature, several liquid chromatographic (LC) methods were observed about analysis of RMT in pharmaceutical preparations or biological samples (Karim et al., 2006; Ogawa et al., 2014; Patil et al., 2013; Reddy et al., 2012; Varaprasad et al., 2013). Recently, two-dimensional liquid chromatography (2D-LC) method has become popular as it generates excellent resolution, the comprehensive separation of complex biological mixtures (Bushey and Jorgenson, 1990; Dixon et al., 2006; Moore Jr. and Jorgenson, 1995; Regnier et al., 2001; Shalliker and Gray, 2006; Stoll et al., 2006, 2007). There is no method available in serum samples for determining RMT using 2D-LC method.
The present manuscript describes the development of a validated 2D-LC method with UV detection for the determination of RMT in human serum. A one-step sample preparation method was used prior to chromatographic analysis, which was easy and convenient. This is the first method for the analysis of RMT in serum samples using 2D-LC systems in the literature. Finally, the proposed method was applied for the determination of RMT in serum samples collected from a volunteer who had received 8 mg RMT orally.
2 Experimental
2.1 Chemicals and solutions
RMT active pharmaceutical ingredient was supplied from MSN Laboratories Pvt. Ltd. (Hyderabad, India) and its pharmaceutical preparation (Rozerem Film Tablet® 8 mg of RMT) was provided from Krebs Pharmaceutica Import–Export GmbH (Offenbach am Main, Germany). All chemicals and solvents were of analytical and gradient grades. Ultra-pure water was prepared by an ELGA Purelab Option-Q DV 25 (UK) water purification system.
The first stock solution of RMT was prepared by dissolving 10 mg of RMT in methanol and then two times diluting it with same solvent to give 1 μg/mL concentration. The second stock solutions of RMT were prepared at concentrations of 10, 50, 100, 200, 400 and 500 ng/mL with methanol dilution from first stock solution for spiked serum study. The standard solutions of RMT were prepared at different concentrations (1, 5, 10, 20, 40 and 50 ng/mL) diluted with methanol from second stock solutions for using in the absolute recovery study.
2.2 Instrumentation and chromatographic conditions
The chromatographic separations were performed on a Shimadzu 2D-LC system (Kyoto, Japan). First dimension system consisted of an LC-20AT pump, a DGU-20A5 vacuum degasser, a SIL-20AC autosampler, a CTO-20A column oven, an FCV-12AH six port valve (including a 200 μL sample loop) and an SPD-20A detector. Second dimension system consisted of an LC-20AD pump, a DGU-20A5 vacuum degasser, a CTO-20A column oven (shared oven) and an SPD-M20A PDA detector and both systems were connected via FCV-12AH. The six port valve operation was controlled by a system software (LC Solution Version 1.24). Chromatographic data were collected and computed by the same system software. The first dimension separation was on an Agilent Eclipse Plus C18 (50 mm × 2.1 mm, 5 μm I.D.) column, using as mobile phase 45% acetonitrile: 55% 10 mM ortho-phosphoric acid solution mixture with 0.5 mL/min flow rate; the second dimension was carried out on a Restek Ultra pentafluorophenyl propyl (PFPP) (150 mm × 4.6 mm, 5 μm I.D.) column, using as mobile phase 40% methanol: 60% 2.25 mM ortho-phosphoric acid solution mixture with 1 mL/min flow rate. All separations were carried out in isocratic mode and detection wavelength has been selected as 203 nm for both systems. A scheme of a simple and comprehensive 2D-LC for two valve positions described is given in Fig. 2.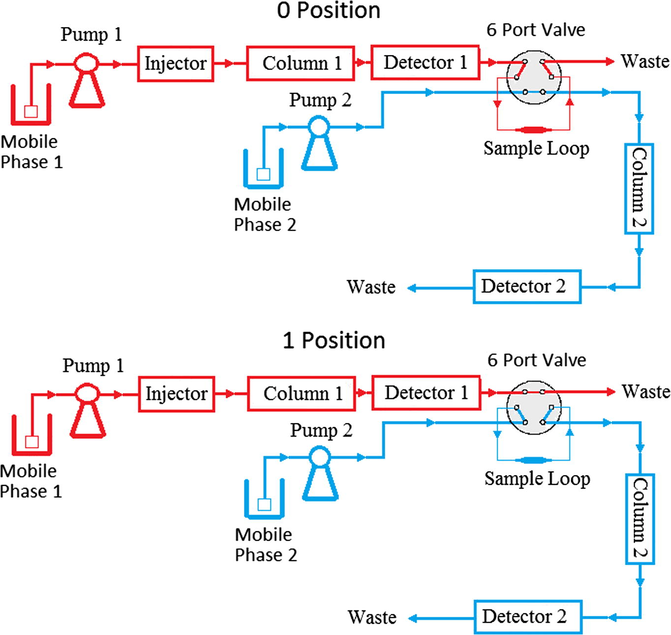
Flow diagram of 2D-LC system for two valve positions.
2.3 Method parameters for 2D-LC system
Some parameters specific to 2D-LC systems, such as “valve rotation time”, “loop volume” and “system pressure”, were investigated. Firstly, time for switching of the FCV-12A valve from 0 position to 1 position was investigated. Tests were performed in order to determine the time frame where the amount of analyte reached maximum in sample loop. For this purpose, analyte within the sample loop was sent to the second system by switching the valve from position 0 to position 1 at time points 3.60, 3.70, 3.80, 3.85, 3.90 and 4.00 min representing the completion of RMT peak obtained after injection of standard substance in the first system. Valve rotation time was selected based on the evaluation of peak areas of the analyte at the second system.
After the selection of switching time, loop volume was tested. Volume of the sample loop, where analyte and matrix were together in the first system mobile phase at a certain time point, was investigated in order to be able to deliver RMT to the second system. In this study, theoretically the recovery increases proportionally with the increasing volume of sample loop, which leads to peak broadening in the second system. For this reason, sample loop volume should be optimized in order to have sharp peaks and acceptable recovery. For this purpose, sample loops with volumes of 100, 200, 500 and 1000 μL were installed in the valve system and the optimum volume for sample loop was determined by the analysis of standards followed by serum samples in pre-defined analytical conditions.
Finally, baseline change and differences in the system pressure as a result of switching the FCV-12A valve from position 0 to position 1 were investigated during the analysis.
2.4 Sample preparation
Venous blood samples (4–5 mL) were placed into glass tubes and then centrifuged (within 2 h from collection) at 1400g for 15 min; the supernatant (serum) was then transferred into polypropylene test tubes and stored at −20 °C until analysis.
1.0 mL of serum was spiked with the second stock solution of RMT (100 μL each) to give final concentrations of 1–50 ng/mL and vortexed for approximately 10 s; after adding 2 mL of methanol, the samples were vortexed for 1 min. Each sample was filtered with 0.45 μm Nylon filter and filtrates were evaporated to dryness under nitrogen at 40 °C. The residues were re-dissolved with 250 μL of mobile phase. Samples were filtered with 0.2 μm Nylon filter before injection.
2.5 Method validation
The developed analytical method was validated according to international guidelines with respect to certain parameters such as selectivity, accuracy, precision, recovery, the calibration curve, sensitivity, reproducibility and stability of analyte in spiked samples (FDA, 2013).
Serum calibration standards were prepared at six levels by spiking 1.0 mL of human serum with the 1–50 ng/mL concentrations of RMT. The obtained mixture was processed as previously described in Section 2.4 and an aliquot of 20 μL was injected into the 2D-LC system. The procedure was performed in triplicate for each concentration. The analyte peak areas obtained were plotted against the corresponding concentrations of the analytes (as ng/mL) and the calibration curves were set up by means of the least-square method. Linear regression analysis of the data from calibration curves gave slope (a), intercept (b) and coefficients of determination (r2), which were used to determine the concentration of analyte in the quality control (QC) samples. The lowest concentration level giving a chromatographic response with acceptable coefficient of variation was defined as the lower limit of quantification (LLOQ).
Absolute recovery data were obtained at the low (5 ng/mL), middle (20 ng/mL) and high (40 ng/mL) QC concentration levels. For this purpose the ratio of the mean peak area from spiked serum samples (extracted RMT) to the mean peak area of standard solutions (unextracted RMT) was calculated. The absolute recovery was obtained using the equation: absolute recovery = (response peaks of extracted RMT/unextracted RMT) × 100.
Precision and accuracy of the proposed method were determined in terms of repeatability (intra-day precision) and intermediate precision (inter-day precision). For this purpose, spiked serum samples at three different concentration levels (5, 20 and 40 ng/mL) of RMT were analyzed six times a day in triplicate injections over six consecutive days. The assay accuracy was calculated as relative mean error (RME). The precision was given as the relative standard deviation (RSD). Accuracy and precision values covering ±15% of the actual range of experimental concentrations were considered acceptable. The serum samples were extracted with the procedure described above in the Section 2.4. and injected into the 2D-LC system. Precision and accuracy were expressed as mean RSD and RME, respectively, which were calculated from experimental data.
Drug stability in serum samples was assessed using low (5 ng/mL) and high (40 ng/mL) QC samples under different conditions as follows: in the autosampler at +4 °C for 12 h, after three freeze–thaw cycles, at +4 °C for 8 h, on storage at −20 °C for 14 days.
2.6 Application to human serum samples
The developed method was applied for the determination of RMT in human serum samples obtained from a healthy volunteer (43 years old, 77 kg, 178 cm height) after administrating single oral dose of 8 mg of RMT. The venous blood samples were collected into tubes at 1 h following oral drug administration, because, the maximum blood-plasma concentration (Cmax) is achieved about 1 hour following oral administration (Karim et al., 2006). The serum samples were obtained from venous blood as previously described in Section 2.4. The serum samples were stored at −20 °C until analysis. The study was approved by Clinical Research Ethics Committee of Bezmialem Vakif University (B.30.2.BAV.0.05.05/379), Istanbul, Turkey.
3 Results
3.1 Chromatographic conditions
Different types of analytical columns were tested including C8, CN, C18, PFPP, biphenyl and phenyl with different mobile phases such as the mixtures of methanol or acetonitrile with ortho-phosphoric acid, acetic acid and formic acid solutions. The sharp and isolated RMT peaks were observed as follows:
First System Column: Agilent Eclipse Plus C18 (50 mm × 2.1 mm, 5 μm I.D.) at 30 °C.
First System Mobile phase: Acetonitrile 45%: 10 mM ortho-phosphoric acid 55% with 0.5 mL/min flow rate.
Second System Column: Restek Ultra PFPP (150 mm × 4.6 mm, 5 μm I.D.) at 30 °C.
Second System Mobile phase: Methanol 40%: 2.25 mM ortho-phosphoric acid 60% with 1 mL/min flow rate.
The UV detector was set as 203 nm for both systems. Retention times were 3.4 min for the first system and 10.4 min for the second system (Fig. 3).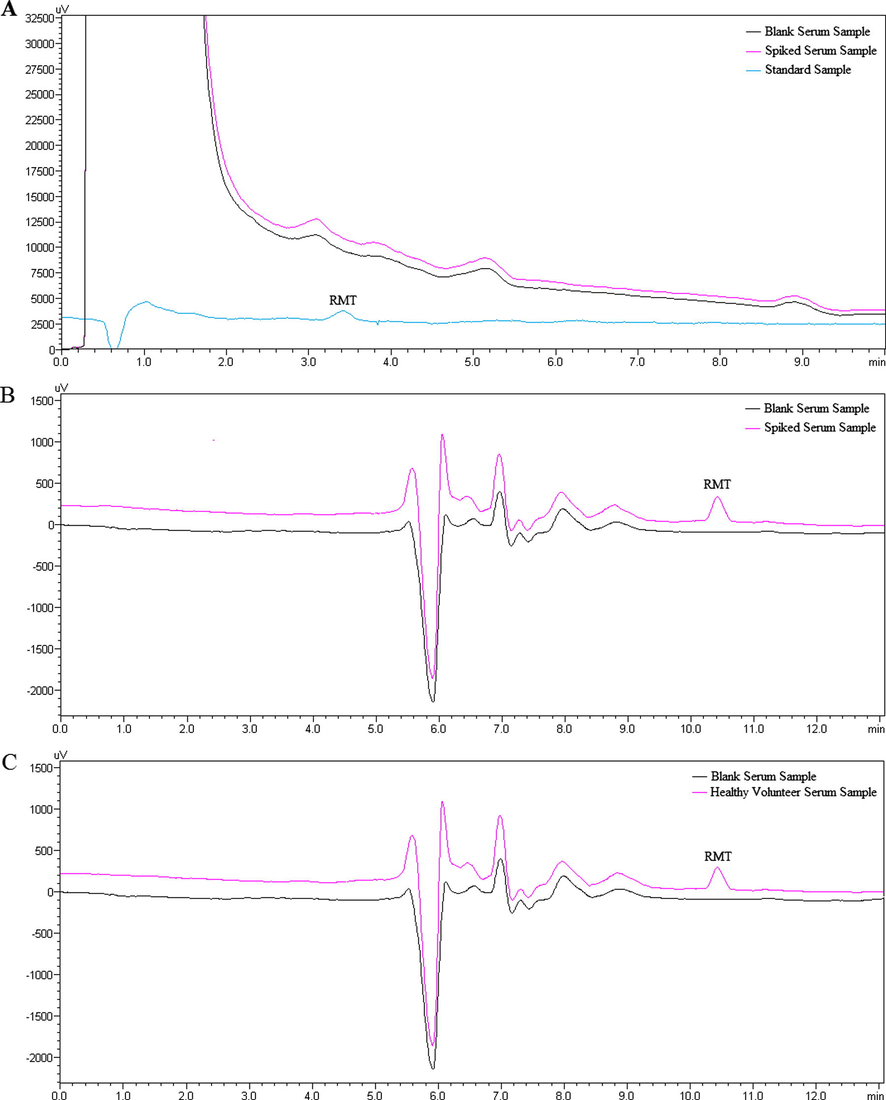
(A) Chromatograms of the (1) blank serum sample and (2) serum sample spiked with RMT (5.0 ng/mL) and (3) standard RMT solution (5.0 ng/mL) at the first system. (B) Chromatograms of the (1) blank serum sample and (2) serum sample spiked with RMT (5.0 ng/mL) at the second system. (C) Chromatograms of the (1) blank serum sample and (2) serum sample obtained from a healthy volunteer 1.0 h after oral administration of 8 mg RMT.
3.1.1 Selection of time for valve rotation
For selecting the timing for valve rotation, the valve was rotated from position 0 to 1 at following time points, 3.60, 3.70, 3.80, 3.85, 3.90 and 4.00 min. A 200 μL aliquot of the sample from the first chromatography was sent to the second system and peak areas obtained from the second chromatographic separation were measured. Results showed that peak area was maximum when the valve rotation time was selected as 3.85 min. In conclusion, 3.85 min time point was selected as valve switching time.
3.1.2 Selection of loop
Sample loop volume was investigated in order to be able to deliver the analyte to the second system. For this purpose, sample loop volumes of 100, 200, 500 and 1000 μL were assayed based on band broadening. Optimum results were attained with loop volume of 200 μL.
3.1.3 Change in system pressure
Baseline change and differences in the system pressure resulting from switching the FCV-12A valve were investigated. Consequently, it was observed that the change of mobile phase at the transition between the systems did not affect RMT peak (Fig. 3B and C). Change in the system pressure was investigated when the FCV-12A valve was switched and it was observed that the pressure was stabilized in a short time period and stayed constant during analysis at this level.
3.2 Method validation
The peak areas obtained were plotted against the corresponding concentrations of the RMT (ng/mL) and the calibration curves were set up in concentration range of 1–50 ng/mL in human serum. The mean linear regression equation of the calibration curves was y = 779.48 × −337.08 (r2 = 0.9990), where y represents the peak area of RMT and x represents the serum concentrations of RMT. The coefficients of determination values of the calibration curves ranged from 0.9956 to 0.9993, demonstrating good linearity of the method. The LLOQ with acceptable precision and accuracy under the stated experimental conditions for this method in serum was measured as 1 ng/mL for which the RSD was lower than 20%.
Blank human serum was spiked with the analytes at three different concentration levels (5, 20 and 40 ng/mL) of RMT for absolute recovery. The mean absolute recovery of RMT extracted from serum samples was found as 80.28% (Table 1).
Added concentration (ng/mL)
Found concentration (ng/mL) ± SD
Recovery (%)
RSD (%)
5
3.97 ± 0.156
79.33
3.92
20
16.11 ± 0.348
80.55
2.16
40
32.39 ± 0.367
80.97
1.13
A summary of the intra-day and inter-day precision results at low, medium and high concentrations of RMT in serum is summarized in Tables 2 and 3, respectively. In this assay, RSD values were found within the range of 1.49–2.85% and 2.08–4.24% for intra- and inter-day precision, respectively. RME values were found within the range of 1.78–3.47% and 1.75–3.63% for intra- and inter-day assay, respectively. Since the RSD and RME values were within the acceptable range, the method has been demonstrated to have satisfactory precision and accuracy. All results regarding precision and accuracy were within the ranges acceptable for bioanalytical purposes.
Added concentration (ng/mL)
5
20
40
Found concentration (ng/mL)
5.06
19.46
38.83
4.68
19.34
40.07
4.74
19.25
39.17
4.77
19.70
39.44
4.80
19.61
39.75
4.91
20.08
38.48
Mean
4.83
19.57
39.29
SD
0.137
0.299
0.587
RSD (%)
2.85
1.53
1.49
RME (%)
−3.47
−2.13
−1.78
Added Concentration (ng/mL)
5
20
40
Found concentration (ng/mL)
4.93
19.50
40.02
4.48
19.22
39.88
4.90
19.13
40.12
4.77
20.08
38.87
5.08
19.77
38.74
4.75
18.92
38.16
Mean
4.82
19.44
39.30
SD
0.204
0.433
0.816
RSD (%)
4.24
2.23
2.08
RME (%)
−3.63
−2.82
−1.75
As a result of stability studies, RMT was stable under all conditions employed in this study (maximum deviation of 2.91% was observed).
3.3 Application to human serum samples
The proposed method was applied to the determination of RMT in human serum samples. The chromatogram of a serum sample from a 43 years old healthy volunteer, who took a single dose of Rozerem (containing 8 mg RMT) film tablet is shown in Fig. 3C. Calculated RMT concentration (4.69 ± 0.22 ng/mL) obtained from analysis, was comparable with the literature data (Karim et al., 2006).
4 Discussion
As mentioned earlier, a few methods were reported for the determination of RMT in biological samples. Although, some of these methods have sensitivity advantage over the developed method, they include laborious extraction procedure such as solid phase extraction (Ogawa et al., 2014) and special sample preparation technique such as micropulverized extraction (Miyaguchi, 2014) or expensive instruments (Karim et al., 2006; Ogawa et al., 2014 and Miyaguchi, 2014). The maximum RSD (4.24%) and RME (3.47%) values of the developed method indicate the better assay precision and accuracy than the reported chromatographic methods. The proposed method is reliable and sensitive and it has simple sample preparation with superior separation technique without internal standard. For this purpose, a new 2D-LC system was designed using Shimadzu LC-20A system. Second dimension separation was carried out using only one 6 port valve including 200 μL sample loop. The developed method was validated according to international guidelines using selected optimum chromatographic conditions and 2D-LC system parameters. This automatized heart-cutting 2D-LC system allowed a simple sample preparation procedure leading to a significant decrease in total analysis time and cost. Compared to traditional heart-cutting systems, the developed method had relatively short analysis time for the first dimension and longer analysis time for the second dimension system. The developed method was applied for the determination of RMT in biological samples.
5 Conclusion
This is the first method for the analysis of RMT in serum samples using 2D-LC in the literature. The proposed method was successfully applied to the analysis of RMT in serum samples from 8 mg single dose treatment of 43 years old healthy volunteer. The results demonstrated that the developed method is applicable for drug monitoring or bioavailability and bioequivalence studies of RMT.
Acknowledgment
This research was supported by the Research Fund of Istanbul University with the Project No: 20432.
References
- Automated instrumentation for comprehensive two dimensional high performance liquid chromatography of proteins. Anal. Chem.. 1990;62(2):161-167.
- [Google Scholar]
- Comprehensive multi-dimensional liquid chromatographic separation in biomedical and pharmaceutical analysis: a review. Biomed. Chromatogr.. 2006;20(6–7):508-529.
- [Google Scholar]
- Food and Drug Administration, 2013. FDA Guidance for Industry: Bioanalytical Method Validation. Rockville, MD: US Department of Health and Human Services, Food and Drug Administration, Center for Drug Evaluation and Research. September 2013.
- Disposition kinetics and tolerance of escalating single doses of ramelteon, a high-affinity MT1 and MT2 melatonin receptor agonist indicated for treatment of insomnia. J. Clin. Pharmacol.. 2006;46(2):140-148.
- [Google Scholar]
- Determination of sedative-hypnotics in human hair by micropulverized extraction and liquid chromatography/quadrupole-Orbitrap mass spectrometry. Anal. Meth.. 2014;6(15):5777-5783.
- [Google Scholar]
- Comprehensive three-dimensional separation of peptides using size exclusion chromatography/reversed phase liquid chromatography/optically gated capillary zone electrophoresis. Anal. Chem.. 1995;67(19):3448-3463.
- [Google Scholar]
- High-throughput analysis of ramelteon, agomelatine, and melatonin in human plasma by ultra-performance liquid chromatography–tandem mass spectrometry. Forensic Toxicol.. 2014;32(1):126-131.
- [Google Scholar]
- Enantiomeric separation of a melatonin agonist Ramelteon using amylose-based chiral stationary phase. Arabian J. Chem.. 2013;6(1):103-109.
- [Google Scholar]
- Stability-indicating UPLC method for determination of ramelteon and their degradation product in active pharmaceutical ingredients. J. Liq. Chrom. Relat. Technol.. 2012;35(5):688-699.
- [Google Scholar]
- Multidimensional chromatography and the signature peptide approach to proteomics. LC GC N Am.. 2001;19(2):200.
- [Google Scholar]
- Concepts and practice of multidimensional high-performance liquid chromatography. Adv. Chromatogr.. 2006;44:177-236.
- [Google Scholar]
- Study to investigate the absolute bioavailability of a single oral dose of ramelteon (TAK-375) in healthy male subjects. Clin. Pharmacol. Ther.. 2004;75(2):P22.
- [Google Scholar]
- Comprehensive two-dimensional HPLC separation of tryptic peptides based on high-temperature HPLC. J Chromatogr. A. 2006;1122(1–2):123-137.
- [Google Scholar]
- High temperature, fast two-dimensional liquid chromatography. J. Chromatogr. A. 2007;1168(1–2):3-43.
- [Google Scholar]
- Estimation of ramelteon in bulk and tablet dosage form by HPLC. Rasayan J. Chem.. 2013;6(4):315-319.
- [Google Scholar]


