

Translate this page into:
An approach to identify new antihypertensive agents using Thermolysin as model: In silico study based on QSARINS and docking
⁎Corresponding author at: Institut Universitari de Ciència Molecular, Universitat de València, Edifici d’Instituts de Paterna, P.O. Box 22085, E-46071 València, Spain. jacgarit@yahoo.es (Juan A. Castillo-Garit) Juan.Castillo@uv.es (Juan A. Castillo-Garit)
-
Received: ,
Accepted: ,
This article was originally published by Elsevier and was migrated to Scientific Scholar after the change of Publisher.
Peer review under responsibility of King Saud University.
Abstract

Abstract
Thermolysin is a bacterial proteolytic enzyme, considered by many authors as a pharmacological and biological model of other mammalian enzymes, with similar structural characteristics, such as angiotensin converting enzyme and neutral endopeptidase. Inhibitors of these enzymes are considered therapeutic targets for common diseases, such as hypertension and heart failure. In this report, a mathematical model of Multiple Linear Regression, for ordinary least squares, and genetic algorithm, for selection of variables, are developed and implemented in QSARINS software, with appropriate parameters for its fitting. The model is extensively validated according to OECD standards, so that its robustness, stability, low correlation of descriptors and good predictive power are proven. In addition, it is found that the model fit is not the product of a random correlation. Two possible outliers are identified in the model application domain but, in a molecular docking study, they show good activity, so we decide to keep both in our database. Finally, 141 and 69 compounds (2.5 ⩽ pKi < 3.5 and pKi ⩾ 3.5, respectively) are identified as potential Thermolysin inhibitors, concluding that the proposed computational tools are an efficient method for the identification of new drugs that could inhibit this enzyme.
Keywords
Antihypertensive
Docking
Multiple Linear Regression
QSARINS
Thermolysin
Virtual screening

1 Introduction
Thermolysin (EC 3.4.24.27) was one of the first metalloproteases whose structure was obtained crystallographically; therefore, it has been studied extensively as an archetype of zinc metalloendopeptidases (Marchand-Geneste et al., 2002). It is a heat-stable extracellular endopeptidase with molecular weight of 34,600 Da. Thermolysin (TLN) is classified within the family M4 metalloendopeptidases (http://merops.sanger.ac.uk/) (Adekoya and Sylte, 2009). This proteolytic enzyme contains a zinc ion, essential for catalytic activity, and four calcium ions required for thermal stability (Waller and Marshall, 1993). This enzyme is specific for peptide bonds containing the amino group of hydrophobic amino acid residues, such as L-leucine, L-isoleucine, and L-phenylalanine (Morihara and Tswzu, 1970). The mechanism of action of Thermolysin proposed by Brian Matthews was emerged from an extended series of structural studies. In native Thermolysin the zinc ion has approximate tetrahedral coordination, with three ligands provided by the protein (His 142 and His 146 in the motif HEXXH, and Glu 166 in the motif EXXXD) and the fourth provided by a water molecule (Matthews, 1988).
The zinc-metalloproteinases secreted by the gram-positive thermophilic bacterium Bacillus thermoproteolyticus is the prototype of the TLN family and has served as a model system to study the inhibition mechanism of other metalloproteinases. Crystallographic data for TLN and various TLN-inhibitor complexes have been used in efforts to model the active site of other TLN-like enzyme (Bohacek et al., 1996; Tiraboschi, 1999). These enzymes play a key role in the biosynthesis and metabolism of different bioactive peptides, so that its inhibitors have considerable potential as therapeutic agents (Holland et al., 1994). In addition, Thermolysin presents close structural and functional similarities with several mammalian enzymes that are involved in the control of different physiological functions, like neprilysin (NEP) and angiotensin-converting enzyme (ACE), both involved in the control of blood pressure.
Angiotensin I-converting enzyme (ACE, EC 3.4.15.1) belongs to the M2 family of Zinc-binding metalloproteinases, within the MA clan. ACE plays an important role in blood pressure homeostasis by cleaving the C-terminal dipeptide from angiotensin I to produce the potent vasopressor peptide angiotensin II (Rang, 2003) and inactivates the vasodilatory peptide bradykinin by the sequential removal of two C-terminal dipeptides (Yang et al., 1970). This enzyme contains two Zinc-coordinating catalytic domains (N and C domains) each bearing the HEXXH motif where the two histidines form two of the three amino acid ligands, while a glutamate 24 residues downstream forming the third ligand (Williams et al., 1994). The role of a Zn ion in ACE catalysis was thought to be analogous to that in TLN (Soubrier, 1988). As a consequence of these structural and functional similarities and the role of ACE in the metabolism of those two vaso-active peptides, the active site of TLN has been used as a model to develop highly potent and specific ACE inhibitors.
Neprilysin (neutral endopeptidase; NEP, EC 3.4.24.11) is an integral plasma membrane ectopeptidase of the M13 family of Zinc metalloproteinases. Like TLN and ACE, NEP possesses the HEXXH motif as well as a consensus sequence EXIXD in which the glutamate (Glu) serves as the third Zn ligand (Roques, 1993; Roques et al., 1993; Williams et al., 1994). NEP is involved in the metabolism of a number of regulatory peptides of the mammalian cardiovascular, inflammatory, nervous and immune systems (Bland, 2008). Therefore, NEP is potential therapeutic targets in cardiovascular and inflammatory disorders. Before the crystal structure of NEP-inhibitor complex was solved, the structure and function similarities between NEP and TLN served as the basis of NEP inhibitor design by using TLN as a test model. Selective inhibitors, such as phosphoramidon have contributed to understanding NEP enzyme function (Holland et al., 1994). This enzyme catalyzes the vasodilatory peptide degradation: natriuretic peptides, substance P and enkephalins (Turner et al., 2001).
According to this, TLN was previously used to construct the NEP and ACE models, which guided in the design of NEP/ACE inhibitors. The dual inhibition of neprilysin and the angiotensin receptor may represent an attractive therapeutic approach for a wide range of cardiovascular diseases, including hypertension, diabetes and heart or kidney failure, in which vasoconstriction, volume overload and neurohormonal activation play a role in the pathophysiology (Manzur et al., 2013). The structural and functional similarities between TLN, NEP and ACE indicate that Thermolysin inhibitors may also inhibit ACE and NEP and be putative antihypertensives (Khan et al., 2009). Dual NEP/ACE inhibitors repress simultaneously two key enzymes that participate in cardiovascular function regulation (Ruilope et al., 2012). This type of inhibitors exerted typical actions of ACE inhibitors and/or NEP inhibitors, such as dose-dependent inhibition of angiotensin I–induced hypertension, protection of atrial natriuretic factor, and enhancement of diuresis, natriuresis, and cGMP urinary excretion (Laurent et al., 2000).
According to the World Health Organization, cardiovascular disease accounts globally for approximately 17 million deaths a year and, of these, complications of hypertension account for 9.4 million deaths worldwide every year. Hypertension is responsible for at least 45% of deaths due to heart disease and 51% of deaths due to stroke. In 2014, the worldwide prevalence of hypertension in adults over 18 years was about 22% (World Health Organization, 2016). Given the large number of persons affected by these diseases, efforts are continuously made in the field of drug research, with the aim of finding new agents to optimize their management (Unger et al., 2011). Still, the prognosis for these patients remains grim, and many treatment options are unsatisfactory. In addition, we can say that the treatment and the response of patients with decompensated heart failure have not changed substantially in recent decades. As a result of the foregoing, there is a critical need to find new drugs to improve clinical outcomes (Aronson and Krum, 2012; Manzur et al., 2013).
The QSAR studies are useful tools for screening chemicals, especially in early stages of the drug discovery process, which have provided no experimental data. If these are properly developed and rigorously validated (Gramatica et al., 2013b), they become outstanding tools to evaluate only those that are most promising. In the last two decades, QSAR models have been successfully used to search new molecular entities (Bhadoriya et al., 2014; Nazarshodeh et al., 2015; Sahu et al., 2014), correlating significant structural properties with the biological activity of a compound. In this sense, our research group have obtained several remarkable results in the identification/selection of new molecular entities with potential action against different targets (Brito-Sánchez et al., 2013; Castillo-Garit et al., 2012, 2015a,b, 2009; Le-Thi-Thu et al., 2016). The main objective of the present study was to obtain a statistically significant model to predict the Thermolysin inhibition and to identify new hits, which could be potential antihypertensive agents. We used the QSARINS software to develop a Multiple Linear Regression (MLR) model to identify the potentially new inhibitors; it was validated according to OECD standards (Worth et al., 2007).
2 Materials and methods
2.1 Thermolysin inhibitors database
The database was collected from reports of the international literature (see Fig. S-1 and Table S-1 of supplementary material). These compounds are reversible competitive inhibitors of Thermolysin enzyme and have reported enzyme inhibition constants (Ki) covering a range of 6.8 × 10⁻⁸ to 430 nM. Due to the inhibition wide range of the compounds, we decided to work with pKi (−log Ki), which varied from −2.63 to 7.16. The database of 176 experimental compounds was divided into training (133 compounds) and prediction (43 compounds).
2.2 Software
For the calculation of molecular descriptors, DRAGON Software (Talete, 2007) was used. All the families of descriptors (0D - 3D) were calculated excluding constant and near-to-constant variables. Program DRAGON is an application for the calculation of the molecular descriptors, originally developed by Milano Chemometrics and QSAR Research Group, and provides more than 1600 molecular descriptors that are divided into 20 logical blocks.
In order to obtain the MLR model, we used the QSARINS (QSAR-Insubria) software (Gramatica et al., 2013a,b) developed at the University of Insubria. It would be ideal to use all combinations of available descriptors for the calculation of the models; however, the number of combinations is usually so great that it is impossible to calculate all models. Therefore, to reduce the model computation time, all combinations were preliminarily used with only a small number of descriptors per model, in order to explore all combinations of low dimension, using the all subset technique, and, later, a genetic algorithm (GA) method was applied to develop models based on a larger number of descriptors.
2.3 Computational techniques
2.3.1 Multiple Linear Regression
The MLR is the process that obtains a linear relationship between the Thermolysin inhibition (pKi) and the molecular descriptors, using ordinary least squares (OLS) algorithm (Gramatica et al., 2013b).
For selecting the best model, the equations were ordered by QSARINS, showing the optimum models according to R2 (the highest value is in correspondence with the good fitting of the model), Q2LOO (for the highest values and comparable with R2, the model is robust), R2−Q2LOO (a lower value is indicative of the model stability) and RMSE (should be small and as close as possible between calculation of training, training prediction by LOO and external prediction series).
2.3.2 Molecular docking
In this work, docking was used for the analysis of 15 compounds, including two that were outside the applicability domain of the model. Considering that the predictions of the outlier compounds by the model can be unreliable, the docking has allowed predicting the interactions of these compounds with Thermolysin and other compounds with similar structural characteristics and the best orientation of a ligand (inhibitor) in the pocket of the aforementioned protein (Azam and Abbasi, 2013). This computing tool has been widely used in medical chemistry researches (Kitchen et al., 2004; Mena-Ulecia et al., 2015; Quesada-Romero et al., 2014; Yuriev and Ramsland, 2013).
Here, the crystallographic structure of Thermolysin was used, and it was extracted from the Protein Data Bank, whose code is 5DPF (Krimmer and Klebe, 2015). This protein was refined with the addition of hydrogen and the amino acid loads by using the graphical interface of the AutodockTool module, which is contained in the MGLTools 1.5.6 program (Morris et al., 2009). The same program was used to prepare the inhibitors, which were saved in the pdbqt format. The Thermolysin inhibitors were optimized using the RHF/AM1 semi-empirical method, which is contained in the GAMMES package (Schmidt et al., 1993), in order to obtain the most realistic structures. In the docking experiments, a 16 × 16 × 16 box with a grid spacing of 0.375 Å was used. The grid was fixed in the center of the ligands with the coordinates x = 8.815 Å, y = −40.713 Å and z = 5.671 Å. The mode number was 10, and the maximum range of energy differences between the computed ligands was 5 kcal/mol. Every running of the docking was made by using the Autodock Vina program (Trott and Olson, 2010).
2.4 Model validation according to OECD principles
Algorithm QSARINS is friendly software that can validate the obtained model using OECD principles, in order to increase the confidence of the predictions. According to these principles, the model should have the following: (1) a defined endpoint; (2) an unambiguous algorithm; (3) a defined domain of applicability; (4) appropriate measures of goodness-of-fit, robustness and predictability; and (5) a mechanistic interpretation, if possible (Worth et al., 2007).
Principle 1 is associated with the endpoint definition where it refers to a physicochemical, biological or pharmacological property that can be measured and, therefore, modeled. The aim of this principle is to ensure transparency in the measurement point predicted by a given model. The endpoint in this work was the Thermolysin inhibition constant (Ki), which characterizes substrate inhibition by a competitive inhibitor (Kakkar et al., 1999), expressed as pKi.
According to Principle 2, QSAR models can be expressed in the form of unambiguous algorithms, considering that the algorithm model is the way of relating the descriptors of the chemical structure and activity (endpoint of the model) through mathematical models or rules based on the knowledge developed by one or more experts. The used algorithm was a mathematical model of Multiple Linear Regression detailed in the previous section.
William graph was used to define the model application domain (DA) (Principle 3), so that reliable predictions of the model have leverage values below the critical leverage with ± 3 standard deviations. Compounds that are outside these ranges may be considered outliers. In addition, Insubria graph was used for DA. This was very useful to assess the reliability of the predictions of experimental compounds, lacking response, and to compare with the predictions of the database.
Following the Principle 4, the goodness of the fit was evaluated using the coefficient of determination R2 and a modified form R2adj that also evaluated the effectiveness by adding a new descriptor to the model.
In order to control the robustness of the model, we carried out internal validation strategies. First, we used the Q2LOO criterion applying the technique of cross-validation (CV), i.e., iteratively excluding a compound from the dataset (Leaving One Out, LOO), and then calculating a model with the remaining compounds and making the prediction for the excluded molecule. If the internal predictions were good, the value of Q2LOO was high and comparable with R2, so the model was considered internally stable and robust. However, a disturbance of a single compound in a series of 133 cases was too weak to show the real model robustness. Code QSARINS further includes a stronger technique: Leaving Many Out (LMO), which allowed studying the behavior of the model when a larger number of compounds (in this case 30% of the compounds) were excluded. The model was considered stable if the values of R2 and Q2 calculated for each iteration of the LMO experiment and their averages (R2LMO and Q2LMO) were comparable with the values of R2 and Q2LOO of the model.
In order to demonstrate that the model was not the result of a chance correlation, we applied the Y-scrambling procedure. In this procedure, responses are placed randomly, so there was no correlation with the descriptors and, as a result, the performance of the models should decay drastically. In this case, if the model in the validation process was good, the values of R2 and Q2 of each iteration, and their averages (R2YS and Q2YS) must be lesser and lesser with respect to the values of the model.
In order to assess the model’s ability to predict new compounds, an external validation was carried out. The procedure was performed by applying the model equation obtained with the training set, a predictive dataset, i.e., excluding compounds that were never been used for the calculation model. Model performance was evaluated by different criteria such as RMSEext, Q2-F1, Q2-F2, Q2-F3, r2M, Δr2m, CCC, and Golbraikh and Tropsha methods.
The mechanistic interpretation of the model (Principle 5), although it is not mandatory, it is very desirable. In our work, we developed a general interpretation of the model based on the descriptors selected to describe the Thermolysin inhibition. This could be useful to understand the different factors driving the process.
2.5 Virtual screening
With the aim of performing identification/selection of new compounds as Thermolysin inhibitors, the obtained model was used for the virtual screening of the international database Drug Bank (www.drugbank.ca), which is a database available on the University of Alberta (Canada). These data contain more than 1431 molecules approved by the FDA (Food and Drug Agency of the government of the United States), 133 bioactive drugs approved by the FDA and more than 5212 experimental drugs.
3 Results and discussion
3.1 Getting QSAR-model RLM
Using the DRAGON software (Talete, 2007) we calculate 3224 descriptors (0D-3D). To perform the calculation of the 0-2D descriptors we use molecules representation in the ChemDraw software (saved as ∗.mol files). However, to carry out the calculation of 3D descriptors, geometry optimization calculations should be done; several approaches can be used (González and Helguera, 2003; Goodarzi et al., 2013a,b; Perez Gonzalez et al., 2006). In our work, we performed geometry optimization calculations for each compound considered in this study using the semiempirical method AM1 (Dewar et al., 1985) implemented in Mopac. Given the great number of variables calculated, even when 1503 descriptors were excluded, the number of remaining descriptors was 1721. Thus, the data were subjected to a new filtration process using the QSARINS software (Gramatica et al., 2013a,b) and the descriptors that possessed more than 95% of constant values and had more than 90% correlation were eliminated. After that, only 399 variables were considered in the selection process to develop the model, as shown in Fig. 1.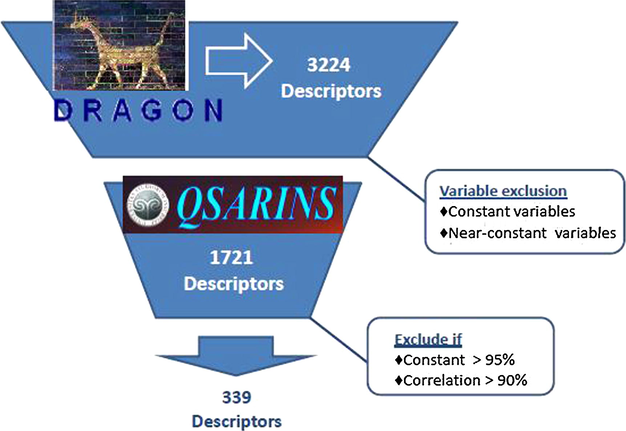
Diagram of variables filtering process.
Then, we developed several models with low multicollinearity between descriptors and good correlation with the modeled response. The generated population of models were plotted the mean values of R2 and Q2LOO (with their standard deviations) versus the number of variables of the model (Fig. 2), in order to evaluate the performance of the models against their size and to avoid overfitted models. As can be seen, the values of R2 and Q2LOO rose as new descriptors were added to the model, except for six and seven variables, so we can infer that the added descriptor does not give new information. The highest values of R2 and Q2LOO were achieved by the models of eight variables; however, the models with five variables showed very similar values with three less predictive variables. Based on the principle of parsimony, we selected five variables as optimal dimension to develop the final model, which were used to predict the Thermolysin inhibition.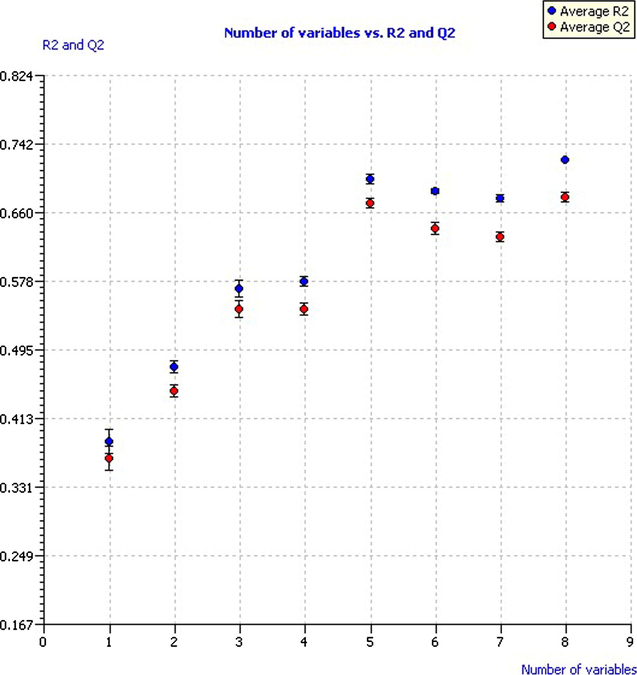
Model performance according to number of variables.
The best MLR model obtained with its statistical parameters is shown below:
pKi = −23.62 + 0.52xMor07u − 20.77xMor12v − 3.12xR5v+ + 2.87xR5p+ + 23.58xB01[N–O]
N = 133 R2 = 0.714 R2adj = 0.702 s = 1.230 F = 63.248
R2−R2adj = 0.011 LOF = 1.688 Kxx = 0.231 Delta K = 0.100
RMSEtr = 1.202 MAEtr = 0.975 RSStr = 192.024 CCCtr = 0.833
The model presented an R2 of 0.714, so it manifests a proper fit for modeling Thermolysin inhibition. In addition, an R2adj of 0.702, which is indicative of the convenience to add a new descriptor to the model and, together with the low value of the LOF parameter of 1.688, we can say that no existing overfitting is in the model, as it presents a good fit with minimum number of descriptors. The correlation between the model descriptors is low because the value of Kxx is small (0.231); this allows us to assume that the model has very little redundant information in the selected descriptors. Besides, according to the Delta K parameter (0.1), the model has an appropriate correlation between descriptors and the modeled response, with a small error on the training calculations and estimated parameters (RMSEtr = 1.202; MAEtr = 0.975; s = 1.230). Yellow circles in Fig. 3 represent the values predicted by the model equation versus the experimental pKi values for the training set. This scatter plot permitted detection of systematic trends or grouping of the data and potential outliers therein.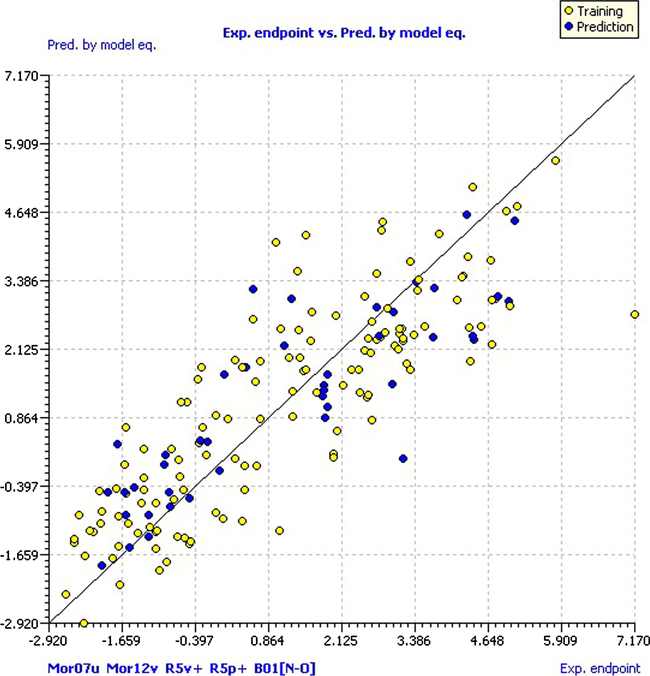
Scatter plot of experimental pKi versus predicted by model equation.
As can be seen, the compound NFpLA (compound 43) of the training set has a residual of −4.38 and can be considered an outlier compound. Keep in mind that this is the compound that has the highest pKi in the database (pKi = 7.17), and the pKi predicted by the model is 2.786, which leads to obtain a very high residual value. However, the model predictions were not affected, since a compound with predicted pKi greater than 2.5 is considered very active. The experimental pKi for Thermolysin and the results predicted by the MLR model for the training set are shown in Table 1.
Ligand
Exp. endpoint
Pred. by model eq.
Pred. mod. eq. res.
Autodock Vina
Evina (rank)
RMSD (Å)
20
5.00
3.02
−1.98
−5.7(4)
2.62
21
5.04
2.93
−2.11
−6.4(8)
1.24
22
2.05
0.63
−1.42
−6.7(4)
1.20
28
2.92
2.88
−0.04
−7.8(2)
0.15
29
4.38
2.38
−2.00
−5.7(5)
2.64
30
4.32
2.53
−1.79
−6.1(6)
1.34
31
4.72
2.23
−2.49
−6.5(2)
3.28
32
3.00
1.49
−1.51
−6.0(1)
0.05
33
2.80
2.35
−0.45
−7.9(2)
1.24
34
3.46
3.41
−0.05
−7.0(2)
0.02
43
7.17
2.79
−4.38
−8.0(1)
0.36
66
4.78
3.07
−1.71
−7.5(2)
2.74
70
4.35
1.91
−2.44
−7.6(2)
0.49
171
2.77
2.38
−0.39
−7.1(2)
0.25
172
4.82
3.11
−1.71
−8.7(2)
0.66
3.2 Model validation according OECD principles
In order to validate our model, we followed the OECD regulatory principles to ensure their validity, checking the model performance, i.e., the fitting, stability in the cross-validation and the ability to predict new compounds (Worth et al., 2007). The fitting and stability of the model were evaluated using internal validation procedures; first, we take into account the parameters of the cross-validation Leave-One-Out (LOO). According to the obtained results, it is possible to affirm that the internal predictions are good since the variance explained in the prediction by LOO (Q2Loo = 0.6868) has a comparable value with R2 = 0.7135. Then, the model is considered internally stable or robust with a small error in the predictions (RMSEcv = 1.2563 and MAEcv = 1.0190). Fig. 4 shows the values predicted by LOO versus the experimental values of pKi (clear circles for the training set and dark circles for the prediction set). As in the model predictions, the NFpLA compound is the farthest from the line and is supported by the hypothesis of which it can be considered an outlier compound.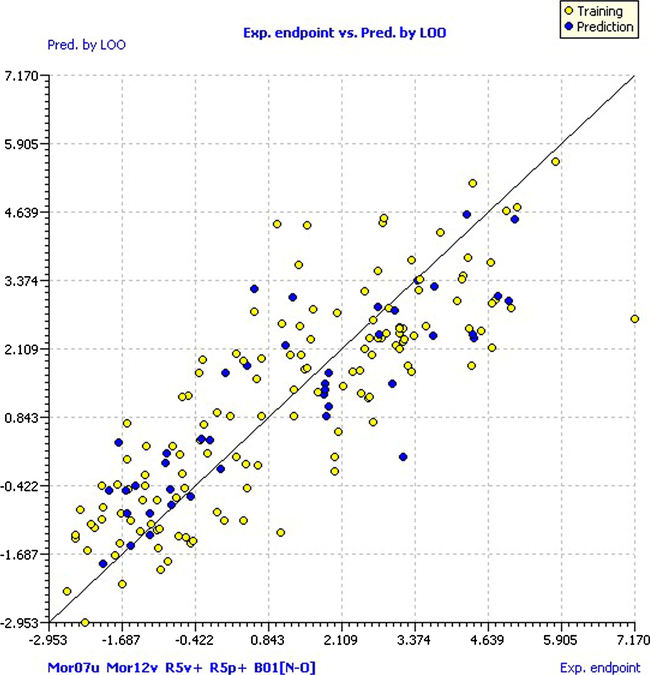
Scatter plot of experimental pKi versus predicted by LOO.
A stronger technique included in the QSARINS is Leaving-Many-Out (LMO), which was developed leaving out the 30% of the dataset to study the behavior of our model. This technique was very useful in our database because in opposite to LOO, where for each single disturbance of the data the influence on the predictions was very weak; in LMO technique, each perturbation of data is significant. The model is considered stable because the R2 = 0.7135 and Q2LMO = 0.6810 values are comparable, and calculation in each iteration of LMO and their averages are comparable to the values of R2 and Q2LOO of the model. Fig. 5 shows the Q2LMO versus the correlation between descriptors and Thermolysin inhibition (Kxy) in which it is observed that the values of Q2LMO are very similar to each other, which confirms that the model has a good fit, robustness and stability.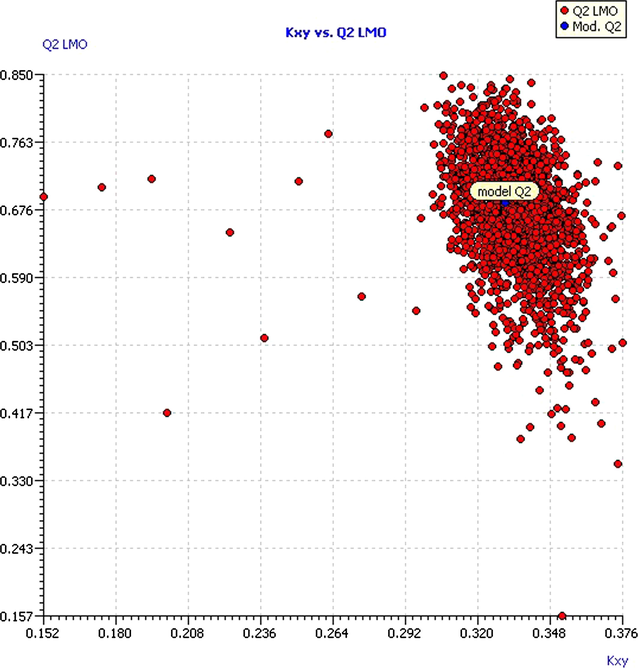
Plot of LMO validations compared with the original model.
In order to demonstrate that the model was not the result of a casual correlation, the Y-scrambling procedure was used, placing the answers at random, so that there was no correlation with descriptors and, as a consequence, the model performance decayed dramatically. The values of R2 and Q2 of each iteration and its averages (R2Y-scr and Q2Y-scr) give us the criteria that the model is good, since these parameters are ever lower with respect to the values of the model (R2Y-scr = 0.039 and Q2Y-scr = −0.055). The R2Y-scr and Q2Y-scr values against R2 and Q2 of the model are shown in Fig. 6. Notice that the values of R2 and Q2 of the model are very far from the values obtained for those parameters in the Y-scrambling experiment, which indicates that the model was not obtained as a result of a random correlation.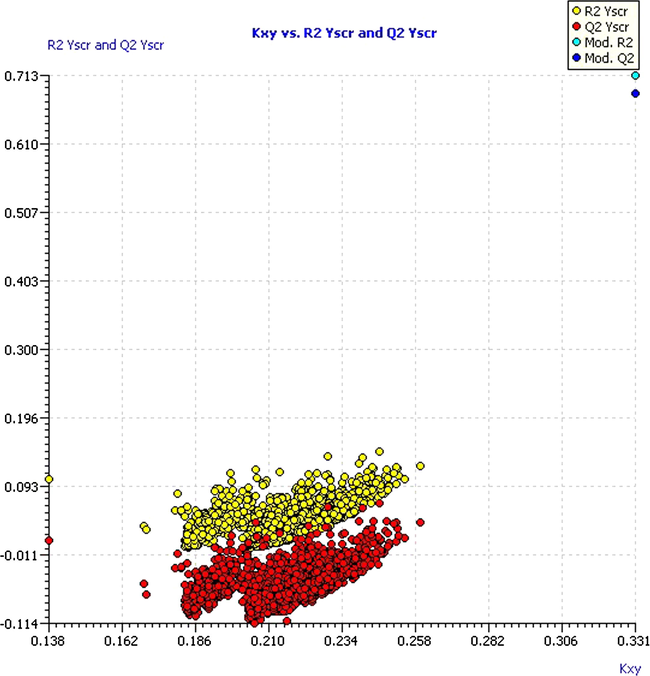
Plot of Y-scrambled model compared with the original model.
The predictive ability of the model was tested using a series of external predictions, which were never used to obtain the model (external validation). Using this procedure, we checked the ability of the model to predict new compounds and their parameters showing results equivalent to the value of model R2 (R2ext = 0.723), RMSEext = 1.182, MAEext = 0.91, PRESSext = 60.091, Q2-F1 = 0.713, Q2-F2 = 0.713, Q2-F3 = 0.723, CCCext = 0.817, r2m_aver = 0.619, r2m_delta = 0.126.
Where R2ext is the external determination coefficient (Golbraikh and Tropsha, 2002), RMSEext is the Root Mean Square Error in external prediction; MAEext is the Mean Absolute Error in external prediction; PRESSext is the Predictive Residual Sum of Squares (external validation); Q2-F1 (Shi et al., 2001), Q2-F2 (Schüürmann et al., 2008), and Q2-F3 (Consonni et al., 2009) are the variances explained in external prediction; CCCext is the Concordance Correlation Coefficient (Chirico and Gramatica, 2011, 2012; Lin, 1989) and r2m_aver and r2m_delta are the Roy criteria: average and delta (Ojha et al., 2011). The predictions of compounds in the external set can be seen in Fig. 3 (blue circles).
A crucial problem in chemometrics and QSAR studies is the definition of the applicability domain (AD) of a classification or regression model. Even with a robust, significant and validated QSAR model, unreliable predictions of the modeled property for the entire universe of chemical compounds can be expected. Indeed, only predictions for compounds that fall within the AD can be considered reliable and not the extrapolation of the models (Dimitrov et al., 2005).
In this study, we used the approach of leverage (h) and standardized residuals described in the technical literature (Atkinson, 1985). Fig. 7 shows the William graph of the model, where open circles represent the compounds of the training and dark circles represent the prediction set.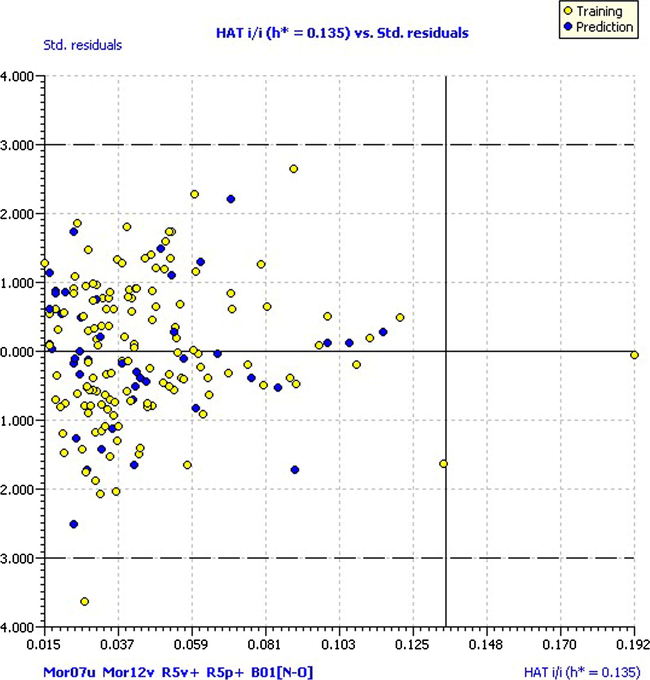
Williams plot. Hat diagonal values versus standardized residuals.
As shown in this figure, most of the compounds are within the applicability domain of the model. There is only one compound (compound 34) with the value greater than the critical leverage (h = 0.192), but showing residual within the limits, and one compound (compound 43), having residual off-limits (−3.62) though this is within critical leverage. Both cases must be taken into account as potential outlier compounds.
Besides, the QSARINS provided a new approach for determining the model applicability domain based on leverage and model predictions. The Insubria graphic is very useful to evaluate the position of the molecules lacking experimental response, compared with the structural applicability domain, and to compare their predictions with the compounds having the experimental values. According to the graph of Insubria (Fig. 8), only one compound is outside the AD by leverage (compound 34) and coincides with the William graph.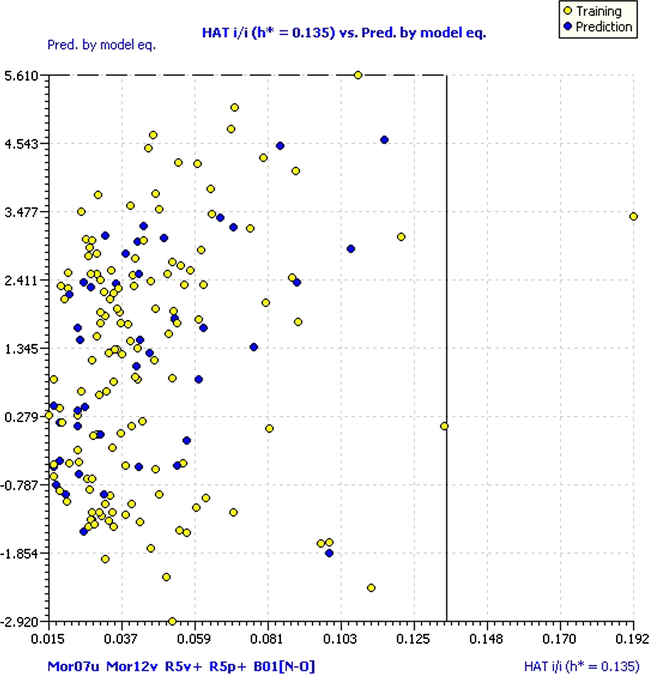
Insubria graph. Hat diagonal values versus predicted data.
As shown in the model equation, using only five predictors (molecular descriptors), more than 70% of the inhibitory activity of Thermolysin can be described. Most of the variables are three-dimensional (Mor07u, Mor12v, R5v+ and R5p+) of 3D MoRSE and GETAWAY families, respectively. This result is logical, since there are reports that the enzyme is stereospecific (Jin and Kim, 1997), so the three-dimensional structure of the inhibitors is essential for access and interaction with the active site and subsite pockets of the enzyme. Note that descriptors weighted by the van der Waals volume have a negative coefficient that could be related to the steric hindrance to access the active site inside. In addition, the descriptor weighted by polarizability has a positive coefficient, which reinforces the idea that electrostatic interactions with residues near the active site of the enzyme are crucial to their catalytic activity. Furthermore, the model has a two-dimensional (2D) descriptor (B01 [NO]), based on the search for similar patterns in the database compounds. These suggest that the presence of very close nitrogen atoms and oxygen atoms permits the interaction with the active site of the enzyme.
3.3 Molecular docking
First, the method of the docking to reproduce the crystal structure of the Thermolysin-inhibitor complex (Fig. 9) was made. This test allowed measuring the capacity of the docking to reproduce known structures, which were contained in a crystal.![Conformational comparison of compounds 20, 21 and 22 (in yellow) from the crystal structures in Thermolysin–5H9a inhibitor complex (inhibitor in red). a: N-[(S)-({[(benzyloxy)carbonyl]amino}methyl)(hydroxy)phosphoryl]-L-leucyl-4-methyl-L-leucine-(6S,9S)-1-(benzyloxy)-6-isobutyl-9-neopentyl-4-oxido-1,4,7-trioxo-2,5,8-triaza-4-phosphadecan-10-oate (C22 H36 N3 O7 P).](/content/184/2019/12/8/img/10.1016_j.arabjc.2016.10.003-fig10.png)
Conformational comparison of compounds 20, 21 and 22 (in yellow) from the crystal structures in Thermolysin–5H9a inhibitor complex (inhibitor in red). a: N-[(S)-({[(benzyloxy)carbonyl]amino}methyl)(hydroxy)phosphoryl]-L-leucyl-4-methyl-L-leucine-(6S,9S)-1-(benzyloxy)-6-isobutyl-9-neopentyl-4-oxido-1,4,7-trioxo-2,5,8-triaza-4-phosphadecan-10-oate (C22 H36 N3 O7 P).
As it is shown in Fig. 9, the docked structures had an adequate orientation in the pocket of Thermolysin. It reproduces in an acceptable way the X-ray crystal structure of the Thermolysin-inhibitor complex. The root mean square deviation (RMSD) of the analyzed molecules regarding the crystal structure of the inhibitor was <2.0 Å in the 73.3% of all the analyzed cases (Table 1). In this analysis, it was considered that 2.0 Å is the reference value that identifies an either correct or incorrect resolution of the docking (Gohlke et al., 2000). The RMSD has often been used to measure the quality of reproduction of a known (i.e. crystallographic) binding pose by a docking method (Gohlke et al., 2000). Several authors have suggested that a low RMSD with respect to the true binding pose (in our case the crystallographic structure of Thermolysin-inhibitor (5H9) complex), is good (ideally less than 1.5 Å, or even better, less than 1 Å). This represents good reproduction of the correct pose. Beware reading much significance into relative values of RMSD’s greater than 3 Å. A binding pose with RMSD 4 Å is not better than one of 6 Å. They are both equally poor (i.e. wrong) (Gohlke et al., 2000; Liebeschuetz et al., 2012; Maiorov and Crippen, 1994). Only the compounds 20, 29, 31 and 66 had values higher than 2.0 Å.
Analyzing the docking results, it is worth mentioning that the compound 172 presented the lower union energy (−8.7 kcal/mol) of all the analyzed molecules. As Fig. 10B shows, the orientation of one of the OH groups makes that it coordinates with the metal (Zn2+) in the active center of the protein. Besides, one of the terminal benzenes is located in a hydrophobic pocket, formed by Leu133, Val139, Phe130 and Leu202, whereas the other benzene terminal is located in a hydrophobic area that has been formed by the amino acids Trp115 and Tyr157, which stabilize the molecule. The terminal OH groups are oriented toward a polar area that has been formed by the Asn227. The Asp226 is also located in this area. It is anionic and it provides density of charge in the stabilization of these groups.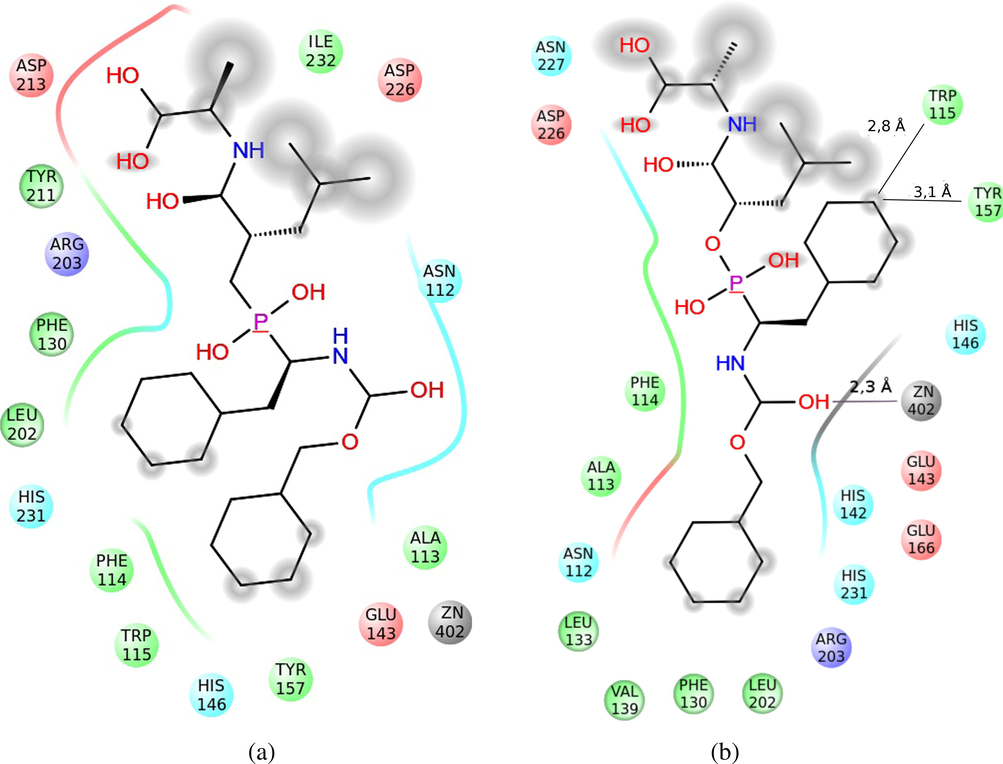
Representation of the interactions of the compound 43 (A) and 172 (B) in the active center of the Thermolysin. The interaction surface with the solvent has been shaded. The polar area of interaction has been represented with blue ribbons; the hydrophobic area, with green ones, and the density of negative charge, with red ones. The interaction with the Zn2+ has been represented with a gray line.
Of all analyzed compounds, two of them were identified as possible outliers (Compounds 34 and 43) from QSAR method results. In this sense, we made experiments of molecular docking of these ‘outlier’ compounds and a group of compounds with similar structural characteristics, since the model provided three-dimensional information of molecules, and it would be interesting to observe their behavior in the active site of Thermolysin. In order to analyze the actions of compound 43 in the active site of the enzyme, besides, seven compounds were considered by the similarity therewith; they are shown in Fig. 11.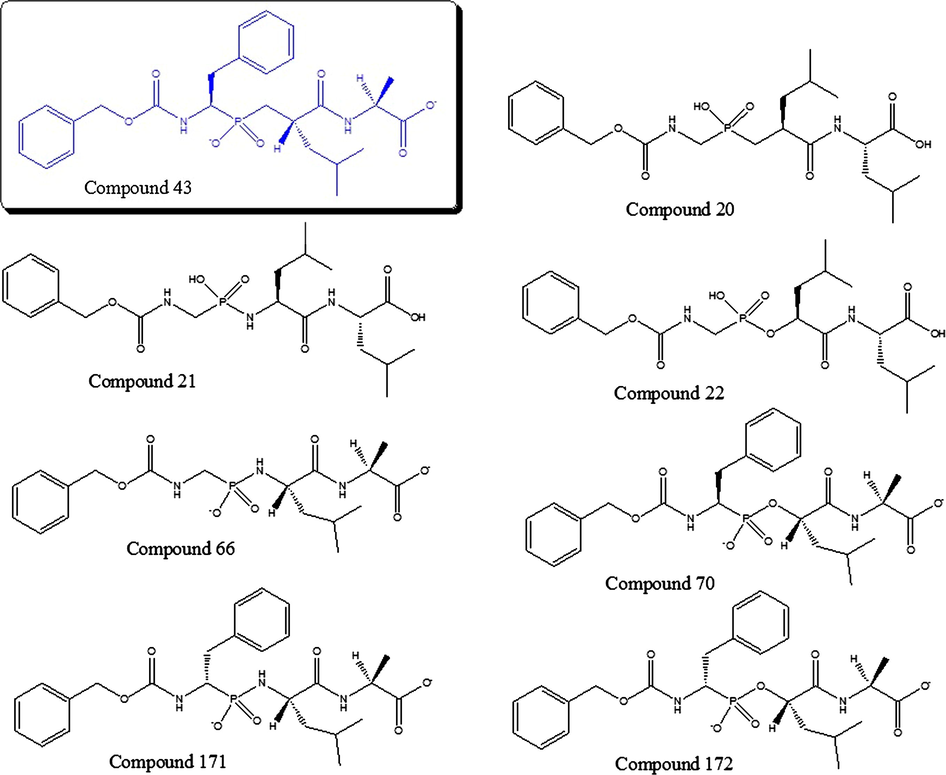
Structurally similar compounds to compound 43 proved with docking.
Of all compounds in the dataset, the compound 43 is the most active (pKi = 7.17); in other words, this compound is an excellent inhibitor of Thermolysin. This molecule behaved in a similar way in the docking experiments, with low energy of union (−8.0 kcal/mol), compared with other evaluated compounds (see Table 1) that have similar structural characteristics. This molecule is oriented in the active center of Thermolysin, in such a way that the terminal benzenes are located in a hydrophobic pocket, formed by the amino acids Phe130, Leu202, on the one hand, and Phe114, Trp115, Tyr157 and the Ala113, on the other, which gives stability to the complex. Moreover, the Asp213, when being anionic, stabilizes that area and attracts both terminal OHs, which present hydrogens with a lack of charge, stabilizing even more the complex (Fig. 10A).
According to these results, it is confirmed that this compound is very active. However, the pKi predicted by our model is similar to those values of structurally related compounds, instead of their real value, so the residual is large. This suggests that the high experimental activity of compound 43 could be a consequence of the difficulty in hydrolyzing the molecule. Note that compounds with lower Evina (66, 70 and 172) have a hydrolyzable bond near to the phosphorus atom in the chain (P–O– or P–NH–). This enables that the molecule stay longer time in the active site of Thermolysin and, thus, their large value of activity with respect to other structurally similar molecules; for this reason, we decided to keep this compound in the training set.
In the case of compound 34, it has a very close-to-zero (−0.05) residual, so the prediction of this compound by the model is very good. However, this compound is outside the critical leverage, indicating that it may be a structural outlier. As shown in Fig. 12, we can see that it exists in the database other thiols nearby from the structural point of view (compounds 28–33); nevertheless, this compound has the lowest RMSD of all tested molecules (see Table 1) and low energy of union (−7.0 kcal/mol).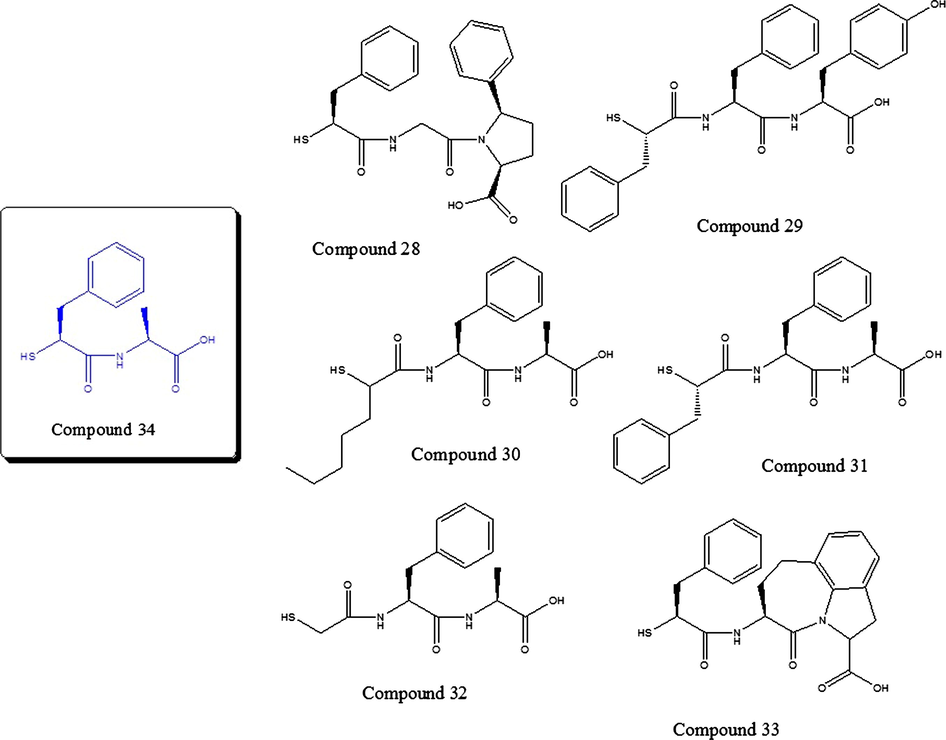
Structurally similar compounds to compound 34 proved with docking.
The low energy of union above is due to its stabilization in the active center of the Thermolysin in a polar area, formed by the histidines 142 and 231, besides the Asn112. This area stabilizes the OH terminal groups (Fig. 13A). Besides, the terminal benzene is stabilized in a hydrophobic area that is formed by Trp115 and Tyr153. Note that the interactions of the compound 34 (Fig. 13A) and compound 32 (Fig. 13B), in the active center of Thermolysin, involve the same residues (His 142, 146 and 231; Glu 143 and 166; Ala113; Phe114; Trp115 and Tyr157). From the foregoing, we decided to maintain also the compound 34 in the training set of the model.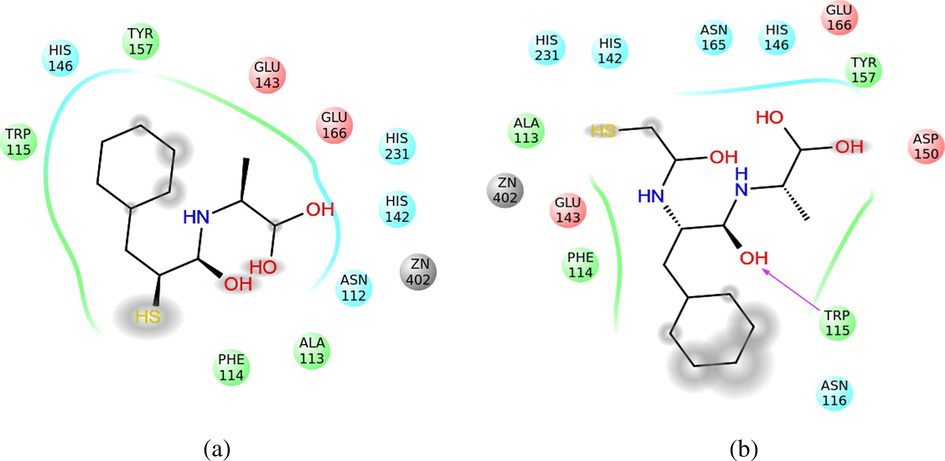
Representation of the interactions of the compound 34 (A) and compound 32 (B) in the active center of the Thermolysin. The interaction with the solvent has been shaded. The polar area of interaction has been represented with blue ribbons; the hydrophobic area, with green ones, and the area with density of negative charge, with red ones.
3.4 Virtual screening
In this report, the main objective was to identify new compounds with inhibitory activity of Thermolysin, considering that they were predicted by the model as active, were within the AD and possessed suitable pharmacokinetic characteristics for oral administration. For the division into virtual screening, it was considered different pKi values, which were separated into three groups according to their activity, reported by Klopman and Bendale (1989): inactive (pK < −0522), marginally active (−0.522 ⩽ pKi < −0022) and active (pKi ⩾ −0.022). According to that, we decide to carry out a new division for the active compounds: Group 1 (−0.022 ⩽ pKi < 2.5), Group 2 (2.5 ⩽ pKi < 3.5) and Group 3 (pKi ⩾ 3.5). Fig. 14 shows the filtering process carried out in the database Drug Bank. As a result, 141 compounds were predicted by the model as belonging to Group 2 (Table S-2 of supplementary material) and 69 were predicted in Group 3; these compounds and their predicted values can be seen in Table 2. HAT i/i: leverage value taken from the hat matrix diagonal. HAT values higher than the cutoff value h∗ = 3p′/n, where p′ is the number of model variables plus one and n is the number of the objects used to calculate the model, are considered X-outliers (Atkinson, 1985; Gramatica et al., 2013b). LAI: Lipinski Alert Index or ‘the rule of 5’ is a filter that identifies compounds with low probability of useful oral activity because of poor absorption or permeation. The alert index is a dummy variable taking value 1 when two or more properties are out of range (Lipinski et al., 1997, 2001).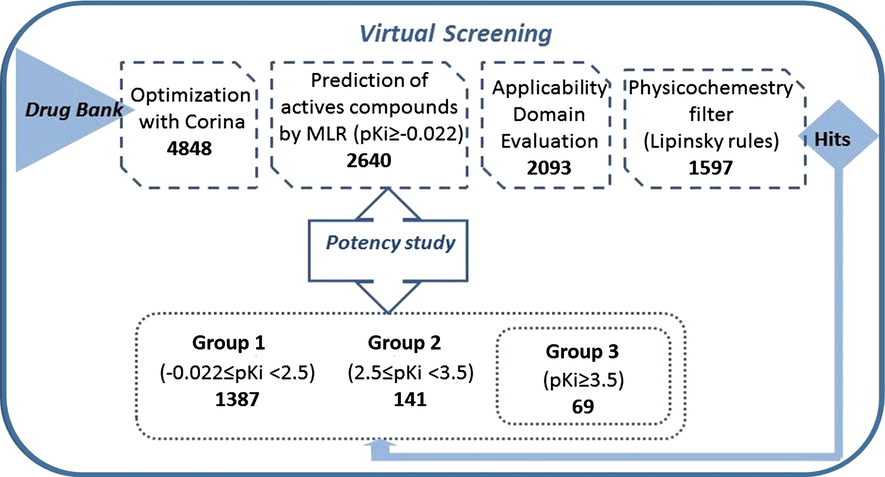
Scheme of virtual screening.
DRUGBANK-ID
Pred. by model eq.
HAT i/i (h∗ = 0.1353)
LAI
DRUGBANK-ID
Pred. by model eq.
HAT i/i (h∗ = 0.1353)
LAI
DB01462
3.518
0.044
0
DB02888
4.333
0.101
0
DB01523
4.138
0.048
0
DB03010
4.574
0.091
0
DB00239
4.043
0.084
0
DB03076
3.807
0.071
0
DB00606
3.935
0.059
0
DB03104
3.506
0.092
0
DB00734
4.135
0.057
0
DB03141
4.784
0.107
0
DB00850
3.821
0.056
0
DB03507
6.631
0.134
0
DB00909
3.576
0.112
0
DB03549
4.516
0.055
0
DB00932
5.581
0.067
0
DB03579
4.146
0.079
0
DB00933
4.056
0.091
0
DB03591
4.424
0.086
0
DB00941
3.613
0.085
0
DB03712
3.857
0.097
0
DB00944
4.570
0.101
0
DB03768
4.327
0.064
0
DB01076
3.663
0.086
0
DB03787
4.146
0.079
0
DB01147
3.503
0.047
0
DB03880
4.647
0.058
0
DB01267
3.947
0.051
0
DB04150
4.258
0.069
0
DB01289
5.062
0.059
0
DB04287
3.874
0.098
0
DB01406
4.343
0.096
0
DB04310
3.863
0.090
0
DB01601
4.937
0.117
0
DB04363
3.669
0.083
0
DB04845
3.662
0.129
0
DB04495
5.219
0.102
0
DB01630
5.556
0.127
0
DB04502
6.728
0.124
0
DB01987
3.781
0.081
0
DB04609
4.473
0.060
0
DB02038
4.146
0.079
0
DB04659
5.230
0.079
0
DB02090
4.492
0.112
0
DB04709
4.235
0.082
0
DB02093
3.595
0.086
0
DB04722
3.8103
0.046
0
DB02225
3.506
0.111
0
DB04772
3.9996
0.052
0
DB02243
4.444
0.086
0
DB04779
4.0673
0.061
0
DB02269
3.593
0.088
0
DB00886
4.2398
0.054
0
DB02276
5.763
0.112
0
DB05025
3.5649
0.057
0
DB02449
3.839
0.043
0
DB05100
5.7736
0.131
0
DB02598
4.284
0.126
0
DB05316
3.6097
0.077
0
DB02613
3.699
0.126
0
DB05790
5.7223
0.135
0
DB02673
3.920
0.075
0
DB05796
4.7386
0.104
0
DB02723
5.528
0.077
0
DB05804
3.9205
0.101
0
DB02783
3.732
0.089
0
DB06258
3.5556
0.076
0
DB02814
4.002
0.078
0
DB06515
3.9857
0.089
0
DB02851
3.680
0.123
0
4 Conclusions
In the present study, a QSAR-RLM model was developed using molecular descriptors of Dragon software, which adequately predicted the inhibitory activity of the enzyme Thermolysin.
This model fulfilled all regulatory principles established by the OECD; the robustness of the model was tested through exercised internal validation (LOO, LMO and Y-scrambling), and its predictability was determined with an external prediction set (external validation). Two possible outliers were identified in the model application domain but, in a molecular docking study, they showed good activity, so we decided to keep both in our database. Finally, a virtual screening experiment was performed for the Drug Bank database. The model identified 141 compounds as potential Thermolysin inhibitors with pKi value between 2.5 and 3.5, as well as 69 compounds with pKi value greater than 3.5; future evaluation of these compounds could be a step forward in the search of new Thermolysin inhibitors.
Contributors
All authors approved the final version of this manuscript. Cañizares-Carmenate and Castillo-Garit designed and performed the QSAR experiments and wrote the manuscript, Mena-Ulecia and Perera-Sardiña designed and performed the Docking experiments; Torrens idealized the study and revised the manuscript.
Acknowledgments
One of us, F. Torrens, thanks support from the Spanish Ministerio de Economía y Competitividad (Project No. BFU2013-41648-P) and EU ERDF.
References
- The thermolysin family (M4) of enzymes: therapeutic and biotechnological potential. Chem. Biol. Drug Des.. 2009;73:7-16.
- [Google Scholar]
- Novel therapies in acute and chronic heart failure. Pharmacol. Ther.. 2012;135:1-17.
- [Google Scholar]
- Plots transformations, and regression. In: An Introduction to Graphical Methods of Diagnostic Regression Analysis. Clarendon Press; 1985.
- [Google Scholar]
- Molecular docking studies for the identification of novel melatoninergic inhibitors for acetylserotonin-o-methyltransferase using different docking routines. Theor. Biol. Med. Model. 2013;10:63.
- [Google Scholar]
- An approach to design potent anti-Alzheimer’s agents by 3D-QSAR studies on fused 5,6-bicyclic heterocycles as c-secretase modulators using kNN–MFA methodology. Arab. J. Chem.. 2014;7:924-935.
- [Google Scholar]
- Bioinformatic analysis of the neprilysin (M13) family of peptidases reveals complex evolutionary and functional relationships. BMC Evol. Biol.. 2008;8:16.
- [Google Scholar]
- Three-dimensional models of ACE and NEP inhibitors and their use in the design of potent dual ACE/NEP inhibitors. J. Am. Chem. Soc.. 1996;118:8231-8249.
- [Google Scholar]
- Comparative study to predict toxic modes of action of phenols from molecular structures. SAR QSAR Environ. Res.. 2013;24:235-251.
- [Google Scholar]
- Identification in silico and in vitro of novel trypanosomicidal drug-like compounds. Chem. Biol. Drug Des.. 2012;80:38-45.
- [Google Scholar]
- Bond-based bilinear indices for computational discovery of novel trypanosomicidal drug-like compounds through virtual screening. Eur. J. Med. Chem.. 2015;96:238-244.
- [Google Scholar]
- In silico antibacterial activity modeling based on the TOMOCOMD-CARDD approach. J. Braz. Chem. Soc.. 2015;26:1218-1226.
- [Google Scholar]
- Applications of bond-based 3D-chiral quadratic indices in QSAR studies related to central chirality codification. QSAR Comb. Sci.. 2009;28:1465-1477.
- [Google Scholar]
- Comments on the definition of the Q2 parameter for QSAR validation. J. Chem. Inf. Model. 2009;49:1669-1678.
- [Google Scholar]
- Real external predictivity of QSAR models: how to evaluate it? comparison of different validation criteria and proposal of using the concordance correlation coefficient. J. Chem. Inf. Model.. 2011;51:2320.
- [Google Scholar]
- Real external predictivity of QSAR models. Part 2. New intercomparable thresholds for different validation criteria and the need for scatter plot inspection. J. Chem. Inf. Model.. 2012;52:2044.
- [Google Scholar]
- Development and use of quantum mechanical molecular models. 76. AM1: a new general purpose quantum mechanical molecular model. J. Am. Chem. Soc.. 1985;107:3902-3909.
- [Google Scholar]
- A stepwise approach for defining the applicability domain of SAR and QSAR models. J. Chem. Inf. Model.. 2005;45:839-849.
- [Google Scholar]
- Knowledge-based scoring function to predict protein-ligand interactions. J. Mol. Biol.. 2000;295:337-356.
- [Google Scholar]
- TOPS-MODE versus DRAGON descriptors to predict permeability coefficients through low-density polyethylene. J. Comput. Aided. Mol. Des.. 2003;17:665-672.
- [Google Scholar]
- Modeling of 2-pyridin-3-yl-benzo[d][1,3]oxazin-4-one derivatives by several conformational searching tools and molecular docking. Curr. Pharm. Des.. 2013;19:2194-2203.
- [Google Scholar]
- Towards better understanding of feature-selection or reduction techniques for quantitative structure-activity relationship models. TrAC-Trends Anal. Chem.. 2013;42:49-63.
- [Google Scholar]
- Gramatica, P., Chirico, N., Papa, E., Cassani, S., Kovarich, S., 2013a. QSARINS, software for QSAR MLR model development and validation. From http://www.qsar.it.
- QSARINS: a new software for the development, analysis and validation of QSAR MLR models. J. Comput. Chem.. 2013;34:2121-2132.
- [Google Scholar]
- Inhibition of thermolysin and neutral endopeptidase 24.11 by a novel glutaramide derivative: X-ray structure determination of the thermolysin-inhibitor complex. Biochemistry. 1994;33:51-56.
- [Google Scholar]
- D-stereospecificity in the inhibition of thermolysin by N-acyl-N-hydroxy-c -amino acid esters. Tetrahedron: Asymmetry. 1997;8:3699-3702.
- [Google Scholar]
- Estimation of Ki in a competitive enzyme-inhibition model: comparisons among three methods of data analysis. Drug Metab. Dispos.. 1999;27:756-762.
- [Google Scholar]
- Discovery of potent thermolysin inhibitors using structure based virtual screening and binding assays. J. Med. Chem.. 2009;52:48-61.
- [Google Scholar]
- Docking and scoring in virtual screening for drug discovery: methods and applications. Nat. Rev. Drug Discovery. 2004;3:935-949.
- [Google Scholar]
- Computer automated structure evaluation (CASE): a study of inhibitors of the thermolysin enzyme. J. Theor. Biol.. 1989;136:67-77.
- [Google Scholar]
- Thermodynamics of protein-ligand interactions as a reference for computational analysis: how to assess accuracy, reliability and relevance of experimental data. J. Comput. Aided Mol. Des.. 2015;29:867-883.
- [Google Scholar]
- antihypertensive effects of fasidotril, a dual inhibitor of neprilysin and angiotensin-converting enzyme, in rats and humans. Hypertension. 2000;35:1148-1153.
- [Google Scholar]
- Prediction of Caco-2 cell permeability using bilinear indices and multiple linear regression. Lett. Drug Des. Discovery. 2016;13:161-169.
- [Google Scholar]
- Pose prediction and virtual screening performance of GOLD scoring functions in a standardized test. J. Comput. Aided Mol. Des.. 2012;26:737-748.
- [Google Scholar]
- A concordance correlation coefficient to evaluate reproducibility. Biometrics. 1989;45:255-268.
- [Google Scholar]
- Experimental and computational approaches to estimate solubility and permeability in drug discovery and development settings. Adv. Drug Delivery Rev.. 1997;23:3-25.
- [Google Scholar]
- Experimental and computational approaches to estimate solubility and permeability in drug discovery and development settings. Adv. Drug Delivery Rev.. 2001;46:3-26.
- [Google Scholar]
- General atomic and molecular electronic structure system. J. Comput. Chem.. 1993;14:1167-1189.
- [Google Scholar]
- Significance of root-mean-square deviation in comparing three-dimensional structures of globular proteins. J. Mol. Biol.. 1994;235:625-634.
- [Google Scholar]
- Dual inhibition of neprilysin and angiotensin II receptor: promising new strategy in the treatment of cardiovascular disease. Rev. Colomb. Cardiol.. 2013;20:386-393.
- [Google Scholar]
- New approach to pharmacophoremapping and QSAR analysis using inductive logic programming. Application to thermolysin inhibitors and glycogen phosphorylase B inhibitors. J. Med. Chem.. 2002;45:399-409.
- [Google Scholar]
- Structural basis of the action of thermolysin and related zinc peptidases. Acc. Chem. Res.. 1988;21:333-340.
- [Google Scholar]
- Study of the differential activity of thrombin inhibitors using docking, QSAR, molecular dynamics, and MM-GBSA. PLoS One. 2015;10:e0142774.
- [Google Scholar]
- Thermolysin: kinetic study with oligopeptides. Eur. J. Biochem. Soc. Trans.. 1970;15:374-380.
- [Google Scholar]
- AutoDock4 and AutoDockTools4: automated docking with selective receptor flexibility. J. Comput. Chem.. 2009;30:2785-2791.
- [Google Scholar]
- 3D-QSAR and virtual screening studies in identification of new Rho kinase inhibitors with different scaffolds. J. Iran. Chem. Soc.. 2015;12:1945-1959.
- [Google Scholar]
- Further exploring rm 2 metrics for validation of QSPR models. Chemom. Intell. Lab. Syst.. 2011;107:194-205.
- [Google Scholar]
- Quantitative structure activity relationships as useful tools for the design of new adenosine receptor ligands. 1. Agonist. Curr. Med. Chem.. 2006;13:2253-2266.
- [Google Scholar]
- Insights into the interactions between maleimide derivates and GSK3β combining molecular docking and QSAR. PLoS One. 2014;9
- [Google Scholar]
- Pharmacology. Churchil Livingstone; 2003.
- Zinc metallopeptidases: active site structure and design of selective and mixed inhibitors: new approaches in the search for analgesics and anti-hypertensives. Biochem. Soc. Trans.. 1993;21:678-685.
- [Google Scholar]
- Neutral endopeptidase 24.11: structure, inhibition, and experimental and clinical pharmacology. Pharmacol. Rev.. 1993;45:87-146.
- [Google Scholar]
- Blood pressure reduction with LCZ696, a novel dual-acting inhibitor of the angiotensin II receptor and neprilysin: a randomised, double-blind, placebo-controlled, active comparator study. The Lancet. 2012;375:1255-1266.
- [Google Scholar]
- QSAR studies of some side chain modified 7-chloro-4-aminoquinolines as antimalarial agents. Arab. J. Chem.. 2014;7:701-707.
- [Google Scholar]
- External validation and prediction employing the predictive squared correlation coefficient - test set activity mean vs training set activity mean. J. Chem. Inf. Model.. 2008;48:2140-2145.
- [Google Scholar]
- QSAR models using a large diverse set of estrogens. J. Chem. Inf. Comput. Sci.. 2001;41:186-195.
- [Google Scholar]
- Two putative active centers in human angiotensin I-converting enzyme revealed by molecular cloning. Proc. Natl. Acad. Sci. USA. 1988;82:9386-9390.
- [Google Scholar]
- Talete, s.r.l., 2007. DRAGON for Windows (Software for Molecular Descriptor Calculations).
- A three-dimensional construction of the active site (region 507–749) of human neutral endopeptidase (EC.3.4.24.11) Protein Eng.. 1999;12:141-149.
- [Google Scholar]
- The K correlation index: theory development and its application in chemometrics. Chemom. Intell. Lab. Syst.. 1999;46:13-29.
- [Google Scholar]
- AutoDock Vina: improving the speed and accuracy of docking with a new scoring function, efficient optimization, and multithreading. J. Comput. Chem.. 2010;31:455-461.
- [Google Scholar]
- The neprilysin (NEP) family of zinc metalloendopeptidases: genomics and function. BioEssays. 2001;23:261-269.
- [Google Scholar]
- Therapeutic perspectives in hypertension: novel means for renin-angiotensin-aldosterone system modulation and emerging device-based approaches. Eur. Heart J.. 2011;32:2739-2747.
- [Google Scholar]
- Three-dimensional quantitative structure-activity relationship of angiotesin-converting enzyme and thermolysin inhibitors. A comparison of CoMFA models incorporating molecular orbital fields and desolvation free energies based on active-analog and complementary-receptor-field alignment rules. J. Med. Chem.. 1993;36:2390-2403.
- [Google Scholar]
- Identification of two active site residues in human angiotensin I-converting enzyme. J. Biol. Chem.. 1994;269:29430-29434.
- [Google Scholar]
- World Health Organization, W.H.O., 2016. Raised blood pressure. Retrieved March 2016, from www.who.int/gho/ncd/risk_factors/blood_pressure_text/en/.
- The role of the European Chemicals Bureau in promoting the regulatory use of (Q)SAR methods. SAR QSAR Environ. Res.. 2007;18:111-125.
- [Google Scholar]
- A dipeptidyl carboxypeptidase that converts angiotensin I and inactivates bradykinin. Biochim. Biophys. Acta. 1970;214:374-376.
- [Google Scholar]
- Latest developments in molecular docking: 2010–2011 in review. J. Mol. Recognit.. 2013;26:215-239.
- [Google Scholar]
Appendix A
Supplementary material
Supplementary data associated with this article can be found, in the online version, at http://dx.doi.org/10.1016/j.arabjc.2016.10.003.
Appendix A
Supplementary material
Supplementary data 1
Supplementary data 1


