

Translate this page into:
Kinetic parameters underlying hematite-assisted decomposition of tribromophenol
⁎Corresponding author. mn.altarawneh@uaeu.ac.ae (Mohammednoor Altarawneh)
-
Received: ,
Accepted: ,
This article was originally published by Elsevier and was migrated to Scientific Scholar after the change of Publisher.
Peer review under responsibility of King Saud University.
Abstract
Interaction of brominated flame retardants (BFRs) and transition metal oxides is a widely utilized approach in thermal recycling of bromine-contaminated plastics. An optimum design of the operation requires the development of accurate thermo-kinetic parameters that dictate the co-degradation of both entities. To attain this obviative, thermal degradation behavior pertinent to co-pyrolysis and co-combustion of hematite (Fe2O3): tribromophenol (TBP) mixtures was explored in a thermogravimetric analyzer (TGA) at various heating rates. Thermo-kinetic parameters for mixtures were acquired based on TGA runs while employing three major model-free or isoconversional methods (KAS, Starink, and FWO) and model-fitting methods (Coats-Redfern). Obtained profiles infer that the addition of hematite systematically reduces the governing activation energy (Ea) in both thermochemical processes in reference to neat TBP. The hematite-assisted debromination of TBP under oxidative conditions entails lower activation energy when compared with degradation under pyrolytic conditions. Molecular modeling mapped out initial mechanisms that operate in the interaction with a prime focus on reactions that lead to ring opening of the aromatic rings. Overall, the results obtained from the thermal chemical conversions find direct application in reactor modeling and heat transfer design in domains related to the recycling of electronic and electrical waste (e-wastes).
Keywords
BFR
Thermal degradation
Non-isothermal
Kinetic parameters
Reaction mechanism

1 Introduction
Brominated flame retardants are essential ingredients in polymers present in printed circuit boards (PCBs). They are added in appreciable quantities to delay or prevent the onset of fire when these components are subjected to heat. WPCBs (waste printed circuit boards) and e-waste are accumulating at an alarming pace. This creates a serious dilemma with environmental, health, economical, and social dimensions. The presence of a high load of bromine in the non-metallic fraction in WPCBs and other fractions of discarded plastics engender their safe disposal and utilization for resource recovery to be very challenging (Zhao et al., 2022). The problem is even more profound in certain parts of the world where WPCBs are directly incinerated in the open atmosphere to recover their metallic fractions (Ali et al., 2022a; Kwarteng et al., 2022). Such primitive practices severally pollute surrounding environments with a full spectrum of notorious brominated pollutants, most notably, dioxin-like compounds. Several methodologies and abatement procedures have been pioneered and applied in the removal of bromine from e-waste. The primary objective aim of these methodologies is either to recycle both bromine and hydrocarbon entities or to fix bromine. Developed methodologies include oxidation at supercritical conditions, bio-extraction, and plasma-induced degradation (Andooz et al., 2022). However, such approaches may not apply at industrial scales. Among notable and wide approaches in bromine recovery and elimination from bromine-bearing polymers is their co-pyrolysis with solid additives at mild operational conditions (Altarawneh et al., 2019). The underlying aim is to upgrade the oil extracted from pyrolysis of WPCBs and to produce bromine-free hydrocarbon feeds.
Deployed materials in the catalytic upgrading of WPCB’s oil include zeolite-based materials, a heterogeneous mixture of transition metal oxides (i.e., electric arc furnace dust (EAFD), red mud), and pure transition metal oxides (Al-Harahsheh and Altarawneh, 2019; Grabda et al., 2009; Oleszek et al., 2013; Rzyman et al., 2010; Terakado et al., 2013, 2011). The latter include oxides of iron, zinc, lead, calcium, and antimony. The metal–oxygen structural pairs in these oxides serve as Lewis acid-base sites; thereby facilitating dissociative additions of bromine entities. The catalytic upgrading process is typically carried out in the temperature range of 200–600 °C. As evident by a multitude of characterization techniques, fixed bromine content in the organic matter converts transition metal oxides into metal halides and metal oxyhalides. The utilized metal oxides display a varying degree of success in the elimination of bromine depending on the initially present BFRs, and the deployed BFRs/WPCBs to additives mixing ratio (Al-Harahsheh et al., 2019). An effective additive is expected to entail the capacity of capturing the various brominated fragments from the decomposition of BFRs, most notably aliphatic and aromatic compounds, in addition to HBr. The latter generally accounts for nearly 50 % of the initial bromine content in BFRs. It mainly forms through H abstraction from aromatic rings by the abundant bromine radicals (Altarawneh, 2022).
Due to their affordability, iron oxides (hematite Fe2O3, magnetite Fe3O4, and franklinite ZnFe2O4) were utilized in pure and mixture forms as debromination agents of neat BFRs and WPCBs (Al-Harahsheh et al., 2019). For instance, in a recent study (Mousa et al., 2022), we contrasted profiles of products from co-pyrolysis of a 1:1 mixture of 2,4,6-tribromphenol (TBP) and hematite in a flow reactor between 150 and 500 °C. Thermal decomposition of brominated flame retardants (including TBP) produces an elevated concentration of HBr. As a transition metal oxide with Lewis acid-base sites, hematite captures and fixes HBr. This process transforms hematite into iron bromides; namely, FeBr3 and Febr2. However, it is well-established that FeBr3 is thermally unstable beyond 140 °C and readily eliminates Br2 to produce FeBr2 (Oleszek et al., 2013). The TBP serves as a model compound for BFRs as it contains the brominated aromatic rings that constitute the major structural entities of nearly all BFRs. The degradation of pure TBP in the condensed medium displays a minor conversion of only 3 %. The addition of Fe2O3 resulted in a TBP conversion at 33 %. Thus, hematite entails a rather modest cracking capacity at the investigated temperature window. The non-brominated compounds (i.e., octane) in the condensate fraction account for nearly 17 % of the decomposition products. Emission of HBr was reduced by ∼45 % in reference to the degradation of pure TBP. Fixation of HBr and the subsequent formation of FeBr3 and FeBr2 is attributed to the well-established bromine fixation mechanism that was mapped out by (DFT) density functional theory calculations (Ahmed et al., 2018). The gaseous fraction was mainly dominated by alkylated benzenes (toluene, p-xylene) (Mousa et al., 2022). This group of compounds is often deployed as fuel additives (Zhang et al., 2022). Thus, in principle, it might be plausible to optimize the operational conditions pertinent to the co-pyrolysis of hematite toward the production of XBT products (xylene, benzene, and toluene).
Central to this aim is to precisely comprehend the thermal degradation behavior of BFRs formulations with transition metal oxides as a prerequisite to locating relevant thermal stability regions and their working temperature windows. To this end, the aim of this study is twofold; to report accurate thermo-kinetic parameters for the decomposition of pure TBP and its mixture with hematite under oxidative and pyrolytic conditions, and to map out initial reactions that operate in the decomposition of TBP aromatic ring over a model structure of hematite. The acquired parameters and provided mechanistic insight herein shall find direct application in efforts that aim to safely dispose of bromine-laden plastic waste streams in general. Another important aspect is to comprehend the complex chemistry underlying interaction of brominated aromatic compounds with the abundant transition metal oxides in the recycling facilities.
2 Experimental and modeling procedure
2.1 Thermogravimetric analysis (TGA) runs
The pyrolytic and combustion reactions were performed using TGA Q500 V20.10 of TA instruments. The oxygen and nitrogen of 60 ml/min flow rates were used as the carrier gas, and the analysis was performed in the temperature range of 25–600 °C at the heating rate of 10 °C/min. The peak degradation temperature (Td), and kinetic and thermodynamic parameters were obtained from the TGA data. A sample weighing approximately 8–10 mg was taken to run the experiments, and for the mixture, the sample weight was considered a 1:1 mass ratio (hematite:TBP).
2.2 Model-Free or isoconversional methods
The thermokinetic studies of the samples were done by the model-free method, also known as the isoconversional technique, from the acquired TGA data for different heating rates. The basic concept of this technique is at a specific conversion; the rate of reaction depends only on the temperature (Dhyani and Bhaskar, 2018). This method delivers the characteristic kinetics parameters from the conversion plot against temperature (Vyazovkin, 2000). Moreover, model-free approaches do not require an assumption of any reaction models like the Coats-Redfern method (Naqvi et al., 2018). The studies are conducted on three well-known isoconversional models: Starink, Kissinger Akahira Sunose (KAS), and Flynn-Wall-Ozawa (FWO). This model provides an opportunity to investigate the deviations in the activation energy (Ea, kJ/mol) as a function of conversion (α) throughout the different reactions (Stančin et al., 2021). The pre-exponential or frequency factor (A, min−1) and the linear regression (R2) are also calculated from the characteristic equation for each model. The fundamental state of the equation for the thermal decomposition of the solid state can be generalized, as shown in Eq. (1).
TBP + Fe2O3 (with/without) → Char (solid) + Condensate (liquid) + Volatile (gas)
There are commonly two different methods of isoconversional technique such as differential and integral approaches. The equation is known as the differential method, which has the Friedman method of determining kinetics, whereas the integral form for the model-free approach that obtained by separating the variables α and T, followed by the integration, which gives the following Eq. (7).
Below the onset temperature Ti, the extent of conversion is negligible; hence the equation will be zero between 0 and Ti (Ozawa, 1965; Soria-Verdugo et al., 2020), as illustrated in Eq. (8). Therefore, the final
is obtained in Eq. (9), which is referred as Integral method under which the Straink (Starink, 2003), KAS (Akahira and Sunose, 1971), and FWO (Flynn and Wall, 1966) are covered. In this research work, we are deriving the kinetic parameters by using the isoconversional integral method because it is considered less sensitive. Hence, the possibility of error will be less in this method (Naqvi et al., 2018).
The difference between the models mainly depends upon their assumption in the approximation of the temperature integrals. In the FWO model, as shown in Eq. (10), the approximation of Doyle is used, whereas, the KAS model is focused on improving the FWO model by changing the approximation from Doyle to Murray and White, as shown in Eq. (11) (Doyle, 1962; Murray, 1955). The final Starink model is represented in Eq. (12). The comprehensive details of the mathematical derivation of the following models are reported elsewhere (Soria-Verdugo et al., 2018; Starink, 2003).
From the following derived equations, the characteristic plots are created using each model for the combustion, pyrolysis, catalytic combustion, and catalytic pyrolysis. In our considered notation, we refer to the degradation of the hematite:TBP mixture as a catalytic-assisted process that operates in the decomposition of the latter. The linear plots will be obtained for
vs
in Starink model,
vs
in KAS, and
vs
for the FWO model, respectively. The slope and intercept are found from the obtained linear curves by which it can calculate the Ea and A values for the required conversions. The mean squared error (MSE) for the determined kinetic parameters was calculated using Eq. (13).
2.3 Model fitting method
The reaction mechanism involved at different temperature ranges for each heating rate analyzed was determined by using the model fitting method. The model fitting method is also known as the Coat-Redfern integral method represented as Eq. (14). This approach derives the different kinetic parameters utilizing the data obtained from the TGA.
Reaction Mechanism
Symbol
f(α)
g(α)
Order reaction models
1st Order
R1
(1-α)
-ln(1-α)
2nd Order
R2
(1 − α)2
[1/(1 − α)] − 1
3rd Order
R3
(1 − α)3
½ [(1 − α)−2 − 1]
Half Order
R4
(1 − α)1.5
(2 [(1 – α)−1.5 –1]
Diffusion Models
One dimensional diffusion
D1
½α
α2
Jander Equation (3D)
D2
1.5*(1 − α)2/3*[1 − (1 − α)1/3]−1
[1−(1 − α)1/3]2
Ginstling Equation (4D)
D3
1.5*[(1 − α)1/3 –1]−1
[1-⅔α-(1-α)2/3]
Geometric Models
Contracting Cylinder
F1
2(1-α)1/2
1-(1-α)1/2
Contracting Sphere
F2
3(1-α)2/3
1-(1-α)1/3
Nuclei Growth models
Random Nucleation
F3
(1-α)2
1/(1-α)
Power Law
P2
2α1/2
α1/2
Power Law
P3
3α2/3
α1/3
Avrami Erofeev
A1
1.5*(1-α)[-ln(1-α)]1/3
[-ln(1-α)]2/3
Avrami Erofeev
A2
2(1-α)[-ln(1-α)]1/2
[-ln(1-α)]1/2
Avarami Erofeev
A3
3(1-α)[-ln(1-α)]2/3
[-ln(1-α)]⅓
The thermodynamic variables such as the enthalpy change
, entropy change
and Gibbs free energy change
are extracted from the findings of kinetic triplets using the model-free method (Xu and Chen, 2013). The
evaluates the energy required for the bond dissociation while undergoing the decomposition reactions. The
values enable to determine the condition of reaction either exothermic or endothermic (Arabkhani et al., 2021).
measures the degree of disorderness of the formed products from reactants in a system, in which lower
values resemble the lower reactivity than high
values. The maximum mechanical work that can be attained by a substance for a specific task is called as Gibbs Free energy and hence
signifies the viability of energy on undergoing the reactions. The equation related to each thermodynamic parameter are illustrated in Eq. (15), Eq. (16), and Eq. (17).
2.4 Computational methodology
Cluster model
We mapped out the initial steps in the hematite-assisted decomposition of a TBP molecule based on an α-Fe2O3 cluster. As illustrated in our previous work (Altarawneh et al., 2016a), the utilized cluster acquires the main geometrical and electronic features to that of an extended hematite surface along the most thermodynamically stable termination 0001. The computational methodology comprises using the PAW functional (Perdew and Burke, 1996) along with a global cut-off of 3.6 Å, and the DNP basis set. Total energies converged to less than 1 × 10⁻⁶ Hartree. Reaction energies were corrected through the inclusion of a dispersion correction function (Tkatchenko et al., 2008). The complete LST/QST method (Govind et al., 2003) locates transition state structures. All calculations were executed using the DMol3 program (Delley, 2000). Bond’s order is calculated based on Mayer’s formalism (Bridgeman et al., 2001).
3 Results and discussions
3.1 Thermogravimetric analysis
The TGA data were acquired for the samples with and without Fe2O3 in the presence of oxygen and nitrogen at four different heating rates 5, 10, 15, and 20 °C, respectively. The pure TBP sample exhibited only a single decomposition stage in both pyrolysis and combustion due to the absence of any other impurities, whereas the mixture sample exposed two stages in which the second stage was minor. In all the TGA plots for the samples, as shown in Fig. 1, the first stage is considered the active zone where the major devolatilization of TBP occurs, and the second stage is known to be the passive zone. There was no significant fluctuation in the initial and final temperatures for all the samples in both environments. The onset temperature for all the processes was 95–100 °C, and the endpoint was around 200 °C. The differential thermogravimetric (DTG) curves were also plotted for the following TGA curves, which have their own characteristic plot for each sample. The DTG curve detects the Td at which the maximum mass loss occurs. An increasing trend of temperature in the TGA plot for the Td was noticed by increasing the heating rate, which was a similar pattern reported in previous studies (Kaur et al., 2018; Liu et al., 2021; Müsellim et al., 2018). The Td value increased for the combustion process compared to the pyrolysis for the samples. The Td had a significant hike from 154 to 183 °C to 166–180 °C in catalytic combustion, whereas a relatively small increment was observed in normal combustion from 152 to 180 °C to 158–185 °C compared to the pyrolysis reaction at the four different heating rates. Apart from this, the appearance of the second decomposition stage with a Td value around 400 °C in both catalytic reactions can be attributed to two reasons. The first possibility could be the detachment of oxygen from the oxygenated compounds that form during the decomposition of TBP with the help of Fe2O3 in the second stage (Jayashree et al., 2019). The formation of oxygenated compounds is already reported in the previous study of TBP and Fe2O3 (Mousa et al., 2022). The second possibility for this slight curve can also rise due to char oxidation, which appeared only in catalytic reactions (Ali et al., 2023; Bai et al., 2014).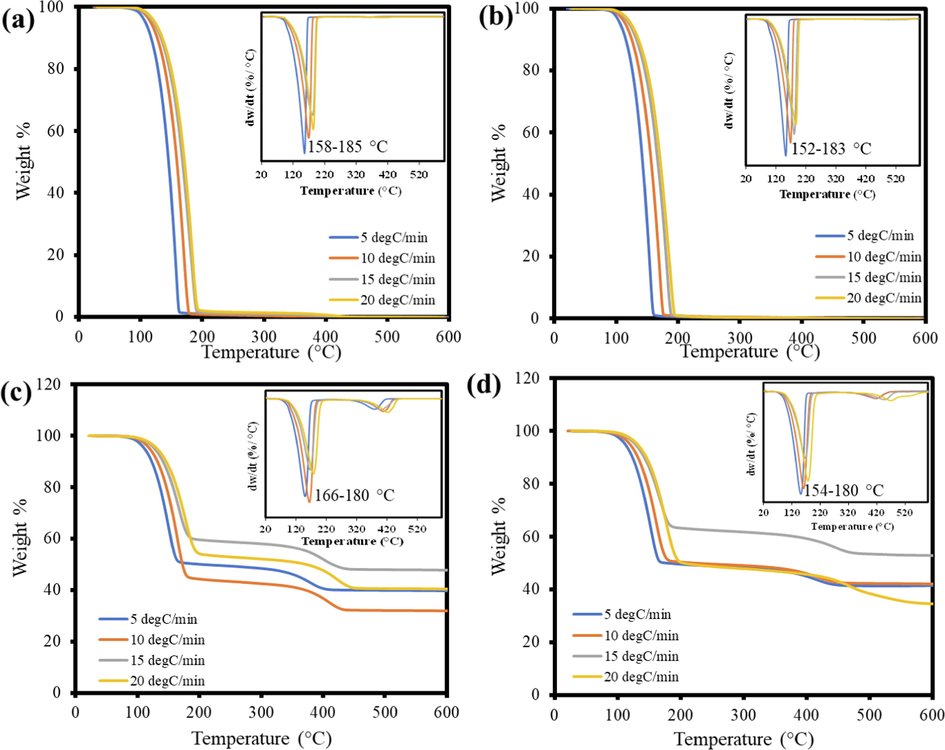
TGA and DTG curves for (a) Pure TBP combustion, (b) Pure TBP pyrolysis, (c) Catalytic combustion (TBP + Fe2O3), and (d) Catalytic pyrolysis (TBP + Fe2O3).
The formation of char was noticed in the catalytic reactions only. Pyrolysis of pure TBP did not result in the formation of char. But in catalytic reactions, due to the presence of Fe2O3, the emitted volatile gases during the degradation of TBP will be reacting with the Fe2O3 resulting in the bond dissociation and formation of FeBr3 (Chen et al., 2018), which is verified by the results obtained in XRD, FTIR, and SEM-EDX. In addition to the FeBr3, the char consists of carbon ashes and other inorganics. The char formation was more in the catalytic pyrolysis with 45 %, whereas it was around 35 % for the catalytic combustion. The char mass was varied according to the heating rates for the catalytic reactions.
3.2 Thermo-kinetic analysis by model-free/isoconversional method
The thermo-kinetic parametric analysis was carried out using the model-free approach using the obtained TGA data for the four processes: combustion, pyrolysis, catalytic pyrolysis, and catalytic combustion. The isoconversional curves were plotted for the Starink, KAS, and FWO model as a function of conversion for combustion and pyrolysis processes in the presence and absence of Fe2O3 at four different heating rates to determine the linearity, as shown in Fig. S.1 and Fig. S.2 in the Supplementary Materials (SM). The conversion range was selected from 0.05 to 0.95 for normal reactions and 0.05–0.5 for catalytic reactions with a step size of 0.05. The slope obtained from the curves was used to calculate the dependency of Ea on calculated R2 values. All the models gave a correlation coefficient of above 0.95 for most of the investigated conversions. This indicates that the selected models were reliable in calculating Ea and A values from the derived characteristic equations of each model. However, poor regression was obtained in the experiments run in the presence of the Fe2O3, and this reduced correlation was found only at the termination stage of the reaction. This could arise due to the experimental error in observing the minor mass changes at the end of the reaction, which is common in the TGA experiments (Liu et al., 2020).
The calculated Ea for the Starink and KAS model was identical in the four processes, but a slight variation was observed in both Ea and A values for the FWO model. This variation can be attributed to the assumption made for each model in the approximation of temperature integrals. Comparing the combustion and pyrolysis reaction of pure TBP, the Ea values were found to be approximately in the range of 65–105 kJ/mol and 60–93 kJ/mol, respectively, as enlisted in the Supplementary Material Table S.1 and Table S.2 (Supplementary Material, SM). The Ea values obtained for the pure TBP were comparable with the previous literature studies (Wang and Hsieh, 1993). The combustion reaction incurs a more Ea value with a 10 kJ/mol difference from the pyrolysis reaction. In both cases, a significant drop was reflected when the conversion range was 0.05–0.15. This explains that the decomposition of TBP into other unsaturated and saturated compounds is initiated in the early stage of the reaction itself. Further conversions also followed the decreasing pattern in Ea value up to 95 % but at a minimal level. The A values for the combustion process were in the range of 1013-109 min−1, whereas for the pyrolysis reaction, it was reported in 1011-108 min−1. From the A values, both processes followed simple reactions or surface reactions (Ali et al., 2022b). Further higher A values indicated a high rate of molecular collision, which requires more reaction energy, in agreement with the values obtained for Ea (Liu et al., 2020).
Comparing the Ea and A values for the combustion and pyrolysis in the presence of Fe2O3 perceived a reverse trend. The estimated Ea values for catalytic combustion were 47–80 kJ/mol and for the pyrolysis reaction was 57–82 kJ/mol, excluding the conversion with poor regression as tabulated in Table 2 and Table 3. It was interesting to notice the decrease in the Ea values of combustion compared to pyrolysis in the presence of oxygen. The exact reverse trend was also shown in the A values for the catalytic process. The estimated A values for the catalytic combustion and catalytic pyrolysis were in the range of 1010-107 min−1 and 1011-109 min−1, respectively. Overall, both processes indicated a simple reaction but, for a small conversion range at the end of the reaction in catalytic combustion, the A value reduces below 109 min−1, which explains that the reaction was tight complex during this conversion (Turmanova et al., 2008). The Ea and A values showed in the α range of 45 %, and 50 % were not reliable due to poor regression, and this could happen due to the experimental error in the minor changes of weight towards the end of the reaction.
Conversion
(%)Straink Model
KAS Model
FWO model
R2
Ea
(kJ/mol)A
(min−1)MSE
R2
Ea
(kJ/mol)A
(min−1)MSE
R2
Ea
(kJ/mol)A
(min−1)MSE
0.05
0.99
80.27
4.85E + 10
0.0022
0.99
80.07
4.58E + 10
0.0022
0.99
82.35
8.78E + 10
0.0022
0.1
0.99
73.21
6.42E + 09
0.0028
0.99
73.00
6.04E + 09
0.0028
0.99
75.83
1.36E + 10
0.0028
0.15
0.99
70.53
2.97E + 09
0.0028
0.99
70.31
2.79E + 09
0.0028
0.99
73.41
6.80E + 09
0.0028
0.2
0.99
68.68
1.75E + 09
0.0032
0.99
68.46
1.64E + 09
0.0032
0.99
71.75
4.22E + 09
0.0032
0.25
0.98
66.85
1.03E + 09
0.0039
0.98
66.62
9.64E + 08
0.0039
0.99
70.09
2.62E + 09
0.0038
0.3
0.98
64.98
6.00E + 08
0.0048
0.98
64.74
5.60E + 08
0.0048
0.98
68.39
1.60E + 09
0.0047
0.35
0.97
61.92
2.48E + 08
0.0070
0.97
61.68
2.31E + 08
0.0071
0.97
65.55
7.08E + 08
0.0070
0.4
0.84
47.23
3.40E + 06
0.0345
0.84
46.97
3.15E + 06
0.0345
0.87
51.68
1.26E + 07
0.0343
0.45
0.01
1.13
2.74E-01
0.2059
0.01
1.49
3.96E-01
0.2063
0.27
6.97
8.31E + 00
0.1969
0.5
0.02
0.95
2.19E-01
0.1044
0.01
0.59
1.23E-01
0.1044
0.6
9.23
2.04E + 01
0.1060
Conversion
(%)Straink Model
KAS Model
FWO model
R2
Ea
(kJ/mol)A
(min−1)MSE
R2
Ea
(kJ/mol)A
(min−1)MSE
R2
Ea
(kJ/mol)A
(min−1)MSE
0.05
0.98
82.38
8.75E + 10
0.0041
0.98
82.19
8.27E + 10
0.0041
0.98
84.36
1.54E + 11
0.0041
0.1
0.98
75.55
1.24E + 10
0.0052
0.98
75.34
1.17E + 10
0.0052
0.98
78.06
2.55E + 10
0.0052
0.15
0.97
72.56
5.26E + 09
0.0067
0.97
72.34
4.94E + 09
0.0067
0.98
75.34
1.17E + 10
0.0067
0.2
0.96
70.69
3.07E + 09
0.0081
0.96
70.46
2.88E + 09
0.0081
0.97
73.66
7.22E + 09
0.0081
0.25
0.95
70.79
3.16E + 09
0.0105
0.95
68.77
1.77E + 09
0.0105
0.96
71.71
4.12E + 09
0.0105
0.3
0.93
65.86
7.66E + 08
0.0151
0.93
65.63
7.16E + 08
0.0151
0.94
69.24
2.02E + 09
0.0151
0.35
0.86
57.74
7.29E + 08
0.0309
0.85
57.49
6.78E + 07
0.0309
0.88
61.60
2.23E + 08
0.0308
0.4
0.03
2.20
7.10E-01
0.2180
0.04
2.56
9.10E-01
0.2183
0.22
5.98
5.43E + 00
0.2100
0.45
0.1
3.75
1.85E + 00
0.2246
0.14
4.13
2.26E + 00
0.2251
0.21
4.96
3.42E + 00
0.2142
The plot of Ea as a conversion function for different models on the four processes is illustrated in Fig. 2. The calculated Ea values of Starink and KAS models were identical, but a slight variation was observed in the FWO model. As discussed in the TGA curves, it was seen that there was a sudden drop in the Ea values in the presence of a Fe2O3. This is because the reaction ended with 50 % conversion, as discussed in the TGA plots. It is seen that the Ea was the least for the catalytic combustion reaction. Moreover, concerning the Ea values, the corresponding A values also showed a difference of two or three orders of magnitude when catalytic combustion compared to other processes, which indicated the simplicity and fastness of the catalytic reaction in the presence of oxygen.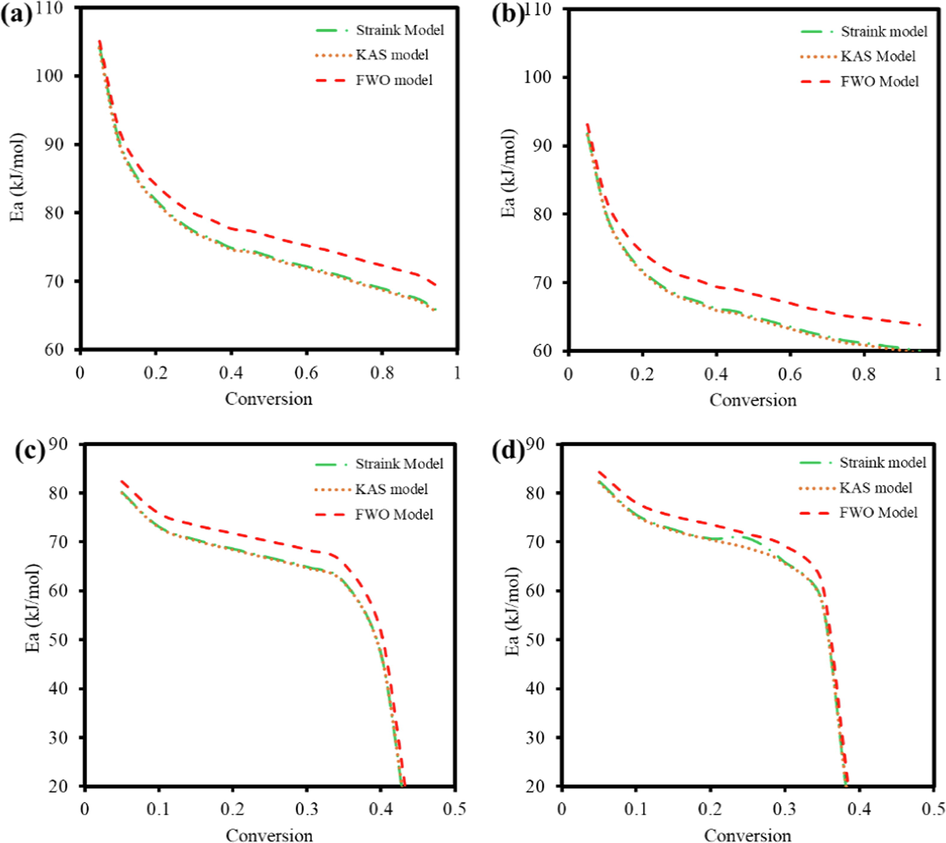
Plot of Ea as a function of α for TBP (a) combustion, (b) pyrolysis, (c) catalytic combustion, (d) catalytic pyrolysis.
From the TGA analysis for both pyrolysis and combustion, it was observed that the decomposition takes place via a single-stage degradation in the temperature window 100–200 °C. On the contrary, degradation of the mixture features three regions of 100–200 °C, 200 – 400 °C, and 400–500 °C. From the derived 15 mechanisms and based on the R2 values, the best-fitted mechanism for the reactions at different heating rates were determined as enlisted in Table 4 and Table 5 for pyrolysis and combustion reactions. After comparing the values of activation energies obtained from the model-free kinetic approach with Coats and Redfern approach, the reaction mechanism in pyrolysis and combustion of pure TBP follows a 1st and half order reaction, spherical and cylindrical contraction and Avarami Erofeev A1. While mixing the TBP with Fe2O3 in both pyrolysis and combustion exhibits a rather very complex nature of the reaction mechanism with 1st, ½ order reaction, geometrical contraction, and Avarami Eroveef A1 with the addition of one-dimensional diffusion and power law. In case of pyrolysis, both pure and mixtures - except the random nucleation and power law (P3) -, all deployed models provide very well-fitting at low-temperature regions. In the mixture at a high-temperature region most models (except tone-dimensional diffusion, contracting sphere, and Avarami Erofeev A1), entail R2 values close to 1.0 for the heating rate of 10 and 15 °C/min. For the combustion process, one-dimensional diffusion exhibited a good fitting correlation in both pure and blend samples. In the case of reaction-order mechanisms for the mixture, first and ½ order reactions afford excellent fitting across the high-temperature zone utilizing a 15 °C/min heating rate. The same pattern of reaction mechanism was observed for the contracting sphere and cylinder models. Overall, Power law model P2 proved to be the best-fitted model for all the temperature ranges and different heating rates for both combustion and pyrolysis reactions.
Model Name
Symbol
Heating rate °C/min
Sample
Temperature (100–200 °C)
Temperature (400–500 °C)
R2
Ea (kJ/mol)
A
(min−1)R2
Ea (kJ/mol)
A
(min−1)
1st Order
R1
5
TBP
0.93
77.75
1.03E + 09
TBP + FeO
0.93
57.46
1.65E + 06
0.26
250.58
7.08E + 22
10
TBP
0.98
85.35
1.02E + 10
TBP + FeO
0.97
62.57
9.63E + 06
0.91
23.42
7.05E + 07
15
TBP
0.99
84.55
7.06E + 09
TBP + FeO
0.97
62.57
1.44E + 07
0.91
23.42
1.06E + 08
20
TBP
0.99
82.84
4.50E + 09
TBP + FeO
0.99
66.67
2.98E + 07
0.73
7.24
1.36E + 09
2nd Order
R2
5
TBP
0.88
109.37
1.56E + 12
TBP + FeO
0.9
94.92
1.87E + 10
0.26
287.78
3.42E + 25
10
TBP
0.96
133.62
1.51E + 15
TBP + FeO
0.95
110.50
1.79E + 12
0.01
0.42
3.19E + 08
15
TBP
0.98
143.53
1.88E + 16
TBP + FeO
0.97
113.41
3.83E + 12
0.91
10.78
2.24E + 09
20
TBP
0.99
146.09
3.75E + 16
TBP + FeO
0.99
127.73
1.46E + 14
0.73
5.20
4.67E + 09
3rd Order
R3
5
TBP
0.91
239.81
1.35E + 31
TBP + FeO
0.95
118.68
4.14E + 14
0.6
231.96
7.10E + 24
10
TBP
0.86
211.15
9.71E + 26
TBP + FeO
0.97
107.98
1.92E + 13
0.97
278.75
2.73E + 23
15
TBP
0.79
171.06
3.12E + 21
TBP + FeO
0.98
92.68
1.65E + 11
0.96
203.71
6.55E + 16
20
TBP
0.78
149.79
4.75E + 18
TBP + FeO
0.98
90.14
5.20E + 10
0.9
68.28
7.69E + 05
1/2 order
R4
5
TBP
0.94
109.16
2.29E + 13
TBP + FeO
0.94
69.95
9.71E + 07
0.26
215.19
1.94E + 20
10
TBP
0.96
109.97
2.34E + 13
TBP + FeO
0.98
72.10
2.09E + 08
0.96
71.63
3.89E + 05
15
TBP
0.95
101.73
1.53E + 12
TBP + FeO
0.99
68.09
6.41E + 07
0.96
58.53
5.13E + 05
20
TBP
0.95
96.31
3.06E + 11
TBP + FeO
0.99
71.88
1.58E + 08
0.85
18.77
3.00E + 08
One dimensional diffusion
D1
5
TBP
0.85
96.01
4.20E + 10
TBP + FeO
0.87
85.23
1.61E + 09
0.87
6.79
6.18E + 09
10
TBP
0.94
121.40
6.40E + 13
TBP + FeO
0.94
102.11
2.46E + 11
0.86
6.54
1.24E + 10
15
TBP
0.97
133.57
1.67E + 15
TBP + FeO
0.96
106.72
9.09E + 11
0.28
1.53
1.29E + 09
20
TBP
0.98
137.40
4.99E + 15
TBP + FeO
0.98
122.29
5.27E + 13
0.02
0.24
4.28E + 08
Jander Equation
D2
5
TBP
0.92
132.59
5.56E + 14
TBP + FeO
0.92
107.80
2.64E + 11
0.26
2955.94
1.22E + 27
10
TBP
0.98
153.33
1.58E + 17
TBP + FeO
0.96
120.95
1.10E + 13
0.86
21.44
6.82E + 08
15
TBP
0.99
158.39
4.21E + 17
TBP + FeO
0.97
121.30
1.03E + 13
0.96
32.61
3.69E + 08
20
TBP
0.99
158.39
3.75E + 17
TBP + FeO
0.99
133.93
2.27E + 14
0.87
14.85
6.70E + 09
Ginstling Equation
D3
5
TBP
0.9
116.51
3.37E + 12
TBP + FeO
0.91
99.12
1.62E + 10
0.26
312.94
2.20E + 27
10
TBP
0.96
139.78
2.30E + 15
TBP + FeO
0.95
113.94
1.19E + 12
0.46
5.40
5.00E + 09
15
TBP
0.99
148.23
1.80E + 16
TBP + FeO
0.97
116.02
1.94E + 12
0.94
17.31
4.25E + 09
20
TBP
0.99
150.02
2.82E + 16
TBP + FeO
0.99
129.78
6.18E + 13
0.87
8.25
1.66E + 10
Contracting Cylinder
F1
5
TBP
0.89
56.98
6.21E + 05
TBP + FeO
0.89
47.23
3.04E + 04
0.26
288.49
3.83E + 25
10
TBP
0.97
68.25
2.22E + 07
TBP + FeO
0.95
54.40
3.40E + 05
0.081
1.01
8.73E + 08
15
TBP
0.99
72.00
6.71E + 07
TBP + FeO
0.97
55.20
4.96E + 05
0.81
4.84
2.73E + 09
20
TBP
0.99
72.64
9.01E + 07
TBP + FeO
0.99
61.93
3.24E + 06
0.16
0.94
2.20E + 09
Contracting Sphere
F2
5
TBP
0.91
62.80
2.75E + 06
TBP + FeO
0.91
50.40
5.49E + 04
0.26
291.08
5.89E + 25
10
TBP
0.98
73.17
7.11E + 07
TBP + FeO
0.96
56.98
5.23E + 05
0.52
4.72
1.81E + 09
15
TBP
0.99
75.70
1.44E + 08
TBP + FeO
0.97
57.15
6.22E + 05
0.92
10.30
2.89E + 09
20
TBP
0.99
74.82
1.56E + 08
TBP + FeO
0.99
63.46
3.54E + 06
0.21
1.42
2.92E + 09
Random Nucleation
F3
5
TBP
0.84
973.66
4.14E + 13
TBP + FeO
0.88
38.43
2.58E + 04
0.26
170.58
1.10E + 17
10
TBP
0.71
76.45
7.48E + 09
TBP + FeO
0.83
28.40
8.18E + 05
0.97
133.29
1.03E + 11
15
TBP
0.53
52.48
4.71E + 06
TBP + FeO
0.78
18.77
1.59E + 07
0.95
95.39
4.86E + 07
20
TBP
0.45
40.35
1.28E + 05
TBP + FeO
0.63
12.90
9.25E + 07
0.85
27.44
4.77E + 07
Power Law
P2
5
TBP
0.77
18.76
1.50E + 07
TBP + FeO
0.79
16.06
2.81E + 07
0.99
10.70
1.96E + 10
10
TBP
0.92
25.10
8.10E + 06
TBP + FeO
0.9
20.28
2.52E + 07
0.99
10.59
3.93E + 10
15
TBP
0.96
28.14
6.83E + 06
TBP + FeO
0.93
21.43
3.22E + 07
0.99
8.61
3.53E + 10
20
TBP
0.97
29.10
7.75E + 06
TBP + FeO
0.97
25.33
2.04E + 07
0.99
9.13
5.59E + 10
Power Law
P3
5
TBP
0.77
10.15
8.12E + 07
TBP + FeO
0.71
8.36
1.12E + 08
0.99
11.13
2.21E + 10
10
TBP
0.88
14.38
7.92E + 07
TBP + FeO
0.86
11.17
1.51E + 08
0.99
11.06
4.43E + 10
15
TBP
0.95
16.41
8.56E + 07
TBP + FeO
0.91
11.94
2.10E + 08
0.99
9.74
4.77E + 10
20
TBP
0.97
17.05
1.04E + 08
TBP + FeO
0.96
14.53
1.86E + 08
0.99
10.04
7.07E + 10
Avrami Erofeev
A1
5
TBP
0.93
49.44
2.12E + 05
TBP + FeO
0.91
36.00
1.81E + 05
0.26
262.49
5.12E + 23
10
TBP
0.98
54.60
1.30E + 06
TBP + FeO
0.96
39.40
2.06E + 05
0.84
11.63
4.03E + 08
15
TBP
0.98
54.06
1.16E + 06
TBP + FeO
0.98
38.60
4.78E + 05
0.93
12.86
7.11E + 08
20
TBP
0.99
52.92
9.42E + 05
TBP + FeO
0.99
42.14
3.45E + 05
0.08
0.83
5.78E + 08
Avrami Erofeev
A2
5
TBP
0.92
35.38
1.65E + 05
TBP + FeO
0.91
25.23
2.52E + 06
0.26
268.55
1.40E + 24
10
TBP
0.98
39.18
1.74E + 05
TBP + FeO
0.96
27.78
3.39E + 06
0.69
5.71
6.75E + 08
15
TBP
0.98
38.78
3.77E + 05
TBP + FeO
0.97
27.14
7.01E + 06
0.86
6.64
1.23E + 09
20
TBP
0.98
37.92
7.02E + 05
TBP + FeO
0.99
29.84
6.04E + 06
0.56
2.37
3.14E + 09
Avarami Erofeev
A3
5
TBP
0.91
21.22
5.50E + 06
TBP + FeO
0.87
14.47
2.89E + 07
0.26
274.61
3.83E + 24
10
TBP
0.97
23.76
7.46E + 06
TBP + FeO
0.95
16.17
4.66E + 07
0.01
0.20
8.18E + 07
15
TBP
0.98
23.49
1.43E + 07
TBP + FeO
0.96
15.29
8.31E + 07
0.05
0.41
2.59E + 08
20
TBP
0.98
22.92
2.36E + 07
TBP + FeO
0.99
17.54
8.92E + 07
0.94
5.59
1.42E + 10
Model Name
Symbol
Heating rate °C/min
Sample
Temperature (100–200 °C)
Temperature (350–450 °C)
R2
Ea (kJ/mol)
A
(min−1)R2
Ea (kJ/mol)
A
(min−1)
1st Order
R1
5
TBP
0.94
77.56
1.09E + 07
TBP + FeO
0.91
52.60
6.35E + 03
0.6
508.40
1.69E + 41
10
TBP
0.98
86.95
1.69E + 08
TBP + FeO
0.97
64.06
2.00E + 05
0.83
40.13
5.27E + 06
15
TBP
0.99
81.39
3.29E + 07
TBP + FeO
0.98
63.56
2.13E + 05
0.91
33.22
2.59E + 07
20
TBP
0.99
82.16
4.64E + 07
TBP + FeO
0.99
64.49
2.65E + 05
0.74
25.76
1.17E + 08
2nd Order
R2
5
TBP
0.90
113.53
3.97E + 10
TBP + FeO
0.88
91.10
5.84E + 07
0.55
551.62
1.35E + 44
10
TBP
0.96
138.07
3.39E + 13
TBP + FeO
0.95
115.84
5.71E + 10
0.9
11.93
1.00E + 09
15
TBP
0.99
140.41
5.31E + 13
TBP + FeO
0.96
117.96
1.13E + 11
0.95
15.47
1.10E + 09
20
TBP
0.99
145.10
2.08E + 14
TBP + FeO
0.99
122.58
3.18E + 11
0.83
13.93
1.90E + 09
3rd Order
R3
5
TBP
0.91
217.98
5.68E + 25
TBP + FeO
0.94
96.98
6.48E + 09
0.83
505.77
1.63E + 43
10
TBP
0.85
208.18
1.54E + 24
TBP + FeO
0.98
103.20
3.32E + 10
0.78
370.09
2.98E + 31
15
TBP
0.82
155.46
1.70E + 17
TBP + FeO
0.98
94.98
3.28E + 09
0.88
255.04
1.15E + 22
20
TBP
0.83
145.73
9.98E + 15
TBP + FeO
0.98
89.75
5.94E + 08
0.74
190.23
4.54E + 16
1/2 order
R4
5
TBP
0.95
104.87
4.80E + 10
TBP + FeO
0.92
61.90
1.16E + 05
0.83
500.15
9.75E + 40
10
TBP
0.96
110.71
2.29E + 11
TBP + FeO
0.98
72.39
2.60E + 06
0.79
102.72
2.29E + 08
15
TBP
0.96
96.24
2.93E + 09
TBP + FeO
0.98
70.38
1.73E + 06
0.89
74.76
1.22E + 06
20
TBP
0.96
95.01
2.25E + 09
TBP + FeO
0.99
70.06
1.46E + 06
0.74
56.55
5.34E + 05
One dimensional diffusion
D1
5
TBP
0.88
100.45
1.35E + 09
TBP + FeO
0.86
82.94
8.91E + 06
0.32
2.53
1.15E + 09
10
TBP
0.95
126.07
1.70E + 12
TBP + FeO
0.77
7.66
2.42E + 09
0.97
5.49
8.50E + 09
15
TBP
0.98
130.90
5.83E + 12
TBP + FeO
0.96
111.24
2.84E + 10
0.84
4.91
1.99E + 09
20
TBP
0.98
136.24
2.80E + 13
TBP + FeO
0.98
116.88
1.10E + 11
0.68
4.58
2.77E + 09
Jander Equation
D2
5
TBP
0.93
135.20
7.13E + 12
TBP + FeO
0.9
101.29
3.18E + 08
0.58
591.75
1.27E + 47
10
TBP
0.98
157.26
2.61E + 15
TBP + FeO
0.96
125.21
2.28E + 11
0.9
42.02
3.12E + 07
15
TBP
0.99
154.02
7.34E + 14
TBP + FeO
0.97
125.85
2.86E + 11
0.95
41.16
6.18E + 07
20
TBP
0.99
157.37
1.91E + 15
TBP + FeO
0.99
129.15
5.27E + 11
0.83
34.65
2.63E + 08
Ginstling Equation
D3
5
TBP
0.91
120.29
7.14E + 10
TBP + FeO
0.9
94.45
3.72E + 07
0.56
606.26
1.06E + 48
10
TBP
0.97
144.08
4.70E + 13
TBP + FeO
0.96
118.93
3.29E + 10
0.91
20.23
1.32E + 09
15
TBP
0.99
144.77
4.43E + 13
TBP + FeO
0.97
120.56
5.63E + 10
0.96
23.05
1.49E + 09
20
TBP
0.99
149.05
1.53E + 14
TBP + FeO
0.99
124.76
1.37E + 11
0.84
20.17
3.25E + 09
Contracting Cylinder
F1
5
TBP
0.91
58.71
1.62E + 04
TBP + FeO
0.87
44.64
1.42E + 03
0.55
551.6
1.32E + 44
10
TBP
0.97
70.35
5.40E + 05
TBP + FeO
0.95
56.80
1.07E + 04
0.78
7.61
1.39E + 09
15
TBP
0.99
70.14
5.42E + 05
TBP + FeO
0.96
57.48
1.64E + 04
0.9
8.52
2.08E + 09
20
TBP
0.99
72.15
1.12E + 06
TBP + FeO
0.99
59.46
2.85E + 04
0.61
6.56
3.23E + 09
Contracting Sphere
F2
5
TBP
0.92
64.10
5.72E + 04
TBP + FeO
0.88
47.15
9.80E + 02
0.56
563.16
9.43E + 44
10
TBP
0.98
75.13
1.55E + 06
TBP + FeO
0.96
59.11
1.45E + 04
0.83
15.42
8.43E + 08
15
TBP
0.99
73.51
1.00E + 06
TBP + FeO
0.97
59.43
1.99E + 04
0.92
15.00
1.43E + 09
20
TBP
0.99
75.19
1.87E + 06
TBP + FeO
0.99
61.08
3.12E + 04
0.7
11.74
2.90E + 09
Random Nucleation
F3
5
TBP
0.82
85.33
1.01E + 09
TBP + FeO
0.88
27.52
1.60E + 04
0.84
489.22
4.49E + 40
10
TBP
0.68
73.72
4.11E + 07
TBP + FeO
0.81
24.20
1.06E + 05
0.77
179.06
1.27E + 15
15
TBP
0.53
45.19
1.01E + 04
TBP + FeO
0.78
18.81
8.42E + 05
0.86
121.31
2.40E + 10
20
TBP
0.51
38.71
3.26E + 03
TBP + FeO
0.64
14.21
4.75E + 06
0.72
88.81
4.62E + 07
Power Law
P2
5
TBP
0.81
19.87
6.02E + 05
TBP + FeO
0.77
15.49
2.11E + 06
0.98
9.01
1.25E + 10
10
TBP
0.92
26.27
2.40E + 05
TBP + FeO
0.91
21.78
8.59E + 05
0.99
7.91
1.84E + 10
15
TBP
0.97
27.48
2.94E + 05
TBP + FeO
0.93
22.56
1.11E + 06
0.99
7.14
2.19E + 10
20
TBP
0.97
28.81
2.84E + 05
TBP + FeO
0.97
23.97
1.13E + 06
0.99
7.22
3.04E + 10
Power Law
P3
5
TBP
0.74
10.89
6.62E + 06
TBP + FeO
0.66
7.98
1.53E + 07
0.99
9.73
1.53E + 10
10
TBP
0.91
15.16
4.53E + 06
TBP + FeO
0.88
12.17
1.06E + 07
0.99
8.99
2.51E + 10
15
TBP
0.96
15.96
5.92E + 06
TBP + FeO
0.91
12.69
1.44E + 07
0.99
8.49
3.26E + 10
20
TBP
0.96
16.85
6.38E + 06
TBP + FeO
0.97
13.61
1.60E + 07
0.99
8.54
4.46E + 10
Avrami Erofeev
A1
5
TBP
0.94
49.40
3.84E + 03
TBP + FeO
0.9
32.75
1.37E + 04
0.57
517.11
5.84E + 41
10
TBP
0.98
55.66
3.00E + 04
TBP + FeO
0.97
40.40
4.40E + 03
0.78
23.04
9.43E + 07
15
TBP
0.99
51.96
1.16E + 04
TBP + FeO
0.97
40.07
8.28E + 03
0.88
18.44
2.84E + 08
20
TBP
0.99
52.47
1.60E + 04
TBP + FeO
0.99
40.69
1.15E + 04
0.64
13.46
7.39E + 08
Avrami Erofeev
A2
5
TBP
0.93
35.28
5.17E + 03
TBP + FeO
0.87
22.80
2.13E + 05
0.56
521.48
1.09E + 42
10
TBP
0.98
39.98
3.75E + 03
TBP + FeO
0.96
28.53
1.07E + 05
0.72
14.48
3.32E + 08
15
TBP
0.99
37.20
1.54E + 04
TBP + FeO
0.97
28.28
1.90E + 05
0.83
11.02
7.56E + 08
20
TBP
0.99
37.58
2.00E + 04
TBP + FeO
0.99
28.75
2.63E + 05
0.49
7.29
1.40E + 09
Avarami Erofeev
A3
5
TBP
0.91
21.16
2.77E + 05
TBP + FeO
0.83
12.85
3.31E + 06
0.56
525.86
2.03E + 42
10
TBP
0.98
24.29
2.80E + 05
TBP + FeO
0.95
16.67
2.64E + 06
0.50
5.91
7.62E + 08
15
TBP
0.99
22.44
8.29E + 05
TBP + FeO
0.96
16.50
4.44E + 06
0.55
3.61
1.11E + 09
20
TBP
0.98
22.69
1.08E + 06
TBP + FeO
0.99
16.81
6.05E + 06
0.05
1.13
7.54E + 08
3.3 Thermodynamic analysis
The thermodynamic parameters were calculated from kinetic data obtained from the model-free approach. The values obtained for the parameters
,
,
, were identical in the Starink and KAS models, but a slight difference was noticed in the FWO model, which could be due to the different assumptions made for each model in the approximation of temperature integrals. The
value indicates the amount of energy required for converting the TBP into value-added products in the form of condensate and volatiles during the degradation. It represents the energy difference between reactant consumption and the formation of activated complexes.
values for the proposed three models in all the techniques were found to be positive, resembling the endothermic reactions. This indicate that during all the reactions, the samples are undergoing the breakage of lower energy bonds resulting in the formation of higher energy bonds. The highest and lowest values for the
were found to be in the combustion and catalytic combustion with a value of 100.86 and 75.77 kJ/mol as indicated in Table 6 and enlisted in Table S.3, Table S.4, Table S.5 of Supplementary Material. The pyrolysis and catalytic pyrolysis values for
were lying between the other two processes. This indicated the least energy was required for the bond dissociation of TBP organic compound in the presence of Fe2O3 and oxygen atmosphere. Further, another estimation was done using the
value to determine the favourability of forming products by calculating the difference between
and Ea. The feasibility of the reaction was preferred if the difference value was lower (Moine et al., 2016; Müsellim et al., 2018).
Coversion
(%)Straink Model
KAS Model
FWO model
ΔH
(kJ/mol)ΔG
(kJ/mol)ΔS
(kJ/mol)ΔH
(kJ/mol)ΔG
(kJ/mol)ΔS
(kJ/mol)ΔH
(kJ/mol)ΔG
(kJ/mol)ΔS
(kJ/mol)
0.05
100.87
100.29
0.00
100.69
100.30
0.00
101.68
83.14
0.04
0.1
87.48
100.80
−0.03
87.29
100.81
−0.03
89.11
83.62
0.01
0.15
81.71
101.05
−0.04
81.51
101.05
−0.04
83.72
83.84
0.00
0.2
78.40
101.19
−0.05
78.20
101.20
−0.05
80.67
83.97
−0.01
0.25
75.84
101.31
−0.06
75.63
101.32
−0.06
78.30
84.08
−0.01
0.3
73.91
101.40
−0.06
73.70
101.41
−0.06
76.52
84.16
−0.02
0.35
72.76
101.46
−0.06
72.54
101.47
−0.06
75.47
84.21
−0.02
0.4
71.45
101.52
−0.07
71.23
101.53
−0.07
74.27
84.27
−0.02
0.45
71.08
101.54
−0.07
70.86
101.55
−0.07
73.96
84.28
−0.02
0.5
70.24
101.58
−0.07
70.01
101.60
−0.07
73.19
84.32
−0.02
0.55
69.40
101.63
−0.07
69.18
101.64
−0.07
72.44
84.35
−0.03
0.6
68.71
101.66
−0.07
68.48
101.67
−0.07
71.81
84.38
−0.03
0.65
68.02
101.70
−0.08
67.79
101.71
−0.08
71.18
84.42
−0.03
0.7
67.22
101.74
−0.08
66.98
101.75
−0.08
70.44
84.45
−0.03
0.75
66.30
101.79
−0.08
66.07
101.80
−0.08
69.60
84.50
−0.03
0.8
65.55
101.83
−0.08
65.31
101.84
−0.08
68.91
84.53
−0.03
0.85
64.72
101.87
−0.08
64.48
101.89
−0.08
68.15
84.57
−0.04
0.9
63.90
101.92
−0.09
63.66
101.93
−0.09
67.40
84.61
−0.04
0.95
62.16
102.02
−0.09
61.91
102.03
−0.09
65.77
84.70
−0.04
The obtained values for the combustion and pyrolysis in the presence of Fe2O3 were 4.4 and 4.8 kJ/mol, indicating a thermodynamic driving force of the catalytic combustion reaction. calculates the increment of the total energy of the system, which was also found to be hold a lower value in catalytic combustion compared to all other processes. signifies the degree of randomness of the product formed. If the value is negative, it resembles that the disorderness of the products is lower than that of the reactants, and it favors the state of thermodynamic equilibrium (Stančin et al., 2021). On the other side, if the value is positive, it points toward high product reactivity. The values were initiated from −0.05 kJ/mol in catalytic combustion, whereas in all other processes, the value started from −0.02 kJ/mol, which supports the catalytic combustion reaction. For all models in different techniques, the has a positive value and with a negative value, which refers to the non-spontaneous process (Naqvi et al., 2018).
3.4 Mechanistic pathway
Via surface characterization techniques (Fig. S.3, SM), our previous investigation established organic bromine transfer from the TBP ring into the hematite surface (Mousa et al., 2022). The portrayed reaction mainly ensues via direct abstraction of the aromatic bromine by the hematite (Altarawneh et al., 2016b). However, dissociative addition through the fission of the hydroxyl’s OH bond also takes place. Fig. 3 portrays steps that characterize ring-opening pathways that proceed following the scission of the O—H bond over the Lewis acid-base sites in hematite (M1 → M2). Ring-opening along the step M2 → M3 requires a sizable activation enthalpy of 200 kJ/mol whereas the reaction is noticeably endothermic at 193 kJ/mol. Calculated Mayer’s bond orders characterize the bonding nature in the produced C6 adduct. A Mayer’s bond order at 0.31 infers a genuine bonding between the fragment and the cluster. As shown in the structure of M3, an ortho bromine atom is expelled upon ring opening. The following steps feature the departure of C2BrH molecules without encountering activation energies via endothermic reactions. Values of bond orders remain largely unchanged with the shortening of the hydrocarbon chain in the M5 intermediate. The formation of carbon monoxide moieties in the final step is in accord with the evolution of CO and the observed reduction cycle Fe2O3 → Fe3O4 → FeO → Fe (Oleszek et al., 2013).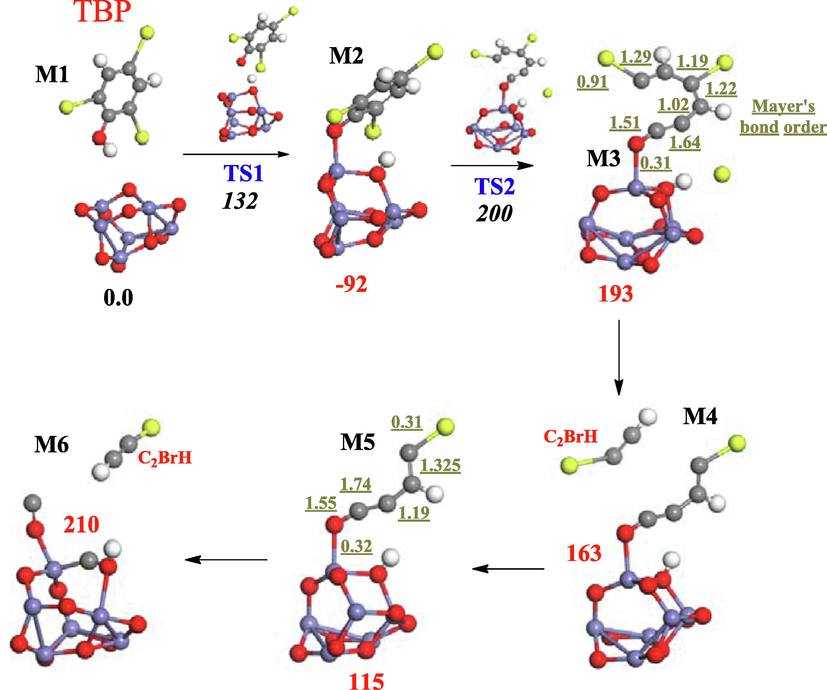
Decomposition of TBP over hematite. Values (in kJ/mol) in bold and italic fonts represent reaction and activation energies respectively. Red, white, grey, blue, and yellow sphere denote oxygen, hydrogen, carbon, iron, and bromine atoms respectively.
In a recent study, we reported products that arise from co-pyrolysis of hematite with TBP in the temperature window from 150 to 500 °C using GCMS (Mousa et al., 2022). We have also investigated interaction between an evaporated stream of TBP with hematite (Ali et al., 2022c). Alkylated benzenes were found to dominate the gas fraction. A wide product distribution was observed in the condensable products (Mousa et al., 2022). The major constituents in the gas phase were toluene with a relative area of 50.88 % followed by p-xylene (22 %), 3-methyl butanone (16.64 %), ethylbenzene (4.99 %), and mesitylene (3.78 %) in our study (Mousa et al., 2022). Hematite proved to be a good debromination agent during the thermal degradation of TBP releasing zero brominated compounds in the gaseous phase (Ali et al., 2022c; Ma et al., 2018). Mechanistically, Fe3+ cations fixed evolved HBr gases through a dissociative adsorption reaction forming FeBr2. In addition to these gases, the presence of Fe particles also enhanced the production of H2, CO, and CH4 (Ma and Kamo, 2019).
4 Conclusion
TGA and DTG curves were attained for the degradation of TBP under different conversion processes. The degradation stage changed from one to two when TBP is mixed with hematite. The initial and final decomposition temperatures were almost identical for all the described techniques, around 95 °C and 200 °C. From the DTG curve, the Td shifted to a slightly higher temperature in combustion compared to the pyrolysis process. For the four techniques of thermochemical process applied to the TBP, the model-free kinetics such as Starink, FWO, and KAS models were used to determine the kinetic parameters that can contribute to designing and implementing the reactor on a pilot scale. Plausible reaction mechanisms were illustrated through deploying the Coats-Redfern method. Fifteen reaction models were explored to determine the best-fitting mechanism by comparing Ea values obtained from model-free methods. The pure TBP sample exhibited 1st and half order reaction, spherical and cylindrical contraction, and Avarami Erofeev A1. On the contrary, co-pyrolysis and co-oxidation of TBP and Fe2O3 follow rather complex nature of reaction mechanism. The R2 values for all the models were around 0.95, which indicates a satisfactory prediction of the deployed model to account for mass loss curves. The lowest Ea and corresponding A values were identified for the corresponding combustion reactions of the mixtures. From a thermodynamic outlook, the difference between the H and Ea remains in the range 4–6 kJ/mol. All the reactions were non-spontaneous, confirmed by the negative values S of and positive values of ΔG. Future mechanistic models could focus on subsequent reactions between the pyrolytic fragments and the hematite active sites.
Acknowledgments
This study has been supported by the 2019 Abu Dhabi Award for Research Excellence (AARE) – (by ASPIRE, part of the Advanced Technology Research Council (ATRC, Abu Dhabi, United Arab Emirates), grant number: 21N225-AARE2019 – ADEK -103). DFT calculations were carried out at the HCP cluster of the United Arab Emirates University (UAEU).
Declaration of Competing Interest
The authors declare that they have no known competing financial interests or personal relationships that could have appeared to influence the work reported in this paper.
References
- Recycling of zincite (ZnO) via uptake of hydrogen halides. PCCP. 2018;20:1221-1230.
- [CrossRef] [Google Scholar]
- Method of determining activation deterioration constant of electrical insulating materials. Res. Rep. Chiba Inst. Technol. (Sci. Technol.). 1971;16:22-31.
- [Google Scholar]
- Thermodynamic analysis on the oxidative pyrolytic treatment of electric arc furnace Dust–TBBA blends. Oxid. Met.. 2019;91:561-588.
- [CrossRef] [Google Scholar]
- Al-Harahsheh, M., Al-Nu’Airat, J., Al-Otoom, A., Al-Hammouri, I., Al-Jabali, H., Al-Zoubi, M., Abu Al’Asal, S., 2019. Treatments of electric arc furnace dust and halogenated plastic wastes: A review. J. Environ. Chem. Eng. 7, 102856. https://doi.org/10.1016/J.JECE.2018.102856.
- Ali, L., A.Mousa, H., Al-Harahsheh, M., Al-Zuhair, S., Abu-Jdayil, B., Al-Marzouqi, M., Altarawneh, M., 2022a. Removal of Bromine from the non-metallic fraction in printed circuit board via its Co-pyrolysis with alumina. Waste Manag. 137, 283–293. https://doi.org/10.1016/J.WASMAN.2021.11.025.
- Catalytic upgrading of the polymeric constituents in Covid-19 masks. J. Environ. Chem. Eng.. 2022;10:106978
- [CrossRef] [Google Scholar]
- Oxidative and pyrolytic decomposition of an evaporated stream of 2,4,6-tribromophenol over hematite: A prevailing scenario during thermal recycling of e-waste. Waste Manag.. 2022;154:283-292.
- [CrossRef] [Google Scholar]
- Separation of bromine and hydrocarbons from polymeric constituents in e-waste through thermal treatment with calcium hydroxide. Sep. Purif. Technol.. 2023;307:122836
- [CrossRef] [Google Scholar]
- Temperature-dependent profiles of dioxin-like toxicants from combustion of brominated flame retardants. J. Hazard. Mater.. 2022;422:126879
- [CrossRef] [Google Scholar]
- Thermal recycling of brominated flame retardants with Fe2O3. Chem. A Eur. J.. 2016;120:6039-6047.
- [CrossRef] [Google Scholar]
- Thermal decomposition of brominated flame retardants (BFRs): Products and mechanisms. Prog. Energy Combust. Sci.. 2019;70:212-259.
- [CrossRef] [Google Scholar]
- A comprehensive review on pyrolysis of E-waste and its sustainability. J. Clean. Prod.. 2022;333:130191
- [CrossRef] [Google Scholar]
- Synthesis of magnetic tungsten disulfide/carbon nanotubes nanocomposite (WS2/Fe3O4/CNTs-NC) for highly efficient ultrasound-assisted rapid removal of amaranth and brilliant blue FCF hazardous dyes. J. Hazard. Mater.. 2021;420:126644
- [CrossRef] [Google Scholar]
- Investigation on flame retardancy, combustion and pyrolysis behavior of flame retarded unsaturated polyester resin with a star-shaped phosphorus-containing compound. J. Anal. Appl. Pyrol.. 2014;105:317-326.
- [CrossRef] [Google Scholar]
- The Mayer bond order as a tool in inorganic chemistry. J. Chem. Soc. Dalt. Trans.. 2001;2095–2108
- [CrossRef] [Google Scholar]
- Improving bromine fixation in co-pyrolysis of non-metallic fractions of waste printed circuit boards with Bayer red mud. Sci. Total Environ.. 2018;639:1553-1559.
- [CrossRef] [Google Scholar]
- From molecules to solids with the DMol3 approach. J. Chem. Phys.. 2000;113:7756.
- [CrossRef] [Google Scholar]
- Dhyani, V., Bhaskar, T., 2018. Kinetic analysis of biomass pyrolysis, Waste Biorefinery: Potential and Perspectives. Elsevier B.V. https://doi.org/10.1016/B978-0-444-63992-9.00002-1.
- Estimating isothermal life from thermogravimetric data. J. Appl. Polym. Sci.. 1962;6:639-642.
- [CrossRef] [Google Scholar]
- A quick, direct method for the determination of activation energy from thermogravimetric data. J. Polym. Sci., Part B: Polym. Lett.. 1966;4:323-328.
- [CrossRef] [Google Scholar]
- A generalized synchronous transit method for transition state location. In: Computational Materials Science. Elsevier; 2003. p. :250-258.
- [CrossRef] [Google Scholar]
- Studies on bromination and evaporation of zinc oxide during thermal treatment with TBBPA. Environ. Sci. Tech.. 2009;43:1205-1210.
- [CrossRef] [Google Scholar]
- Hydrothermal-induced ɑ-Fe2O3/graphene nanocomposite with ultrahigh capacitance for stabilized and enhanced supercapacitor electrodes. Ionics (Kiel).. 2019;25:3309-3319.
- [CrossRef] [Google Scholar]
- Pyrolysis kinetics and thermodynamic parameters of castor (Ricinus communis) residue using thermogravimetric analysis. Bioresour. Technol.. 2018;250:422-428.
- [CrossRef] [Google Scholar]
- Occupational exposures to particulate matter and PM2.5-associated polycyclic aromatic hydrocarbons at the Agbogbloshie waste recycling site in Ghana. Environ. Int.. 2022;158:106971
- [CrossRef] [Google Scholar]
- Preparation of biochar from food waste digestate: Pyrolysis behavior and product properties. Bioresour. Technol.. 2020;302:122841
- [CrossRef] [Google Scholar]
- Catalytic effect and mechanism of in-situ metals on pyrolysis of FR4 printed circuit boards: Insights from kinetics and products. Chemosphere. 2021;280:130804
- [CrossRef] [Google Scholar]
- Enhanced debromination by Fe particles during the catalytic pyrolysis of non-metallic fractions of printed circuit boards over ZSM-5 and Ni/SiO2-Al2O3 catalyst. J. Anal. Appl. Pyrol.. 2019;138:170-177.
- [CrossRef] [Google Scholar]
- Influence of Fe based ZSM-5 catalysts on the vapor intermediates from the pyrolysis of brominated acrylonitrile-butadiene-styrene copolymer (Br-ABS) Fuel. 2018;230:390-396.
- [CrossRef] [Google Scholar]
- Moine, E. Cheikh, Groune, K., El Hamidi, A., Khachani, M., Halim, M., Arsalane, S., 2016. Multistep process kinetics of the non-isothermal pyrolysis of Moroccan Rif oil shale. Energy 115, 931–941. https://doi.org/10.1016/J.ENERGY.2016.09.033.
- Exploring the potential of hematite as a debromination agent for 2,4,6-tribromophenol. Chem. Eng. J. Adv.. 2022;11:100334
- [CrossRef] [Google Scholar]
- Thermokinetic and TG/DSC-FTIR study of pea waste biomass pyrolysis. Appl. Therm. Eng.. 2018;137:54-61.
- [CrossRef] [Google Scholar]
- Pyrolysis of high-ash sewage sludge: Thermo-kinetic study using TGA and artificial neural networks. Fuel. 2018;233:529-538.
- [CrossRef] [Google Scholar]
- Study of the reactions between tetrabromobisphenol A and PbO and Fe2O3 in inert and oxidizing atmospheres by various thermal methods. Thermochim. Acta. 2013;566:218-225.
- [CrossRef] [Google Scholar]
- A new method of analyzing thermogravimetric data. Bull. Chem. Soc. Jpn. 1965;38:1881-1886.
- [CrossRef] [Google Scholar]
- Comparison shopping for a gradient-corrected density functional. Int. J. Quantum Chem.. 1996;57:309-319.
- [Google Scholar]
- Studies on bromination and evaporation of antimony oxide during thermal treatment of tetrabromobisphenol A (TBBPA) J. Anal. Appl. Pyrol.. 2010;88:14-21.
- [CrossRef] [Google Scholar]
- Analyzing the pyrolysis kinetics of several microalgae species by various differential and integral isoconversional kinetic methods and the Distributed Activation Energy Model. Algal Res.. 2018;32:11-29.
- [CrossRef] [Google Scholar]
- Comparison of wood pyrolysis kinetic data derived from thermogravimetric experiments by model-fitting and model-free methods. Energy Convers. Manag.. 2020;212:112818
- [CrossRef] [Google Scholar]
- Thermogravimetric and kinetic analysis of biomass and polyurethane foam mixtures Co-Pyrolysis. Energy. 2021;237:121592
- [CrossRef] [Google Scholar]
- The determination of activation energy from linear heating rate experiments: a comparison of the accuracy of isoconversion methods. Thermochim. Acta. 2003;404:163-176.
- [CrossRef] [Google Scholar]
- Thermal degradation study of tetrabromobisphenol A under the presence metal oxide: Comparison of bromine fixation ability. J. Anal. Appl. Pyrol.. 2011;91:303-309.
- [CrossRef] [Google Scholar]
- Bromine fixation by metal oxide in pyrolysis of printed circuit board containing brominated flame retardant. J. Anal. Appl. Pyrol.. 2013;103:216-221.
- [CrossRef] [Google Scholar]
- Tkatchenko, A., Letters, M.S.-P. Review, 2009, undefined, 2008. Accurate molecular van der Waals interactions from ground-state electron density and free-atom reference data. APS 102. https://doi.org/10.1103/PhysRevLett.102.073005.
- Non-isothermal degradation kinetics of filled with rise husk ash polypropene composites. Express Polym. Lett.. 2008;2:133-146.
- [CrossRef] [Google Scholar]
- Computational aspects of kinetic analysis.: Part C. The ICTAC Kinetics Project — the light at the end of the tunnel? Thermochim. Acta. 2000;355:155-163.
- [CrossRef] [Google Scholar]
- Kinetic study of synthesising 2,4,6-tribromophenyl benzyl ether by phase transfer catalysis. Dev. Chem. Eng. Miner. Process.. 1993;1:225-237.
- [CrossRef] [Google Scholar]
- Investigation of thermodynamic parameters in the pyrolysis conversion of biomass and manure to biochars using thermogravimetric analysis. Bioresour. Technol.. 2013;146:485-493.
- [CrossRef] [Google Scholar]
- Investigation on n-pentylbenzene combustion at various pressures: Insight into effects of side-chain length on alkylbenzene combustion. Combust. Flame. 2022;238:111976
- [CrossRef] [Google Scholar]
- E-waste dismantling-related occupational and routine exposure to melamine and its derivatives: Estimating exposure via dust ingestion and hand-to-mouth contact. Environ. Int.. 2022;165:107299
- [CrossRef] [Google Scholar]
Appendix A
Supplementary material
Supplementary data to this article can be found online at https://doi.org/10.1016/j.arabjc.2023.104540.
Appendix A
Supplementary material
The following are the Supplementary data to this article:Supplementary Data 1
Supplementary Data 1


