

Translate this page into:
Cyclometalated complexes containing ferrocenyl Schiff base: Preparation, characterization, DFT calculations, application in cancer and biological researches and MOE studies
⁎Corresponding author. reemgd90@yahoo.com (Reem G. Deghadi) gamalreem56@gmail.com (Reem G. Deghadi)
-
Received: ,
Accepted: ,
This article was originally published by Elsevier and was migrated to Scientific Scholar after the change of Publisher.
Peer review under responsibility of King Saud University.
Abstract
A series of transition metal (II/III) complexes containing organometallic Schiff base ligand (H2L) had been synthesized and characterized by using elemental analysis (C, H, N, M), molar conductivity, IR, UV–Vis, 1H NMR and mass spectral analysis. Also, their TG and DTG behaviors were investigated. The ligand was prepared by condensation of 4-aminosalicylic acid with 2-acetylferrocene in 1:1 M ratio. The data of elemental analysis indicated that the prepared complexes were synthesized also in a 1:1 M ratio. The ligand behaved as neutral bidentate ligand that coordinated to metal ions through protonated O-phenolic and protonated carboxylic-OH groups. All complexes had octahedral structure. DFT calculations for H2L ligand were determined with some parameters such as HOMO-LUMO energy gab, electronegativity and chemical hardness–softness. Antimicrobial activity of both H2L Schiff base ligand and its metal complexes was tested against different strains of bacteria and fungi species. Furthermore, all compounds had been screened for their anticancer activities against breast cancer (MCF-7) cell line. [Cu(H2L)(H2O)2Cl2]·2H2O complex had the lowest IC50 value = 47.3 µg/mL. For determining the more effective and probable binding mode between the H2L ligand, Co(II) and Zn(II) complexes with different active sites of 4K3V, 2YLB and 3DJD receptors, so molecular docking studies were investigated.
Keywords
Schiff base
DFT calculations
Antimicrobial activities
Anticancer activities
Docking

- IR
-
Infrared spectroscopy
- UV–Vis
-
Ultraviolet–visible spectroscopy
- 1H NMR
-
Proton nuclear magnetic resonance
- DFT
-
Density function theory
- HOMO
-
Highest occupied molecular orbital
- LUMO
-
Lowest unoccupied molecular orbital
- MCF-7
-
Michigan cancer foundation-7
- IC50
-
Half-maximal inhibitory concentration
- O.D.
-
Optical density
- MOE
-
Molecular operating environment
- MS
-
Mass Spectrometry
- MEP
-
Molecular electrostatic potential
- TG
-
Thermo gravimetric analysis
- DTG
-
Differential thermogravimetric analysis
Abbreviations
1 Introduction
Organometallic chemistry is a branch of science that deals with chemical compounds which containing at least one bond between a metal and a carbon atom of an organic compound. The prepared organometallic compounds have wide applications in different fields such as: homogeneous catalysis, stoichiometric processes and medicinal biochemistry (Mudi et al., 2015). Their applications in medicine and biology become very substantial area to be studied. So, broad range of antitumor species has been developed which mainly based on transition-metal arene, cyclopentadienyl and related structures (Bruijnincx and Sadler, 2008). They have other applications such as in sensors and monitoring protein-protein interactions. Also, they can be used as radioisotopes that may be effective in radioimaging and therapy (Scheck and Schepartz, 2011; Bartholoma et al., 2009; Alberto, 2010) (see Scheme 1).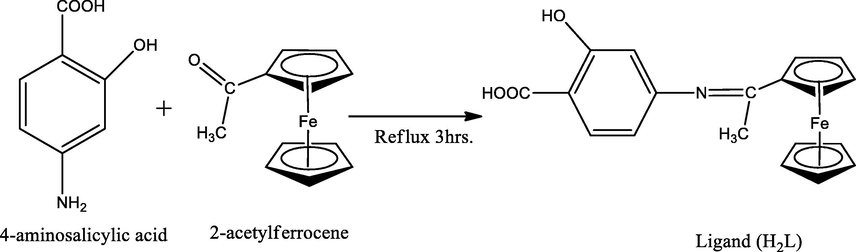
Preparation of organometallic Schiff base ligand (H2L).
Ferrocene behaved as one of the most important example of organometallic compounds which discovered in the beginning of 1950s. This led to various advances in organometallic chemistry and other fields (Kealy and Pauson, 1951). It gave good cytotoxicities in vitro and also inhibited the progress of tumors in vivo (Kopf-Maier et al., 1984; Popova et al., 1993). Some researchers showed that addition of ferrocenyl unit to biologically active molecules may lead to formation of complexes with tumor specificity and high potency. The results of increasing the activity may be due to the combined action that occurred of the organic molecule with Fenton chemistry of the Fe center (Hillard, 2006; Auzias, 2009). It also used as a catalyst in industry, contrast agents in magnetic resonance imaging (MRI), antimalaria drugs and anticancer agents in medicine (Salmain et al., 2008; Fouda et al., 2007; Samouei et al., 2011). Nowadays, the scientists try to prepared more derivatives of ferrocene complexes hoping of exploring more materials used in advanced effective applications.
In the light of these facts, and the higher activity of ferrocenyl Schiff base ligand against different bacterial and fungal species, we interested in synthesis of an organometallic Schiff base ligand (H2L) by condensation of 4-aminosalicylic acid and 2-acetylferrocene was described. Then their Cr(III), Mn(II), Fe(III), Co(II), Ni(II), Cu(II), Zn(II) and Cd(II) complexes were synthesized. All compounds were characterized using different spectroscopic techniques. Also, their antimicrobial and anticancer activities were investigated. DFT calculations were determined and then the data of the experimental IR and UV–Vis results was compared with the theoretical one. Molecular docking was used to predict the probable binding mode between the Schiff base, Co(II) and Zn(II) complexes with the active sites of three receptors which were crystal structure of Staphylococcus aureus (PDB ID: 4K3V), crystal structure of Salmonella typhimurium (PDB ID: 2YLB) and crystal structure of deglycating enzyme fructosamine oxidase from Aspergillus fumigatus (PDB ID: 3DJD).
2 Experimental
2.1 Materials and reagents
All chemicals used were of the analytical reagent grade (AR) and of highest purity. The chemicals used included 2-acetylferrocene which was supplied from Sigma-Aldrich, 4-aminosalicylic acid (Sigma-Aldrich), CrCl3·6H2O, MnCl2·2H2O and FeCl3·6H2O (Sigma-Aldrich), NiCl2·6H2O, CoCl2·6H2O, CuCl2·2H2O and ZnCl2 (BDH) and CdCl2 (Merck). Organic solvents used were ethyl alcohol (95%), methyl alcohol and N,N-dimethylformamide (DMF). Deionized water was usually used in all preparations.
2.2 Solutions
Stock solutions of the ferrocene Schiff base ligand and its metal complexes of 1 × 10⁻³ Mol L−1 were prepared by dissolving an accurately weighed amount in N,N-dimethylformamide for H2L ligand, Fe(III), Cu(II) and Cd(II) complexes while in 1:1 mixture of DMF:DMSO for Cr(III), Mn(II), Co(II), Ni(II) and Zn(II) complexes. The conductivity then measured for the 1 × 10⁻³ Mol L−1 solution of metal complexes. Dilute solutions of the Schiff base ligand and its metal complexes (1 × 10⁻⁴ Mol L−1) were prepared by accurate dilution from the previous prepared stock solutions for measuring their UV–Vis spectra.
2.3 Solution of anticancer study
A fresh stock solution (1 × 10⁻³ Mol L−1) of Schiff base ligand (0.12 × 10⁻² g L−1) was prepared in the appropriate volume of DMF (90%). DMSO was used in cryopreservation of cells. RPMI-1640 medium was used. The medium was used for culturing and maintenance of the human tumor cell line. The medium was supplied in a powder form. It was prepared as follows: 10.40 g of medium was weighed, mixed with 2 g of sodium bicarbonate, completed to 1 L with distilled water and shaken carefully until complete dissolution. The medium was then sterilized by filtration in a Millipore bacterial filter (0.22 mL). The prepared medium was kept in a refrigerator (4 °C) and checked at regular intervals for contamination. Before use, the medium was warmed at 37 °C in a water bath and supplemented with penicillin–streptomycin and FBS. Sodium bicarbonate was used for the preparation of RPMI-1640 medium. Isotonic trypan blue solution (0.05%) was prepared in normal saline and was used for viability counting. FBS (10%, heat inactivated at 56 °C for 30 min), 100 units/mL penicillin and 2 mg/mL streptomycin were used for the supplementation of RPMI-1640 medium prior to use. Trypsin (0.25 × 10⁻¹% w/v) was used for the harvesting of cells. Acetic acid (1% v/v) was used for dissolving unbound SRB dye. SRB (0.40%) dissolved in 1% acetic acid was used as a protein dye. A stock solution of trichloroacetic acid (50%) was prepared and stored. An amount of 50 μL of the stock was added to 200 μL of RPMI-1640 medium per well to yield a final concentration of 10% used for protein precipitation. Isopropanol (100%) and ethanol (70%) were used. Tris base (10 mM; pH = 10.50) was used for SRB dye solubilization. Tris base (121.10 g) was dissolved in 1000 mL of distilled water and the pH was adjusted using hydrochloric acid (2 Mol L−1).
2.4 Instrumentation
Microanalyses of carbon, hydrogen and nitrogen were carried out at the Microanalytical Center, Cairo University, Egypt, using a CHNS-932 (LECO) Vario elemental analyzer. Analyses of the metals were conducted by dissolving the solid complexes in concentrated HNO3, and dissolving the residue in deionized water. The metal content was carried out using inductively coupled plasma atomic absorption spectrometry (ICP-AES), Egyptian Petroleum Research Institute. Fourier transform infrared (FT-IR) spectra were recorded with a PerkinElmer 1650 spectrometer (400–4000 cm−1) as KBr pellets. 1H NMR spectra, as solutions in DMSO-d6, were recorded with a 300 MHz Varian-Oxford Mercury at room temperature using tetra-methylsilane as an internal standard. Mass spectra were recorded using the electron ionization technique at 70 eV with an MS-5988 GS-MS Hewlett-Packard instrument at the Microanalytical Center, National Center for Research, Egypt. UV–Visible spectra were obtained with a Shimadzu UVmini-1240 spectrophotometer. Molar conductivities of 1 × 10⁻³ Mol L−1 solutions of the solid complexes were measured using a Jenway 4010 conductivity meter. Thermogravimetric (TG) and differential thermogravimetric (DTG) analyses of the solid complexes were carried out from room temperature to 1000 °C using a Shimadzu TG-50H thermal analyzer. Antimicrobial measurements were carried out at the Microanalytical Center, Cairo University, Egypt. Anticancer activity experiments were performed at the National Cancer Institute, Cancer Biology Department, Pharmacology Department, Cairo University. The optical density (OD) of each well was measured spectrophotometrically at 564 nm with an ELIZA microplate reader (Meter tech. R960, USA).
2.5 Synthesis of organometallic Schiff base ligand (H2L)
The organometallic Schiff base ligand (H2L) was prepared by refluxing a hot mixture of 4-aminosalicylic acid (0.031 mol, 4.74 g) dissolved in methanol and 2-acetylferrocene (0.031 mol, 7 g) dissolved also in methanol. The resulting mixture was stirred under reflux for about 3 h at 100–150 °C, during which a dark brown solid compound was separated. It was filtered, recrystallized, washed with diethylether and dried in vacuum.
(2-(1-((4-carboxy-3-hydroxyphenyl)imino)ethyl)cyclopenta-2,4-dien-1-yl) (cyclopenta-2,4-dien-1-yl)iron (H2L). Yield 95%; m.p. 247 °C; dark brown solid. Anal. Calc. for C19H17NO3Fe (%): C, 62.81; H, 4.68; N, 3.86; Fe, 15.43. Found (%): C, 62.32; H, 4.78; N, 3.35; Fe, 15.01. FT-IR (ν, cm−1): hydroxyl (OH) 3406br, carbonyl (C⚌O) 1733w, azomethine (C⚌N) 1650sh, ν(COO)asy 1451 m, ν(COO)sym 1371 s. 1H NMR (300 MHz, DMSO-d6, δ, ppm): 4.22–4.77 (m, 9H, ferrocene ring), 6.00–7.13 (m, 3H, benzene), 10.0 (s, 1H, carboxylic-OH), 8.75 (s, 1H, phenolic-OH), 1.56 (s, 3H, methyl group of ferrocene). UV–Vis (λmax, nm): 271 (π–π* of ferrocene) and 314 (n–π* of COOH, C⚌N and OH groups).
2.6 Synthesis of metal complexes
Cr(III), Mn(II), Fe(III), Co(II), Ni(II), Cu(II), Zn(II) and Cd(II) complexes were prepared by a reaction of 1:1 M mixture of hot ethanolic solution (60 °C) of the metal chloride (1.10 × 10⁻³ mol) and the DMF solution of Schiff base ligand (H2L) (0.4 g, 1.10 × 10⁻³ mol). The resulting mixture was stirred under reflux for 1 h, whereupon the complexes precipitated. They were collected by filtration and purified by washing several times with diethyl ether. The solid complexes then dried in desiccator over anhydrous calcium chloride.
2.6.1 [Cr(H2L)(H2O)2Cl2]Cl·5H2O
Yield 79%; m.p. > 300 °C; dark brown solid. Anal. Calc. for C19H31Cl3FeCrNO10 (%): C, 35.21; H, 4.79; N, 2.16; Fe, 8.65; Cr, 8.03. Found (%): C, 34.95; H, 4.15; N, 2.09; Fe, 8.33; Cr, 7.89. Λm (Ω−1mol−1cm2) = 65; FT-IR (ν, cm−1): hydroxyl (OH) 3404br, carbonyl (C⚌O) 1780w, azomethine (C⚌N) 1652sh, ν(COO)asy 1429 s, ν(COO)sym 1367 m, H2O stretching of coordinated water 847 s and 800w, (M—O) 537w. UV–Vis (λmax, nm): 267 (π–π* of ferrocene) and 323 (n–π* of COOH, C⚌N and OH groups).
2.6.2 [Mn(H2L)(H2O)3Cl]Cl·5H2O
Yield 85%; m.p. > 300 °C; dark brown solid. Anal. Calc. for C19H33Cl2FeMnNO11 (%): C, 36.02; H, 5.21; N, 2.21; Fe, 8.85; Mn, 8.69. Found (%): C, 35.97; H, 5.14; N, 2.07; Fe, 8.33; Mn, 8.54. Λm (Ω−1 mol−1 cm2) = 58; FT-IR (ν, cm−1): hydroxyl (OH) 3391br, carbonyl (C⚌O) 1770w, azomethine (C⚌N) 1652sh, ν(COO)asy 1440 s, ν(COO)sym 1384 m, H2O stretching of coordinated water 900w and 821w, (M—O) 561w. UV–Vis (λmax, nm): 268 (π–π*).
2.6.3 [Fe(H2L)(H2O)2Cl2]Cl·2H2O
Yield 94%; m.p. > 300 °C; dark brown solid. Anal. Calc. for C19H25Cl3Fe2NO7 (%): C, 38.16; H, 4.18; N, 2.34; Fe, 18.75. Found (%): C, 37.99; H, 4.06; N, 2.19; Fe, 18.44. Λm (Ω−1mol−1cm2) = 61; FT-IR (ν, cm−1): hydroxyl (OH) 3430br, carbonyl (C⚌O) 1773w, azomethine (C⚌N) 1648sh, ν(COO)asy 1428 m, ν(COO)sym 1369 m, H2O stretching of coordinated water 853 s and 810w, (M—O) 541w. UV–Vis (λmax, nm): 265 (π–π* of ferrocene) and 307 (n–π* of COOH, C⚌N and OH groups).
2.6.4 [Co(H2L)(H2O)2Cl2].3H2O
Yield 88%; m.p. > 300 °C; dark brown solid. Anal. Calc. for C19H27Cl2FeCoNO8 (%): C, 39.11; H, 4.63; N, 2.40; Fe, 9.61; Co, 10.12. Found (%): C, 39.01; H, 4.25; N, 2.22; Fe, 9.26; Co, 9.96. Λm (Ω−1mol−1cm2) = 39; FT-IR (ν, cm−1): hydroxyl (OH) 3382br, carbonyl (C⚌O) disappear, azomethine (C⚌N) 1651sh, ν(COO)asy 1435 m, ν(COO)sym 1382 m, H2O stretching of coordinated water 824 s and 800w, (M—O) 560w. UV–Vis (λmax, nm): 267 (π–π*).
2.6.5 [Ni(H2L)(H2O)3Cl]Cl·2H2O
Yield 86%; m.p. > 300 °C; dark brown solid. Anal. Calc. for C19H27Cl2FeNiNO8 (%): C, 39.11; H, 4.63; N, 2.40; Fe, 9.61; Ni, 10.12. Found (%): C, 39.03; H, 4.46; N, 2.13; Fe, 9.32; Ni, 9.95. Λm (Ω−1 mol−1 cm2) = 60; FT-IR (ν, cm−1): hydroxyl (OH) 3412br, carbonyl (C⚌O) 1760w, azomethine (C⚌N) 1652sh, ν(COO)asy 1429 m, ν(COO)sym 1374 m, H2O stretching of coordinated water 860 s and 800w, (M—O) 535w. UV–Vis (λmax, nm): 267 (π–π* of ferrocene) and 326 (n–π* of COOH, C⚌N and OH groups).
2.6.6 [Cu(H2L)(H2O)2Cl2].2H2O
Yield 90%; m.p. > 300 °C; grey solid. Anal. Calc. for C19H25Cl2FeCuNO7 (%): C, 40.04; H, 4.39; N, 2.46; Fe, 9.83; Cu, 11.15. Found (%): C, 39.78; H, 4.21; N, 2.34; Fe, 9.09; Cu, 11.02. Λm (Ω−1 mol−1 cm2) = 3; FT-IR (ν, cm−1): hydroxyl (OH) 3431br, carbonyl (C⚌O) disappear, azomethine (C⚌N) 1651sh, ν(COO)asy 1430 m, ν(COO)sym 1310 s, H2O stretching of coordinated water 920w and 830w, (M—O) 520 s. UV–Vis (λmax, nm): 277 (π–π*).
2.6.7 [Zn(H2L)(H2O)2Cl2].H2O
Yield 78%; m.p. > 300 °C; dark brown solid. Anal. Calc. for C19H23Cl2FeZnNO6 (%): C, 41.23; H, 4.16; N, 2.53; Fe, 10.13; Zn, 11.75. Found (%): C, 41.11; H, 3.99; N, 2.14; Fe, 10.04; Zn, 11.23. Λm (Ω−1 mol−1 cm2) = 13; FT-IR (ν, cm−1): hydroxyl (OH) 3442br, carbonyl (C⚌O) disappear, azomethine (C⚌N) 1648sh, ν(COO)asy 1436 m, ν(COO)sym 1380w, H2O stretching of coordinated water 920w and 850w, (M—O) 550w. UV–Vis (λmax, nm): 269 (π–π*).
2.6.8 [Cd(H2L)(H2O)2Cl2].3H2O
Yield 75%; m.p. > 300 °C; dark brown solid. Anal. Calc. for C19H27Cl2FeCdNO8 (%): C, 35.85; H, 4.25; N, 2.20; Fe, 8.81; Cd, 17.61. Found (%): C, 35.47; H, 4.11; N, 2.10; Fe, 8.64; Cd, 17.42. Λm (Ω−1 mol−1 cm2) = 6; FT-IR (ν, cm−1): hydroxyl (OH) 3448br, carbonyl (C⚌O) disappear, azomethine (C⚌N) 1652sh, ν(COO)asy 1447 s, ν(COO)sym 1384s, H2O stretching of coordinated water 910w and 824s, (M—O) 550w. 1H NMR (300 MHz, DMSO-d6, δ, ppm): 4.22–4.77 (m, 9H, ferrocene ring), 6.00–7.95 (m, 3H, benzene), 10.11 (s, 1H, carboxylic-OH), 8.85 (s, 1H, phenolic-OH), 1.25 (s, 3H, methyl group of ferrocene). UV–Vis (λmax, nm): 262 (π–π*).
2.7 Spectrophotometric studies
The absorption spectra were recorded for 1 × 10⁻⁴ Mol L−1 solutions of the free organometallic Schiff base ligand and its metal complexes. The spectra were scanned within the wavelength range from 200 to 700 nm.
2.8 Antimicrobial activity
The in vitro antibacterial and antifungal activity tests were performed through the disc diffusion method (Albert, 1979; Govindaraj and Ramanathan, 2014). The bacterial organisms that have been used were [Bacillus subtilis, Staphylococcus aureus, Escherichia coli and Salmonella typhimurium] and fungal species included [Aspergillus fumigatus and Candida albicans,]. Stock solution (0.001 mol) was prepared by dissolving the compounds in DMSO. The nutrient agar medium for antibacterial was (0.5% Peptone, 0.1% Beef extract, 0.2% Yeast extract, 0.5% NaCl and 1.5% Agar-Agar) was prepared, cooled to 47 °C and then seeded with tested microorganisms. After solidification 5 mm diameter holes were punched by a sterile corkborer. The investigated compounds, i.e. Schiff base ligand and its metal complexes, were introduced in Petri-dishes (only 0.1 m) after dissolving in DMSO at 1.0 × 10⁻³ Mol L−1. These culture plates were then incubated at 37 °C for 20 h for bacteria. The activity was determined by measuring the diameter of the inhibition zone (in mm). The plates were kept for incubation at 37 °C for 24 h and then the plates were examined for the formation of zone of inhibition. The diameter of the inhibition zone was measured in millimeters. Antimicrobial activities were performed in triplicate and the average was taken as the final reading (Chandra et al., 2009).
2.9 Anticancer activity
Potential cytotoxicity of all prepared compounds was tested using the method of Skehan and Storeng (Skehan et al., 1990). Cells were plated in 96-multiwell plate (104 cells/well) for 24 h before treatment with the compounds to allow attachment of cell to the wall of the plate. Different concentrations of the compounds under investigation (0, 5, 12.5, 25, 50 and 100 μg/ml) were added to the cell monolayer and triplicate wells were prepared for each individual dose. The monolayer cells were incubated with the compounds for 48 h at 37 °C and in 5% CO2 atmosphere. After 48 h, cells were fixed, washed and stained with SRB stain. Excess stain was washed with acetic acid and attached stain was recovered with tris‐EDTA buffer. The optical density (O.D.) of each well was measured spectrophotometrically at 564 nm with an ELIZA microplate reader and the mean background absorbance was automatically subtracted and mean values of each drug concentration was calculated. The relation between drug concentration and surviving fraction is plotted to get the survival curve of breast tumor cell line for each compound.
Calculation:
The percentage of cell survival was calculated as follows:
Survival fraction = O.D. (treated cells)/O.D. (control cells). The IC50 values (the concentrations of the Schiff base ligand (H2L) or complexes required to produce 50% inhibition of cell growth). This experiment was repeated three times.
2.10 Computational methodology
DFT and molecular modeling theoretical calculations for organometallic Schiff base ligand (H2L) was carried out on Gaussian03 package (Frisch et al., 2004) at density functional theory (DFT) level of theory. The molecular geometry for the tested ligand was fully optimized using density functional theory based on B3LYP method along with the LANL2DZ basis set (Lakshmipraba et al., 2015). The optimized structure of the ligand (H2L) was visualized using Chemcraft version 1.6 package (Mohamed and Abd El-Wahab, 2005), and GaussView version 5.0.9 (Dennington et al., 2009). Quantum chemical parameters such as the highest occupied molecular orbital energy (EHOMO), the lowest unoccupied molecular orbital energy (ELUMO) and HOMO–LUMO energy gap (ΔE) for the investigated molecule were calculated.
2.11 Molecular docking
Molecular docking studies were elaborated using MOE 2008 software and it is rigid molecular docking software. These studies are very important for predicting the possible binding modes of the most active compounds against the receptors of crystal structure of Staphylococcus aureus (PDB ID: 4K3V), crystal structure of Salmonella typhimurium (PDB ID: 2YLB) and crystal structure of deglycating enzyme fructosamine oxidase from Aspergillus fumigatus (PDB ID: 3DJD) (Dhanaraj et al., 2016). Docking is an interactive molecular graphics program can be used to calculate and display feasible docking modes of a receptor and ligand and complex molecules. It necessitates the ligand, the receptor as input in PDB format. The water molecules, co-crystallized ligands and other unsupported elements (e.g., Na, K, Hg, etc.,) were removed but the amino acid chain was kept (Balakrishnan et al., 2015). The structure of ligand in PDB file format was created by Gaussian03 software. The crystal structures of the three receptors were downloaded from the protein data bank ( http://www.rcsb.org./pdb).
3 Results and discussion
3.1 Characterization of organometallic Schiff base ligand (H2L)
A dark brown organometallic Schiff base ligand (H2L) was synthesized by condensation between 4-aminosalicylic acid with 2-acetylferrocene. The structure of the prepared ligand was characterized according to different techniques such as elemental analysis, IR, mass spectrometry, 1H NMR UV–Vis and thermal analyses. The mass spectrum (MS) of H2L ligand showed a peak at 364 amu which corresponding to the molecular ion (m/z) peak. The data confirmed the successful condensation between the parent compounds to get the Schiff base ligand that has molecular formula C19H17NO3Fe with atomic mass 363 g/mol. The elemental analysis data indicated that the ligand was formed in 1:1 M ratio. The infrared spectrum of the Schiff base ligand showed important characteristic bands. The most characteristic band was appeared at 1650 cm−1 that may be corresponded to ν(C⚌N) of azomethine group. This gave good indication for the successful synthesis of organometallic Schiff base ligand (Firouzabadi and Firouzmandi, 2017). The stretching frequency of ν(OH) group was observed at 3406 cm−1 as a broad band (Martins et al., 2017). The ligand also exhibited bands at 1733, 1451 and 1371 cm−1 due to ν(C⚌O), ν(COO–)asy and ν(COO–)sym, respectively (Ajlouni et al., 2016; Mahmoud et al., 2017a). 1H NMR spectrum of H2L ligand showed multiplet signals that were appeared in the region of 4.22–4.77 ppm which correspond to the ferrocene protons (Zhang et al., 2001). The signal which was attributed to the methyl protons was observed at 1.56 ppm (Yadav and Singh, 2011). The multi-signals within the 6.00–7.13 ppm range were assigned to the aromatic protons of benzene ring (Bal et al., 2014). In the down field region of the 1H NMR spectrum of the ligand, singlet signal was observed at 10 ppm which related to carboxylic proton of salicylic acid (Bal et al., 2014; Roman and Andree, 2001). Singlet signal was appeared at 8.75 ppm that related to the phenolic proton (Alaghaz et al., 2014a).
3.1.1 Geometrical optimization of the Schiff base ligand (H2L)
Calculating theoretical parameters would help in characterizing the molecular structure of the prepared compounds. So, the structure of the Schiff base ligand was optimized by using DFT method (Gaber et al., 2018; Singh et al., 2012). The calculated bond lengths and bond angles for H2L ligand were listed in Supplementary Table (1) and the optimized structure of the H2L ligand was shown in Fig. 1. Furthermore, other quantum chemical parameters such as: energy of the highest occupied molecular orbital, EHOMO, energy of the lowest unoccupied molecular orbital, ELUMO, energy gap (ΔE), chemical potentials, Pi, electronegativity, χ, dipole moment, μ, softness, σ, hardness, η, and additional electronic charge, ΔNmax had been calculated according to different equations as shown in Supplementary Information 1 (SI-1) and then were listed in Table 2 (Pearson, 1989; Geerlings et al., 2003; Chattaraj and Giri, 2007).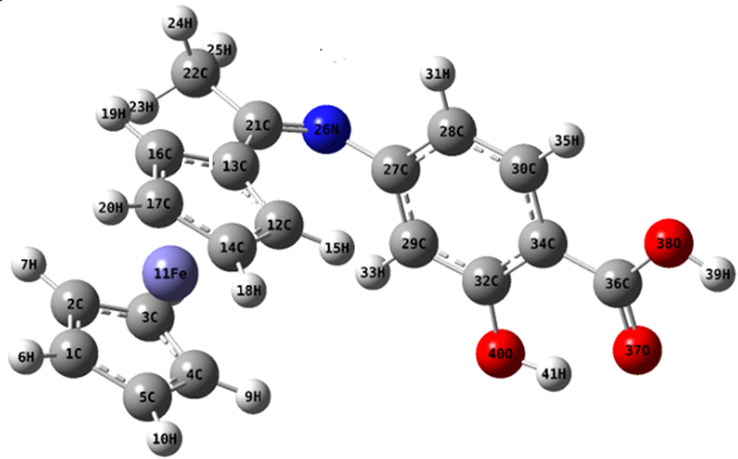
The optimized structure of organometallic Schiff base ligand (H2L).
The calculated quantum chemical parameters
E (a.u)
−1137.97
Dipole moment (Debye)
4.83
EHOMO (eV)
−5.91
ELUMO (eV)
−1.93
ΔE (eV)
3.98
χ (eV)
3.92
η (eV)
1.99
σ (eV)−1
0.51
Pi (eV)
−3.92
S (eV)−1
0.25
ω (eV)
3.86
ΔNmax
1.97
When the value of EHOMO become higher, the molecule is better for donating electrons. This means that the ligand offering electrons to unoccupied d-orbital of the transition metal ions and this increase the possibility of complexation to occur. Also, the small band gap energy showed that the molecule became more reactive one. The ΔE value of the H2L ligand was very small (3.98 e.V). Dipole moment is considered as very important role in increasing the biological activities of the prepared compounds. The decrease in this value as observed in the prepared ligand may be the reason for increasing of its activities against breast cancer (Sagdinc et al., 2009).
3.1.2 Molecular electrostatic potential map (MEP)
MEP of the synthesized ligand was observed in Fig. 2. The MEP gave important information about charge density distributions, electrophilic interactions and chemically reactive sites that present in the ligand (Sahin et al., 2017). The positive electrostatic potential surfaces were represented by blue color which referred to the lower electron density regions. The negative regions were represented by red color which corresponded to nucleophilic sites (Ekmekcioglu et al., 2015; Aktan et al., 2011). The MEP of the ligand showed red color which surrounded the carboxylic and phenolic groups. While the ferrocene and benzene rings were surrounded by blue-green color. This indicated that the more reactive sites which were electrophilic surfaces that coordinated to metal ions were phenolic and carboxylic groups (Babur et al., 2015).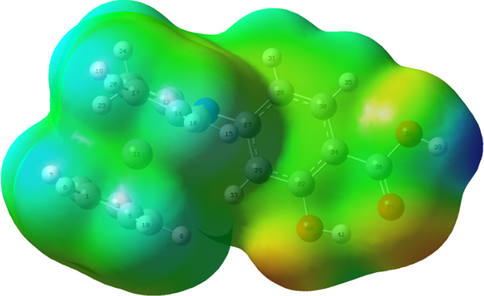
Molecular electrostatic potential map of organometallic Schiff base ligand (H2L), the electron density isosurface is 0.004 a.u.
3.1.3 Vibrational properties
For confirming the successfully preparation of the ligand, experimentally vibrational analysis was compared with the theoretical data that had been performed based on the optimized structure of the ligand. The data observed with the quantum chemical methods such as DFT method had systematic errors. So, using scaling factor of 0.96 for LanL2DZ level can overcome these errors (Alturk et al., 2016). The experimental data showed that the ligand had five important characteristic bands which were appeared at 3406, 1733, 1650, 1451 and 1371 cm−1 which corresponded to ν(OH), ν(C⚌O), ν(C⚌N)azomethine, ν(COO–)asy and ν(COO–)sym, respectively. These bands were calculated theoretically and their value were at 3666, 1720, 1680, 1482 and 1389 cm−1. These data confirmed that the experimental values were close to the theoretical data. So, the ligand was prepared with successful method (Mahmoud et al., 2017b; Ermis, 2018).
3.1.4 UV–Visible analysis
The nature of the electronic transitions presented in the UV–Vis spectrum of the Schiff base ligand had been studied by high accuracy and low computational cost of DFT method (Mahmoud et al., 2017c; Reed et al., 1988). The experimental and theoretical electronic spectra of the ligand were showed in Supplementary Fig. 3. Also, electronic transitions with maximum oscillator strength from DFT calculations were listed in Supplementary Table 3. The experimental absorption spectrum of the Schiff base ligand was recorded in 10−4 M DMF solution. This spectrum showed bands at 271 and 314 nm which related to π–π* transitions of the ferrocene and benzene rings and to the n–π* transition of COOH, OH and C⚌N groups, respectively (Kucuk et al., 2015).
The data from TD-DFT method showed also two electronic transitions at 277 and 312 nm. The band observed at 277 nm was contributed to transition from HOMO-4 to LUMO. The second band computed at 312 nm with an oscillator strength of f = 0.3211 was represented by the contribution of HOMO → LUMO + 3 or contribution of HOMO-2 → LUMO (Gokce et al., 2017; Bilge et al., 2009). These transitions were shown in Fig. 4.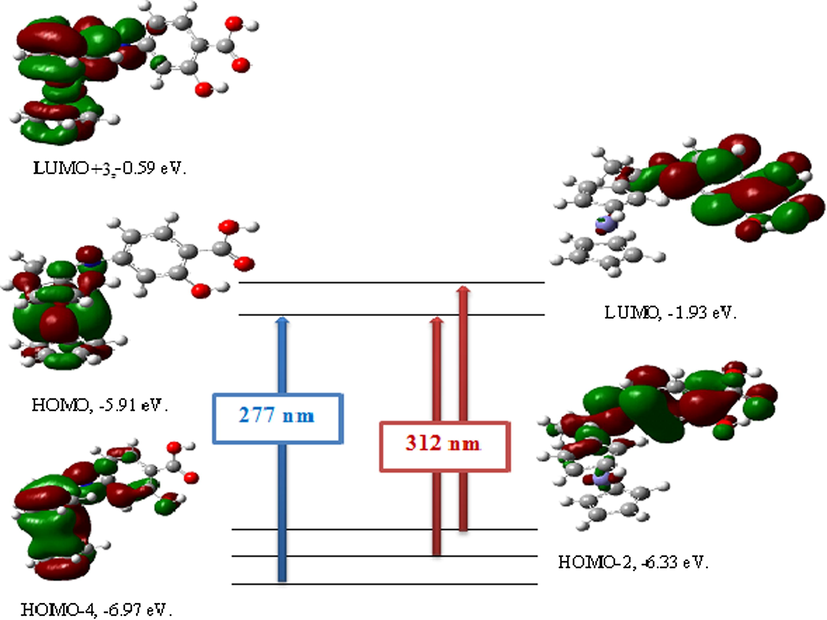
Theoretical electronic absorption transitions for Schiff base ligand (H2L) in DMF solvent.
3.2 Characterization of metal complexes
After preparation of organometallic Schiff base ligand, their Cr(III), Mn(II), Fe(III), Co(II), Ni(II), Cu(II), Zn(II) and Cd(II) complexes were also prepared. All the prepared compounds were characterized by using various techniques such as elemental analysis (C, H, N and metal content), IR, molar conductance, UV–Vis, 1H NMR and mass spectrometry. Their thermal analyses (TG and DTG) were studied.
3.2.1 Elemental analysis
The transition metal complexes were also prepared and then collected in pure form with satisfied yields. Their melting points, colors and percent of carbon, hydrogen, nitrogen and metal contents were determined. The complexes agreed well with a 1:1 metal: ligand stoichiometric ratio. They were air stable solids at room temperature and had high melting point values > 300 °C. They were soluble in N,N-dimethylformamide (DMF) for H2L ligand, Fe(III), Cu(II) and Cd(II) complexes while in 1:1 mixture of DMF:DMSO for Cr(III), Mn(II), Co(II), Ni(II) and Zn(II) complexes. Also, they were insoluble in water, ethanol and methanol solutions.
3.2.2 Molar conductivity measurements
The molar conductivity of 10−3 Mol L−1 solutions of all prepared complexes was measured at room temperature (25 °C). It was shown that Co(II), Cu(II), Zn(II) and Cd(II) complexes were located as non-electrolytes (Gull and Hashmi, 2015; Alothman et al., 2019). The data of these results assigned to the absence of any chloride anion in outer sphere of these complexes. While, Cr(III), Mn(II), Fe(III) and Ni(II) complexes behaved as electrolytes as the result of the presence of chloride anions in the outer sphere (Soliman and Mohamed, 2013; Mohamed et al., 2006).
3.2.3 IR spectra
In order to determine the mode of binding between the Schiff base and metal ions, IR spectra of all prepared complexes were compared with that of the Schiff base ligand. The IR spectrum of H2L ligand showed band at 1650 cm−1, this band attributed to azomethine group. In all metal complexes spectra, there were not any significant shifting in this band which confirming the non-participating of this azomethine group in the coordination (Firouzabadi and Firouzmandi, 2017). A broad band was appeared in the ligand spectrum at 3406 cm−1. This band was shifted in all complexes to lower or higher frequencies in the range of 3382–3448 cm−1 which confirming the participation of OH group in coordination with metal ions (Martins et al., 2017; Soliman and Mohamed, 2013). The carbonyl group, asymmetric and symmetric vibrations of carboxylic bands were exhibited in ligand at 1733, 1451 and 1371 cm−1, respectively. These bands were shifted in all metal complexes to 1760–1780, 1428–1447 and 1310–1384 cm−1, respectively (Ajlouni et al., 2016; Mahmoud et al., 2017d). The shift occurred in the carboxylate bands confirmed its participation in chelate formation with monodentate mode. Furthermore, two bands were assigned to the presence of coordinated water molecules in all metal complexes which appeared at 824–920 and 800–850 cm−1 (Mahmoud et al., 2016). In lower frequencies of all metal complexes spectra, new band was found in the region of 520–561 cm−1 which attributed to ν(M—O) (Halli et al., 2011). From the comparison between the spectrum of Schiff base and its metal complexes spectra, it was concluded that H2L ligand behaved as bidentate ligand that can be coordinated to the metal ions through protonated phenolic-OH and protonated carboxylic-OH groups.
3.2.4 1H NMR spectra
The 1H NMR spectra of H2L ligand and its Cd(II) complex were recorded in DMSO-d6 (Singh et al., 2010). The spectrum of the ligand showed multiplet signals that appeared in the region of 4.22–4.77 ppm which corresponded to the ferrocene protons (Zhang et al., 2001). These signals were appeared in Cd(II) complex at the same range. The methyl protons was observed as singlet signal at 1.56 ppm in the ligand and at 1.25 ppm in its Cd(II) complex (Yadav and Singh, 2011). The multi-signals within the 6.00–7.13 ppm range were assigned to the aromatic protons of benzene ring in the ligand which were indicated in the Cd(II) complex at 600–7.95 ppm (Bal et al., 2014). The carboxylic proton of salicylic acid was observed at 10 ppm in Schiff base ligand. This signal was still appeared in the Cd(II) complex but shifted to higher value at 10.11 ppm. This data indicated that this proton didn′t remove from the carboxylic group upon coordination (Bal et al., 2014; Roman and Andree, 2001). Also in the 1H NMR spectrum of ligand, singlet signal was appeared at 8.75 ppm that related to the phenolic proton (Alaghaz et al., 2014b). This signal was still present in the spectrum of the Cd(II) complex but shifted to higher value 8.85 ppm. This confirmed the participating of this phenolic proton in coordination. Finally, the ligand behaved as neutral bidentate ligand as confirmed from the IR spectra (Fig. 5).![a 1H NMR spectrum of Schiff base ligand (H2L). b 1H NMR spectrum of [Cd(H2L)(H2O)2Cl2].3H2O complex.](/content/184/2020/13/5/img/10.1016_j.arabjc.2020.03.017-fig5.png)
a 1H NMR spectrum of Schiff base ligand (H2L). b 1H NMR spectrum of [Cd(H2L)(H2O)2Cl2].3H2O complex.
3.2.5 UV–Visible spectra of the Schiff base ligand and its metal complexes
The electronic absorption spectra of the prepared organometallic Schiff base and its metal complexes were measured in the range of 200–700 nm at room temperature.
The absorption spectrum of organometallic Schiff base ligand showed two bands at 271 and 314 nm. The first band was related to π-π* transitions of the benzene and ferrocene rings. The second band was observed at λmax = 314 nm that may be related to the n–π* transition of the COOH, OH and C⚌N groups (Soliman and Mohamed, 2013; Kianfar et al., 2013). In all metal complexes, the band that appeared at 271 in the ligand was shifted to the range of 262–277 nm. While the other band that related to n–π* transition was shifted to 307–326 nm. These shifting gave good indication for coordination of carboxylic group to the metal ions (Liu et al., 2007; Mahalakshmi and Rajavel, 2010).
3.2.6 Thermal analysis of Schiff base ligand and its metal complexes
Thermal analysis is considered as a very useful, effective and important technique that can be used to determine the thermal stability of materials and confirm their molecular structures. So, the thermal stability of organometallic Schiff base (H2L) and its transition metal complexes were investigated using differential thermogravimetric (DTG) and thermogravimetric technique (TG) analyses. These analyses were investigated at heating rate of 10 °C/min in nitrogen atmosphere over the range from room temperature to 1000 °C. The data then were listed in Table 4. n* = number of decomposition steps.
Complex
TG range(°C)
DTGmax(°C)
n*
Mass loss Total mass lossEstim (Calc.) %
Assignment
Residues
Schiff base ligand (H2L)
70–405
405–1000201, 376
424, 617, 7352
319.74 (19.84)
43.33 (43.80) 63.07 (63.64)-Loss of C3H6NO.
-Loss of C11H11O
FeO + 5C
[Cr(H2L)(H2O)2Cl2]Cl·5H2O
40–125
125–455
455–100078
341
8471
1
113.22 (13.90)
20.83 (20.54)
35.72 (35.29) 69.77 (69.73)-Loss of 5H2O.
-Loss of Cl2, 2H2O and C2H2.
-Loss of C13H15NO0.5Cl.
FeO +1/2Cr2O3
4C
[Mn(H2L)(H2O)3Cl]Cl·5H2O
40–145
145–520
520–100077
310
6601
1
113.73 (14.22)
20.18 (19.75)
33.92 (33.97) 67.83 (67.94)-Loss of 5H2O.
-Loss of 3H2O and Cl2.
-Loss of C14H17NO.
FeO + MnO + 5C
[Fe(H2L)(H2O)2Cl2]Cl·2H2O
30–105
105–380
380–100069
144
616, 9251
1
26.13 (6.03)
22.96 (22.26)
35.16 (36.23) 64.25 (64.52)-Loss of 2H2O.
-Loss of Cl2, 2H2O and C2H2.
-Loss of C12H15NO0.5Cl.
FeO+1/2Fe2O3 + 5C
[Co(H2L)(H2O)2Cl2]·3H2O
30–390
390–610
610–100075, 340
590
7272
1
127.02 (26.85)
9.72 (9.61)
30.15 (30.10) 66.89 (66.56)-Loss of 5H2O, HCl and C2H6.
-Loss of C3H4O.
-Loss of C10H6NCl.
FeO + CoO + 4C
[Ni(H2L)(H2O)3Cl]Cl·2H2O
40–520
520–100089, 340
8432
133.23 (33.37)
33.22 (33.19) 66.45 (66.56)-Loss of 5H2O, HCl and C4H4O.
-Loss of C11H12NCl.
FeO + NiO + 4C
[Cu(H2L)(H2O)2Cl2]·2H2O
30–130
130–345
345–100085
313
6001
1
16.43 (6.32)
18.90 (18.79)
39.97 (39.86) 65.30 (64.97)-Loss of 2H2O.
-Loss of 2H2O and Cl2.
-Loss of C15H17NO.
FeO + CuO + 4C
[Zn(H2L)(H2O)2Cl2]·H2O
40–635
635–100083, 281
5802
139.97 (39.60)
21.67 (21.88) 61.64 (61.48)-Loss of 3H2O, Cl2 and C6H6O.
-Loss of C8H11N.
FeO + ZnO + 5C
[Cd(H2L)(H2O)2Cl2]·3H2O
30–325
325–615
615–100086, 220
432, 588
6992
2
113.96 (14.15)
16.82 (16.75)
37.61 (37.66) 68.39 (68.56)-Loss of 5H2O.
-Loss of HCl and C3H4NO.
-Loss of C16H12Cl.
CdO + FeO
The organometallic Schiff base ligand (H2L) with the molecular formula (C19H17NO3Fe) was thermally decomposed in five decomposition steps. The first and second steps with estimated mass loss of 19.74% (calculated mass loss = 19.84%) within the temperature range 70–405 °C may be correspond to the loss of C3H6NO molecule. The DTG curve gave maximum peaks temperature at 201 and 376 °C. The other three decomposition steps with estimated mass loss of 43.33% (calculated mass loss = 43.80%) within the temperature range 405–1000 °C may be correspond to the loss of C11H11O molecule. The DTG curve gave maximum peaks temperature at 424, 617 and 735 °C. At the end of decomposition FeO contaminated with carbon remained as residues. The overall weight loss amounted to 63.07% (calculated mass loss = 63.64%).
The [Cr(H2L)(H2O)2Cl2]Cl·5H2O complex was thermally decomposed in three steps. The first step with estimated mass loss of 13.22% (calculated mass loss = 13.90%) within the temperature range of 40–125 °C corresponded to loss of five water molecules of hydration. The DTG curve gave maximum peak temperature at 78 °C. The second step corresponded to estimated mass loss of 20.83% (calculated mass loss = 20.54%) within the temperature range 125–455 °C and represented the loss of Cl2 gas, 2H2O and C2H2 molecules. The final step with estimated mass loss of 35.72% (calculated mass loss = 35.29%) within the temperature range 455–1000 °C corresponded to loss of C13H15NO0.5Cl molecule. The DTG curve gave maximum peak temperature at 847 °C, leaving FeO and ½ Cr2O3 contaminated with carbon as residues. The overall weight loss amounted to 69.77% (calculated mass loss = 69.73%).
The [Mn(H2L)(H2O)3Cl]Cl·5H2O complex upon heating lost 5H2O molecules in the first step of decomposition within the temperature range 40–145 °C at maximum peak temperature 77 °C, with a mass loss = 13.73% (calculated mass loss = 14.22%). The second step of decomposition occurred at maximum peak temperature at 310 °C, correspond to loss of Cl2 gas and 3H2O molecules with a mass loss = 20.18% (calculated mass loss = 19.75%), in the temperature range of 145–520 °C. The final step started the decomposition at 520 °C and ended at 1000 °C with maximum peak temperature at 660 °C and may be correspond to the loss of C14H17NO molecule with mass loss of 33.92% (calculated mass loss = 33.97%), leaving FeO and MnO oxides contaminated with carbon as residues of decomposition. The overall weight loss amounted to 67.83% (calculated mass loss = 67.94%).
The [Fe(H2L)(H2O)2Cl2]Cl·2H2O complex showed four decomposition steps within the range 30–1000 °C. The first decomposition step was accompanied by loss of 2H2O molecules of hydration in the temperature range of 30–105 °C with an estimated mass loss of 6.13% (calculated mass loss = 6.03%). The DTG curve gave maximum peak temperature at 69 °C (the maximum peak temperature). The second step of decomposition correspond to loss of C2H2, 2H2O molecules and Cl2 gas at 105–380 °C with an estimated mass loss of 22.96% (calculated mass loss = 22.26%) with maximum peak temperature at 144 °C. The final two decomposition steps within the range 380–1000 °C were assigned to loss of C12H15NO0.5Cl molecule with a mass loss of 35.16% (calculated mass loss = 36.23%). Ferric and ferrous oxides contaminated with carbon were remained as residues. The overall weight loss amounted to 64.25% (calculated mass loss = 64.52%).
In the thermograph of [Co(H2L)(H2O)2Cl2].3H2O complex, the first and second steps of decomposition correspond to mass loss of 27.02% (calculated mass loss = 26.85%) within the temperature range of 30–390 °C with maximum peaks temperature at 75 and 340 °C, represented the loss of 5H2O, HCl and C2H6 molecules. The third step started the decomposition at 390 °C and ended at 610 °C with maximum peak temperature at 590 °C and may be accounted to the loss of C3H4O molecule with mass loss of 9.72% (calculated mass loss = 9.61%). The final step of the decomposition started at 610 °C and ended at 1000 °C with maximum peak temperature at 727 °C and may be accounted to the loss of C10H6NCl molecule with mass loss of 30.15% (calculated mass loss = 30.10%), leaving behind FeO and CoO oxides contaminated with carbon as residues of decomposition. The overall weight loss amounted to 66.89% (calculated mass loss = 66.56%).
In the thermograph of [Ni(H2L)(H2O)3Cl]Cl·2H2O complex, the first and second steps of decomposition displayed a gradual mass loss of 33.23% (calculated mass loss = 33.37%) within the temperature range of 40–520 °C which may be correspond to the loss of five molecules of water of hydration, HCl and C4H4O molecules. The DTG curve gave maximum peaks temperature at 89 and 340 °C. The final step represented a mass loss of 33.22% (calculated mass loss = 33.19%) which correspond to loss of C11H12NCl molecule within temperature range 520–1000 °C. The maximum peak temperature was at 843 °C. Finally, FeO and NiO contaminated with carbon remained as residues. The overall weight loss amounted to 66.45% (calculated mass loss = 66.56%).
The [Cu(H2L)(H2O)2Cl2].2H2O complex gave decomposition pattern that started from 30 °C to 1000 °C with three steps. The first step within the temperature range of 30–130 °C with maximum peak temperature at 85 °C which represented the loss of two water molecules of hydration with a found mass loss of 6.43% (calculated mass loss = 6.32%). The second step which represented the loss of Cl2 gas and 2H2O molecules with a mass loss of 18.90% (calculated mass loss = 18.79%) within the temperature range 130–345 °C and maximum peak temperature at 313 °C. The final step was represented the loss of C15H17NO molecule with a mass loss of 39.97% (calculated mass loss = 39.86%) within the temperature range 345–1000 °C and maximum peak temperature at 600 °C. At the end of the thermogram, FeO and CuO contaminated with carbon remained as residues. The overall weight loss amounted to 65.30% (calculated mass loss = 64.97%).
In the thermograph of [Zn(H2L)(H2O)2Cl2].H2O complex, the first and second decomposition steps displayed a gradual mass loss of 39.97% (calculated mass loss = 39.60%) within the temperature range of 40–635 °C which may be correspond to the loss of three molecules of water, Cl2 gas and C6H6O molecule. The DTG curve gave peaks at 83 and 281 °C (the maximum peaks temperature). The third decomposition step indicated a mass loss of 21.67% (calculated mass loss = 21.88%) which correspond to loss of C8H11N molecule within temperature range 635–1000 °C. The maximum peak temperature was at 580 °C. Finally FeO + ZnO contaminated with carbon remained as residues. The overall weight loss amounted to 61.64% (calculated mass loss = 61.48%).
The [Cd(H2L)(H2O)2Cl2].3H2O complex lost upon heating 5H2O molecules in the first and second steps of decomposition within the temperature range of 30–325 °C, at maximum peaks temperature at 86 and 220 °C with estimated mass loss of 13.96% (calculated mass loss = 14.15%). The third and fourth steps accounted for the loss of HCl and C3H4NO molecules within the temperature range of 325–615 °C, at maximum peaks temperature at 432 and 588 °C, with estimated mass loss of 16.82% (calculated mass loss = 16.75%). The final step correspond to loss of C16H12Cl molecule within temperature range 615–1000 °C at maximum peak temperature at 699 °C, with estimated mass loss of 37.61% (calculated mass loss = 37.66%), leaving FeO and CdO as residues of decomposition. The overall weight loss amounted to 68.39% (calculated mass loss = 68.56%).
The prepared ferrocenyl ligand had iron atom. During the synthesis of its complexes with different transition metal ions, they contain two metal atoms. Due to that, these prepared complexes were very stable and their M.P. > 300 °C. So, the residues were a mixture of ferrous oxide and transition metal oxide which became contaminated with some carbon atoms.
3.2.7 Structural interpretation
The structure of transition metal complexes were characterized and confirmed by different spectroscopic techniques. Also, TG and DTG thermal studies were investigated. Finally, the structure of all prepared metal complexes was shown in Fig. 6.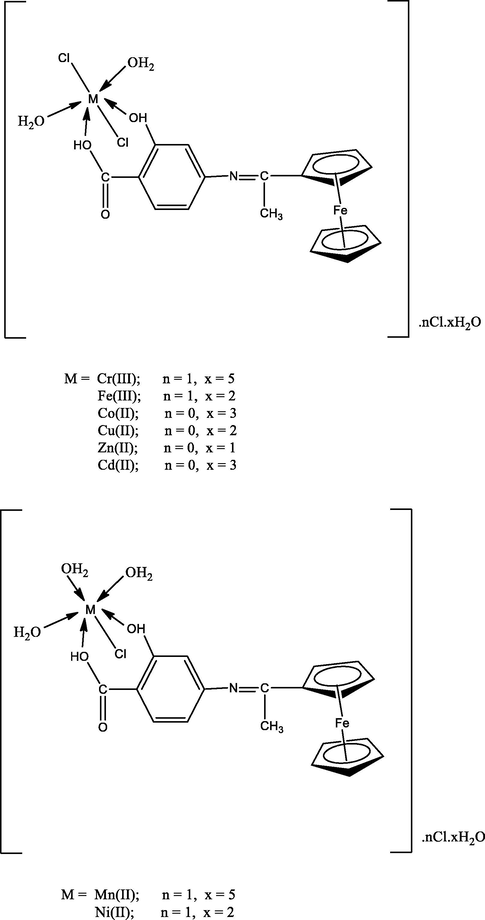
The structure of organometallic Schiff base metal complexes.
3.2.8 Antimicrobial activities
The main goal of the preparation of any antimicrobial compound is to help in inhibiting the causal microbe on the patients without any side effects. So, organometallic Schiff base (H2L) and its Cr(III), Mn(II), Fe(III), Co(II), Ni(II), Cu(II), Zn(II) and Cd(II) complexes were investigated for antibacterial and antifungal activities against two strain of Gram-positive bacteria (Bacillus subtilis and Staphylococcus aureus), two strain of Gram-negative bacteria (Escherichia coli and Salmonella typhimurium) and two pathogenic fungus (Aspergillus fumigatus and Candida albicans). The biological data were shown in Fig. 7.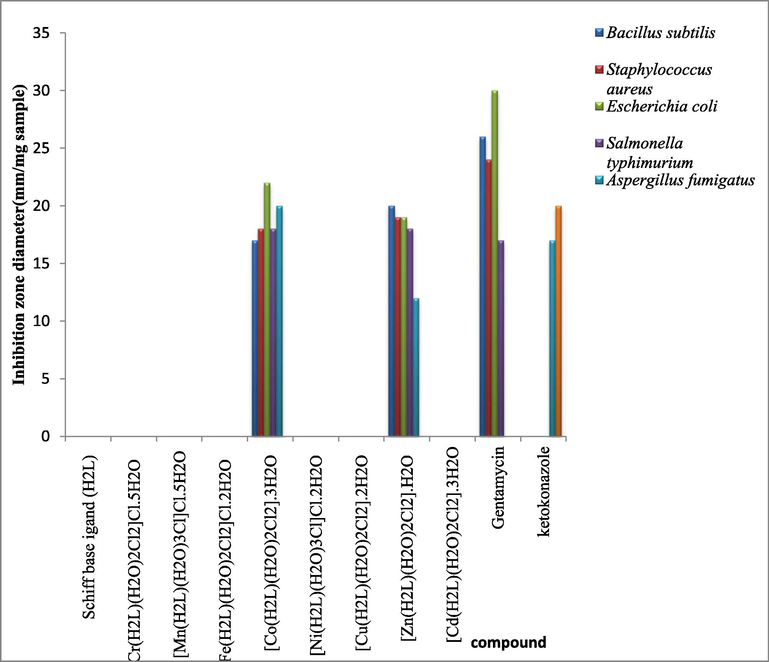
Biological activity of organometallic Schiff base ligand (H2L) and its metal complexes.
The data of the biological activities of the Schiff base ligand and its metal complexes against four different bacterial and two fungal species showed that the ligand and Cr(III), Mn(II), Fe(III), Ni(II), Cu(II) and Cd(II) complexes had no activity against all species. While Co(II) and Zn(II) complexes had very high bacterial activity against all bacterial species. And also, they had fungicidal activity against Aspergillus fumigatus specie with inhibition zone diameter 20 and 12 mm for Co(II) and Zn(II) complexes, respectively.
Also the activities of these compounds against Gram-positive and Gram-negative bacteria were confirmed by calculating the activity index according to the following relation (Thangadurai and Natarajan. 2001; Mahmoud et al., 2017e; Chohan et al., 2004). From the data, it was observed that the ligand and all complexes had no activity index against all species except Co(II) and Zn(II) had very high activity index value (Mahmoud et al., 2017e).
The higher value of biological activities of some metal complexes may be attributed to their high penetrating ability to the bacteria and fungi cell wall (El-Gammal, 2010; Karekal and Mruthyunjayaswamy, 2013).
3.2.9 Anticancer activities
The in vitro cytotoxic activities of the prepared organometallic Schiff base and its metal complexes were screened against cell line of breast cancer (MCF-7). Firstly, cytotoxic activities of these compounds were calculated at single concentration 100 μg/mL against MCF-7 cell line. It was found that H2L ligand, Cu(II) and Cd(II) complexes had inhibition ratio value 70, 74 and 78%, respectively, while other metal complexes were <60%. Secondary, the compounds with inhibition ratio value equal or higher than 70% were investigated against four concentrations (0, 12.5, 25 and 50 μg/mL) and the median inhibitory concentration (IC50) values of these compounds were calculated. These activities were then showed in Fig. 8. From these results, it was showed that the Cu(II) complex had the lowest IC50 value = 47.3 μg/mL which can be considered as very active compound that may be used in future as very effective antibreastic drug (Mohamed et al., 2015).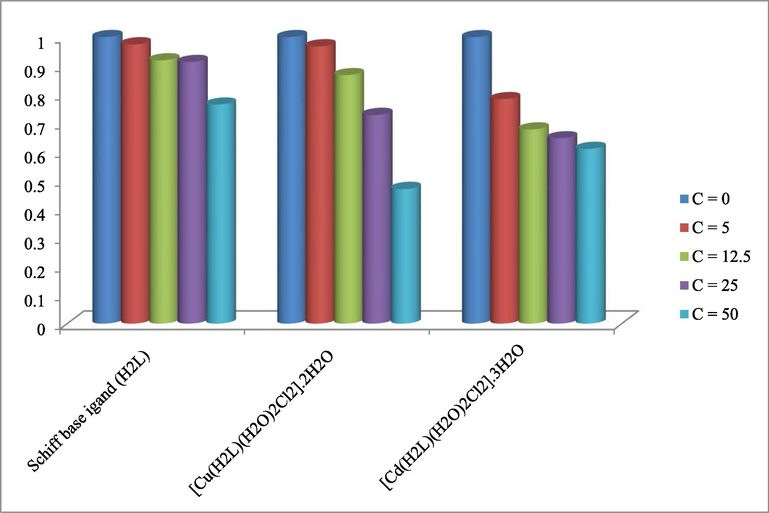
Anticancer activity against breast cancer of the Schiff bases ligand (H2L) and its metal complexes.
3.2.10 Molecular modeling of organometallic Schiff base ligand (H2L), Co(II) and Zn(II) complexes: Docking study
Docking studies is considered as very active method that can be used to establish the multi-receptor interaction of the prepared Schiff base ligand to design drug resistance against different effects that occur in our bodies (Chacko and Samanta, 2017; Rauf and Shah, 2017). So, the optimized structure of the Schiff base ligand, Co(II) and Zn(II) complexes were docked with different possible biological targets such as: the receptors of crystal structure of Staphylococcus aureus (PDB ID: 4K3V), crystal structure of Salmonella typhimurium (PDB ID: 2YLB) and crystal structure of deglycating enzyme fructosamine oxidase from Aspergillus fumigatus (PDB ID: 3DJD). These bacterial and fungal species may cause some infections in skin and bone. Also, cause inflammation of sinuses and lungs. Three-dimensional structures of docking studies of all compounds were shown in Fig. 9. Furthermore, their binding energies with the three receptors were calculated and then were listed in Table 5.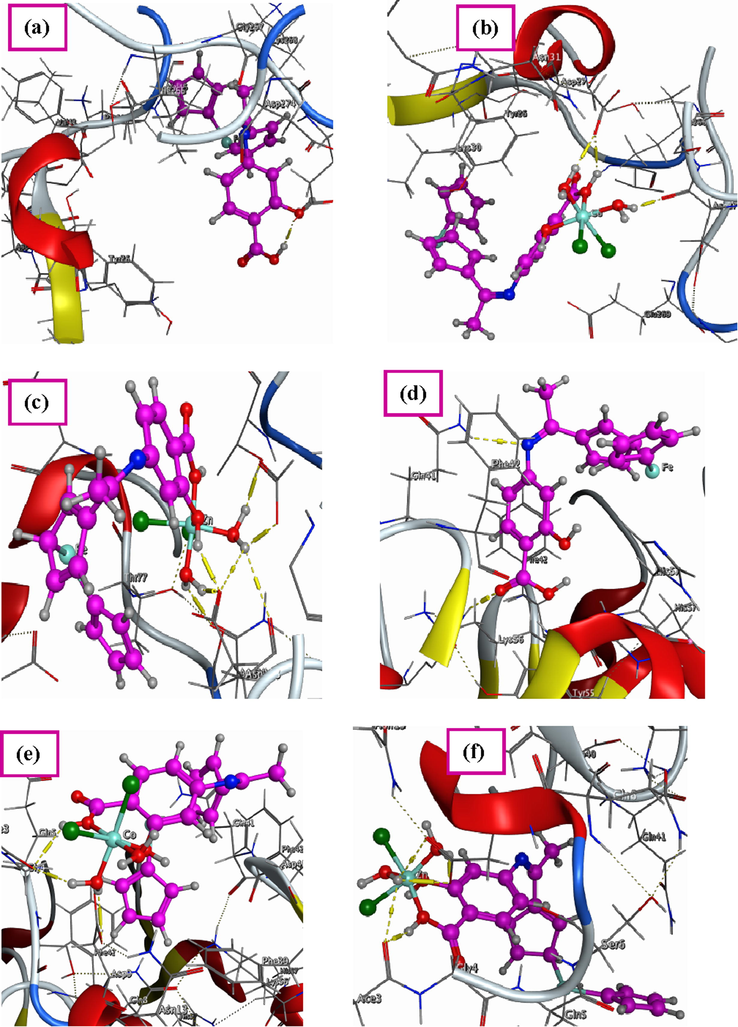
3D structure of the interaction between Schiff base ligand (H2L) with receptors of (a) 4K3V, (d) 2YLB and (g) 3DJD, 3D plot of the interaction between Co(II) complex with receptors of (b) 4K3V, (e) 2YLB and (h) 3DJD and 3D plot of the interaction between Zn(II) complex with receptors of (c) 4K3V, (f) 2YLB and (i) 3DJD.
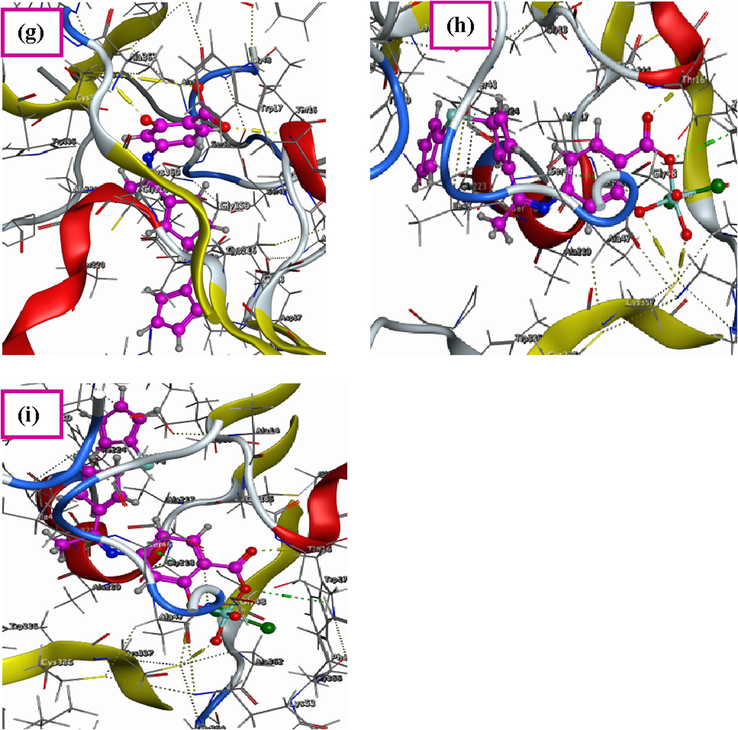
3D structure of the interaction between Schiff base ligand (H2L) with receptors of (a) 4K3V, (d) 2YLB and (g) 3DJD, 3D plot of the interaction between Co(II) complex with receptors of (b) 4K3V, (e) 2YLB and (h) 3DJD and 3D plot of the interaction between Zn(II) complex with receptors of (c) 4K3V, (f) 2YLB and (i) 3DJD.
Compound
Receptor
Ligand moiety
Receptor site
Interaction
Distance (Aο)
E (kcal mol−1)
Ligand (H2L)
4K3V
O37
OE2 GLU 269
H-donor
3.00
−6.50
2YLB
N26
O37NE2 GLN 41
NE2 GLN 8H-acceptor
H-acceptor3.22
3.02−1.50
−2.00
3DJD
O38
O37SG CYS 337
N TRP 17H-donor
H-acceptor3.11
2.94−6.10
−2.40
[Co(H2L)(H2O)2Cl2].3H2O complex
4K3V
O35
O43
O46
O35
O43
O46OD1 ASP 27
OD1 ASP 27
O ASP 274
OD1 ASP 27
OD1 ASP 27
OD1 ASP 27H-donor
H-donor
H-donor
ionic
ionic
ionic3.11
2.82
2.85
3.11
2.82
3.31−4.80
−29.70
−11.50
−3.80
−5.80
−2.70
2YLB
O35
O46
O46
O46
O35
O37
O46
O46O ACE 3
O ACE 3
OD1 ASP 9
OD2 ASP 9
OD2 ASP 9
OD2 ASP 9
OD1 ASP 9
OD2 ASP 9H-donor
H-donor
H-donor
H-donor
ionic
ionic
ionic
ionic2.82
2.87
2.86
2.86
3.30
3.26
2.86
2.86−2.80
−3.30
−4.80
–23.00
−2.80
−2.90
−5.50
−5.50
3DJD
O37
O43
O36
C4
O43
O35SG CYS 337
SG CYS 337
N TRP 17
NH1 ARG 186
SG CYS 337
5-ring TRP 17H-donor
H-donor
H-acceptor
ionic
ionic
cation-π4.09
2.97
2.82
3.33
2.97
4.29−17.50
−43.00
−2.70
−2.60
−4.70
−2.00
[Zn(H2L)(H2O)2Cl2].H2O complex
4K3V
O37
O42
O42
O45
O45
O45
O45
O35
O37
O37
O37
O42
O45
O45
O45OD1 ASP 118
OD1 ASN 74
OD1 ASP 118
OE1 GLU 113
OE2 GLU 113
O ASP 118
OD1 ASP 118
OE1 GLU 113
OE1 GLU 113
OE2 GLU 113
OD1 ASP 118
OD1 ASP 118
OE1 GLU 113
OE2 GLU 113
OD1 ASP 118H-donor
H-donor
H-donor
H-donor
H-donor
H-donor
H-donor
ionic
ionic
ionic
ionic
ionic
ionic
ionic
ionic2.59
2.92
2.84
2.73
2.60
3.28
3.40
2.79
3.16
3.04
2.59
2.84
2.73
2.60
3.40−25.50
−9.50
−9.50
−11.30
−12.80
−2.00
−1.30
−6.10
−3.50
−4.20
−7.90
−5.60
−6.60
−7.80
−2.30
2YLB
O35
O42
O45
O45
O45
O35
O42
O42
O45
O45O ACE 3
OD2 ASP 9
O ACE 3
OD1 ASP 9
OD2 ASP 9
OD2 ASP 9
OD1 ASP 9
OD2 ASP 9
OD1 ASP 9
OD2 ASP 9H-donor
H-donor
H-donor
H-donor
H-donor
ionic
ionic
ionic
ionic
ionic3.16
2.66
3.09
3.27
2.82
2.77
3.61
2.66
3.27
2.82−2.80
−10.00
−0.80
−1.10
−14.50
−6.20
−1.50
−7.20
−2.90
−5.80
3DJD
O37
O42
O36
O42
O35
6-ringSG CYS 337
SG CYS 337
N TRP 17
SG CYS 337
5-ring TRP 17
CA SER 46H-donor
H-donor
H-acceptor
ionic
cation-π
π-H4.19
2.99
2.78
2.99
4.30
4.50−14.10
−42.00
−2.50
−4.50
−2.20
−0.70
Firstly, the ligand and its Co(II) and Zn(II) complexes were studied against receptor of Gram positive bacteria such as Staphylococcus aureus (PDB ID: 4K3V) (Gribenko et al., 2013). The result showed that there was possible interaction (H-donor) between the ligand and this receptor. This interaction was increased in the Co(II) and Zn(II) complexes as H-donor and ionic bonds. The minimum binding energies for ligand, Co(II) and Zn(II) complexes were −6.5, −29.7 and −25.5 kcal mol−1, respectively.
Secondary, these compounds were also investigated by molecular docking against Gram negative bacteria such as Salmonella typhimurium (PDB ID: 2YLB) (Sauer and Weichenrieder, 2011). The results indicated that the two complexes had stronger binding interaction with the receptor than the prepared ligand. The main interaction force of the ligand was H-acceptor while for complexes were H-donor and ionic bonds. The minimum binding energies for ligand, Co(II) and Zn(II) complexes were −2.0, –23.0 and −14.5 kcal mol−1, respectively.
Finally, the three compounds were studied against receptor of deglycating enzyme fructosamine oxidase from Aspergillus fumigatus (PDB ID: 3DJD) (Collard et al., 2008). From the results, it was indicated that the main interaction force of the ligand was H-donor and H-acceptor, while in complexes some binding interaction also appeared beside the main interaction in the ligand such as ionic, cation-π and π-H. The minimum binding energies for ligand, Co(II) and Zn(II) complexes against this receptor were −6.1, −43.0 and −42.0 kcal mol−1, respectively. So, Co(II) complex showed the best binding bonds and the lowest binding energies with the different receptors. From all of this data it was confirmed that the coordination with transition metal ions increase the activities against different bacteria and fungi and so decrease the binding energy.
4 Conclusion
Eight transition metal complexes were prepared from O,O-bidentate Schiff base ligand. This ligand was synthesized by condensation of 4-aminosalicylic acid with 2-acetylferrocene. The DFT studies of the Schiff base ligand confirmed its preparation successfully by comparing the data of experimental IR and UV–Vis data with theoretical ones. All compounds then were characterized by different physicochemical and spectroscopic techniques. The data of elemental analysis confirmed that the H2L ligand reacted with metal ions in 1:1 M ratio. IR spectra showed that ligand acted as bidentate ligand and it bound to metal ions through protonated phenolic and carboxylic groups. They had octahedral structures and they were nonelectrolyte except Cr(III), Mn(II), Fe(III) and Ni(II) complexes which were 1:1 electrolytes. After investigating, the ligand and its metal complexes against breast cancer cell line (MCF-7), it was indicated that the [Cu(H2L)(H2O)2Cl2].2H2O complex had the lowest IC50 value (47.3 μg/mL). All compounds were screened against different bacterial species such as Bacillus subtilis, Staphylococcus aureus, Escherichia coli and Salmonella typhimurium and against two fungal species [Aspergillusfumi gatus and Candida albicans]. From these data, it was showed that Co(II) and Zn(II) complexes were only biologically active. Molecular docking studies of the free H2L ligand and its Co(II) and Zn(II) complexes with different receptors of 4K3V, 2YLB and 3DJD showed that the lowest binding energy were −6.5, −2.0 and −6.1 kcal mol−1 for ligand, −29.7, –23.0 and −43.0 kcal mol−1 for Co(II) complex and −25.5, −14.5 and −42.0 kcal mol−1 for Zn(II) complex, respectively. These values indicated that binding energy decreased upon coordination.
References
- J. Rare Earths. 2016;34(10):986.
- J. Mol. Str.. 2011;1002:113.
- J. Mol. Str.. 2014;1072(1):103.
- J. Mol. Str.. 2014;1084:36.
- Selective Toxicity: Physico-chemical Basis of Therapy (6th ed.). New York: Wiley; 1979.
- Med. Organomet. Chem.. 2010;32:219.
- Arabian J. Chem. 2019 In Press
- J. Phys. Chem. Solid. 2016;98:71.
- J. Organomet. Chem.. 2009;694:855.
- J. Mol. Str.. 2015;1081:175.
- Turk. J. Chem.. 2014;38:222.
- Spectrochim. Acta A. 2015;150:671.
- J. Chem. Commun.. 2009;5:493.
- J. Chem. Sci.. 2009;121(6):989.
- J. Curr. Opin. Chem. Biol.. 2008;12(2):197.
- J. Biomed. & Pharma.. 2017;89:162.
- Molecules. 2009;14(1):174.
- J. Phys. Chem. A. 2007;111:11116.
- J. Enzyme Inhib. Med. Chem.. 2004;19(5):417.
- J. Biol. Chem.. 2008;283(40):27007.
- Dennington, R., Keith, T., Millam, J., editors. 2009. GaussView, Version 5.0.8, R. KS: Dennington, Semichem Inc., Shawnee Mission.
- J. Photochem. & Photobio. B. 2016;162:115.
- J. Mol. Str.. 2015;1099:189.
- Spectrochim. Acta A. 2010;75:533.
- J. Mol. Str.. 2018;1156:91.
- J. Braz. Chem. Soc.. 2017;28(5):768.
- Appl. Organomet. Chem.. 2007;21(8):613.
- Frisch, M.J., et al., 2004. Gaussian 03, Revision C.01, Gaussian Inc, Wallingford CT.
- Mater. Sci. & Eng. C. 2018;83:78.
- Chem. Rev.. 2003;103(5):1793.
- J. Mol. Str.. 2017;1136:288.
- Turk. J. Chem.. 2014;38:521.
- Gribenko, A., Mosyak, L., Ghosh, S., Parris, K., Svenson, K., Moran, J., Chu, L., Li, S., Liu, T., Woods, V.L., Jansen, K.U., Green, B.A., Anderson, A.S., Matsuka, Y.V., 2013. J. Mol. Biol. 425, 3429.
- J. Braz. Chem. Soc.. 2015;26(7):1331.
- Turk. J. Chem.. 2011;35:393.
- Chem. Med. Chem.. 2006;1:551.
- Turk. J. Chem.. 2013;37:775.
- Nature. 1951;168(4285):1039.
- Spectrochim. Acta A. 2013;105:374.
- J. Cancer Res. Clin.. 1984;108(3):336.
- Turk. J. Chem.. 2015;39:939.
- J. Coord. Chem.. 2015;68(8):1374.
- J. Coord. Chem.. 2007;60(24):2671.
- Arabian J. Chem. 2010 In Press
- J. Therm. Anal. Calorim.. 2017;127(3):2149.
- Appl. Organomet. Chem.. 2017;31(12) e3858
- J. Coord. Chem.. 2017;70(20):3552.
- Appl. Organomet. Chem.. 2017;31(11) e3753
- Appl. Organomet. Chem.. 2017;32(2) e4051
- J. Therm. Anal. & Calorim.. 2016;124(2):1071.
- J. Braz. Chem. Soc.. 2017;28(1):87.
- Spectrochim. Acta A. 2005;61:1059.
- Turk. J. Chem.. 2006;30:361.
- Spectrochim. Acta A. 2015;145:76.
- American J. Chem. & Appl.. 2015;2(6):151.
- Arabian J. Chem. 2017 In Press
- J. Organomet. Chem.. 1989;54(6):1423.
- Appl. Organomet. Chem.. 1993;7(2):85.
- Chem. Rev.. 1988;88(6):899.
- Bull. Chem. Technol. Macedonia.. 2001;20(2):131.
- J. Mol. Str.. 2009;917:63.
- J. Photochem. & Photobio. B. 2017;178:428.
- J. Organomet. Chem.. 2011;696:3764.
- Proc. Natl. Acad. Sci. USA. 2011;108(32):13065.
- Acc. Chem. Res.. 2011;44(9):654.
- Arabian J. Chem. 2012 In Press
- Turk. J. Chem.. 2010;34:499.
- J. National Cancer Instit.. 1990;82(13):1107.
- Spectrochim. Acta A. 2013;107:8.
- Indian J. Chem. A. 2001;40(6):573.
- Spectrochim. Acta A. 2011;78:298.
- J. Organomet. Chem.. 2001;628:123.
Appendix A
Supplementary material
Supplementary data to this article can be found online at https://doi.org/10.1016/j.arabjc.2020.03.017.
Appendix A
Supplementary material
The following are the Supplementary data to this article:Supplementary data 1
Supplementary data 1
Supplementary data 2
Supplementary data 2
Supplementary data 3
Supplementary data 3


