

Translate this page into:
Biomimetic synthesis of CuInS2 nanoparticles: Characterization, cytotoxicity, and application in quantum dots sensitized solar cells
⁎Corresponding author. jose.perez@unab.cl (J.M. Pérez-Donoso)
-
Received: ,
Accepted: ,
This article was originally published by Elsevier and was migrated to Scientific Scholar after the change of Publisher.
Abstract
Abstract
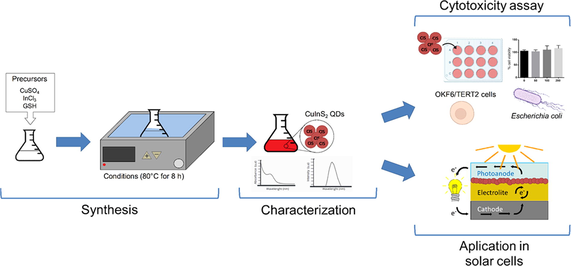
Mild biomimetic method for the synthesis of CuInS2 nanoparticles using the biological molecule glutathione as sulfur source and stabilizing agent. The aqueous synthesis is performed at low temperatures, under aerobic conditions and atmospheric pressure. Synthesized CuInS2 nanoparticles are non-toxic and work as efficient photosensitizers in solar cells.
Abstract
CuInS2 (CIS) nanoparticles have unique chemical, toxicological and optoelectronic properties that favor their technological applications. In the present work we report a novel one step biomimetic method for the aqueous synthesis of CIS nanoparticles, that is also low cost and environmentally friendly. This biomimetic method uses only CuSO4 and InCl3 as precursor salts, and the biological molecule glutathione as sulfur donor and stabilizer of the nanoparticles (NPs). The reaction is performed at low temperatures, under aerobic conditions and atmospheric pressure. CIS nanoparticles produced by our biomimetic method exhibit fluorescence emission between 650 and 700 nm when excited at 500 nm. A size between 10 and 15 nm was determined by Dynamic light scattering (DLS) and corroborated by electron transmission microscopy. X-ray diffraction analysis (XRD) confirmed the crystalline structure of the CIS NPs produced. Energy Dispersive X-Ray Spectroscopy (EDX) analyses revealed the presence of Cu, In, and S in a 0.6: 1.4: 2 ratio, which has been reported for other CIS NPs in literature. No cytotoxicity of CIS NPs was observed in human OKT6/TERT2 cells and bacteria. Besides, the potential application of biomimetic CIS NPs as photosensitizers in quantum dots sensitized solar cells (QDSSCs) was confirmed. The biocompatibility, spectroscopic properties, and energy harvesting performance in solar cells of the CIS NPs produced by our biomimetic method make them suitable for their use in different biotechnological applications.
Keywords
Biomimetic synthesis
CIS
Photosensitizer
QDSSC
Glutathione

1 Introduction
CuInS2 nanoparticles (CIS NPs) are chalcopyrite-type ternary semiconductors that belong to a group of nanomaterials known as semiconductor fluorescent nanoparticles or quantum dots (QDs). QDs display size-dependent spectroscopic properties such as absorption and emission spectra (Xiong et al. 2013; Leach and Macdonald, 2016).
CIS NPs absorb light in the visible spectrum, showing fluorescence emissions in the visible and near-infrared region, and a direct bandwidth between 1.5 and 2 eV. These optical properties make CIS nanoparticles excellent candidates for different technological applications such as biomedicine and solar cells (Ilaiyaraja et al. 2018; Jain et al. 2020; Tsolekile et al. 2017).
In photovoltaic devices, CIS NPs act as photosensitizers with a broad absorption range and as consequence, a great capacity to capture light (Du et al. 2019; Pan et al., 2018). Also, the generation of solar cells based on lead/cadmium-free photosensitizers represents another advantage of CIS NPs.
In general, the toxicity of QDs has been associated with several factors, like the type of solvent used in the synthesis, nanoparticle coating, and particularly the metals composing the nanocrystal (Girma et al. 2017). In this sense, CIS nanoparticles represent a promising solution to the cytotoxicity issues that characterize most QDs constituted by heavy metals such as Cd, Pb, or Te (Tsolekile et al. 2017).
To date, there is scarce research about the toxicological effect of CIS QDs. However, existing studies indicate that there are no toxicological effects when used for bioimaging. In this sense, Zou et al., 2019 reported no changes of body weight, hematology, blood biochemistry, organ histology, and biodistribution when PEGylated CuInS2/ZnS were administered to mice. Chen et al., 2020 evaluated the immunotoxicology effect and demonstrated that they produce 10 times less inflammation than CdTe QDs. Chen et al., 2015 also demonstrated that pure CIS and CuInS2/ZnS QDs do not have citotoxical effects in the model organism Caenorhabditis elegans.
In recent years, several works describing chemical methods for the synthesis of CIS NPs have been published, most of them based in solvothermal, hot injection, microwave irradiation, and hydrothermal processes (Kharkwal et al., 2014; Belgacem et al., 2018; Chumha et al. 2018; Vahidshad et al. 2013; Hosseinpour-Mashkani et al., 2012; Hosseinpour-Mashkani et al, 2013; Hosseinpour-Mashkani et al., 2014; Salavati-Niasari et al., 2015a; Salavati-Niasari et al., 2015b). Despite this significant advance, chemical synthesis of CIS NPs still present some environmental, safety and costs issues. Those issues are mainly related to the use of high temperatures, inert atmospheres, and organic solvents in the process (Mobarak et al. 2008; Peng et al. 2016). Therefore, there is an increasing interest in developing methods for the production of CIS NPs involving mild conditions and biological molecules.
In the case of QDs based on metals (such as Cd and Te), some green processes based on biomolecules, and conditions resembling those found on biological systems (biomimetic synthesis) have been described (Pérez-Donoso et al., 2012- He & Ma, 2013). Recently, new methods to synthesize CIS NPs using glutathione and cysteine as reducing agents have been reported (Arshad et al., 2019; Mir et al., 2018; Mousavi-Kamazani, 2018; Tsolekile et al. 2020). However, they still require high temperatures, pressure, radiation, or the addition of sodium sulfide for nanoparticle formation. Also, a room temperature method to synthesize CIS NPs using the enzyme cystathionine γ-lyase has been reported (Spangler et al., 2017). This reaction produces H2S from cysteine, but it requires extra steps associated with the production and purification of the cystathionine γ-lyase.
In the present work, we describe for the first time a biomimetic method for the synthesis of CIS QDs, a green chemistry method that preserves some biological qualities in a chemical process (Vincent et al., 2006), and does not require enzymes, radiation, anaerobic environments, or high temperatures. Besides, unlike current synthesis methods, we designed a simple one-step procedure in which all precursors are added together and then heated for synthesis. The reaction is performed at low temperatures, under aerobic conditions and atmospheric pressure, without radiation, and requires simple precursors; copper and indium salts as metal precursors, and the biological molecule glutathione as S2− donor and stabilizer of the nanocrystal. Spectroscopic properties, size, structure, and composition of biomimetic CIS nanoparticles were characterized. The cytotoxicity of the biomimetic CIS NPs was evaluated in bacteria and a eukaryotic cell line. Also, the performance of biomimetic CIS as photosensitizers in quantum dots sensitized solar cells (QDSSCs) was determined.
Altogether, presented results establish biomimetic synthesis as a low cost and eco-friendly method to produce CIS NPs with high potential for its application in biomedicine and solar cells.
2 Materials and methods
2.1 Materials
Copper chloride (CuCl2) and ultrapure water were purchased from Winkler. Copper sulfate (CuSO4), copper nitrate (Cu(NO3)2), indium chloride (InCl3), reduced L-glutathione (GSH), sodium hydroxide (NaOH) and titanium oxide nanoparticles (TiO2, 21 nm size, and anatase crystal structure) were purchased from Sigma-Aldrich. Rhodamine B was purchased from Merck. All chemicals were used directly without any further purification.
2.2 Synthesis of CIS nanoparticles
Solutions of CuSO4 (2 mM) and InCl3 (8 mM) were mixed with GSH (40 mM) in distilled water, the pH was adjusted to 9.0 and the mixture was incubated eight hours at 80 °C in a thermoregulated bath. To remove the unreacted components, the solution was dialyzed using cellulose membranes (14 kDa) and deionized water. Finally, the solution with the NPs was lyophilized using an SP Scientific Virtis Benchtop Sentry 2.0 lyophilizer. Purified and concentrated nanoparticles were used for further characterizations.
2.3 Characterization of nanoparticles
2.3.1 Spectroscopic properties
Absorption and fluorescence spectra were measured on a Synergy H1M multiple-well plate reader (Biotek) as previously described by Pérez-Donoso et al. 2012. The fluorescence emission spectra ranging from 530 to 900 nm (exciting at λ 500 nm) were measured in a Varian Cary-Eclipse luminescence spectrometer (Mulgrave, Australia), equipped with a xenon flash lamp. A Starna (Essex, England) quartz cell with a 3 mL inner volume and a 10 × 10 mm light path was used. The widths of the excitation and emission slits were 10 nm.
The quantum yield (QY) of biomimetic NPs was determined following the protocol previously described by Carrasco et al. (2021) and Venegas et al. (2017). CIS NPs were dissolved in distilled water, and Rhodamine B in ethanol (QY = 56%) (Merck KGaA, Darmstadt, Germany). Different samples with absorbance values between 0.01 and 0.1 A.U. under excitation at 510 nm were prepared. Fluorescence spectra were registered and the integrated fluorescence intensity (IFI) calculated. Then, IFI was plotted versus the absorbance of solutions (CIS NPs and Rhodamine B). The slope for each curve (m CIS NPs: 1.235x10 006, and mR Rhodamine B: 84140) and the refractive index of each solvent (n water: 1.3290, and nR ethanol: 1.3571) were used to calculate CIS NPs QY considering Rhodamine B as reference. In this case, the QY can be calculated using: QYNPs = QYR[mNPs/mR][nNPs/n2R].
2.3.2 Transmission electron microscopy
Transmission electron microscopy (TEM) images were obtained with a Hitachi model HT7700 operated at 200 kV, operated in transmission and scanning mode. For analysis, 2 µL of a 8 mg/mL NPs solution were deposited on a HC300 Au-grid using a Beryllium slide.
Micrographs were processed by ImageJ 1.51 j8 software package for morphology studies and analyzed by Origin 2016 B 9.3.226 software package for nanocrystal size. The chemical composition of the nanoparticles was determined by energy dispersion X-ray spectroscopy (EDX) using an EDAX detector attached to the TEM FEI Tecnai G2 F20 S-Twin, which allows to perform punctual EDX analysis.
2.3.3 Powder X-ray diffraction
Powder X-ray diffraction (XRD) was measured with a Bruker D8 diffractometer operating with Cu Kα radiation (λ = 1.5418 Å). XRD data was analyzed using the CIS chalcopyrite card (JCPDF: ID. 65-1572).
2.3.4 Dynamic light scattering
The hydrodynamic size of CIS nanoparticles was determined by dynamic light scattering (DLS) in a Zetasizer Nano ZS, the dispersion of the nanoparticles was measured in distilled water.
2.3.5 Fourier transform infrared spectroscopy (FTIR)
FTIR was performed on a Thermoscientific Nicolet iS10 IR equipment using the OMNIC9 program to determine the vibrational stretching peaks. The ORIGIN program was used to plot the data
2.4 Toxicity of CIS nanoparticles
2.4.1 MTS viability assay
25,000 OKT6/TERT2 cells were seeded per well in a 96-multiwell plate and incubated 24 h at 37 °C in 5% CO2. CIS NPs were suspended in phosphate-buffered saline (PBS) and added to OKF6/TERT2 cells at different concentrations (50, 100, and 200 µg/mL). After incubation for 24 h, cell monolayers were washed. Then, the viability of OKF6/TERT2 cells was measured using the CellTiter 96 cytotoxicity assay (Promega). The percentage of viability was calculated as follows: (Optical density 490 nm of CIS NPs incubated cells/Optical density 490 nm of control cells) × 100.
2.4.2 MIC of CIS NPs on Escherichia coli
Growth minimal inhibitory concentrations (MIC) of biomimetic CIS NPs were determined in 96-well plates using Escherichia coli BW25113 cultures. 5 µL of an overnight E. coli culture (Absorbance 600 nm = 1) were used to inoculate 100 µL LB solutions containing biomimetic CIS nanoparticles at 2000, 1000, 800, 400, 200, or 100 µg/mL. Cultures were incubated at 37 °C during 24 h in darkness, and then absorbance was measured at 600 nm to evaluate bacterial growth. E. coli growing in LB medium without NPs was used as a positive control.
2.5 Characterization of CIS NPs as photosensitizers in quantum dot sensitized solar cells
QDSSCs were produced following a protocol previously described by our group with some modifications (Órdenes-Aenishanslins et al., 2016; Órdenes-Aenishanslins et al., 2020). For the construction of the cells, 20 × 20 × 2 mm TEC15 fluorine-doped tin oxide coated glass (FTO glass) with a surface resistivity of 13 [Ω/sq], and a transmittance of 85% was used. The glasses were cleaned by sonication in absolute ethanol and ultrapure water to remove any residue. Cathode (counter electrode) was prepared using a solution of H2PtCl6 (50 mM) in isopropanol and deposited on the FTO by spin coating; the glass was then heated at 400 °C for 20 min, the process was repeated four times without modified atmosphere. The anode (electrode) was prepared using a TiO2 nanoparticle solution; this was deposited by spin coating (0.2 xg for 5 s) and repeated 2 times (2 layers of TiO2). The sintering was performed at 465 °C during 20 min, thus creating an active area of 1 cm2. The sensitization of the TiO2 layer was carried out by direct adsorption of the CIS nanoparticles. Briefly, 30 µL of a prepared CIS NPs solution (8 mg/mL) in ultra-pure water was added onto the TiO2 layer. The final content of CIS NPs in the TiO2 layer was 240 µg. The cell assembly was carried out by adding 14 µL of the electrolyte to the electrode (TiO2 layer sensitized with nanoparticles), the counter electrode was placed on it, and the cell was subsequently sealed. The electrolyte solution used was sulfide/polysulfide (S2−/Sn2−) (NaOH 0.1 M, Na2S 1.0 M, and S 0.1 M in ultrapure water).
The cells were characterized in a solar simulator (SunLite ™ Model 11002. Abet Technologies, Inc.) under standard conditions of temperature and irradiation, with a light intensity of 100 mW·cm−2 and AM1.5.
3 Results and discussion
3.1 Synthesis and characterization of CIS NPs
The biomimetic synthesis of CIS NPs was performed using water as a solvent, and a solution of copper sulfate and indium chloride as metal precursors. Different glutathione (GSH) concentrations were evaluated (20, 40, 60, and 80 mM) to determine the conditions favoring the production of QDs. CIS NPs formation was determined by assessing the generation of a characteristic, red-colored solution at different incubation times. Our results revealed that in the presence of 20 mM GSH, the color of the synthesis solution changed from light yellow to green. No evidence suggesting the synthesis of CIS NPs was observed in this condition (Fig. 1A). A different situation was observed when the synthesis reaction was performed in the presence of higher GSH concentrations, observing that the color of the reaction changes from yellow to orange and finally dark red after 8 h of synthesis (Fig. 1D-G-H). As previously reported, this change in coloration is evidence of the generation of CIS NPs (ilaiyaraja et al., 2018; Arshad et al., 2019).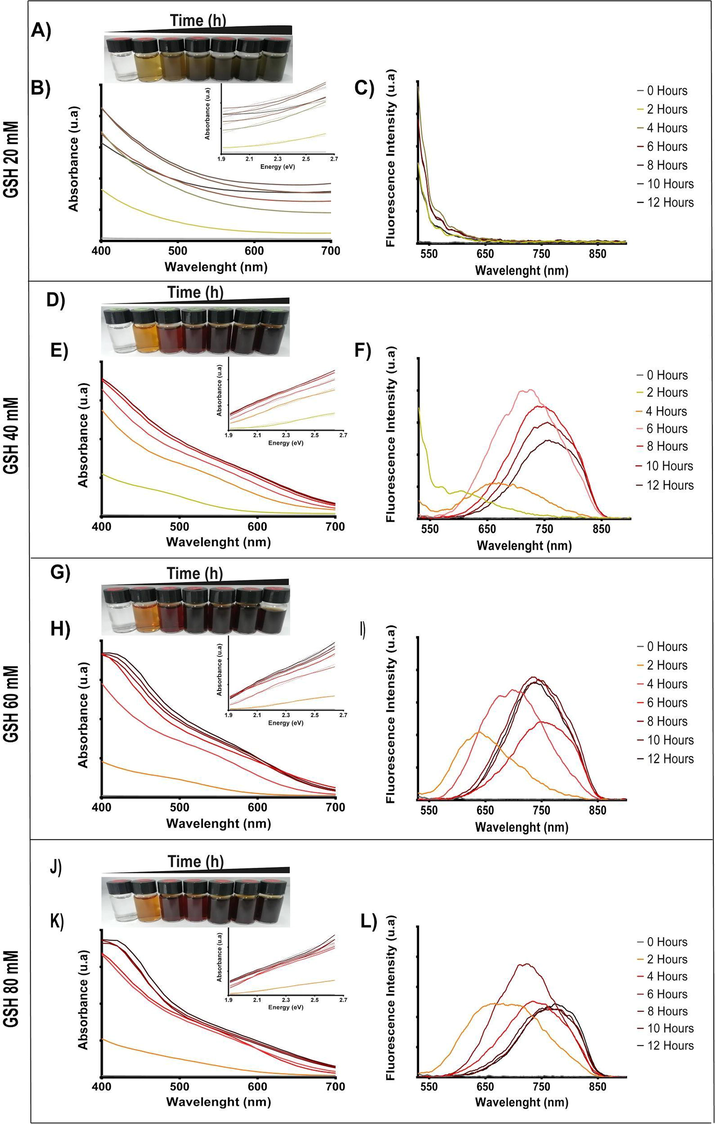
CIS NPs formation kinetics at increasing GSH concentrations. The biomimetic synthesis reactions were performed using 2 mM copper sulfate, 8 mM Indium chloride, and increasing concentrations of GSH: 20 mM (A), 40 mM (D), 60 mM (E) and 80 mM (J). The spectra of each reaction was measured at 2, 4, 6, 8, 10, and 12 h. The absorbance and fluorescence spectra obtained for each condition are shown in figures: C-D) for 20 mM of GSH, E-F) for 40 mM of GSH, H-I) for 60 mM of GSH and K-L) for 80 mM of GSH.
The spectroscopic properties of the synthesis reaction were measured from aliquots obtained at different times (1–12 h). As expected, no absorption or fluorescence emission peaks were observed in the synthesis reaction using 20 mM GSH (Fig. 1B-C), confirming the absence of CIS NPs in this condition. In contrast, the fluorescence emission spectra of reactions performed using GSH 40, 60 and 80 mM confirmed the presence of peaks corresponding to CIS NPs (650–750 nm). This is most probably consequence of the high requirement of GSH molecules for the synthesis to occur, since GSH is required as a reducing agent and a sulfide source in the synthesis reaction of metal sulphide nanomaterials (Arshad et al. 2019; Arshad et al. 2016; Mazing et al. 2018).
The QDs-characteristic shift in emission peaks was clearly observed in the spectra obtained in these conditions (Fig. 1D-L). Also, an absorbance peak near 500 nm was obtained in these aliquots. The bandgaps were measured for the CIS NPs produced after 8 h synthesis. Band gaps of 1.621, 1.647, and 1.636 eV were determined for CIS NPs produced in presence of 40, 60, and 80 mM GSH, respectively (Fig. 1E-F, H-I, K-L). The band gap values obtained are in agreement with those previously reported for CIS NPs, ranging from 1.5 to 2 eV (ilaiyaraja et al., 2018; Xia et al., 2018). In synthesis reactions using 40, 60 and 80 mM GSH we observe the characteristic time-dependent red emission shifts previously reported for CIS NPs (from 600 to 800 nm) (Peng et al., 2016; Tsolekile et al. 2020). In synthesis reactions using 60 mM and 80 mM GSH (Fig. 1I-L), those peaks are observed after 2 h synthesis, while in reactions involving 40 mM GSH (Fig. 1F), the emission peaks are observed after 4 h synthesis. Performing the synthesis in presence of 40 mM GSH allows to obtain clearly defined emission spectra in the aliquots obtained at different incubation times (all of them display different emission peaks) (Fig. 1F). These spectroscopic characteristics are particularly relevant for technological applications of QDs, particularly those related with imaging and optoelectronics. Based on this and considering the simplicity and costs of using a lower GSH concentration, we decided to continue our study characterizing the CIS NPs produced by our biomimetic method in presence of 40 mM GSH.
To determine if the use of other copper sources can improve the synthesis reaction, copper sulfate was replaced by copper nitrate or copper chloride, and the production of CIS NPs was evaluated after 8 h reaction. The characteristic absorbance and fluorescence spectra of CIS NPs produced in presence of the three Cu-sources were determined (Fig. 2A). The synthesis performed using copper sulfate presented a slightly higher fluorescence emission.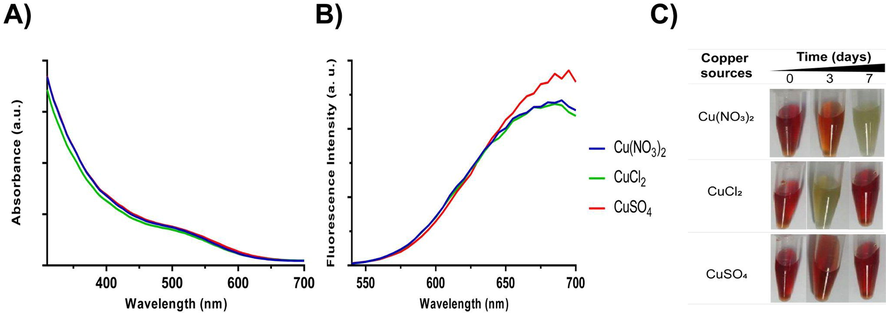
Synthesis of CIS NPs using different copper sources. The biomimetic synthesis was performed during 8 h using indium chloride (8 mM), GSH (40 mM), and different copper salts (2 mM). A) Absorbance and B) fluorescence spectra of CIS NPs produced using Cu(NO3)2, CuCl2, or CuSO4. C) Stability of CIS NPs after 3 and 7 days.
The time stability on aqueous solution of biomimetic CIS NPs produced using either Cu(SO4), CuCl2 or Cu(NO3) was also determined. NPs were stored in darkness for 7 days, and afterwards the color of the solution was evaluated. Interestingly, CIS NPs produced using CuCl2 or Cu(NO3) lost its color on day 3, and turn uncolored at day 7, a result that suggests nanoparticle instability. On the other hand, biomimetic CIS NPs produced with Cu(SO4) maintained its color and spectroscopic characteristics even after seven days (Fig. 2B). In most methods reported to date, the Cu source used for CIS synthesis is copper chloride or copper nitrate (Benchikhi et al. 2016; Mousavi-Kamazani, 2018; Mazing et al. 2018). In our biomimetic method, SO42− may act as a capping agent helping to stabilize the CIS NPs, as has been previously reported for other NPs (Di Gianvincenzo et al., 2010; Cheng et al., 2014). Taking in consideration the highest fluorescence emission peaks and aqueous stability, we determined that the best synthesis condition was the reaction involving CuSO4 as a precursor salt, and 40 mM from GSH.
The quantum yield (QY) determined for the CIS NPs produced in this reaction was 8.05%. This result is comparable with QY values obtained with CIS QDs produced by other methods: 5.0% and 8.8% (Shei et al. 2015), and 9.4% (Min et al. 2015). Unlike biomimetic CIS NPs, those QDs were produced at high temperatures (200, 250, and 240 °C, respectively) and under N2 atmosphere.
The structure and composition of CIS NPs produced by the biomimetic method were obtained using XRD, EDX, TEM, DLS, and FTIR. The XRD diffractogram shown in Fig. 3A reveals that CIS NPs exhibited a tetragonal crystalline structure, based on the three main peaks at 27.93, 46.55 and 55.01° indexed as (112), (204/220), and (116) (Buchmaier et al. 2016; Jindal and Giripunje, 2017; Shen et al. 2011). The EDX elemental analysis indicated the presence of copper, indium and sulfur with atomic percentages of 0.6, 1.4, and 2, respectively (Fig. 3B). The stoichiometry obtained for the CIS NPs by EDX punctual analysis revealed a copper deficit compared to the 1–1 − 2 expected stoichiometry previously reported (Liu et al. 2012; Mir et al. 2018). However, several studies have reported CIS syntheses having a higher amount of indium than copper, as in this case (Lu et al. 2018; Tsolekile et al. 2020). As expected, the EDX analysis also evidenced the presence of C, O, and N on the NPs. This result confirms the presence of some biomolecules bound to the nanocrystal, which may correspond to GSH acting as a capping and stabilizer on aqueous solution. These roles of GSH have been reported previously for CdTe-GSH NPs produced by a biomimetic method (Pérez-Donoso et al., 2012).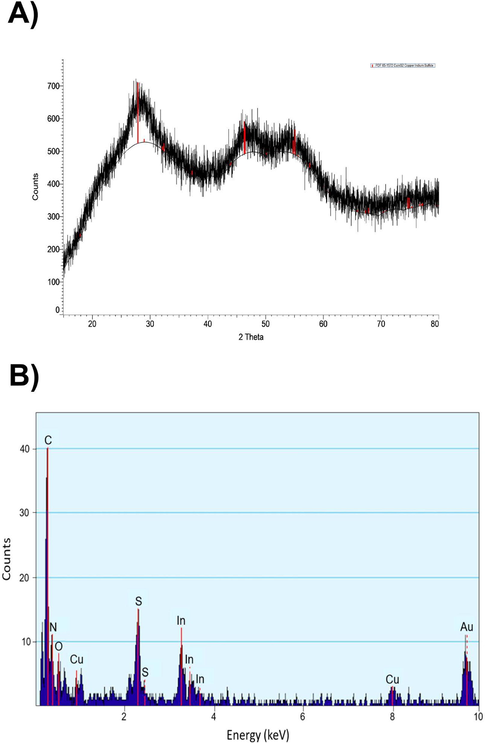
Structural and elemental characterization of CIS NPs. A) XRD analysis of CIS NPs. Blackline represents the diffraction pattern of synthesized NPs. The red bars represent a simulated diffraction pattern of CIS. B) Elemental composition of CIS NPs determined by EDX.
The size and morphology of biomimetic CIS NPs were determined by TEM. Nanospheres with a size below 50 nm were determined (Fig. 4 A-B). A size histogram derived from the micrographs revealed that biomimetic CIS NPs present an average size of 33.5 ± 0.25 nm (Fig. 4C). In general, the size reported for CIS NPs produced by different syntheses procedures exhibit great dispersion, ranging from 2 − 300 nm (Li et al. 2012 -Chumha et al., 2018). The size of the NPs obtained by our biomimetic method is very uniform in comparison, which is essential to control the spectroscopic properties of CIS NPs (Benchikhi et al., 2016; Mousavi-Kamazani et al., 2015). Moreover, size homogeneity is particularly relevant for biomedical applications, as certain sizes can enhance the cytotoxic effect through the accumulation of the NPs (Ganguly et al., 2018). Regarding the hydrodynamic size, a DLS analysis indicated an average size of 38.9 nm with a monodisperse distribution and a Pdi of 0.455 (supplementary material Figure S1). This result is in agreement with TEM determinations and suggest the presence of an organic layer on the surface of CIS NPs.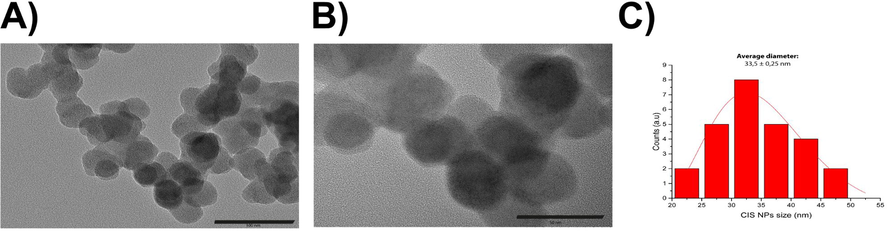
TEM of biomimetic CIS nanoparticles A). Panoramic micrograph of biomimetic CIS NPs (100 nm bar scale). B) Biomimetic CIS NPs (50 nm bar scale). C) Size distribution histogram of CIS NPs (n = 26). The red line corresponds to the log-normal fit.
The characterization of the organic molecules present on CIS NPs was evaluated by FTIR (Fig. 5). Considering the presence of GSH in the synthesis, the EDX results (showing the presence of C, O and N), and the high aqueous solubility of the CIS NPs obtained, we focused on confirming the presence of GSH on the biomimetic NPs produced. The FTIR spectra of synthesized NPs (red color) and GSH (black color) were obtained (Fig. 5). In the GSH spectrum, the presence of peaks near 3112 cm−1, corresponding to the characteristic vibrational stretching of NH, provides evidence of an –NH2 group. At 2521 cm−1, the classic SH stretching corresponding to the thiol group of GSH is observed. In addition to the presence of vibrational stretching at 1658 cm−1 and 1332 cm−1 for the asymmetric and symmetric COO– (respectively), signals at 1553 cm−1 and 1073 cm−1 corresponding to NH and CN are observed. The presence of these signals indicates that the main functional groups of GSH are present (Mir et al., 2018; Arshad et al., 2016; Pérez-Donoso et al., 2012). In the FTIR spectrum of biomimetic CIS NPs, the stretching at 2521 cm−1 corresponding to SH is not observed, which could reflect the existence of a bond between the thiol group of GSH and the CIS nanoparticle. Besides, the spectrum of CIS NPs shows the vibrational stretching associated with other functional groups of GSH such as amines (Amide II) and carboxyl (COO−), indicating their presence in the nanoparticle, in a similar way to those reported in other works that used GSH to synthesize NPs (Arshad et al., 2019).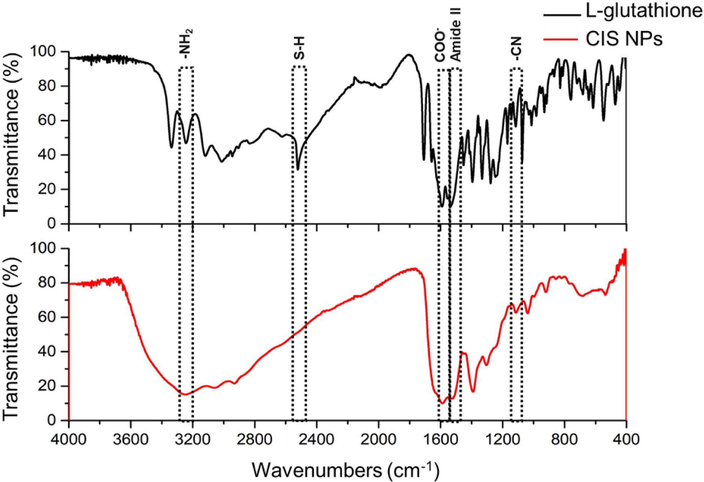
FTIR analysis of biomimetic CIS NPs. The red line corresponds to the CIS NPs and the black line to GSH. The most relevant peaks are indicated.
3.2 Cytotoxicity of CIS QDs
A relevant feature affecting the application and technological potential of nanomaterials is their toxicity. Based on this, we evaluated the toxicity of biomimetic CIS NPs in human and bacterial cells.
To determine the toxicity of NPs in human cells, we measured the viability of epithelial cells (OKT6/TERT2 line) exposed to CIS NPs. MTS assays showed that biomimetic NPs did not affect the viability of epithelial cells at concentrations of 50–200 µg/mL (Fig. 6A). Even when we assayed higher concentrations (400 and 500 µg/mL), there was no reduction in the cell viability (not shown). As expected, the exposure to DMSO (a control for cell death) decreases the cell viability up to 60% (Fig. 6A).
Cytotoxicity of biomimetic CIS NPs in an epithelial human cell line and bacteria. A) OKT6/TERT2 cells were incubated 24 h in presence of CIS NPs (50, 100, and 200 µg/mL). DMSO was used as a control to induce cell death (death control). B) Effect of different concentrations of CIS NPs on the growth of E. coli (OD 600 nm). Values that differ significantly from non-stimulated cells are indicated (One-way ANOVA, p-value < 0.001).
Obtained results suggest that biomimetic CIS NPs are highly innocuous for human cells. This is in agreement with previous reports showing high biocompatibility on cell lines (Speranskaya et al., 2016; Chen et al., 2015; Nikazar et al., 2020). In this context, using MTT assays, it was shown that CuInS2/ZnS NPs are not cytotoxic in HeLa cells (Foda et al., 2014). Also, using flow cytometry, it was shown that CuInS2-ZnS-AFP produce low cytotoxicity in hepatic epithelial cells HepG2 (Yang et al., 2016). Moreover, it was determined that CuInS2/ZnS core/shell quantum dots do not cause cell death in THP1 cells, which is relevant for bioimaging applications (Spangler et al., 2017). In the same context, in vivo experiments performed in Balb-c mouse showed very low toxicity, since no histological changes were observed in several organs obtained from mice treated with PEGylated CuInS2/ZnS nanoparticles (Zou et al., 2019).
Bacterial toxicity of biomimetic CIS NPs was also determined in E. coli cells (Fig. 6B). In agreement with the results observed in OKT6/TERT2, no cytotoxicity was observed when bacterial cells were exposed to CIS NPs, even at high concentrations such as 1000 µg/mL. Courtney et al., 2016 reported that the effect of CIS NPs on E. coli growth was related with the bandgap of the NPs. Bacterial growth was favored in presence of NPs with a bandgap of 1.9 eV (Courtney et al., 2016). No cytotoxicity has been determined in E. coli cells exposed to chemically synthesized CIS NPs, even at high concentrations (up to 1 µM) (Pathakoti et al., 2013).
3.3 Biomimetic CIS NPs as a photosensitizer in QDSSCs
Based on optical properties, the band gap, and QY determined for the biomimetic CIS NPs, we decided to evaluate its performance as photosensitizer in Quantum Dots Sensitized Solar Cells (QDSSCs). QDSSCs are constituted by a platinum counter electrode (cathode), a TiO2 layer where the QDs photosensitizers are incorporated as an electrode (anode), and the electrolyte located between the cathode and the anode. The incorporation of CIS NPs generates an improvement in all photovoltaic parameters such as voltage, current and efficiency. The current–voltage curves of the constructed cell (supplementary material Figure S2) show that the photovoltaic device presents the characteristic shape expected for QDSSCs.
Obtained photovoltaic parameters of solar cell sensitized with CIS NPs and TiO2 NPs as control are summarized in Table 1. An increase in two orders of magnitude in efficiency was determined compared with the control cell containing TiO2 NPs (efficiency of 0.1203% v/s 0.0015%). The efficiency values obtained for the CIS NPs are comparable with those reported in previous works (Li et al., 2012; Peng et al., 2016; Ilaiyaraja et al., 2018; Mousavi-Kamazani, 2018).
Cell
Voc (V)
Isc (A)
Pmax (W)
FF
Efficiency (%)
TiO2
0.159
1.050 × 10⁻⁵
1.547 × 10⁻⁶
0.928
0.0015
CIS
0.347
8.562 × 10⁻⁴
1.204 × 10⁻⁴
0.405
0.1203
In general, efficiency values reported for solar cells photosensitized with CIS are in the range between 0.1 and 5% (Ilaiyaraja et al., 2018; Pan et al., 2014). Differences in cell efficiency can be a consequence of nanoparticle coating, cathode used (copper, platinum, cobalt, lead, etc.), and the technique used to photosensitize the TiO2 layer that corresponds to the electrode, among others (Du et al., 2019). Other works report efficiencies between 0.5 and 0.7% by sensitizing the TiO2 layer using Doctor Blade’s technique with a paste of CIS NPs (Mousavi-Kamazani, 2018). Efficiencies near 2% have been obtained by directly synthesizing the CIS nanoparticles on the TiO2 layer (Mahjoub et al., 2017). The electrodeposition of the CIS NPs generates solar cells with efficiencies between 0.4 and 1.1% (Peng et al., 2016). The most common technique used is sensitization by immersion of the electrode the TiO2 layer in which efficiencies of 0.1–3.5% (Ilaiyaraja et al., 2018), 0.3% (Li et al., 2012), and 4% (Peng et al., 2020). This technique can also be performed by deposition of the NPs solution on the TiO2 layer, instead of submerging the full electrode. Using that method, the reported efficiencies ranged between 4.8 and 5.05% (Pan et al., 2014). However, values obtained with the electrode immersion method used CIS NPs with a 3-mercaptopropionic acid modified surface. In this context, it is interesting to note that efficiencies of QDSSCs based on CIS NPs are affected by the synthesis method and the technique used to incorporate the sensitizer. The biomimetic method for CIS NPs synthesis proposed has advantages over other chemical methods in terms of costs and mild conditions used, however some improvements are still required to improve their use in solar cells and the photovoltaic parameters obtained.
4 Conclusion
This is the first report of a one-step and eco-friendly biomimetic method to synthesize CIS QDs. The method only requires two metal salts, the biological molecule GSH, and the aqueous synthesis is performed at low temperatures, aerobic conditions, and atmospheric pressure.
We validate the potential of synthesized CIS NPs to be applicated in bioimaging and biomedicine, since NPs showed high aqueous solubility and no toxicity to the epithelial human cell line (OKT6/TERT2) and E. coli. We also demonstrate that biomimetic CIS QDs works as a photosensitizer in solar cells.
Finally, considering the low cost, mild conditions, simplicity of the process, absence of toxicity and photosensitizing capacity, biomimetic CIS NPs represents excellent candidates to evaluate production scaling potential and to optimize their properties for specific technological applications such as solar cells, bioimaging, and biomedicine, among others.
Acknowledgments
This work was supported by Erika Elcira Donoso Lopez, Fondecyt 1200870 (JMP-D) and 3170718 (C.P.Q), CONICYT scholarship 21171644 - 2017 (J.C.G.), INACH RT-25_16 (JMP-D) and FP_02-17 (C.P.Q). We would like to thank Edwar Fuentes from FCQyF, Universidad de Chile, for facilitating the fluorimeter.
In the loving memory of Claudio Vásquez Guzmán, an excellent friend, mentor, and scientist, but a better human being. Thanks for all the adventures and for showing us the beauty of science and friendship.
Declaration of Competing Interest
The authors declare that they have no known competing financial interests or personal relationships that could have appeared to influence the work reported in this paper.
References
- Aqueous synthesis of tunable fluorescent, semiconductor CuInS2 quantum dots for bioimaging. Arabian J. Chem.. 2019;12(8):4840-4847.
- [Google Scholar]
- One-pot aqueous synthesis of highly biocompatible near infrared CuInS2 quantum dots for target cell imaging. Chin. J. Chem .. 2016;34(6):576-582.
- [Google Scholar]
- CuInS2 thin films obtained through an innovative CSVT deposition method from solvothermal-generated precursors. Mater. Sci. Semicond. Process.. 2018;83:224-230.
- [Google Scholar]
- Synthesis and characterization of CuInS2 nanocrystals prepared by solvothermal/molten salt method. Ceram. Int.. 2016;42(9):11303-11308.
- [Google Scholar]
- Room temperature synthesis of CuInS 2 nanocrystals. RSC Adv.. 2016;6(108):106120-106129.
- [Google Scholar]
- Production of cadmium sulfide quantum dots by the lithobiontic Antarctic strain Pedobacter sp. UYP1 and their application as photosensitizer in solar cells. Microb Cell Fact. 2021;20:41.
- [Google Scholar]
- Photoexcited quantum dots for killing multidrug-resistant bacteria. Nat. Mater.. 2016;15(5):529-534.
- [Google Scholar]
- Evaluations of the chemical stability and cytotoxicity of CuInS2 and CuInS2/ZnS core/shell quantum dots. The Journal of Physical Chemistry C. 2015;119(5):2852-2860.
- [Google Scholar]
- In vitro and in vivo immunotoxicity of PEGylated Cd-free CuInS2/ZnS quantum dots. Nanotoxicology. 2020;14(3):372-387.
- [Google Scholar]
- Green synthesis of chondroitin sulfate-capped silver nanoparticles: Characterization and surface modification. Carbohydr. Polym.. 2014;110:195-202.
- [Google Scholar]
- Cyclic microwave radiation synthesis, photoconductivity, and optical properties of CuInS2 hollow sub-microspheres. Appl. Surf. Sci.. 2018;447:292-299.
- [Google Scholar]
- Gold nanoparticles capped with sulfate-ended ligands as anti-HIV agents. Bioorganic Med. Chem. Lett.. 2010;20:2718-2721.
- [Google Scholar]
- Performance improvement strategies for quantum dot-sensitized solar cells: a review. J. Mater. Chem. A. 2019;7(6):2464-2489.
- [Google Scholar]
- Biocompatible and highly luminescent near-infrared CuInS2/ZnS quantum dots embedded silica beads for cancer cell imaging. ACS Appl. Mater. Interfaces. 2014;6(3):2011-2017.
- [Google Scholar]
- Toxicity of nanomaterials: Exposure, pathways, assessment, and recent advances. ACS Biomater. Sci. Eng.. 2018;4(7):2237-2275.
- [Google Scholar]
- Synthetic strategies and biomedical applications of I-III–VI ternary quantum dots. J. Mater. Chem. B. 2017;5(31):6193-6216.
- [Google Scholar]
- CuInS2 quantum dot sensitized solar cells with high VOC≈ 0.9 V achieved using microsphere-nanoparticulate TiO2 composite photoanode. Sol. Energy Mater. Sol. Cells. 2018;178:208-222.
- [Google Scholar]
- I-III-VI core/shell QDs: Synthesis, characterizations and applications. J. Lumin.. 2020;219:116912
- [Google Scholar]
- Exploitation of inimitable properties of CuInS2 quantum dots for energy conversion in bulk heterojunction hybrid solar cell. Mater. Res. Express. 2017;4(11):115506
- [Google Scholar]
- Biomimetic Synthesis of Fluorogenic Quantum Dots for Ultrasensitive Label-Free Detection of Protease Activities. Small. 2013;9(15):2527-2531.
- [Google Scholar]
- Microwave-assisted synthesis and photovoltaic measurements of CuInS 2 nanoparticles prepared by using metal-organic precursors. Mater. Res. Bull.. 2012;47:3148-3159.
- [Google Scholar]
- CuInS2 nanoparticles: Microwave-assisted synthesis, characterization, and photovoltaic measurements. Mater. Sci. Semicond. Process.. 2013;16:390-402.
- [Google Scholar]
- CuInS2 nanostructures: Synthesis, characterization, formation mechanism and solar cell applications. J. Ind. Eng. Chem.. 2014;20:3800-3807.
- [Google Scholar]
- A solvothermal approach for the size-, shape-and phase-controlled synthesis and properties of CuInS2. Mater. Chem. Phys.. 2014;144(3):252-262.
- [Google Scholar]
- Optoelectronic properties of CuInS2 nanocrystals and their origin. The journal of physical chemistry letters. 2016;7(3):572-583.
- [Google Scholar]
- High-performance quantum dot-sensitized solar cells based on sensitization with CuInS2 quantum dots/CdS heterostructure. Energy Environ. Sci.. 2012;5(1):5315-5324.
- [Google Scholar]
- One-pot synthesis of ternary CuInS2 quantum dots with near-infrared fluorescence in aqueous solution. RSC Adv.. 2012;2(3):819-825.
- [Google Scholar]
- The regulation on visible-light photocatalytic activity of CuInS2 by different Cu/In molar ratio. Mater. Chem. Phys.. 2018;212:372-377.
- [Google Scholar]
- Fabrication of selenization-free superstrate-type CuInS2 solar cells based on all-spin-coated layers. Mater. Chem. Phys.. 2017;186:446-455.
- [Google Scholar]
- Synthesis of Ternary Metal Chalcogenide Colloidal Nanocrystals in Aqueous Solutions. Opt. Spectrosc.. 2018;125(5):773-776.
- [Google Scholar]
- Green Synthesis of CuInS2/ZnS Nanocrystals with High Photoluminescence and Stability. J. Nanomater.. 2015;2015 (Article ID 842365, 9 pages)
- [Google Scholar]
- Eco-friendly synthesis of CuInS2 and CuInS2@ ZnS quantum dots and their effect on enzyme activity of lysozyme. RSC Adv.. 2018;8(53):30589-30599.
- [Google Scholar]
- Electrical and thermoelectric properties of CuInS2 single crystals. Mater. Chem. Phys.. 2008;109(2–3):287-290.
- [Google Scholar]
- Synthesis and characterization of CuInS2 quantum dot in the presence of novel precursors and its application in dyes solar cells. Mater. Lett.. 2015;145:99-103.
- [Google Scholar]
- A green and simple hydrothermal approach to synthesize needle-like CuInS2 2 nanostructures for solar cells. J. Mater. Sci.: Mater. Electron.. 2018;29(18):16050-16056.
- [Google Scholar]
- Revisiting the cytotoxicity of quantum dots: an in-depth overview. Biophys. Rev.. 2020;12:703-718.
- [Google Scholar]
- Pigments from UV-resistant Antarctic bacteria as photosensitizers in dye sensitized solar cells. J. Photochem. Photobiol., B. 2016;162:707-714.
- [Google Scholar]
- Bacterial synthesis of ternary CdSAg quantum dots through cation exchange: Tuning the composition and properties of biological nanoparticles for bioimaging and photovoltaic applications. Microorganisms. 2020;8(5):631.
- [Google Scholar]
- High-efficiency “green” quantum dot solar cells. J. Am. Chem. Soc.. 2014;136(25):9203-9210.
- [Google Scholar]
- Photoinduced toxicity of CdSe/ZnS quantum dots with different surface coatings to Escherichia coli. Int. J. Nanotechnol.. 2013;10(12):1093-1108.
- [Google Scholar]
- Influence of surface states of CuInS2 quantum dots in quantum dots sensitized photo-electrodes. Appl. Surf. Sci.. 2016;388:437-443.
- [Google Scholar]
- Interface connection modulation by heating treatment for photovoltaic performance enhancement on CuInS2 quantum dot sensitized solar cells. J. Alloy. Compd.. 2020;817:153351
- [Google Scholar]
- Biomimetic, mild chemical synthesis of CdTe-GSH quantum dots with improved biocompatibility. PLoS ONE. 2012;7(1):e30741
- [Google Scholar]
- Effect of precursor, microwave power and irradiation time on the particle size of CuInS2 nanoparticles. J. Mater. Sci. Mater. Electron.. 2015;26:7936-7947.
- [Google Scholar]
- Synthesis, characterization and photovoltaic studies of CuInS2 nanostructures. J. Mater. Sci. Mater. Electron.. 2015;26:2810-2819.
- [Google Scholar]
- Synthesis of CuInS 2 quantum dots using polyetheramine as solvent. Nanoscale Res. Lett.. 2015;10(1):1-7.
- [Google Scholar]
- Photocatalytic activity of TiO2 nanoparticles sensitized by CuInS2 quantum dots. Ind. Eng. Chem. Res.. 2011;50(15):9131-9137.
- [Google Scholar]
- Enzymatic biomineralization of biocompatible CuInS 2,(CuInZn) S 2 and CuInS 2/ZnS core/shell nanocrystals for bioimaging. Nanoscale. 2017;9(27):9340-9351.
- [Google Scholar]
- Synthesis of Hydrophilic CuInS2/ZnS Quantum Dots with Different Polymeric Shells and Study of Their Cytotoxicity and Hemocompatibility. ACS Appl. Mater. Interfaces.. 2016;8:7613-7622.
- [Google Scholar]
- Evolution of ternary I-III–VI QDs: synthesis, characterization and application. Nano-Struct. Nano-Objects. 2017;12:46-56.
- [Google Scholar]
- Synthesis, structural and fluorescence optimization of ternary Cu–In–S quantum dots passivated with ZnS. J. Lumin. 2020:117541.
- [Google Scholar]
- Synthesis and characterization of copper indium sulfide chalcopyrite structure with hot injection method. J. Nanostruct.. 2013;3(2):145-154.
- [Google Scholar]
- Biological phosphorylated molecules participate in the biomimetic and biological synthesis of cadmium sulphide quantum dots by promoting H2S release from cellular thiols. RSC Adv.. 2017;7:40270-40278.
- [Google Scholar]
- Size-dependent band-gap and molar absorption coefficients of colloidal CuInS2 quantum dots. ACS Nano. 2018;12(8):8350-8361.
- [Google Scholar]
- Aqueous synthesis of color-tunable CuInS2/ZnS nanocrystals for the detection of human interleukin 6. ACS Appl. Mater. Interfaces. 2013;5(16):8210-8216.
- [Google Scholar]
- Bio-compatibility and cytotoxicity studies of water-soluble CuInS2-ZnS-AFP fluorescence probe in liver cancer cells. Hepatobil. Pancr. Dis. Int.. 2016;15(4):406-411.
- [Google Scholar]
- In Vivo Toxicity Evaluation of PEGylated CuInS2/ZnS Quantum Dots in BALB/c Mice. Front. Pharmacol.. 2019;10:437.
- [Google Scholar]
Appendix A
Supplementary material
Supplementary data to this article can be found online at https://doi.org/10.1016/j.arabjc.2021.103176.
Appendix A
Supplementary material
The following are the Supplementary data to this article:


