

Translate this page into:
Spectrophotometric determination of diphenhydramine hydrochloride in pharmaceutical preparations and biological fluids via ion-pair formation
*Corresponding author ak_eldidamony@yahoo.com (Akram M. El-Didamony)
-
Received: ,
Accepted: ,
This article was originally published by Elsevier and was migrated to Scientific Scholar after the change of Publisher.
Available online 16 June 2010
Abstract
A simple, sensitive and accurate spectrophotometric method has been described for the assay of diphenhydramine hydrochloride (DPH) in raw material and in biological samples. The method is based on extraction of DPH into dichloromethane as ion-pair complexes with patent blue (PB), eriochrome black T (EBT), methyl orange (MO) and bromocresol purple (BCP) in acidic medium. The coloured species exhibited absorption maxima at 632, 514, 428 and 414 nm for PB, EBT, MO and BCP, with molar absorptivity values of 1.32 × 10⁵, 2.36 × 10⁴, 3.68 × 10⁴ and 3.07 × 10⁴ l mol−1 cm−1, respectively. The reaction conditions were optimized to obtain the maximum colour intensity. Beer’s law was obeyed with a good correlation coefficient (0.9982–0.9993) in the concentration ranges 0.5–3, 2.0–16, 2.0–10 and 1.0–10 μg ml−1 for PB, EBT, MO and BCP methods, respectively. The composition ratio of the ion-association complexes was found to be 1:1 in all cases as established by Job’s method. The conditional stability constant (Kf) and the free energy changes (ΔG°) were determined for all complexes formed. The proposed method was successfully applied for the determination of DPH in tablets and human urine with good accuracy and precision. Statistical comparison of the results with those obtained by the official method showed good agreement and indicated no significant difference in accuracy and precision.
Keywords
Diphenhydramine hydrochloride
Patent blue
Methyl orange
Bromocresol purple
Eriochrome black T
Tablets
Urine
Spectrophotometry

1 Introduction
Diphenhydramine hydrochloride (DPH) (Scheme 1) 2-(diphenylmethoxy)-N,N-dimethylethylamine hydrochloride) is an effective antihistaminic and has been used for the treatment of motion sickness and extra pyramidal symptoms, as well as an antitussive and night-time sleep-aid. Recently, its use has been reported, in combination with other drugs, as antiemetic for the prevention of cisplatin-induced emesis in chemotherapy treatment. It has also been used as sedative in dentistry for children and in local anaesthesia (Goodman-Hillman et al., 1996). Several methods have been proposed for determining diphenhydramine hydrochloride in pharmaceutical preparations including capillary electrophoresis (Gomez et al., 2002; Marchesini et al., 2003; Dong et al., 2005), atomic absorption (Nerin et al., 1993; El Ries and Khalil, 2001), fluorometry (Alatayud et al., 1992; Reguera et al., 2004), flow injection analysis (Tipparat et al., 2002), spectrophotometry (Caddy et al., 1975; Shamsa and Maghssoudi, 1976; Maghssoudi et al., 1977; El-Shahat et al., 1992; Basavaiah and Charan, 2002). Chromatographic methods have been used such as gas chromatography (Raj et al., 1998), liquid chromatography (Kumar et al., 1998; Marti´nez-Algaba et al., 2006) and high performance liquid chromatography (HPLC) (Yuan and Locke, 1991; Ye and Stewart, 1996; Muller and Sherma, 1999). The drug and its formulations are official in BP (United States Pharmacopoeia, 2000), which recommended HPLC for its assay.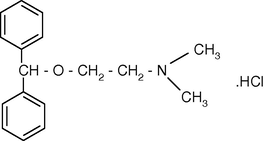
Chemical structure of diphenhydramine HCl.
The aim of this study was to develop an accurate, reproducible and adequately sensitive extractive spectrophotometric method based on the formation of dichloromethane soluble ion-association complexes between DPH with patent blue (PB), eriochrome black T (EBT), methyl orange (MO) and bromocresol purple (BCP) in acidic medium. The selectivity of the proposed method was studied and the results showed that most of coexistent substances did not interfere in the determination of DPH. The proposed method was applied for determining DPH in bulk, tablets, and urine samples with satisfactory results.
2 Experimental
2.1 Apparatus
All the absorbance spectral measurements were made using spectroscan 80 D double-beam UV/visible spectrophotometer (Biotech Engineering Ltd., UK), with wavelength range 190–1100 nm, spectral bandwidth 2.0 nm, with 10 mm matched quartz cells.
2.2 Reagents and solutions
All of the chemicals used were of analytical or pharmaceutical grade and used without further purification. Double distilled water was used to prepare all solutions.
-
Stock solutions of pure diphenhydramine hydrochloride (DPH) were prepared by dissolving 20 mg of DPH with distilled water in a 100 ml calibrated flask. Working solutions of lower concentrations (100 and 50 μg ml−1) were freshly prepared by appropriate dilution with water.
-
A solutions of 5 × 10⁻⁴ M patent blue (PB), eriochrome black T (EBT), methyl orange (MO) and bromocresol purple (BCP) (Aldrich product) were prepared by dissolving an accurately weighted amount of the dyes in distilled water and then diluted to the mark with water in a 100 ml calibrated flasks separately.
-
A series of buffer solutions of KCl–HCl (pH 1.0–2.2); NaOAc–HCl (pH 3.0–5.2); NaOAc–AcOH (pH 3.42–5.89); NaH2PO4–Na2HPO4 (pH 6.0–8.0) and potassium hydrogen phthalate–NaOH (pH 4–5.6) were prepared by following the standard methods (Britton, 1952).
2.3 General recommended procedures
2.3.1 Procedure for calibration curve
Aliquots of DPH in the concentration range stated in Table 1, were transferred into a series of 50 ml separating funnels. A 2.5 ml of 5 × 10⁻⁴ M dye solution and 2.0 ml of buffer solutions of (pH 3.6, pH 5.0, or pH 4, or pH 4.6) were placed. The volume of the aqueous phase was adjusted to 10 ml with distilled water and mixed well. The funnels were shaken vigorously with 10 ml of dichloromethane for 2 min. The two phases were allowed to stand for clear separation and the dichloromethane layer was dried by running through anhydrous sodium sulfate. The absorbance of the organic phase was measured at 632, 514, 428 and 414 nm for PB, EBT, MO and BCP, respectively, against dichloromethane. The calibration graphs are linear over the concentration ranges and are given in Table 1.
Parameters
DPH–PB
DPH–EBT
DPH–MO
DPH–BCP
λmax (nm)
632
514
428
414
pH
3.6
5.2
4.0
4.6
Molar absorptivity (l mol−1 cm−1)
1.32 × 10⁵
2.36 × 10⁴
3.68 × 10⁴
3.07 × 10⁴
Sandell’s sensitivity (ng cm−2)
2.211
12.364
7.929
9.504
Beer’s limit (μg ml−1)
0.5–3.0
2.0–16
2.0–10
1.0–10
Sy/x
0.0286
0.0129
0.0163
7.07 × 10⁻³
Slope (b)
0.4295
0.0542
0.1335
0.0977
Intercept (a)
0.0317
0.3574
−0.09
0.1099
SD of slope
0.0181
2.03 × 10⁻³
5.16 × 10⁻³
2.23 × 10⁻³
SD of intercept
0.0608
0.0364
0.0923
0.0150
Correlation coefficient (r)
0.9991
0.9982
0.9992
0.9993
Stability constant (Kf)
4.974
3.985
4.181
4.309
Free energy change, ΔG° (kJ mol−1)
6.784
5.434
5.701
5.876
2.3.2 Stoichiometric relationship
Job’s method of continuous variations was employed; 2 × 10⁻⁴ M solution of PB and DPH, 5 × 10⁻⁴ M of EBT, MO, BCP and DPH solution were used. A series of solutions were prepared in which the total volume of drug and reagent was kept at 1.8 ml. The reagents were mixed in various proportions and completed to 10 ml of distilled water, following the above-mentioned procedure.
2.3.3 Procedure for the assay of tablets
Ten tablets were weighed and powdered. A portion of the powder equivalent to 20 mg of DPH was weighed and dissolved in distilled water, filtered into a 100 ml calibrated flask to remove the insoluble matter and diluted to volume with water. Solutions of working range concentration were prepared by proper dilution of this stock solution with water and followed the above procedure for the analysis.
2.3.4 Procedure for the assay of urine samples
The proposed method was applied to the determination of DPH in human urine collected from six normal people and transferred into well-cleaned sample tubes. Human urine was 50-fold diluted with distilled water. For the determination of DPH in urine, 1.0 ml of diluted urine was put in a 50 ml separating funnel. The solution was prepared and then, absorbance was measured following the same procedure as that for standard solutions. The absolute recovery was determined for DPH by comparing the representative absorbance of the treated urine with the absorbance of the standard drug at the same concentration.
3 Results and discussion
Extractive spectrophotometric procedures due to their sensitivity are widely used in the assay of drugs and hence, ion-pair extractive spectrophotometry has received a considerable attention for the quantitative determination of many pharmaceutical compounds (El-Didamony, 2005; Patel et al., 2007; El-Didamony, 2008; Manjunatha et al., 2009; Issa et al., 2010; Cağlar and Önal, 2010).
3.1 Optimization of the reaction conditions
The course of the formation and extraction of the coloured compounds of DPH with PB, EBT, MO and BCP depends on the acidity of the solutions, the reagents concentrations and on the nature of organic solvent used. These factors were established by a number of preliminary experiments.
3.1.1 Absorption spectra
Anionic dyes such as patent blue (PB), eriochrome black T (EBT), methyl orange (MO) and bromocresol purple (BCP) form ion-association complexes in acidic buffer solution with the positively charged drug and these complexes are quantitatively extracted into dichloromethane. Absorption spectra of the ion-pair complexes extracted into dichloromethane show a maximum at 632, 514, 428 and 414 nm for BP, EBT, MO and BCP, respectively, as shown in Fig. 1. The reagent blank under similar conditions showed no absorption.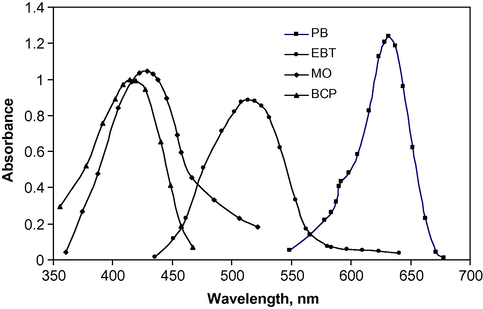
Absorption spectra of 3 μg ml−1 of DPH–PB complex, 9 μg ml−1 of DPH with EBT, MO and BCP complex against dichloromethane as blank.
3.1.2 Effect of pH and buffer media
It was observed that effective extraction for the complexes depends on the type of buffer used and its pH. The effect of buffer solution was studied by extracting the coloured complexes in the presence of various buffers, such as KCl–HCl (1.0–2.2), NaOAc–AcOH (3.0–6.0), potassium hydrogen phthalate–NaOH (4.1–5.9) and NaOAc–HCl (7.0–9.0). The experiments showed that the maximum colour intensity and constant absorbance were observed in NaOAc–AcOH for PB, MO and BCP. For EBT reagent, phthalate buffer was the buffer of choice, which did not interfere and gave the highest sensitivity. The results are shown in Fig. 2 and it is evident that absorbance of the complexes with PB, EBT, MO and BCP was found to be constant within the pH ranges 3.0–3.8, 5.0–5.6, 3.0–4.2 and 4.0–5.0, respectively. Thus, all the absorbance measurements were made at pH 3.6, 5.2, 4.0 and 4.6 with PB, EBT, MO and BCP, respectively. The optimum amount of buffer solution used to give constant absorbance was also studied and found to be 2.0 ml.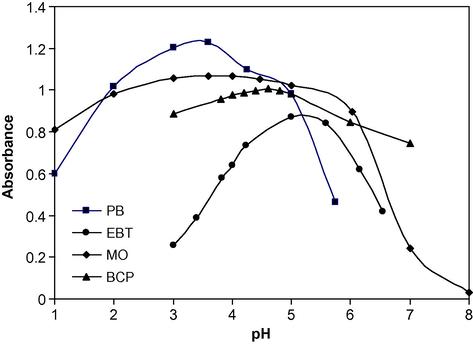
Effect of pH on the absorbance of ion-pair complexes of PB with 3 μg ml−1 DPH and EBT, MO and BCP with 9 μg ml−1 DPH.
3.1.3 Selecting of the extracting solvents
Several water-immiscible organic solvents, including benzene, toluene, carbon tetrachloride, chloroform and dichloromethane were investigated. Dichloromethane was selected because of its slightly higher efficiency on colour intensity and the shortest time to reach the equilibrium between both phases.
3.1.4 Sequence of addition
From the experiment, we can see that when the addition sequence was dye–buffer–drug, the absorbance was the highest. When the addition sequence was drug–dye–buffer, the absorbance was less.
3.1.5 Effect of time and temperature
The effect of time on the formation and stability of the ion-association complexes was studied by measuring the absorbance’s of the extracted ion-association complexes at increasing time intervals. At the beginning, the absorbance increased gradually along with the time. After 10 min it achieved stability and remained basically unaltered for more than 3 h.
The effect of temperature on the absorbance was also, examined in the range of 30–100 °C. The results showed that the ion-association complexes were performed almost instantaneously in all cases at room temperature (25 ± 2 °C) and the influence of temperature was little. So, the absorbance was measured at room temperature (25 ± 2 °C).
3.1.6 Effect of dye concentration
The effect of the dye concentration on the intensity of the colour developed at selected wavelengths was tested using different milliliters of 5 × 10⁻⁴ M of the reagents. It is apparent from Fig. 3, that the maximum absorbance in each case, was found with 2.0 ml of dyestuff, beyond which absorbance was constant. Thus 2.5 ml of each dyestuff was used for ion-pair complex formation throughout the experiment.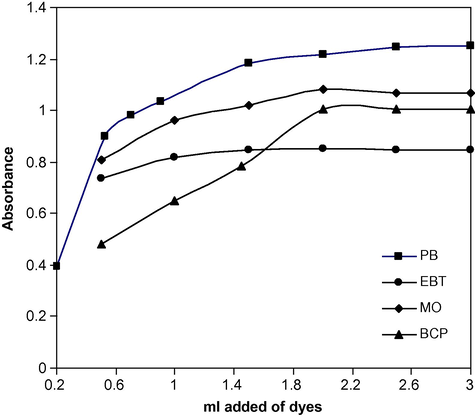
Effect of 5 × 10⁻⁴ M dye on the absorbance of ion-pair complexes of: PB with 3.0 μg ml−1 of DPH, EBT, MO and BCP with 9.0 μg ml−1 of DPH.
3.1.7 Stoichiometric ratio of the ion-association complex
The stoichiometry of the ion-association complex formed by electrostatic attraction between positive protonated drug (DPH+) and the anion of bromocresol purple (BCP−) (as a model example of the used dyes) was investigated by applying the continuous variation method (Job, 1928; Vosburgh and Cooper, 1941) at the wavelength of maximum absorbance. The results obtained showed that the stoichiometric ratio of the ion-association complex is 1:1 (drug:dye) in all cases (Fig. 4). The suggested mechanism of DPH+–BCP− ion-pair complex formation is described in Scheme 2. The extraction equilibrium can be represented as follows:
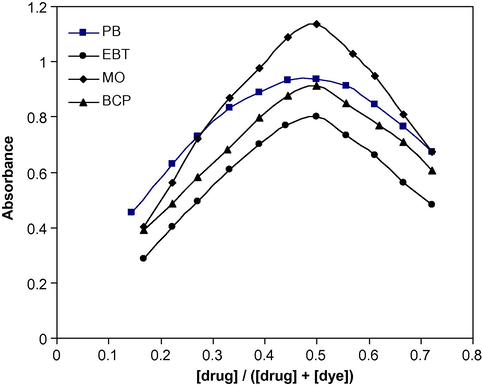
Continuous-variations study of drug–dye systems: DPH–PB (2.0 × 10⁻⁴ M); DPH–EBT; DPH–MO and BCP–DPH (5.0 × 10⁻⁴ M) ion-pair complexes.
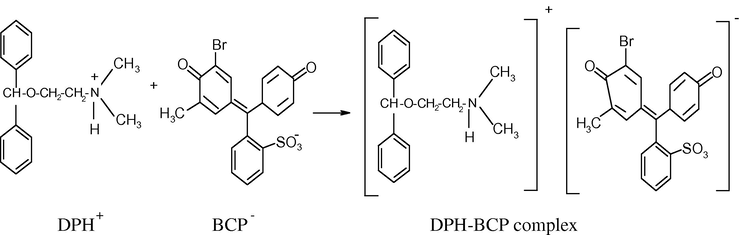
Probable mechanism for the formation of 1:1 DPH–BCP.
3.1.8 Conditional stability constants (Kf) of ion-pair complexes
The conditional stability constants (Kf) of the ion-pair associates for DPH under the experimental conditions described above were calculated from the continuous variation data using the following equation (Inczedy, 1976): where A and Am are the observed maximum absorbance and the absorbance value of the drug present is associated, respectively. CD is the molar concentration of drug at the maximum and n is the stoichiometric constant with which dye ion associates with drug. In accordance with the formula, the conditional stability constants were found to be 4.974, 3.985, 4.181 and 4.309 for PB, EBT, MO and BCP, respectively.
The standard free energy change (ΔG°) was related to the association constant and calculated by the following equation (Martin et al., 1969): where (ΔG°) is the free energy change of the complex (kJ mol−1), R the gas constant (1.987 cal mol−1 deg−1), T is the temperature in kelvin (273+ °C), and Kf is the association constant of drug–reagent ion-pair complexes (l mol−1).
3.1.9 Specificity and effect of excipients
Formation of the ion-pair complex with anionic dyes needs a basic drug; therefore, no possible interference is expected from other co-formulated drugs lacking any basic center. A systematic study of the effect of excipients was performed, following the proposed procedures for a 10-ml sample system, by adding a known amount of excipients to the fixed DPH concentration (3.0 μg ml−1). The results revealed the fact that no significant interference was observed from the excipients, such as glucose, fructose, sucrose, lactose and starch commonly present in pharmaceutical formulations. However, the drug content from the powdered tablets was extracted into methylene chloride, which completely eliminates the common excipients found in drug formulations.
3.2 Validation of the proposed methods
3.2.1 Conformity to Beer’s law
Beer’s law is obeyed in the concentration (C, μg ml−1) range of 0.5–3.0 μg ml−1 with PB, 2.0–16 μg ml−1 with EBT, 2.0–10 μg ml−1 with MO and 1.0–10 μg ml−1 with BCP. The molar absorptivity (ɛ) calculated and found to be 1.32 × 10⁵, 2.36 × 10⁴, 3.68 × 10⁴ and 3.07 × 10⁴ l mol−1 cm−1, for PB, EBT, MO and BCP, respectively, indicating high sensitivity of the reagents under investigations for the determination of the cited drug.
The optical characteristics such as Beer’s law limits, correlation coefficient (r) and Sandell’s sensitivities (Sandell, 1950) are recorded in Table 1. The regression analysis using the method of least square was made for the slope (b), intercept (a) and standard deviation of the residuals (Sy/x) obtained from different concentrations are given in Table 1. The intercept of the lines were very small indicating that there is no systematic difference between determined and expected concentration within the investigated range using the proposed method.
3.2.2 Precision and accuracy
In order to determine the accuracy and precision of the proposed method, solution containing four different concentrations of DPH were prepared and five replicates determinations, covering the usable concentration range, were carried out for the pure form and the pharmaceutical preparation of the drug under investigation. The analytical results obtained for this investigation are summarized in Table 2. The low values of percent relative standard deviation (RSD%) indicate good precision and reproducibility of the proposed method. The average percent recoveries obtained were quantitative (99.85–100.6), indicating good accuracy of the method. The mean values obtained and the calculated standard deviations are compared with those obtained by the pharmacopoeia method of DPH (United States Pharmacopoeia, 2000) by applying the t- and F-tests (Table 3). Such comparison showed that there is no significant difference, at 95% confidence level, between the mean values or variances obtained by the proposed and the pharmacopoeia method. This indicates the high accuracy and precision of the present method.
Method
Added (μg ml−1)
Recovery (%)
Precision, RSDa (%)
Accuracy, Erb (%)
Confidence limitc
DPH–PB
1
100.1
1.565
0.1
1.001 ± 8.97 × 10⁻³
1.5
100.06
1.819
0.0667
1.501 ± 0.0142
2
99.74
2.289
−0.3
1.994 ± 0.0224
2.5
100.02
0.532
0.04
2.501 ± 6.81 × 10⁻³
DPH–EBT
2
99.98
1.649
−0.05
1.999 ± 5.62 × 10⁻³
6
100.6
1.886
0.6
6.036 ± 0.0127
10
100.04
0.3019
0.0214
10.004 ± 3.77 × 10⁻³
14
100.02
0.4206
0.04
14.003 ± 5.39 × 10⁻³
DPH–MO
3
99.82
1.646
−0.2
2.994 ± 5.58 × 10⁻³
5
99.88
1.743
−0.12
4.994 ± 0.0112
7
100
0.7904
0.00
7 ± 7.15 × 10⁻³
9
99.94
1.324
−0.0667
8.994 ± 0.0164
DPH–BCP
2
100.12
3.277
0.1
2.002 ± 0.0116
4
100.14
1.785
0.125
4.005 ± 0.0106
6
99.96
1.094
−0.05
5.997 ± 9.67 × 10⁻³
8
99.90
0.9942
−0.1
7.992 ± 0.0101
Method
Taken (μg ml−1)
Samples
Official method
Sultan
Urine
DPH–PB
1.5
101.02 ± 0.0202
100.93 ± 0.0126
99.98 ± 0.0169
F = 1.4286
F = 1.7990
t = 0.8771
t = 1.4241
DPH–EBT
8.0
99.98 ± 0.0269
99.98 ± 0.0185
99.95 ± 0.0203
F = 1.7559
F = 1.2041
t = 0.4457
t = 0.7303
DPH–MO
3.0
99.88 ± 0.0102
99.86 ± 0.0134
99.92 ± 0.0115
F = 1.2711
F = 1.3577
t = 1.6265
t = 1.1331
DPH–BCP
6.0
100.12 ± 0.0290
99.98 ± 0.0120
100.05 ± 0.0217
F = 1.7859
F = 3.2700
t = 0.9671
t = 1.2108
3.2.3 Analytical application
The validity of the proposed method for the analysis of DPH in tablets and urine was examined by analyzing the sample using the proposed method.
3.2.4 Determination of DPH in tablets and urine
The proposed method has been successfully applied to the determination of DPH in commercial tablets purchased locally and urine samples. The results are shown in Table 3. The mean percent recovery obtained from five replicate measurements of tablets and urine containing DPH were 99.86–101.02% (Table 3) and indicate that the proposed method was effective for the determination of DPH in tablets and urine samples. The calculated Student’s t-values and F-values did not exceed the theoretical ones at 95% confidence level. Therefore, there is no significant difference between the proposed method and official method (United States Pharmacopoeia, 2000).
4 Conclusion
The reagents utilized in the proposed method are cheaper, readily available and the proposed method does not involve any critical reaction conditions or tedious sample preparation. The method is unaffected by slight variations in the experimental conditions, such as pH, reagent concentration or temperature. The proposed method is sufficiently sensitive to permit determination even down to 0.5 μg ml−1. The sensitivity in term of molar absorptivity and the precision in term of RSD of the method are very suitable for the determination of DPH in tablets and biological fluids. Moreover, the methods are free from interference by common additives and excipients. The comparative study of the molar absorptivity indicated good sensitivity of the proposed method which follow the order of PB > MO > BCP > EBT.
References
- Mikrochim. Acta. 1992;106:319-325.
- Farmaco. 2002;57:9-17.
- Hydrogen Ions. Chapman and Hall: fourth ed.; 1952.
- Analyst. 1975;100:563-566.
- Anal. Chem.. 2010;65:239-243.
- J. Pharm. Biomed. Anal.. 2005;39:285-289.
- J. Pharm. Biomed. Anal.. 2001;25:3-7.
- Arch. Pharm. Chem. Life Sci.. 2005;338:190-197.
- Spectrochim. Acta A. 2008;69:770-775.
- J. Chem. Technol. Biotechnol.. 1992;54:175-181.
- J. Pharm. Biomed. Anal.. 2002;30:791-799.
- The Pharmacological Basis of Therapeutics. New York: McGraw-Hill; 1996.
- Analytical Application of Complex Equilibria. Budapest: Wiley; 1976.
- Spectrochim. Acta A. 2010;75:1297-1303.
- Anal. Chem.. 1928;9:113-116.
- J. Mass Spectrom.. 1998;33:1171-1181.
- J. AOAC Int.. 1977;60:926-928.
- J. Anal. Chem.. 2009;64:462-466.
- J. Pharm. Biomed. Anal.. 2003;31:39-46.
- Physical Pharmacy (third ed.). Philadelphia, PA: Lee & Febiger; 1969. pp. 343, 360
- J. Pharm. Biomed. Anal.. 2006;40:312-321.
- J. Liq. Chromatogr. Relat. Technol.. 1999;22:153-159.
- J. Pharm. Biomed. Anal.. 1993;11:411-414.
- Indian J. Pharm. Sci.. 2007;69:318-320.
- Talanta. 1998;46:221-225.
- Anal. Sci.. 2004;20:799-803.
- Colorimetric Determination of Traces of Metals. New York: Inter Science; 1950. p. 29
- J. Pharm. Sci.. 1976;65:761-762.
- J. Pharm. Biomed. Anal.. 2002;30:105-112.
- The United States Pharmacopoeia, 24th ed., United States Pharmacopoeia Convention, Inc., Rockville, 2000, pp. 583–584.
- J. Am. Chem. Soc.. 1941;63:437-444.
- J. Liq. Chromatogr. Relat. Technol.. 1996;19:711-718.
- Drug Dev. Ind. Pharm.. 1991;17:2319-2331.


