

Translate this page into:
First report of flavonoids from leaves of Machaerium acutifolium by DI-ESI-MS/MS
⁎Corresponding author. mariana@ufpi.edu.br (Mariana Helena Chaves)
-
Received: ,
Accepted: ,
This article was originally published by Elsevier and was migrated to Scientific Scholar after the change of Publisher.
Peer review under responsibility of King Saud University.
Abstract
The aqueous fraction obtained by the partition of the ethanolic extract from leaves of Machaerium acutifolium (Fabaceae-Papilionoideae) was analyzed by high-performance liquid chromatography with a diode array detector (HPLC-DAD) and direct insertion in a mass spectrometer with an ion trap analyzer equipped with an electrospray ionization source (DI-ESI-MS/MS). The chemical analysis of the extract demonstrated the occurrence of eight flavonols (1–8), two isoflavonoids (9 and 10) and one biflavonoid (11). These compounds are being reported for the first time from M. acutifolium. The aqueous fraction showed 28.37 ± 0.94% of AA in assay on DPPH and 151.70 ± 9.44 GAE of the total phenolic content.
Keywords
Machaerium acutifolium
HPLC-DAD
DI-ESI-MS/MS
Flavonoids
Isoflavonoids
Antioxidant activity
Total phenolic content

- HPLC-DAD
-
high-performance liquid chromatography with diode array detector
- HPLC-UV
-
high-performance liquid chromatography with ultraviolet detection
- DI-ESI-MS/MS
-
direct insertion in a mass spectrometer with an ion trap analyzer equipped with an electrospray ionization source
- AA
-
antioxidant activity
- TPC
-
total phenolic content
- GAE
-
gallic acid equivalent
- DPPH
-
2,2-diphenyl-1-picrylhydrazyl.
Abbreviations
1 Introduction
Machaerium acutifolium Vogel (Fabaceae - Papilionoideae) popularly known as “jacarandá do campo”, “jacarandá caroba” and “jacarandá bico de pato”, occurs in Brazil, from Amazon, São Paulo, Mato Grosso do Sul, Bahia, Piauí and Maranhão states, mainly in the cerrado area (Lorenzi, 1998; Polido and Sartori, 2007). This plant species is traditionally used as a contraceptive to treat painful menstruation and stomach pain (Barbosa and Pinto, 2003). Ollis et al. (1978) reported that the trunk wood of M. acutifolium contains polyphenols (pinsylvin monomethyl ether, (+)-medicarpin, and petrostyrene). A recent study revealed that trunk ethyl acetate extract of M. acutifolium contains: one 3-arylcoumarin derivative, two flavonoids: (3R)–2H-benzopyran-7-ol, 3,4-dihydro-3-(2’hydroxy-3’,4’-dimethoxyphenyl) and (3R)–2H-benzopyran-7-ol, 3,4-dihydro-3-(2’hydroxy-3’,4’-dimethoxyphenyl)-8-methoxy, one trans-stilbene and a natural indene (Melo et al., 2021). The authors further confirmed the larvicidal activity of crude extract and natural indene.
HPLC is a fundamental technique for the screening and separation of flavonoids (Pinheiro and Justino, 2012; Carvalho et al., 2018). While mass spectrometry (MS) is widely used to identify these compounds (Prasain et al., 2003; Silva et al., 2021; Zhao et al., 2018). Tandem MS (MS/MS) with electrospray ionization (ESI) interface is a valuable technique for the identification of metabolites, due to the high selectivity and ionic resolution. In recent years, it has been widely used for the identification of structures and in the isomeric differentiation of glycosylated flavonoids (Vukics and Guttman, 2010). Studies have shown that the position of sugar substitution has a significant influence on the fragmentation pattern of O-glycosylated flavonoids (Ablajan, 2010; Es-Safi et al., 2005).
Considering the biological importance of M. acutifolium and the few previous report, a systematic study was carried out to identify secondary metabolites (flavonoids and isoflavonoids) in the phenolic-rich aqueous fraction, obtained from the leaves of M. acutifolium by DI-ESI-MS/MS and NMR, and also to evaluate the antioxidant potential and the total phenolic content. Part of this paper was presented in the form of an abstract at the 7th Brazilian Conference on Natural Products held in Rio de Janeiro, Brazil (Carvalho et al., 2019).
2 Materials and methods
2.1 Plant material
Fresh leaves of M. acutifolium were collected from Jatobá do Piauí, state of Piauí, Brazil (S 04° 51 ’006″, W 42° 05 ’057″, 100 m), in March 2017. The plant was identified by biologist Dr. Ruth R. S. de Farias and a voucher specimen was deposited at the Herbarium Graziela Barroso (Federal University of Piauí - UFPI), under code TEPB 31,568 and SisGen AAB530D.
2.2 Sample preparation
The leaves were air-dried (1.4 kg), pulverized in a mechanical grinder, and exhaustively macerated with ethanol (98%). The solvent was removed in a rotary evaporator under reduced pressure and the residual water by lyophilization, yielding 74.7 g of ethanolic extract (5.3%). The crude extract (64 g) was suspended in methanol–water (1:2, v/v) and partitioned successively with hexane and ethyl acetate that resulted in the hexane (FHF, 33.5 g, 52.3%), ethyl acetate (FAEF, 5 g, 7.8%) and aqueous fractions (FAF, 25.5 g, 39.8%). The aqueous fraction was analyzed by HPLC-DAD and DI-ESI-MS/MS.
2.3 Extraction of phenolic compounds
The fraction rich with phenolic compounds was obtained by solid-phase extraction (SPE) of the aqueous fraction. An aliquot (10 mg) of the aqueous fraction was dissolved in 1 mL of the MeOH/H2O (1:1, v/v) and applied in SPE cartridge (1.0 × 3.5 cm - Bakerbondspe 7020–03, C18, 25–40 μm, JT Baker), previously conditioned with the same solvent and eluted with 1 mL of MeOH/H2O (1:1, v/v). The sample was filtered in membrane 0.45 and 0.22 μm (Millipore®) for analysis in HPLC and DI-ESI-MS/MS (50 ppm), respectively.
HPLC analysis were carried out in chromatographs: i) analytical, Shimadzu® equipped with LC-20AT pump, SIL-20AHT automatic injector, SPD-M20A diode array detector, CTO-20A column oven, C18 Shim- pack 6-SIL, column C-18Shim-pack VP-ODS (250 x 4.6 mm, 5 μm) and ii) semi-preparative, Shimadzu® prominence system equipped with LC-6AD binary pump system, manual injector, SPD-20A UV detector, Phenomenex Luna column (C18, 250 x 10 mm, 15 µm). The solvents, (A) H2O-0.2% AcOH and (B) MeOH, were used as mobile phase, being methanol and acetic acid of grade HPLC (J. T. Backer) and ultra-pure water (18 Ω, Milli-Q Plus system). The column temperature was maintained at 30 °C.
DI-ESI-MS/MS analysis was achieved by direct insertion in a mass spectrometer with an ion trap analyzer (ITMS, AmaZon X, Bruker Daltonics), equipped with an electrospray ionization (ESI) source. The conditions used for the analysis were: ESI ionization source in negative ion mode, [ESI(-)], m/z range 100–1500, syringe flow 3.0 µL min−1, capillary voltage 4.5 kV, the flow of drying gas (N2) 9.0 L min−1, nebulization pressure 50 psi and source temperature 350 °C. For MSn analysis, the parameters collision energy, signal amplitude, data acquisition time, and radiofrequency were adjusted for each signal, in order to obtain structural information from the precursor ion.
2.4 Isolation of major compounds
Seven 500 mg aliquots of the aqueous fraction of the leaves were solubilized in H2O/MeOH (8:2) with the aid of an ultrasonic bath and applied to a solid-phase extraction cartridge (SPE, C18, 10 g), initially acclimated with H2O/MeOH (8:2) and eluted successively with 150 mL of each of the following eluents: MeOH/H2O (8:2), MeOH (100%) and CHCl3 (100%). The corresponding eluates were pooled giving the subfractions R1 (3.1 g, 89.7%), R2 (300.5 mg, 8.6%) and R3 (59.5 mg, 1.7%), respectively.
The R1 subfraction was fractionated on semipreparative HPLC-UV, utilizing the gradient elution: 0–104 min; 30–90% MeOH, injection volume 1 mL, flow rate 4 mL min-1 and λ = 254 nm. The chromatographic separation allowed the isolation of compounds 5 (66.6 mg) and 6 (45.9 mg).
2.5 DPPH assay and determination of total phenolic content
The evaluation of the antioxidant activity (AA) of the aqueous fraction of the leaves was made by the spectrophotometric method based on the DPPH free radical scavenging (Sousa et al., 2007).
A stock solution of DPPH, with a concentration of 40 μg mL−1 was prepared and kept under refrigeration and protected from light. The flavonoid rutin and the synthetic compound butylhydroxytoluene (BHT) were used as a positive control. A 250 μg mL−1 stock solution was prepared in triplicate and diluted to concentrations of 200, 150, 100, 50, and 25 μg mL−1. The absorbance measurements of the reaction mixtures (0.3 mL of the sample solution and 2.7 mL of the DPPH stock solution, at a concentration of 40 μg mL−1), were taken at 516 nm, in triplicate, on the 1st, 5th, and 10th minute of analysis, every 10 min until completing 30 min. A mixture of methanol (2.7 mL) and methanol sample solution (0.3 mL) was used as blank. The equation of the analytical curve used to determine the concentration of DPPH was A = 33.227c + 1.0607, with a linear correlation coefficient R = 0.9997, where “c” equals the concentration of DPPH in the reaction medium and “A” is the absorbance obtained at the wavelength (λmax) of 516 nm. From the equation of the analytical curve of DPPH and the absorbance values in a time of 30 min for each concentration tested, the percentage of remaining DPPH (%DPPHrem) and the percentage of AA were determined.
The percentage of antioxidant activity (%AA) was determined from the absorbance values of the samples measured at concentrations of 25, 50, 100, 150, 200, and 250 μg mL−1 in a time of 30 min, using Equation (1) where: AbsDPPH is the initial absorbance of the DPPH solution, Abssample is the absorbance of the reaction mixture and Absblank is the absorbance of the blank.
To determine the percentage of remaining or residual DPPH (%DPPHrem) we used Equation (2).
The efficient concentration of the extract capable of reducing the DPPH free radical concentration by 50% (EC50) in μg mL−1 was also determined from the first-order exponential curve of %DPPHrem versus the sample concentrations (Sousa et al, 2007).
The total phenolic content (TPC) of the aqueous fraction of the leaves was determined by spectrometry in the visible region using the Folin-Ciocalteu method as described by Sousa et al. (2007), analyses performed in triplicate. Aqueous sodium carbonate (15%) and methanolic solution of sample, at a concentration of 1.0 mg L-1, were prepared and stored. 500 μL of Folin-Ciocalteu reagent was added to an aliquot of 100 μL of the sample solution, followed by 5.0 mL of distilled water and stirred for one minute. Then, 2.0 mL of sodium carbonate solution (15%) was added to the reaction mixture, stirring for 30 s, the volume of 10 mL was made up with distilled water, allowed to react for two hours, and measured the absorbance at a wavelength of 750 nm. For the blank, the same procedure was performed, replacing the sample solution with 100 μL of methanol.
The determination of TPC levels was made by interpolating the absorbance of the samples against an analytical curve constructed with a standard of gallic acid (10 to 350 μg mL−1) and expressed as A = 0.1185c–0.0453, with a correlation coefficient linear equal to 0.999, where “c” is the concentration of gallic acid and “A” is the absorbance. TPC was expressed in milligrams of gallic acid equivalent per gram of extract (mg EAG g−1).
2.6 Statistical analysis
The results presented in this study correspond to the average of three repetitions (n = 3) ± standard deviation of the mean. The results of antioxidant activity that presented a probability of occurrence of the null hypothesis lower than 5% (p < 0.05) were considered statistically different, applying ANOVA, followed by multiple comparisons using the Tukey test. All analyses were performed using the Microcal Origin 8.0 software.
3 Results and discussions
The chromatographic profile of the aqueous fraction obtained from the ethanol extract partition showed two intense peaks (Fig. 1). The spectra in the UV region corresponding to these peaks showed absorptions between 300 and 380 and 240 to 280, referring to the cinnamoyl (band I) and benzoyl (band II) systems, respectively (Mabry et al., 1970).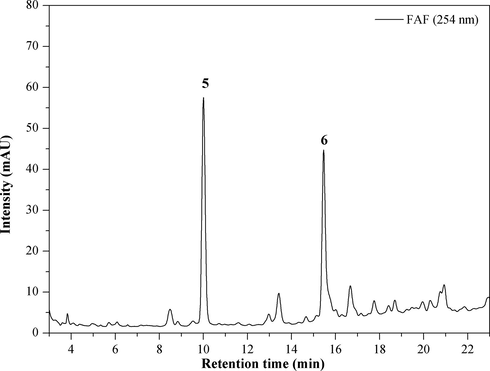
Chromatogram of aqueous fraction. Mobile Phase: MeOH/H2O-AcOH (0.2%), gradient: 0-5min, 30-40% MeOH; 5-7min, 40% MeOH; 7-12min, 40-50% MeOH; 12-14min, 50% MeOH; 14-19min, 50-60% MeOH; 19-23min, 60-100% MeOH, injection volume 10 µL, flow rate 1 mL min-1 and λ=254 nm.
The aqueous fraction rich in phenolic compounds, obtained in a solid-phase extraction cartridge (SPE, C18, 10 g), was applied in semipreparative HPLC, allowing the isolation of major compounds 5 (tR = 9.99) and 6 (tR = 15.44). These compounds were identified by DI-ESI-MS/MS, 1H and 13C NMR and comparison with literature data (Kite et al., 2007; Silva et al., 2018).
Compound 5 presented precursor ion m/z 885 [M−H]- and its MS2 spectrum showed fragment ions m/z 739 [M−H−146]- and 593 [M−H−292]- indicating the loss of one and two rhamnose units, respectively (Fig. 2A). MS3 (m/z 739) showed the fragment ions m/z 593 [M−H−146]-, indicating loss of one rhamnose unit, and 285 [M−H−454]- suggesting loss of two rhamnose and one hexose units (Fig. 2B). The m/z 285 and 255 indicated kaempferol as an aglycone (Fig. 2C and Fig. 8).![Mass spectra MS2 (A), MS3 (B), and MS4 (C) of ions m/z 885, 739, and 593 referring to flavonoid kaempferol-3-O-rhamnosyl-(1→2)-[rhamnosyl-(1→6)]-galactosyl-7-O-rhamnoside (5).](/content/184/2022/15/5/img/10.1016_j.arabjc.2022.103765-fig2.png)
Mass spectra MS2 (A), MS3 (B), and MS4 (C) of ions m/z 885, 739, and 593 referring to flavonoid kaempferol-3-O-rhamnosyl-(1→2)-[rhamnosyl-(1→6)]-galactosyl-7-O-rhamnoside (5).
Compound 6 presented precursor ion m/z 739 [M−H]- and its MS2 spectrum showed the fragment ions m/z 593 [M−H−146]-, indicating loss of one rhamnose, and 285 [M−H−454]- suggesting loss of two rhamnose and one hexose units (Fig. 3A). The MS3 (m/z 593) presented the fragment ion m/z 447 [M−H−146]- indicating loss of one rhamnose (Fig. 3B), while m/z 285 and 255 indicated kaempferol as an aglycone (Fig. 3C and Fig. 8). Hexose, in compounds 5 and 6, was identified as galactose based on NMR data (Supplementary material), suggested the flavonoids kaempferol-3-O-rhamnosyl-(1→2)-[rhamnosyl-(1→6)]-galactosyl-7-O-rhamnoside (5) and kaempferol-3-O-rhamnosyl-(1→6)- galactosyl-7-O-rhamnoside (6) (Kite, et al., 2007; Silva et al., 2018).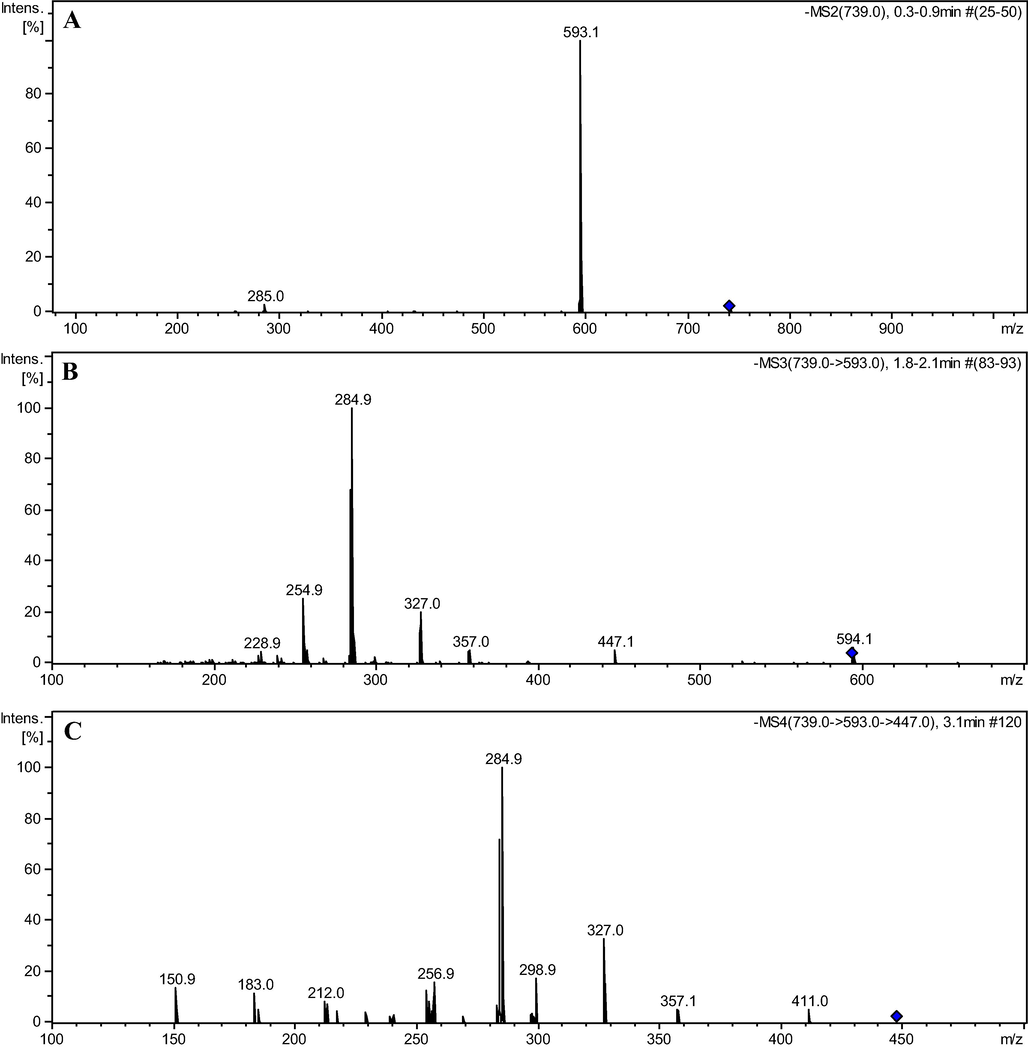
Mass spectra MS2 (A), MS3 (B), and MS4 (C) of ions m/z 739, 593, and 447 referring to flavonoid kaempferol-3-O-rhamnosyl-(1→6)- galactosyl-7-O-rhamnoside (6).
Eight flavonols (1–8), two isoflavonoids (9 and 10), and one biflavonoid (11) were identified by comparing spectrometric data with scientific literature (Fig. 4 and Table 1). The full scan of the aqueous fraction rich in phenolic compounds is shown in Fig. 5.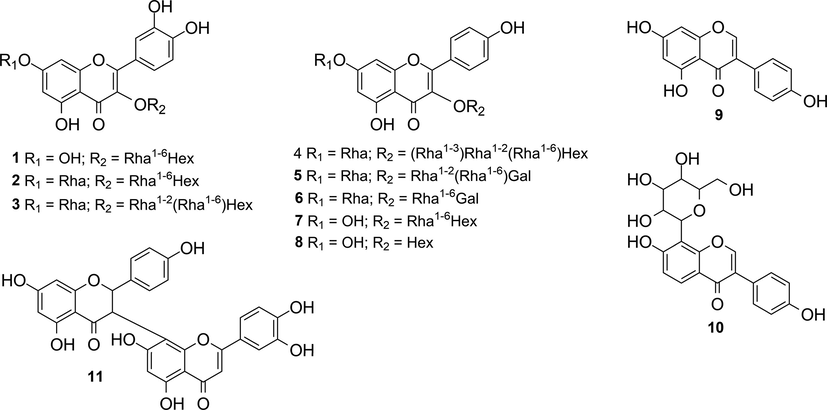
Structures of the compounds identified in the aqueous fraction of M. acutifolium leaves.
Compounds
Molecular Formula
[M−H]−
MSn
Ref.
quercetin-3-O-rhamnosyl-(1→6)-hexoside (1)
C27H30O16
609
MS2[609]: 463(13), 301(100)
MS3[301]: 283(24), 271(100), 255(34), 179(98), 151(78)Ablajan et al., 2006
quercetin-3-O-rhamnosyl-(1→6)-hexosyl-7-O-rhamnoside (2)
C33H40O20
755
MS2[755]: 609(100), 593(7), 447(6) 301(21), 271(3)
MS3[609]: 593(6), 301(100), 271(23), 227(10)Crupi et al., 2014
quercetin-3-O-rhamnosyl-(1→2)-[rhamnosyl-(1→6)]-hexosyl-7-O-rhamnoside (3)
C39H50O24
901
MS2[901]: 755(100), 739(6), 609(14) 593(20), 447(2), 301(15)
MS3[755]: 609(26), 593(10), 447(1) 301(54), 271(30)
Bamawa et al., 2016.
kaempferol-3-O-rhamnosyl-(1→3)-rhamnosyl-(1→2)-[rhamnosyl-(1→6)]-hexosyl-7-O-rhamnoside (4)
C45H60O27
1031
MS2[1031]: 959(23), 885(96), 739(100), 593(3), 575(3), 447(2), 285(4)
MS3[885]: 739(100), 593(3), 575(4), 285(4)
Veitch et al., 2008.
kaempferol-3-O-rhamnosyl-(1→2)-[rhamnosyl-(1→6)]-galactosyl-7-O-rhamnoside (5)
C39H50O23
885
MS2[885]: 739(100), 593(2)
MS3[739]: 593(25), 575(73), 285(100), 255(49)Bresciani et al., 2015
kaempferol-3-O-rhamnosyl-(1→6)-galactosyl-7-O-rhamnoside (6)
C33H40O19
739
MS2[739]: 593(100), 447(1), 285(3)
MS3[593]: 575(1), 447(4), 285(100), 255(21)Morchid et al., 2014
kaempferol-3-O- rhamnosyl-(1→6)-hexoside (7)
C27H30O15
593
MS2[593]: 447(81), 285(100), 284(31), 257(4), 227(10)
MS3[447]: 327(7), 285(100), 255(16)Crupi et al., 2014
kaempferol-3-O-hexoside (8)
C21H20O11
447
MS2[447]: 327(7), 285(100), 255(16)
MS3[285]: 255(38), 227(35)Crupi et al., 2014
genistein (9)
C15H10O5
269
MS2[269]: 241(15), 225(30), 197(25), 143(6)
Zhao et al., 2018
daidzein-8-C-glucoside (10)
C21H20O9
415
MS2[415]: 397(13), 379(96), 295(4), 267(19), 249(14)
Ablajan, 2010; Zhao et al., 2018
morelloflavone (11)
C30H20O11
555
MS2[555]: 429(100), 403(5)
MS3[429]: 401(100), 295(31)Carrillo-Hormaza et al., 2016
![Full scan DI-ESI-MS/MS [M−H]- from enriched aqueous fraction, m/z 100–1100.](/content/184/2022/15/5/img/10.1016_j.arabjc.2022.103765-fig5.png)
Full scan DI-ESI-MS/MS [M−H]- from enriched aqueous fraction, m/z 100–1100.
The MS2 spectrum of the precursor ion m/z 609 [M−H]- provided the fragment ions m/z 463 and 301 indicating the consecutive loss of rhamnose (146 Da) and hexose (162 Da) units, respectively, which are characteristic of the quercetin-3-O-rhamnosyl-(1→6)-hexoside (1), while the MS3 of m/z 301 showed the fragment ions m/z 283, 271, 255, 179 and 151 confirming quercetin as the aglycone (Fig. 6) (Ablajan et al., 2006).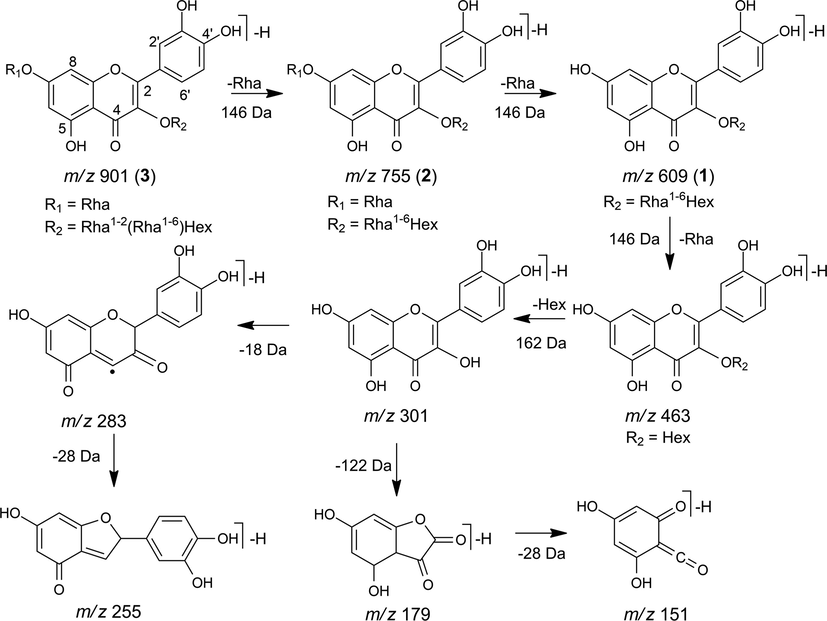
Fragmentation proposal for flavonoids 1, 2 and 3.
Two derivatives of quercetin-3-O-rhamnosyl-(1→6)-hexoside (1) were also identified, corresponding to the precursor ions m/z 901 [M−H]- and 755 [M−H]-. The MS2 spectrum of these ions showed the fragment ion m/z 609 indicating the loss of two and one rhamnose units, respectively. MS3 spectrum showed fragmentation identical to that attributed to quercetin-3-O-rhamnosyl-(1→6)-hexoside (m/z 609), suggesting the compound quercetin-3-O-rhamnosyl-(1→2)-[rhamnosyl-(1→6)]-hexosyl-7-O-rhamnoside (3) and quercetin-3-O-rhamnosyl-(1→6)-hexosyl-7-O-rhamnoside (2) (Crupi et al., 2014; Bamawa et al., 2016).
The fragmentation pattern of quercetin-3-O-rhamnosyl-(1→6)-hexoside (1) can be used as a base for the study of other flavonols, including aglycones and their mono- and di-glycosylated derivatives. In the mass spectra of isoflavonoids, a series of regular neutral losses of 28 Da (CO), 44 Da (CO2), 56 Da (2xCO), 72 Da (CO + CO2), and 84 Da (3xCO) are generally observed (March et al., 2004; Zhao et al., 2018). These characteristic fragmentations are used to distinguish between flavonols and isoflavonoids.
The MS2 spectrum of the precursor ion m/z 1031 [M−H]- showed the fragment ions m/z 885 [M−H−146]- and 739 [M−H−292]- indicating the loss of one and two rhamnose units, respectively. The MS3 (m/z 885) presented the fragment ions m/z 739 [M−H−146]- and 593 [M−H−292]- indicating loss of one and two rhamnose units, respectively (Fig. 6), while m/z 285 and 255 indicated kaempferol as an aglycone, suggesting the flavonoid kaempferol-3-O-rhamnosyl-(1→3)-rhamnosyl-(1→2)-[rhamnosyl-(1→6)]-hexosyl-7-O-rhamnoside (4) (Veitch et al., 2008).
The fragment ions m/z 885, 739, 593, and 447 (Fig. 7) are derived from compound 4, because they show a difference in m/z values corresponding to one to four rhamnose units, respectively. This suggests the flavonols kaempferol-3-O-rhamnosyl-(1→2)-[rhamnosyl-(1→6)]-galactosyl-7-O-rhamnoside (5), kaempferol-3-O-rhamnosyl-(1→6)-galactosyl-7-O-rhamnoside (6), kaempferol-3-O-rhamnosyl-(1→6)-hexoside (7) and kaempferol-3-O-hexoside (8), which is confirmed by the MS3 of these fragments (Bresciani et al., 2015; Crupi et al., 2014; Morchid et al., 2014), as shown in Table 1.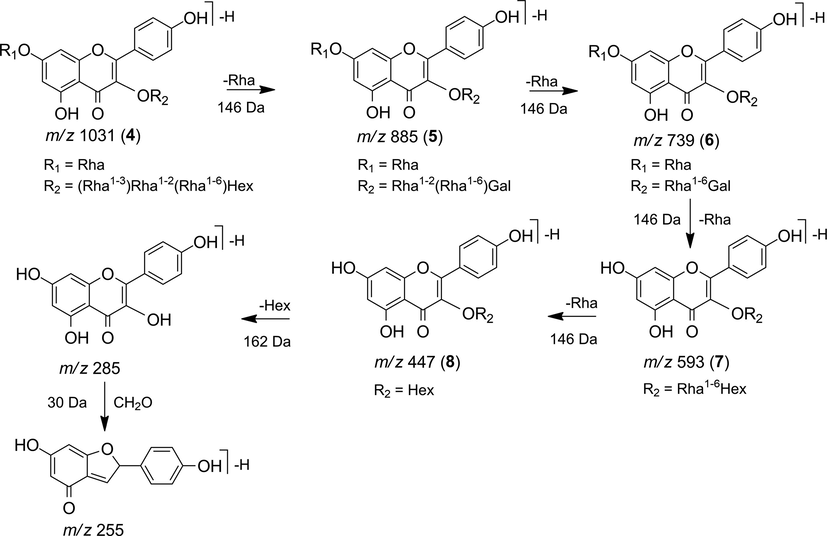
Fragmentation proposal for flavonoids 4 to 8.
The fragmentation pattern observed in the MS2 spectrum of the precursor ion m/z 269 [M−H]- indicates that compound 9 is an aglycone identified as genistein, which can be confirmed by the presence of the fragment ions m/z 241 [M−H−CO]-, 225 [M−H−CO2]-, 197 [M−H−CO2−CO]- and 143 [M−H−C6H6O3]- characteristic of this isoflavonoid. The proposed fragmentation is shown in Fig. 8 (Zhao et al., 2018).
Fragmentation proposal for genistein (9).
The MS2 spectrum of m/z 415 [M−H]- showed the fragment ions m/z 397 [M−H−H2O]- and 379 [M−H−H2O−H2O]- indicating successive water losses that can characterize C-glycosylated type isoflavonoids (Zhao et al., 2018). Additionally, the presence of the fragment ions m/z 295, 267, and 249 was observed corresponding to the losses of C4H6O3, CO, and H2O, respectively, (Fig. 9), which allowed to suggest the compound daidzein-8-C-glucoside (10) (Ablajan, 2010; Zhao et al., 2018).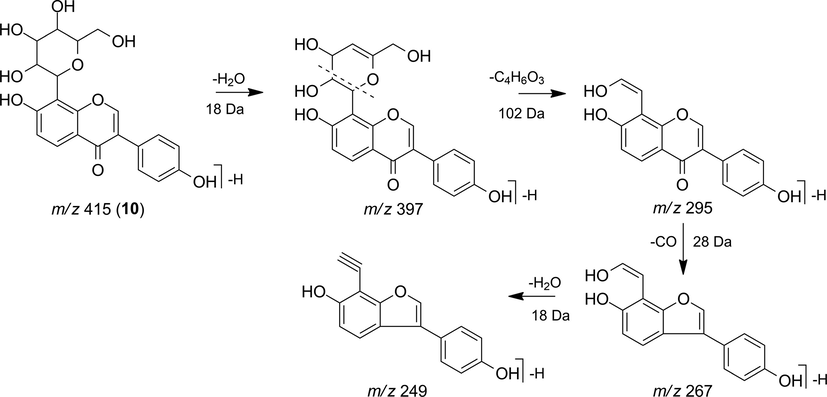
Fragmentation proposal for daidzein-8-C-glucoside (10).
The MS2 spectrum of the precursor ion m/z 555 [M−H]- showed the fragment ions m/z 429 [M−H−126]- indicating the loss of -C6H6O3. The MS3 (m/z 429) presented the fragment ions m/z 401 [M−H−28]- and 295 [M−H−134]- indicating loss of CO and C8H8O2, respectively (Fig. 10), suggesting the biflavonoid morelloflavone (11) (Carrillo-Hormaza et al., 2016; Silva et al., 2021).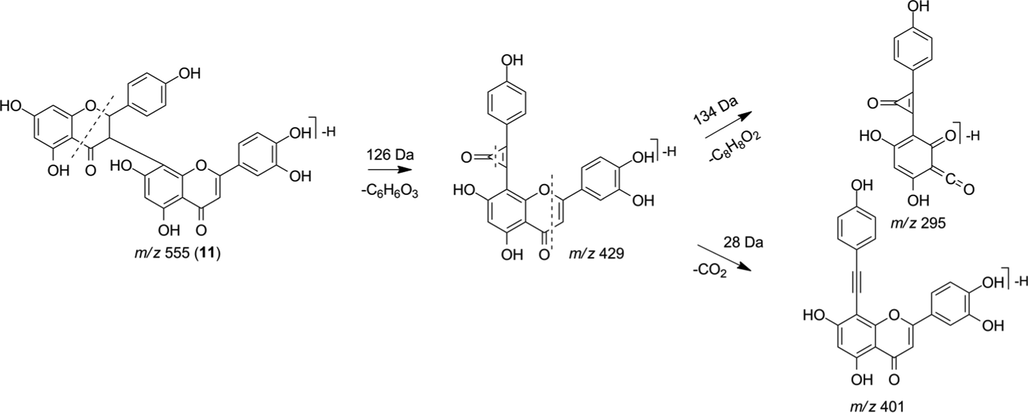
Fragmentation proposal for morelloflavone (11).
Some degenerative diseases such as cancer, atherosclerosis, brain dysfunction, as well as many biological complications, including chronic inflammation, diabetes mellitus, and autoimmune diseases, are associated with free radicals. The body activates intracellular antioxidant systems in addition to a diet rich in natural antioxidants to control the concentration of these reactive species. Phenolic compounds, especially flavonoids, are powerful antioxidants and potential antidiabetic agents (Bursal et al., 2019; Carvalho et al., 2018; Mesa-Vanegas et al., 2015; Taslimi et al., 2020).
The evaluation of the antioxidant activity of the aqueous fraction of M. acutifolium in the DPPH assay indicated in the percentage of antioxidant activity of 28.37%±0.94 in the concentration of 250 μg mL−1, while for the positive controls BHT and rutin the percentages were 89.88%±0.83 and 94.14%±0.22, respectively. The total phenolic content (TPC), expressed in mg of gallic acid equivalent per gram of sample (mg of sample/GAE), determined for the aqueous fraction was 151.70 ± 9.44. It is possible to observe the correlation between the percentage of antioxidant activity and the total phenolic content, these data are compatible with the data reported for the extracts from other species Terminalia brasiliensis (bark and leaf), Cenostigma macrophyllum (leaf) and Copernicia prunifera (root) (Sousa et al., 2007).
4 Conclusions
The analyses of the aqueous fraction of M. acutifolium leaves by HPLC-DAD suggested the presence of flavonols and isoflavonoids. The study by DI-ESI-MS/MS allowed the identification of the flavonoids quercetin-3-O-rhamnosyl-(1→6)-hexoside (1), quercetin-3-O-rhamnosyl-(1→6)-hexosyl-7-O-rhamnoside (2), quercetin-3-O-rhamnosyl-(1→2)-[rhamnosyl-(1→6)]-hexosyl-7-O-rhamnoside (3), kaempferol-3-O-rhamnosyl-(1→3)-rhamnosyl-(1→2)-[rhamnosyl-(1→6)]-hexosyl-7-O-rhamnoside (4), kaempferol-3-O-rhamnosyl-(1→2)-[rhamnosyl-(1→6)]-galactosyl-7-O-rhamnoside (5), kaempferol-3-O-rhamnosyl-(1→6)-galactosyl-7-O-rhamnoside (6), kaempferol-3-O-rhamnosyl-(1→6)-hexoside (7), kaempferol-3-O-hexoside (8), the isoflavonoids genistein (9), daidzein-8-C-glucoside (10) and one biflavonoid morelloflavone (11). The structure of flavonoids 5 and 6 was confirmed by NMR. These compounds are being reported for the first time from the leaves of Machaerium acutifolium. The percentage of antioxidant activity was lower than the positive controls and the total phenolic content was considered moderate.
Author Contributions
Ruth R. Soares de Farias contributed to the collection and identification of the plant (Machaerium acutifolium). Adonias A. Carvalho, Lucivania R. dos Santos, Jurema S. de Freitas, Renato P. de Sousa, Gerardo M. Vieira Jr. and Mariana H. Chaves contributed in the procedures of the extracts preparation and identification of the compounds. Adonias A. Carvalho also contributed to the draft of the article. Mariana H. Chaves, Gerardo M. Vieira Jr., and Mahendra Rai contributed with revision and critical reading of the manuscript. Mariana H. Chaves and Gerardo M. Vieira Jr. coordinated and supervised the laboratory work. All the authors have read the final manuscript and approved the submission.
Acknowledgments
This research was supported by the CAPES and CNPq (PQ-1D: 302470/2018-2, Universal: 406126/2018-6 and INCTBioNat: 465637/2014-0). The authors would like to thank for the financial support and scholarships of L. R. Santos, R. P. Sousa, J. S. Freitas, and M. H. Chaves.
Declaration of Competing Interest
The authors declare that they have no known competing financial interests or personal relationships that could have appeared to influence the work reported in this paper.
References
- A study of characteristic fragmentation of isoflavonoids by using negative ion ESI-MSn. J Mass Spectrom.. 2010;46(1):77-84.
- [CrossRef] [Google Scholar]
- Structural characterization of flavonol 3,7-di-O-glycosides and determination of the glycosylation position by using negative ion electrospray ionization tandem mass spectrometry. J Mass Spectrom.. 2006;41(3):352-360.
- [CrossRef] [Google Scholar]
- Characterization of Leaf Phenolic Compounds of Sabicea johnstonii by HPLC-MSn. J. Nat. Prod. Resour.. 2016;2(2):86-89.
- [Google Scholar]
- Documentação e valorização da fitoterapia tradicional Kayapó nas aldeias A’Ukre e Pykanu - sudeste do Pará. Rev. Bras. Farmacogn.. 2003;13:47-49.
- [CrossRef] [Google Scholar]
- (Poly)phenolic characterization of three food supplements containing 36 different fruits, vegetables and berries. Pharma Nutrition.. 2015;3(2):11-19.
- [CrossRef] [Google Scholar]
- Evaluation of antioxidant capacity of endemic plant Marrubium astracanicum subsp. macrodon: Identification of its phenolic contents by using HPLC-MS/MS. Nat. Prod. Res.. 2019;33(13):1975-1979.
- [CrossRef] [Google Scholar]
- Comprehensive characterization and antioxidant activities of the main biflavonoids of Garcinia madruno: A novel tropical species for developing functional products. J. Funct. Foods.. 2016;27:503-516.
- [CrossRef] [Google Scholar]
- Carvalho, A.A., Santos, L.R., Sousa, R.P., Freitas, J.S., Chaves, M.H., 2019. Flavonoids identification of Machaerium acutifolium by ESI-MS. In: 7TH BRAZILIAN CONFERENCE ON NATURAL PRODUCT/ XXXIII RESEM PROCEEDINGS, 2019, Rio de Janeiro. Anais eletrônicos... Campinas, Galoá, 2019. Disponível em: <https://proceedings.science/bcnp-2019/papers/flavonoids-identification-of-machaerium-acutifolium-by-esi-ms> Acesso em: 14 jul. 2021.
- Phenolic derivatives and antioxidant activity of polar extracts from Bauhinia pulchella. Quim. Nova.. 2018;41(4):405-411.
- [CrossRef] [Google Scholar]
- In-time and in-space tandem mass spectrometry to determine the metabolic profiling of flavonoids in a typical sweet cherry (Prunus avium L.) cultivar from Southern Italy. J Mass Spectrom.. 2014;49(10):1025-1034.
- [CrossRef] [Google Scholar]
- Application of ESI/MS, CID/MS and tandem MS/MS to the fragmentation study of eriodictyol 7-O-glucosyl-(1→2)-glucoside and luteolin 7-O-glucosyl-(1→2)-glucoside. Int. J. Mass Spectrom.. 2005;247(1–3):93-100.
- [CrossRef] [Google Scholar]
- Flavonol tetraglycosides and other constituents from leaves of Styphnolobium japonicum (Leguminosae) and related taxa. Phytochemistry.. 2007;68:1407-1416.
- [CrossRef] [Google Scholar]
- Lorenzi, H., 1998. Arvores brasileiras: manual de identificação e cultivo de plantas arbóreas do Brasil, first ed. Plantarum, Nova Odessa, v.2.
- The Systematic Identification of Flavonoids. New York: Springer-Verlag; 1970.
- A fragmentation study of an isoflavone glycoside, genistein-7-O-glucoside, using electrospray quadrupole time-of-flight mass spectrometry at high mass resolution. Int. J. Mass Spectrom.. 2004;232(2):171-183.
- [CrossRef] [Google Scholar]
- Machaerium acutifolium compounds with larvicidal activity against Aedes aegypti. Pest Manag. Sci.. 2021;77(33):1444-1451.
- [CrossRef] [Google Scholar]
- Actividad antioxidante de extractos de diferente polaridad de Ageratum conyzoides L. Bol. Latinoam. Caribe Plant. Med. Aromat.. 2015;14(1):1-10.
- [Google Scholar]
- Variation in flavonoid pattern in leaves and flowers of Primula veris of different origin and impact of UV-B. Biochem. Syst. Ecol.. 2014;53:81-88.
- [CrossRef] [Google Scholar]
- Petrostyrene, a cinnamylphenol from Machaerium acutifolium. Phytochemistry.. 1978;17:1379-1381.
- [CrossRef] [Google Scholar]
- Pinheiro, P. F., Justino, G. C., 2012. Structural Analysis of Flavonoids and Related Compounds - A Review of Spectroscopic Applications in: Rao, V. (Ed), Phytochemicals - A Global Perspective of Their Role in Nutrition and Health, InTechOpen, pp. 33-56. ISBN: 978-953-51-0296-0. https://www.intechopen.com/books/phytochemicals-a-global-perspective-of-their-role-in-nutrition-and-health/structural-analysis-of-flavonoids-and-related-compounds-a-review-of-spectroscopic-applications.
- O gênero Machaerium (Leguminosae-Papilionoideae-Dalbergieae) no pantanal brasileiro. Rodriguésia.. 2007;58(2):313-329.
- [CrossRef] [Google Scholar]
- Mass spectrometric methods for the analysis of chlorinated and nitrated isoflavonoids: a novel class of biological metabolites. J. Mass Spectrom.. 2003;38(7):764-771.
- [CrossRef] [Google Scholar]
- Composição química e atividades fotoprotetora e antiradicalar in vitro dos galhos de Platonia insignis (Clusiaceae) Quim. Nova.. 2021;44(8):954-962.
- [CrossRef] [Google Scholar]
- Isolation and identification of the five novel flavonoids from Genipa americana leaves. Molecules.. 2018;23(10):1-13.
- [CrossRef] [Google Scholar]
- Fenóis totais e atividade antioxidante de cinco plantas medicinais. Quim. Nova.. 2007;30(2):351-355.
- [CrossRef] [Google Scholar]
- Anti-Alzheimer, antidiabetic and antioxidant potential of Satureja cuneifolia and analysis of its phenolic contents by LC-MS/MS. Arab. J. Chem.. 2020;13(3):4528-4537.
- [CrossRef] [Google Scholar]
- Flavonol pentaglycosides of Cordyla (Leguminosae: Papilionoideae: Swartzieae): Distribution and taxonomic implications. Phytochemistry.. 2008;69:2329-2335.
- [CrossRef] [Google Scholar]
- Structural characterization of flavonoid glycosides by multi-stage mass spectrometry. Mass Spectrom. Rev.. 2010;29(1):1-16.
- [CrossRef] [Google Scholar]
- Rapid Screening and Identification of Daidzein Metabolites in Rats Based on UHPLC-LTQ-Orbitrap Mass Spectrometry Coupled with Data-Mining Technologies. Molecules.. 2018;23(1):1-24.
- [CrossRef] [Google Scholar]
Appendix A
Supplementary material
Supplementary data to this article can be found online at https://doi.org/10.1016/j.arabjc.2022.103765.
Appendix A
Supplementary material
The following are the Supplementary data to this article:Supplementary Data 1
Supplementary Data 1


