

Translate this page into:
In-vivo metabolic profiling of the Natural products Emodin and Emodin-8-O-β-D-glucoside in rats using liquid chromatography quadrupole Orbitrap mass spectrometry
⁎Corresponding author. zhhuang7308@163.com (Zhihai Huang), qiuxiaohui@gzucm.edu.cn (Xiaohui Qiu)
-
Received: ,
Accepted: ,
This article was originally published by Elsevier and was migrated to Scientific Scholar after the change of Publisher.
Abstract
Emodin (EM) and emodin-8-O-β-D-glucoside (EG) were found in various medicinal plants such as Rheum palmatum, Aloe vera, Polygonum multiflorum, and Polygonum cuspidatum. They have different pharmacological properties and are considered potentially toxic substances. It is necessary to identify the metabolites and their distribution in the body. In this study, a comprehensive analytical strategy was developed to characterize the metabolites of EM and EG in vivo using UHPLC-Q-Exactive Orbitrap MS. 190 metabolites were identified in the bio-samples, in addition to the commonly reported glycoside hydrolysis, hydrogenation, hydroxylation, glucuronide conjugation, and sulfation conjugation. We also discovered new pathways such as formylation, acetylation, glycol acylation, lactation, glycerolization, malonylation, glycerol acid acylation, hydroxyvalerylation, erythrosylation, glutaric acidfication, hydroxybenzoylation, glutamylation, hydroxyglutamylation, ascorbylation, aspartylglycylation, dihydroxyphenylglycylation, trihydroxyphenylglycylation, dihydroxymethoxyphenylglycylation, and ring-opening of EM. Cluster analysis revealed that each tissue in the EM and EG groups exhibited a high degree of similarity in their metabolic pathway preferences and bodily distributions, as they clustered together. Interestingly, the presence of glycol acylation, glycerolization, and glycerol acid acylation in the liver may be related to the lipid-lowering effects of EM and EG. These findings offer valuable insights for a more comprehensive understanding of the safety and efficacy of EM and EG, as well as valuable methods for metabolic characterization.
Keywords
Emodin
Emodin-8-O-β-D-glucoside
Metabolite
UHPLC-Q-Exactive Orbitrap MS

Data availability statement.
The raw data supporting the conclusion of this article will be made available by the authors, without undue reservation.
1 Introduction
Emodin (1, 3, 8-trihydroxy-6-methylanthraquinone) and emodin-8-O-β-D-glucoside are present in various medicinal plants such as Rheum palmatum, Aloe vera, Polygonum multiflorum, and Polygonum cuspidatum (Wang et al., 2017; Ghimire et al., 2015; Lin et al., 2015; Li et al., 2016). It is well-known that EM and EG have similar pharmacological properties, including anti-inflammation (Park, et al., 2016; Ding et al., 2008), anti-cancer (Hsu and Chung, 2012), lipid-lowering (Su et al., 2020), neuroprotective (Leung et al., 2020), promoting bone cell proliferation and differentiation (Lee et al., 2008), neuroprotective (Wang et al., 2007; Wang et al., 2021), cognitive enhancing effects (Mitra et al., 2022), and has broad application prospects. Meanwhile, EM and EG are also considered potential toxic substances in Polygonum multiflorum (Dong et al., 2016; Wang et al., 2022; Wu et al., 2018). The mechanism of drug-induced liver injury is closely related to metabolism.
There are many studies on the in-vivo metabolism of EM. Cheng Huiling (Cheng et al., 2020) identified 18 emodin metabolites in rat plasma through high-resolution mass spectrometry and multiple mass loss filtration, the main metabolic pathways being glucuronidation, sulfation, and hydroxylation. Chen Xuan (Tian et al., 2012) used hollow fiber liquid phase microextraction (HFLPME) coupled with high-performance liquid chromatography (HPLC) to identify six metabolites in the plasma and urine of rats of different genders. Male rats detected more types of metabolites than female rats. Wu (Wu et al., 2017) identified the metabolites of EM in rat bile and urine. There are 13 types of emodin metabolites in bile and 22 types in urine, including 4 types of phase I and 18 types of phase II metabolites. The main metabolic pathway of emodin is glucuronidation. Lin (Lin et al., 2012) conducted a study on the tissue distribution of EM and its metabolites. It was found that emodin glucuronide and sulfation products are predominantly distributed in the lungs and kidneys, with no detection in the heart and brain. There is relatively little research on the in vivo metabolism of EG. We have previously published and identified a total of 47 metabolites. EG mainly undergoes hydrolysis, hydroxylation, methylation, carboxylation, glucuronidation, sulfation, and various complex reactions in rats (Shi et al., 2021).
The material basis of a drug is crucial in determining its efficacy and toxicology. Although the in vivo metabolites of EM and EG have been published for a long time, the toxicity of EM and EG remains unclear. With the significant improvement in modern detection sensitivity, we believe that conducting in-depth research on the in vivo metabolites of EM and EG is necessary to advance the process of in vivo metabolite analysis and gain more insights into the pharmacodynamics and toxicology of EM and EG.
2 Materials and methods
2.1 Materials
EG and Citreorosein were purchased from Yuanye Bio-Technology Co., Ltd (No. T20F8Z29653, T20F8Z29653, P31O10F101343, purity ≥ 98 %, Shanghai, China). EM and Rhein were purchased China Institute for food and drug control (No. 110756–201913, 110757–201607, Beijing, China). Acetonitrile and methanol (HPLC grade), were supplied by E. Merck (Darmstadt, Germany), formic acid (HPLC grade) was purchased from fisher (United States), ultra-pure water was prepared by a Milli-Q water purification system (Millipore, MA, United States).
2.2 UHPLC-Q-Exactive plus orbitrap MS/MS analysis
2.2.1 Liquid chromatography
All the samples were analyzed using on an Ultimate 3000 UHPLC system (Dionex, USA) that was controlled by Thermo Xcalibur software (Thermo Fisher Scientific, USA). Samples were separated on a Waters UPLC T3 column (100*2.1 mm, 1.7 µm) (Waters, USA). The mobile phase consisted of solvent A (0.1 % formic acid) and solvent B (acetonitrile). A gradient elution was performed using the following optimized gradient program: 15 ∼ 30 % B at 0 ∼ 1 min, 30 ∼ 40 % B at 1 ∼ 3 min, 40 ∼ 80 % B at 3 ∼ 5 min, 80 ∼ 80 % B at 5 ∼ 8 min, 80 ∼ 15 % B at 8 ∼ 9 min, 15 ∼ 15 % B at 9 ∼ 10 min. The flow rate was maintained at 0.2 ml/min, the sample injection volume was 5 µL, and the column temperature was maintained at 35 ℃.
2.2.2 Mass spectrometry
Mass spectrometry was performed on a Q-Exactive PlusTM quadrupole-Orbitrap mass spectrometer (Thermo Fisher Scientific, USA) with heat electrospray ionization (HESI) in the negative mode. The main optimized parameters for MS were set as follows: The scan mass range was set at m/z 120–1500. a full scan and fragment spectral resolution of 70, 000 FWHM; capillary temperature, 350 ℃; auxiliary gas heater temperature, 350 ℃; spray voltage, −3.2 KV; sheath gas flow rate, 40 Arb; auxiliary gas flow rate, 15 Arb; sweep gas flow rate, 0; S-lens RF level, 50. The properties of dd-MS2 were as follows: resolution, 17, 500; The acquisition mode of stepped NCE (normalized collision energy), 30, 50, and 70 eV. The accumulated resultant fragment ions were injected into the Orbitrap mass analyzer for single-scan detection.
2.3 Animals and drug administration
Male Sprague-Dawley rats (240 ± 20 g) were obtained from the Laboratory Animal Center of Southern Medical University (Guangzhou, China), with a laboratory animal production license No.: SCXK (Yue) 2018–0094. All animals had ad libitum access to water and standard chow, and were acclimatized to the facilities for one week. The rats were housed in an air-conditioned animal facility at 23 ± 2℃, with a humidity of 55 ± 5 % and a 12 h light/dark cycle. Thirty-nine SD rats were randomly divided into plasma group, bile group, tissue (heart, liver, spleen, lung, kidney, brain) group, and urine group of EM and EG. The plasma, urine, and bile groups included three rats each, while the tissue group included nine rats. The suspensions of EM and EG (150 µmol/kg/d, 0.5 % CMC-Na in water as a vehicle) were administered to rats for three consecutive days via oral gavages. Rats in the control group received orally administered 0.5 % CMC-Na according to some protocol. Animal welfare and experimental procedures strictly adhered to the guidelines of the Committee on the Care and Use of Laboratory Animals in China as well as related ethical regulations of Guangzhou University of Chinese Medicine.
2.4 Sample collection and pretreatment
For plasma collection after the last administration, 300 μl of blood samples from orbital veins were collected at 30 min, 1, 2 and 4 h under diethyl ether anesthesia in heparinized 1.5 ml polythene tubes. The blood samples were then centrifuged at 1, 057 g for 10 min. Supernatants were removed and plasma samples from the same rat at different collecting times were mixed in equal volume. For bile sample collection, rats were anesthetized by intraperitoneal injection of 25 % urethane solution. Bile samples were gathered through bile intubation from 0 to 6 h. For urine sample collection, rats were placed in metabolite cages and urine samples were collected from 0 to 24 h after the last dosing. In terms of tissue group sampling, nine rats were randomly divided into three groups with three rats for each point. Rats were executed with 10 % chloral hydrate solution by intraperitoneal injection at 1, 2, and 4 h after the last administration, respectively. Then, the rats were dissected to collect the heart, liver, spleen, lung, kidney, and brain tissues. The tissues were washed with 0.9 % saline solution and dried with filter papers. All plasma, bile, urine, and tissue samples were stored at −80 °C until analysis.
The collected plasma, bile, and urine samples were mixed with 4 times the volume of methanol to precipitate protein. The tissue samples were homogenized in an ice-bath condition with 3 times the amount (g/ml) of 0.9 % saline solution, subsequently extracted by ultrasound (power 280 W, frequency 40 kHz) for 10 min, and then centrifuged at 122, 136 g for 30 min. Supernatants were then removed, and the tissue samples from the same rat at different collection times were mixed in equal volumes. Then, the mixed supernatants added 3 times the volume of methanol, vortexed for 30 s, and then centrifuged at 122, 136 g for another 30 min. Finally, an aliquot of separate supernatants measuring 5 μl was injected into the UHPLC-Q Exactive-Orbitrap MS system for further analysis.
3 Results and discussion
The metabolism profile of EM and EG in vivo was evaluated systemically in this study, as shown in Supplementary Figure. 190 metabolites were identified using a UHPLC-Q Exactive-Orbitrap mass system, detailed information can be found in Supplementary Table 1. The metabolic pathways of rat EM and EG are not only consistent with the reported hydrolysis, hydrogenation, hydroxylation, dihydroxylation, glucuronide conjugation and sulfate conjugation, but some new metabolic pathways leading to metabolites are also analysed in this manuscript. In addition to glucuronidation and sulfation, glutamic acid, ascorbic acid, glycerol, glyceric acid, and other compounds have been identified in this manuscript among the phase II metabolites in this manuscript as forming metabolites with EM dehydration. These compounds were first identified and represent a direction in the metabolism of the compounds.
Mass Fragmentation Pathways of EM and EG. In the MS spectrum, the deprotonated molecular ion of EM and EG at m/z 269.0457 and 431.0979 with the chemical formula of C15H9O5 and C21H19O10 were observed at 8.49 min and 6.11 min, respectively. MS2 spectra of EM (E3) detected ions at m/z 269.0456, 241.0500, and 225.0547, which were formed by the loss of H2O and CO2 from EM. And MS2 spectra of EG (E54) detected ions at m/z 431.0981, 269.0456 and 225.0547. And the characteristic ion m/z 269.0457 was produced by neutral loss of C6H10O5 (hexose). Interestingly, the EM group samples mostly contain EG, indicating the presence of glycosylase catalyzed reactions in rats, which is inconsistent with previous reports. Metabolites E26-1 to E26-6 were tentatively characterized as sulfated emodin. The [M−H]− ion at m/z 349.0027 (C15H9O8S) and MS2 ions at m/z 349.0027 and 269.0454 (C15H9O4, 80 Da, loss of SO3) were observed in the secondary mass spectrum, suggesting that metabolites E26-1 to E26-6 had undergone sulfate conjugation. And emodin undergoes glucuronide conjugation in rats to give metabolites E58-1, E58-2 and E58-3, the deprotonated molecular ion m/z 445.0778 with the chemical formula of C21H17O11 and observed at 5.25 min, 6.04 min, and 6.58 min, product ions at m/z 445.0774 (C21H17O11) and 269.0452 (C15H9O5, −176 Da).
Identification of Metabolites In Vivo. Metabolites E1-1 and E1-2 were eluted at 6.82 min and 7.60 min with same quasi-molecular [M−H]− ion at m/z 237.0553 (C15H9O3) and the product ions at m/z 237.0553 (C15H9O3) and 209.0662 (C14H9O2). Both parent and fragment ions are 32 Da (2O) lower than compound E3. Therefore, compounds E1-1 and E1-2 were tentatively characterized as dideoxyemodin. Similarly, compound E2 was characterized as deoxyemodin. Since the [M−H]− ion at m/z 253.0506 (C15H9O4) and MS2 ions at m/z 253.0501, 225.0543 and 209.0593. Both parent and fragment ions are 16 Da (O) lower than compound E3.
Metabolites E4-1 and E4-2 exhibited retention times of 6.63 min and 6.73 min and were detected at m/z 271.0614 in MS spectra, demonstrating the same chemical formula of C15H11O5. Ions at m/z 271.0614, 253.0485, 227.0694 are 16 Da (O) lower than compounds E9. Therefore, metabolites E4-1 and E4-2 were tentatively characterized as ring open-hehydroxyemodin. Metabolites E9-1, E9-2 and E9-3 were detected at 5.54 min, 7.76 min, and 7.90 min, with the same quasi-molecular ion [M−H]− at m/z 287.0560 and an element composition of C15H11O6. MS2 fragment ions at m/z 269.0449 (C15H9O5), 259.0604 (C14H11O5), 243.0664 (C14H11O4), and 225.0557 (C14H9O3). From the saturation of the molecular formula and the fragment ion situation, it should be the ring opening between C9-C11 or C9-C12 of emodin, indicating that metabolites E9-1, E9-2, and E9-3 have been tentatively characterized as ring opening emodin.
Metabolite E5, with an elution time at 6.72 min, showing an [M−H]− ion at m/z 281.0563, indicating an element composition of C16H9O5. Ions at m/z 281.0463, 253.0507, and 225.0549 were observed in the secondary mass spectrum, both parent and fragment ions are 28 Da (CO) higher than compound E2. Therefore, metabolite E5 was tentatively characterized as deoxyformylated emodin.
Metabolite E6 was eluted at 7.61 min, with the molecular formula C15H7O6 at m/z 283.0249. fragment ions at m/z 283.0262 (C15H7O6), 255.0299 (C14H7O5), and 239.0343 (C14H7O4). Ion m/z 239.0343 was formed by loss of CO2 from the parent ion. Comparison with reference standard, metabolite E6 was characterized as rhein.
Metabolites E7-1, E7-2, and E7-3 were detected at 7.46 min, 7.59 min, and 7.66 min, with the same quasi-molecular ion [M−H]− at m/z 283.0607 and giving element composition of C16H11O5. MS2 ions at m/z 268.0376 (C15H8O5) and 240.0422 (C14H8O4) by successive losses of CH3 and CO. Metabolites E7-1, E7-2 and E7-3 were tentatively characterized as methylemodin.
Metabolites E8-1 to E8-8 were eluted at 5.86 min, 6.18 min, 6.68 min, 6.91 min, 7.40 min, 7.48 min, 8.78 min, and 9.01 min, showed [M−H]− ion at m/z 285.0501, indicating an element composition of C15H9O5. ions at m/z 285.0405, 257.0453, 241.0499, 226.0261, 213.0546, and 198.0309 were observed in the secondary mass spectrum, both parent and fragment ions are 16 Da (O) higher than compound E3. Therefore, metabolites E8-1 to E8-8 were tentatively characterized as hydroxyemodin. Metabolites E13-1, E13-2, and E13-3 were tentatively characterized as dihydroxyemodin. The [M−H]− ion at m/z 301.0356 (C15H9O7) and MS2 ions at m/z 301.0378, 283.0251, 273.0405, and 225.0297. fragment ions are 16 Da (O) higher than compounds E8. Similarly, metabolites E17-1 and E17-2 were tentatively characterized as dihydroxymethylemodin, since the [M−H]− ion at m/z 315.0511 (C16H11O7) and MS2 ions at m/z 315.0511, 300.0275, 272.0372, and 244.0372. Fragment ions are 14 Da (CH2) higher than compounds E13. Metabolite E40 was eluted at 6.03 min, with molecular formula C16H11O10S at m/z 395.0081. fragment ions at m/z 395.0081, 315.0510, 300.0277, and 272.0332, which suggested that E40 was obtained by sulfate conjugation and dihydroxymethylemodin. Therefore, metabolite E40 was tentatively characterized as sulfated dihydroxymethyl emodin. Metabolites E20-1 to E20-4 were detected at 6.28 min, 6.55 min, 6.99 min, and 7.72 min, possessing the same ion [M−H]− at m/z 329.0304 and giving element composition of C16H9O9. MS2 fragment ions at m/z 329.0305 (C16H9O8) and 285.0404 (C15H9O6, hydroxyemodin, –CO2). Thus, metabolites E20-1 to E20-4 were tentatively characterized as carboxyl hydroxyemodin.
Metabolites E10-1 and E10-2 exhibited retention times of 6.95 min and 7.48 min and were detected at m/z 297.0407 in MS spectra, showing the same chemical formula of C16H9O6. Ions at m/z 297.0407, 269.0457, 225.0556 are 28 Da (CO) higher than compounds E3, loss of CO obtained EM, indicated that metabolites were obtained by the formylation reaction of EM. Therefore, metabolites E10-1 and E10-2 were tentatively characterized as formyl emodin.
Metabolite E11 was eluted at 7.05 min, with molecular formula C15H7O7 at m/z 299.0201, fragment ions at m/z 299.0193 (C15H7O7), 255.0299 (C14H7O5), and 227.0340 (C13H7O4). Both parent and fragment ions are 16 Da (O) higher than compound E6. Therefore, metabolite E11 was tentatively characterized as emodic acid.
Metabolite E12, eluted with a retention time of 8.62 min, was found in MS spectra at m/z 299.0552, with the molecular formula of C16H11O6, fragment ions at m/z 299.0548 (C16H11O6), 284.0320 (C15H8O6), and 256.0374 (C14H8O5). Both parent and fragment ions are 16 Da (O) higher than compounds E7. metabolite E12 was tentatively characterized as fallacinol. And metabolites E36-1 to E36-4 showed the same [M−H]− ion at m/z 379.0133 (C16H11O10S) at 5.27 min, 5.90 min, 7.19 min, and 7.97 min, and MS2 spectra gave ions at m/z 299.0555 and 256.0377, indicating that fallacinol undergo sulfate conjugation. Thus, metabolites E36-1 to E36-4 were identified as sulfated fallacinol.
Metabolites E14-1, E14-2, and E14-3 were detected at 7.85 min, 8.02 min, and 8.14 min, with the same ion [M−H]− at m/z 311.0565 and an element composition of C17H11O6. MS2 fragment ions at m/z 311.0565 (C17H11O6), 283.0614 (C16H11O5), 269.0449 (C15H9O5), and 225.0557 (C14H9O3). The ion at m/z 269.0449 was formed by the loss of C2H2O from the parent ion, so the substituent is CH3COOH. Metabolites E14-1, E14-2, and E14-3 were tentatively characterized as acetyl emodin.
Metabolites E15-1, E15-2, and E15-3 showed the same [M−H]− ion at m/z 313.0352 (C16H9O7) at 7.75 min, 7.95 min, and 8.23 min. MS2 spectra gave ions at m/z 313.0352, 285.0404, and 269.0456. Fragment ion display loss of CO2 gave ion m/z 269.0456 (EM). Therefore, metabolites E15-1, E15-2, and E15-3 were identified as carboxyl emodin. And metabolites E40-1, E40-2, and E40-3 showed the same [M−H]− ion at m/z 392.9930 (C16H9O10S) at 5.54 min, 5.76 min, and 7.75 min, and the MS2 spectra gave ions at m/z 392.9916, 313.0351, 284.0411, and 269.0456, indicating that carboxyl emodin undergo sulfate conjugation. Thus, metabolites E40-1, E40-2, and E40-3 were identified as carboxyl-sulfated emodin.
Metabolites E16-1 to E16-6 were eluted at 5.17 min, 6.86 min, 7.33 min, 7.47 min, 7.62 min, and 7.93 min, showed an [M−H]− ion at m/z 313.0719 and an element composition of C17H13O6. Fragment ions at m/z 313.0709, 295.0608, 283.0611, and 269.0454 were observed by successive losses of H2O, CH2O and C2H4O. Therefore, metabolites E16-1 to E16-6 were tentatively characterized as ethylene glycol emodin. Ethylene glycol emodin also undergo sulfate conjugation, giving the ion [M−H]− at m/z 393.0293 and an element composition of C17H12O9S. MS2 fragment ions at m/z 393.0293, 313.0709, 295.0612, and 269.0453. Therefore, metabolites E41-1, E41-2, and E41-3 were tentatively characterized as ethylene glycol sulfated emodin. The proposal fragmentation pathway is shown in Fig. 2.
Metabolites E18-1 and E18-2 exhibited retention times of 8.35 min and 8.83 min and were detected at m/z 325.0722 in the MS spectra, showing the same chemical formula of C18H13O6. The ions at m/z 325.0711, 283.0610, 254.0610, and 240.0426 are 42 Da (C2H2O) lower than compounds E7. Therefore, metabolites E18-1 and E18-2 were tentatively characterized as methylacetylemodin. Sulfate conjugation then occurred to give metabolite E45, eluted with a retention time of 8.62 min, which was found in MS spectra at m/z 405.0277, which in consistent with the theoretical molecular formula of C18H13O9S. The fragment ions at m/z 405.0269, 325.0704, 283.0597, and 254.0576.
Metabolites E19-1, E19-2, and E19-3 were detected at 5.13 min, 7.58 min, and 7.93 min with the same ion [M−H]− at m/z 327.0517, giving element composition of C17H11O7. MS2 fragment ions at m/z 327.0517 (C17H11O7), 283.0614 (C16H11O5), 255.0660 (C15H9O4), and 239.0709 (C15H9O3). Removal of one molecule of CO2 to obtain 283.0614 (methylation), metabolites E19-1, E19-2, and E19-3 were tentatively characterized as methylcarboxylemodin. Similarly, metabolite E46, which may undergo sulfate conjugation, was characterized as methyl sulfated carboxylemodin. Since the [M−H]− ion at m/z 407.0084 (C17H11O10S) and MS2 ions at m/z 327.0508, 283.0615, 255.0662, and 239.0708.
Metabolites E21-1 and E21-2 exhibited retention times of 6.02 min and 6.72 min and were detected at m/z 333.0076 in the MS spectra, showing the same chemical formula of C15H9O7S. Ions at m/z 333.0066 and 253.0504 (C15H9O4, 80 Da, loss of SO3) were observed in the secondary mass spectrum, suggesting that metabolites E21-1 and E21-2 had undergone sulfate conjugation, and were tentatively characterized as sulfated deoxyemodin. Metabolites E31-1, E31-2, and E31-3 were characterized as sulfated methylemodin. The [M−H]− ion at m/z 363.0174 (C16H11O8S) and the MS2 ions at m/z 363.0174, 283.0605, and 240.0418. Similarly, metabolites E32-1 to E32-6 were characterized as sulfated hydroxyemodin. The [M−H]− ion at m/z 364.9972 (C15H9O9S) and the MS2 ions at m/z 285.0403 and 241.0500. metabolites E35-1 and E35-2 were characterized as sulfated emodic acid. Since [M−H]− ion at m/z 378.9758 (C16H9O9S) and MS2 ions at m/z 378.9758 and 299.0194.
Metabolite E22, eluted with a retention time of 8.01 min, was found in MS spectra at m/z 339.0511, consistent with the theoretical molecular formula of C18H11O7. MS2 fragment ions at m/z 399.0503 (C18H11O7), 311.0556 (C17H11O6), 269.0453 (C15H9O5), 241.0500 (C14H9O4), and 225.0547 (C14H9O3). Ion m/z 269.0453 was obtained by continuous loss of CO and COCH3. Therefore, metabolite E22 was tentatively characterized as formyl acetyl emodin.
Metabolites E23-1, E23-2, and E23-3 were detected at 6.98 min, 7.58 min, and 7.86 min, respectively, with the same ion [M−H]− at m/z 341.0667 and an element composition of C18H13O7. MS2 fragment ions at m/z 341.0667 (C18H13O7), 323.0554 (C18H11O6), 308.0328 (C17H8O6), 295.0612 (C17H11O5), 283.0614 (C16H11O5), and 269.0453 (C15H9O5). The compound shows an additional molecule of C3H6O3 compared to EM, possibly lactic acid. Based on the literature and fragment ions, metabolites E23-1, E23-2, and E23-3 were tentatively characterized as lactated emodin. Similarly, metabolites E25-1 to E25-4 were tentatively characterized as glycerol emodin. Since [M−H]− ion at m/z 343.0463 (C17H11O8) and MS2 ions at m/z 343.0817, 325.0711, 283.0612, and 269.0465. Fragment ions are 2 Da (H2) higher than compounds E23. Thus, metabolite E50 and E51 were detected at 4.24 min and 5.07 min, showing [M−H]− ions at m/z 421.0245 (C18H13O10S) and 423.0033 (C17H11O11S). MS2 of E50 fragment ions at m/z 341.0667 (C18H13O7, −80 Da, loss of SO3), 323.0554, 308.0328, 295.0612, 281.0456, and 269.0453. And MS2 of E51 fragment ions at m/z 343.0453 (C17H11O8, −80 Da, loss of SO3), 325.0351, 299.0559, 281.0457, and 269.0465. Therefore, metabolite E50 was characterized as sulfated lactated emodin and E51 was characterized as sulfated carboxyl fallacinol.
Metabolites E24-1 and E24-2 exhibited retention times of 6.32 min and 6.75 min and were detected at m/z 343.0463 in MS spectra, showing the same chemical formula of C17H11O8. The MS2 ions at m/z 343.0470, 299.0561, 281.0458, and 253.0505, which were 44 Da (COOH) higher than compound E12. Therefore, metabolites E24-1 and E24-2 were tentatively characterized as carboxyl fallacinol.
Metabolites E27-1, E27-2, and E27-3 were detected at 6.54 min, 7.19 min, and 7.95 min, with the same ion [M−H]− at m/z 355.0463 and an element composition of C18H11O8. MS2 fragment ions at m/z 355.0455 (C18H11O8), 327.0507 (C17H11O7), 311.0573 (C17H11O6), 296.0325 (C16H8O6), 283.0611 (C16H11O5), 269.0453 (C15H9O5), and 240.0426 (C14H8O4). The compound shows an additional molecule of C3H4O4 compared to EM, possibly malic acid. According to the literature, metabolites E27-1, E27-2, and E27-3 were tentatively characterized as malonyl emodin.
Metabolites E28-1 to E28-4 were eluted at 7.50 min, 7.81 min, 7.98 min, and 8.10 min and showed an [M−H]− ion at m/z 355.0815, indicating an element composition of C19H15O7. Fragment ions were observed at m/z 355.0806, 237.0696, 325.0702, 307.0600, 282.0523, and 269.0450. The compound shows an additional molecule of C4H8O3 compared to EM, possibly hydroxybutyric acid. Therefore, metabolites E28-1 to E28-4 were tentatively characterized as hydroxybutyryl emodin.
Metabolites E29-1 (Rt = 6.27 min) and E29-2 (Rt = 6.48 min) showed the same [M−H]− ion at m/z 357.0258 (C17H9O9) and MS2 spectra gave ions at m/z 313.0352 (C16H9O7, –CO2), 269.0457 (C15H9O5, –CO2), 241.0503 (C14H9O4), and 225.0547 (C14H9O3). Fragment ions m/z 269.0457, 241.0503, and 225.0547 were the same as the fragment ion of EM, and ion m/z 269.0457 was obtained by two consecutive losses of CO2, metabolites E29-1 and E29-2 were identified as dicarboxyl emodin.
Metabolites E30-1 to E30-4 were eluted at 6.02 min, 6.80 min, 7.21 min, and 7.89 min, showing an [M−H]− ion at m/z 357.0611, indicating an element composition of C18H13O8. Fragment ions were observed at m/z 357.0603, 313.0704, 295.0600, 283.0603, and 269.0450. The compound exhibits an additional molecule of C3H6O4 compared to EM, possibly glyceric acid. Therefore, metabolites E30-1 to E30-4 were tentatively characterized as glyceryl acid emodin.
Metabolites E33-1 and E33-2 exhibited retention times of 7.81 min and 7.64 min and were detected at m/z 369.0985 in MS spectra, showing the same chemical formula of C20H17O7. Fragment ions at m/z 369.0977, 315.0875, 325.0715, 283.0612, and 269.0457. The compound shows an additional molecule of C5H10O3 compared to EM, possibly hydroxyvaleric acid, were tentatively characterized as hydroxyvaleryl emodin. Similarly, metabolites E34-1 and E34-2 were characterized as erythrose emodin. Since [M−H]− ion at m/z 371.0767 (C19H15O8) and MS2 ions at m/z 371.0757, 353.0658, 341.0650, 323.0556, 311.0550, 295.0603, 283.0609, 269.0447, and 225.0542. The compound shows an additional molecule of C4H8O4 compared to EM, possibly erythrose. The proposal fragmentation pathway is shown in Fig. 1.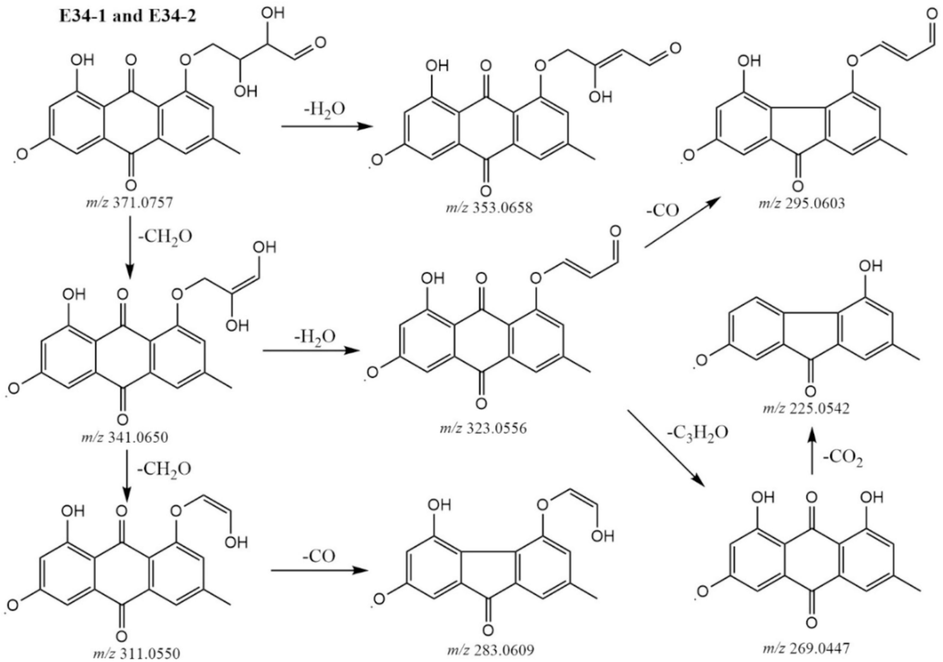
The proposal fragmentation pathways of compounds E34-1 and E34-2.
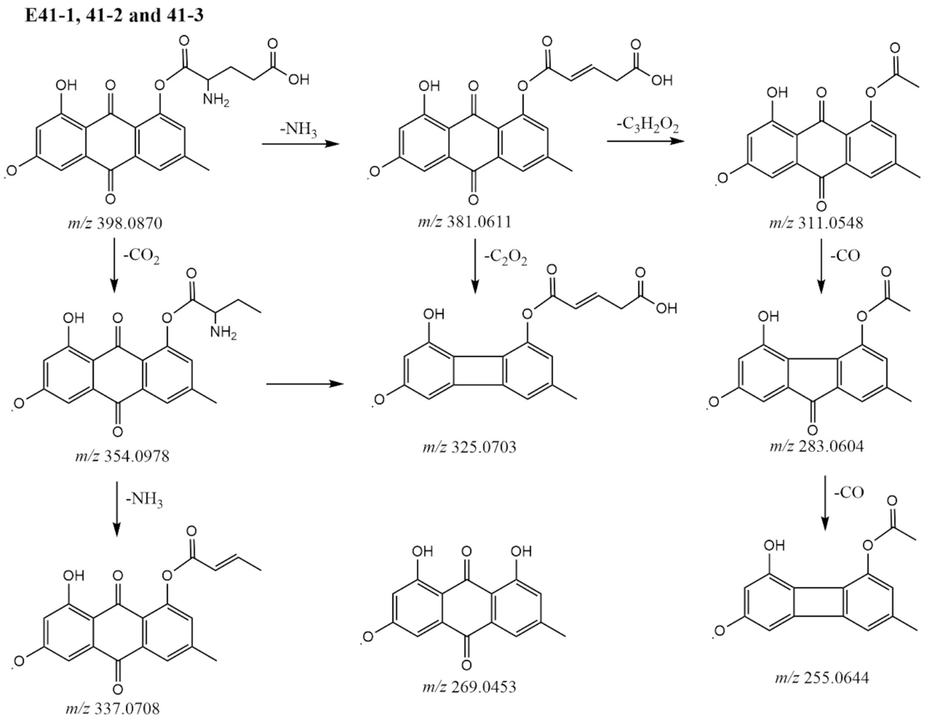
The proposal fragmentation pathways of compounds E41-1, E 41–2, and E41-3.
Metabolites E37-1, E37-2, and E37-3 exhibited retention times of 4.97 min, 5.16 min, and 5.34 min and were detected at m/z 380.9924 in MS spectra, indicating the same chemical formula of C15H9O10S. Fragment ions at m/z 380.9906 and 301.0351 (C15H9O7, −80 Da, loss of SO3) were observed in the secondary mass spectrum, suggesting that metabolites E37-1, E37-2, and E37-3 had undergone sulfate conjugation. Therefore, they were tentatively characterized as sulfated dihydroxyemodin.
Metabolites E38-1, E38-2, and E38-3 showed the same [M−H]− ion at m/z 383.0778 (C20H15O8) and detected at 7.28 min, 7.66 min, and 7.94 min, and MS2 spectra gave ions at m/z 383.0765, 339.0869, 321.0762, 296.0689, 281.0453, and 269.0463. The compound shows an additional molecule of C5H8O4 compared to EM, possibly glutaryl. Thus, metabolites E38-1, E38-2, and E38-3 were characterized as glutaryl emodin. Similarly, metabolites E39-1, E39-2, and E39-3 were characterized as hydroxybenzoyl emodin. The [M−H]− ion at m/z 389.0660 (C22H13O7) and the MS2 ions at m/z 389.0660 and 269.0459.
Metabolites E43-1, E43-2, and E43-3 were detected at 5.41 min, 5.98 min, and 7.04 min, respectively, with the same ion [M−H]− at m/z 398.0884 and an element composition of C20H16O8N. MS2 fragment ions at m/z 398.0870 (C20H16O8N), 381.0611 (C20H13O8), 354.0978 (C19H16O6N), 337.0708 (C19H13O6), 325.0724 (C18H13O6), 311.0558 (C17H11O6), 298.0723 (C16H12O5N), 283.0613 (C16H11O5), and 269.0453 (C15H9O5). The compound has an additional molecule of C5H9O4N compared to EM, possibly glutamic acid. According to literature and fragment ions. Metabolites E43-1, E43-2, and E43-3 were tentatively characterized as glutamyl emodin. Similarly, metabolites E44-1, E44-2, and E44-3 were characterized as hydroxyglutaryl emodin. Since the [M−H]− ion at m/z 399.0726 (C20H15O9) and MS2 ions at m/z 399.0717, 355.0823, 311.0919, 283.0610, and 269.0459. The compound shows an additional molecule of C5H8O5 compared to EM, possibly hydroxyglutaric acid.
Metabolites E47-1, E47-2, and E47-3 showed retention times of 4.92 min, 5.28 min, and 6.19 min and were detected at m/z 408.9875 in MS spectra, showing the same chemical formula of C16H9O11S. Fragment ions at m/z 408.9875, 329.0309 (C19H9O8, −80 Da, loss of SO3), 314.0067, and 286.0124 were observed in the secondary mass spectrum, suggesting that metabolites E37-1, E37-2, and E37-3 were obtained by sulfate conjugation with metabolites E20. Therefore, metabolites E37-1, E37-2, and E37-3 were tentatively characterized as sulfated carboxyl hydroxyemodin.
Metabolite E48 was eluted at 7.16 min, with molecular formula C20H13O8N2 at m/z 409.0686. The fragment ions at m/z 409.0675 (C20H13O8N2), 329.0291 (C16H9O8), and 269.0457 (C15H9O5). The compound shows an additional molecule of C5H6O4N2 compared to EM, which may be dihydroorotic acid, but this is uncertain and is provisionally defined as unknown. The metabolites E49-1 and E49-2 were also unknown. [M−H]− ion at m/z 416.0777 (C23H14O7N) and MS2 ions at m/z 398.0674, 370.0728, 354.0769, 326.0817, and 269.0459. And metabolite E57 was unknown, [M−H]− ion at m/z 437.0993 (C22H17O8N2) and MS2 ions at m/z 437.0994, 419.0883, 376.0822, 358.0715, and 269.0457.
Metabolites E52-1 (Rt = 6.69 min) and E52-2 (Rt = 6.96 min) showed the same [M−H]− ion at m/z 427.0673 (C21H15O10) and MS2 spectra gave ions at m/z 427.0673 (C21H15O10) and 269.0455 (C15H9O5). The compound shows an additional molecule of C6H8O6 compared to EM, possibly ascorbic acid (VC). Therefore, metabolites E52-1 and E52-2 were identified as ascorbyl emodin.
Metabolites E53-1 to E53-4 were eluted at 6.16 min, 6.28 min, 6.83 min, and 7.31 min and showed an [M−H]− ion at m/z 429.0835 with an element composition of C21H17O10. The fragment ion of E53-1 to E53-3 at m/z 253.0505 (C15H9O4), which was obtained by the loss of C6H8O6 (176 Da), indicated that they undergo glucuronide conjugation. Therefore, metabolites E53-1 to E53-3 were characterized as glucuronide deoxyemodin. The MS2 spectra of E53-4 gave ions at m/z 429.0820, 411.0675, 401.0883, 383.0770, 351.0511, 311.0557, and 269.0455. The compound shows an additional molecule of C6H10O6 compared to EM, possibly glucosone. Thus, metabolite E53-4 was tentatively characterized as glucosone emodin.
Metabolite E55, eluted with a retention time of 7.57 min, was found in the MS spectra at m/z 434.0872, which in consistent with the theoretical molecular formula of C23H16O8N. The fragment ions at m/z 434.0866, 416.0754, 389.1027, 372.0863, 354.0757, 325.0343, 308.0316, 297.0394, 281.0448, and 269.0449 were observed. The compound shows an additional molecule of C8H9O4N compared to EM and possibly dihydroxyphenylglycine. Thus, metabolite E55 was tentatively characterized as dihydroxyphenylglycine emodin. Similarly, metabolites E61-1 and E62-2 were identified as trihydroxyphenylglycine emodin with the [M−H]− ion at m/z 450.0823 (C23H16O9N) and MS2 ions at m/z 450.0818, 432.0702, 405.0976, 388.0803, 370.0692, 325.0345, 297.0396, 281.0488, and 269.0458. Both parent and fragment ions are 16 Da (O) higher than compound E55. Additionally, the metabolite E64 was identified as dihydroxy-methoxyphenylglycine emodin with the [M−H]− ion at m/z 464.0974 (C24H18O9N) and the MS2 ions at m/z 464.0970, 446.0861, 418.0933, 402.0989, 384.0879, 370.0692, 325.0345, 297.0396, 281.0488, and 269.0458. Both parent and fragment ions are 14 Da (CH2) higher than metabolites E61.
Metabolite E57, with an elution time of 6.04 min, showed [M−H]− ion at m/z 441.0944, indicating an element composition of C21H17O9N2. Fragment ions at m/z 441.0941, 296.0565, and 269.0457 were observed in the secondary mass spectrum. The compound shows an additional molecule of C6H10O5N2 compared to EM, possibly N-carbamyl-L-glutamic acid. Therefore, metabolite E57 was tentatively characterized as N-carbamyl-L-glutamyl emodin.
Metabolites E59-1 (Rt = 5.12 min) and E59-2 (Rt = 5.47 min) showed the same [M−H]− ion at m/z 447.0933 (C21H19O11) and MS2 spectra gave ions at m/z 447.0930 (C21H19O11), 285.0401 (C15H9O6, −C6H10O5,), 268.0378 (C15H8O6), and 241.0499 (C14H9O4). Metabolites E59-1 and E59-2 were identified as hydroxyemodin-O-glucoside. Similarly, metabolites E60-1, E60-2, and E60-3 were identified as open ring emodin-O-glucoside. The [M−H]− ion at m/z 449.1093 (C21H21O11) and MS2 ions at m/z 449.1086, 431.0978, 269.0456, and 254.0583. Fragment ions indicated that the metabolites loss H2O to give 431.0978 (EG), and lose glycosides to give ion 269.0457 (EM). And, metabolite E69 was tentatively characterized as sulfated hydroxyemodin-O-glucoside. Since [M−H]− ion at m/z 527.0504 (C21H19O14S) and MS2 ions at m/z 447.0933 (C21H19O11, −80 Da) and 285.0404.
Metabolites E62-1 to E62-4, eluted at retention times of 6.31 min, 6.52 min, 6.62 min, and 6.99 min, were found in MS spectra at m/z 459.0937, which in consistent with the theoretical molecular formulae of C22H19O11. Fragment ions at m/z 283.0614 (C16H11O5) due to loss of C6H8O6 (−176 Da), suggested that the metabolites undergo glucuronide conjugation. Thus, metabolites E62-1 to E62-4 were tentatively characterized as methylemodin-O-glucuronide. Similarly, metabolites E63-1 to E63-6 were characterized as hydroxyemodin-O-glucuronide. Since The [M−H]− ion at m/z 461.0728 (C21H17O12) and the MS2 ion at m/z 285.0403(C15H9O6) were determined by loss of C6H8O6 (−176 Da). And metabolites E65-1 and E65-2 were characterized as emodic acid-O-glucuronide. Since [M−H]− ion at m/z 475.0521 (C21H15O13) and MS2 ion at m/z 299.0194. Subsequently, metabolite E67 was characterized as methyl acetylemodin-O-glucuronide. Since [M−H]− ion at m/z 501.1040 (C24H21O12) and MS2 ions at m/z 325.0711, 283.0609, 254.0582.
Metabolites E66-1 (Rt = 3.63 min) and E66-2 (Rt = 3.86 min) showed the same [M−H]− ion at m/z 478.0450 (C20H16O11NS) and MS2 spectra gave ions at m/z 398.0870 (C20H16O8N, −80 Da), 381.0611, 354.0978, 337.0708, 325.0724, 311.0558, 298.0723, 283.0613, 269.0456, and 225.0547. Fragment ions were identical to same as metabolites E43. Therefore, metabolites E66-1 and E66-2 were identified as sulfated glutamyl emodin.
Metabolites E68-1 to E68-4 exhibited retention times of 4.06 min, 4.43 min, 5.02 min, and 6.81 min and were detected at m/z 525.0344 in MS spectra, showing the same chemical formula of C21H17O14S. Fragment ions at m/z 445.0773 and 269.0456 were probably obtained by the successive loss of SO3 (−80 Da) and C6H8O6 (−176 Da) from the deprotonated molecular ion at m/z 581.1500. Therefore, metabolites E68-1 to E68-4 were identified as sulfated emodin-O-glucuronide. Similarly, metabolites E70-1, E70-2, and E70-3 were characterized as sulfated hydroxyemodin-O-glucuronide. The [M−H]− ion at m/z 541.0295 (C20H15O9) and the MS2 ions at m/z 541.0291, 461.0730 (−80 Da), and 285.0406 (−176 Da).
Metabolites E71-1 to E71-5 showed the same [M−H]− ion at m/z 607.1315 (C27H27O16) at 4.40 min, 4.58 min, 4.81 min, 5.12 min, and 5.30 min, and MS2 spectra gave ions at m/z 607.1309, 445.0764, 431.0987, 269.0455, and 225.0548, probably due to the successive loss of C6H10O5 (−162 Da) and C6H8O6 (−176 Da) from the deprotonated molecular ion at m/z 607.1309, suggesting that the undergo glucoside and glucuronide conjugation. Metabolites E71-1 to E71-5 were identified as emodin-O-glucoside-O-glucuronide.
Metabolites E72-1 to E72-4 showed the same [M−H]− ion at m/z 621.1101 (C27H25O17) at 3.41 min, 3.75 min, 4.36 min, and 4.82 min, and MS2 spectra gave ions at m/z 621.1087, 445.0764, 269.0455, and 225.0548, which were probably obtained by the successive loss of C6H8O6 (−176 Da) and C6H8O6 (−176 Da) from the deprotonated molecular ion, indicating that they undergo di-glucuronide conjugations. Thus, metabolites E72-1 to E72-4 were identified as emodin-O-diglucuronide. Similarly, metabolites E73-1 and E73-2 were characterized as hydroxyemodin-O-diglucuronide. Since the [M−H]− ion at m/z 637.1050 (C27H25O18) and the MS2 ions at m/z 637.1050, 461.0725, and 285.0406.
Organizational distribution of EM and EG A total of 190 metabolites were identified in the EM and EG groups. Detailed information can be found in Supplementary Appendix Tabl 1, while the proposed metabolic pathways of EM and EG are illustrated in Fig. 3. To show the distribution of the metabolites, we generate a heat map by plotting the logarithmic values of the peak areas of the metabolites in urine, blood, bile, brain, heart, liver, spleen, lung and kidney tissues to show the distribution of metabolites, heat map is shown in Fig. 4. Intuitively, urine contains the most metabolites, which is consistent with the metabolic distribution pattern. Only 3 metabolites can be detected in all samples, including EM (E3) and two types of glucuronides of emodin (E58-1 and E58-2). 57 metabolites are distributed only in urine samples, other metabolites are distributed in each sample. Clustering analysis showed that the EM and EG groups of tissue samples are clustered together, indicating a similar distribution of metabolites. Interestingly, the distribution of lung tissue in the emodin group is similar to that of brain tissue of in both groups. Kidneys and blood distributions are similar, as are heart and liver distributions. The specific situation of each organization is described below.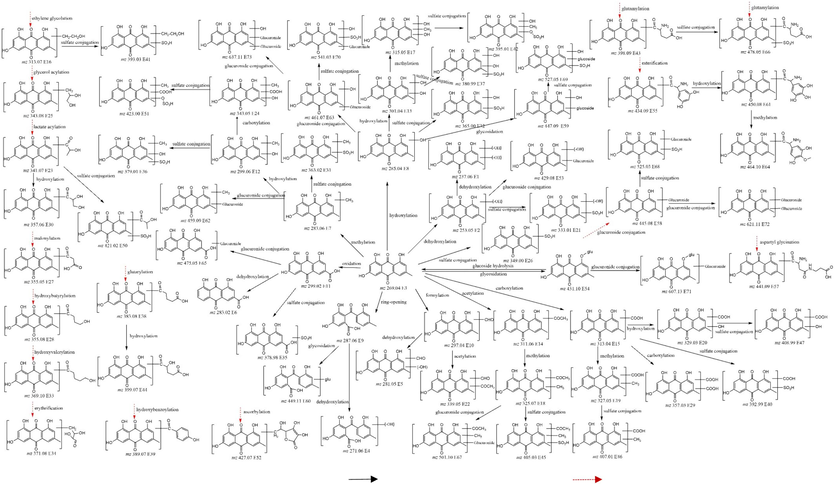
Proposed metabolic pathways of EM and EG in rats (: React in the direction of the arrow,: Direct reaction with EM).
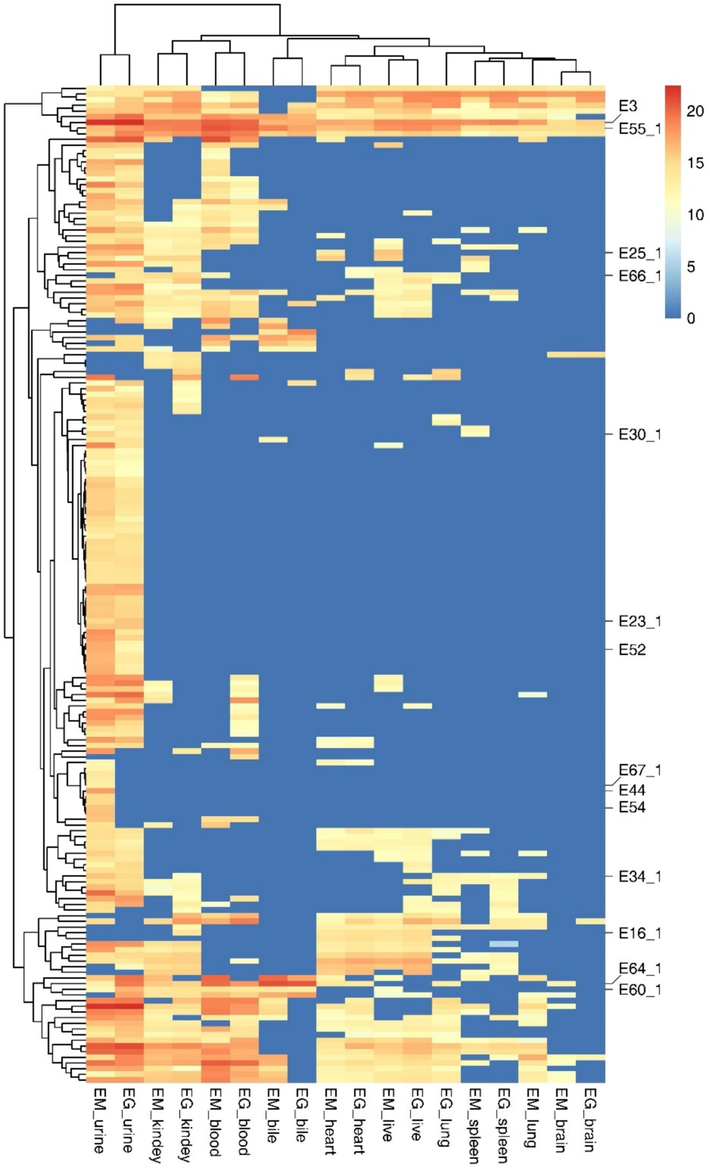
Heat map of 190 metabolites in each organization. The yellow color in the gradient indicates an increase. The blue indicated that there are no compounds present in the sample. (X-axis: (Each sample group of EM and EG;Y-axis: 190 compounds).
Metabolites in the urine 173 and 157 metabolites were found in the urine of the EM and EG groups. The EM group contained all types of compounds, but some isomers were not been detected. In the EG group, some isomers and 4 types of E46 (methyl sulfated carboxyl emodin), E57 (carglutamine emodin), E61 (trihydroxyphenylglycine emodin), and E66 (sulfated glutamyl emodin) were not detected, which were only found in the urine of the EM group. It is interesting to note that some metabolites were not detected in blood and urine, but were detected in samples such as heart and liver. The most likely reasons for this are that the concentration in the blood is too low to be detected and insufficient sensitivity of detection equipment, or that the metabolism is too fast and then quickly converted and used up in the heart or liver.
Metabolites in the blood 65 and 68 metabolites were found in the blood of the EM and EG groups. In the EM group, EM, rehin, hydroxyemodin, emodic acid, fallacinol, acetyl emodin, dihydroxymethylemodin, methyl carboxylemodin, carboxyl hydroxyemodin, glyceryl emodin, erythrose emodin, ascorbyl emodin, EG, and 41 sulfate conjugations and glucuronide conjugations were found. No acetyl emodin, ascorbyl emodin, methylemodin-O-glucuronide were found in the EG group, but methylemodin, ethylene glycol emodin, methylacetylemodin, formyl acetyl emodin, lactated emodin, glycol emodin, malonyl emodin, and 38 sulfate conjugates and glucuronide conjugations were detected. In theory, drugs are absorbed into the blood and then distributed to different tissues. However, a large number of metabolites were not detected in blood samples, which may be due to low sample content, insufficient sensitivity of detection equipment, and rapid elimination of metabolites (Chen et al., 2014; Sun et al., 2007).
Metabolites in the bile 27 and 16 metabolites were found in the bile of the EM and EG groups. The EM group found deoxyemodin, EM and 3 hydroxymodins, and sulfate conjugates and glucuronide conjugates of several metabolites, but no EG was found, which is the only sample without EG. The EG group detected EM, EG, and sulfate conjugates and glucuronide conjugates. The metabolites in the bile are very pure, all of which are sulfate conjugates and glucuronide conjugates, suggesting that other phase II metabolites are formed in the small intestine or other tissues or enter directly into the bloodstream.
Metabolites in the brain 17 and 11 metabolites were found in the brain of the EM and EG groups. The EM group found EM, EG, ethylene glycol emodin, glyceroyl emodin, erythrose emodin, and sulfate conjugates and glucuronide conjugates. The EG group detected EM, EG, ethylene glycol emodin, glyceroyl emodin, erythrose emodin, and glucuronide conjugations. curiously, the sulfate conjugate was not detected. It can be seen that the phase II metabolites of emodin can cross the blood–brain barrier and EM can also be hydrolysed from phase II metabolites. Interestingly, compounds such as ethylene glycol emodin, glycoyl emodin and ether emodin can easily cross the blood–brain barrier and have high concentrations. It is speculated that they provide energy to brain tissue to improve memory.
Metabolites in the heart 52 and 47 metabolites were found in the heart of the EM and EG groups, respectively. In the EM group, EM, ring-opened hehydroxyemodin, rehin, methylemodin, hydroxyemodin, emodic acid, ethylene glycol emodin, dihydroxymethylemodin, glycerol emodin, glyceryl emodin, erythrose emodin, dihydroxybutanoic acid, hydroxyglutaryl emodin, ascorbyl emodin, EG, and 21 sulfate and glucuronide conjugates were found. No dihydroxymethylmodulin and dihydroxybutanoic acid were detected in the EG group, while the others were basically the same except for different amounts of isomers.
Metabolites in the liver 61 and 58 metabolites were found in the liver of the EM and EG groups. The EM group detected more fallacinol, dihydroxymodulin, carbonyl emodin, methylacetylemodin, methylcarbonylemodin, and lactated emodin than the heart group. Compared to the EM group, the EG group detected acetyl emodin, formaryl acetyl emodin and no dihydroxymodulin. Components such as ethylene glycol, glycerol and glycerate, together with emodin, should undergo phase II metabolic enzymes in the liver to produce a series of metabolites which are then transported to tissues such as the heart, spleen and brain, consuming small and medium lipids in the liver which play a nutritional support role in other tissues. May be the main pathway for the treatment of fatty liver.
Metabolites in the spleen 32 and 27 metabolites were found in the spleen of the EM and EG groups. In the EM group, EM, hydroxyemodin, formyl emodin, emodic acid, ethylene glycol emodin, dihydroxyemodin, glycerol emodin, hydroxybutyryl emodin, glyceryl emodin, erythrose emodin, dihydroxybutanoic acid, EG, and sulfate conjugates and glucuronide conjugates. The distribution of the EG and EM groups is similar.
Metabolites in the lung 32 and 46 metabolites were found in the lung of the EM and EG groups. In the EM group, EM, hydroxyemodin, emodic acid, ethylene glycol emodin, glyceryl emodin, erythrose emodin, EG, and sulfate conjugates and glucuronide conjugates were found. There are 14 more metabolites distributed in the EG group than in the EM group, including: methylmodulin, acetyl emodin, acetylated fallacinol, maloyl emodin, hydroxybutyryl emodin, ascorbyl emodin This is the reason for the performance of the EG group lung tissue in the cluster analysis. The interesting comparison is that there are metabolites such as ethylene glycol and glycerol emodin in the lung sample, but no glycerol emodin was detected.
Metabolites in the kidney 65 and 76 metabolites were found in the kidney of the EM and EG groups. The nature of the metabolites in the kidney sample is very similar to that in the liver sample, and there is no clustering related to the number and peak intensity of isomers. Compared with the liver metabolites, the EM group detected carbonyl hydroxyemodin, acetylated fallacinol, and hydroxybutyryl emodin, but not dihydroxyemodin and hydroxyglutaryl emodin. The EG group detected more dihydroxymodulin and acetyl emodin than the EM group of kidneys.
The heat map clearly shows that the EM and EG groups of each sample are clustered, indicating that the amount and distribution of metabolites of EM and EG in each sample are basically consistent, which supports this view. The kidney and blood samples of the EM and EG groups are clustered, while the heart and liver samples are clustered. It is curious that the lung tissue of EM is clustered with the brain tissue of EM and EG groups. This article identifies a large number of new metabolites and analyzes the distribution and characteristics of these compounds, providing a new material basis and theoretical basis for further research into the efficacy and hepatotoxicity mechanisms of EM and EG.
4 Conclusion
A UHPLC-Q-Exactive MS method was established to identify and distribute of metabolites in rats following co-administration of EM and EG by gavage. 190 metabolites were identified in rat urine, plasma, bile, heart, liver, spleen, lung, kidney, and brain. In addition to the reported hydrolysis, hydroxylation, methylation, carboxylation, glucuronidation, sulfation, etc., some new phase II metabolites have also been discovered, including formylation, acetylation, glycol acylation, lactation, glycerolisation, malonylation, glycerol acid acylation, hydroxyvalerylation, erythrosylation, glutaric acidification, hydroxybenzoylation, glutamylation, hydroxyglutamylation, ascorbylation, aspartyl glycylation, dihydroxyphenyl glycylation, trihydroxyphenyl glycylation, dihydroxymethoxyphenyl glycylation, and ring opening of EM, as well as their glucuronide conjugation and sulfate conjugation. Interestingly, we detected EM in all tissues and EG in all samples except bile in the EM group, indicating glycosylation of EM in rats, which differs from published research results. In the liver, EM was found to bind metabolites such as ethylene glycol, glycerol, and glycerate, which may be related to the therapeutic effect of EM on fatty liver. These compounds are also present in the heart, lung and brain, suggesting that EM and EG are primarily hypolipidemic in liver, heart, lung and brain tissues. The detection of EM, EG, glucuronide conjugation and sulfate conjugation metabolites in the brain indicates that these metabolites easily pass through the blood–brain barrier, and may be related to the neuroprotective and cognitive effects of EM and EG.
Author contributions
JB, XQ and ZH conceived and designed the experiments, JB, QZ HS, and BL performed the experiments and analyzed the data, JB and HZ collected and processed the samples, DZ and LG, contributed reagents/materials/analysis tools, JB wrote the paper.
Funding
This work was supported by National Natural Science Foundation of China (81373967, 82204622), Quality standard system construction for the whole industry chain of Chinese medicinal detection pieces from Guangdong Provincial Drug Administration of China (2019KT1261/2020ZDB25).
CRediT authorship contribution statement
Junqi Bai: Writing – review & editing, Writing – original draft, Resources, Project administration, Methodology, Investigation, Funding acquisition, Formal analysis, Data curation, Conceptualization. He Su: Validation, Software. Baosheng Liao: Validation, Software, Conceptualization. Juan Huang: Methodology, Funding acquisition. Danchun Zhang: Methodology, Investigation. Lu Gong: Formal analysis, Data curation. Xuhua Shi: Data curation. Zhihai Huang: Investigation, Funding acquisition. Xiaohui Qiu: Project administration, Methodology, Funding acquisition, Formal analysis.
Declaration of Competing Interest
The authors declare that they have no known competing financial interests or personal relationships that could have appeared to influence the work reported in this paper.
References
- Characterization of the herb-derived components in rats following oral administration of Carthamus tinctorius extract by extracting diagnostic fragment ions (DFIs) in the MSn chromatograms. Analyst. 2014;139(24):6474-6485.
- [CrossRef] [Google Scholar]
- identification of Emodin Metabolites in vivo by HPLC-HRMS and MMDF Technique [J] Mod. Chin, Med.. 2020;22(12) pp. 1985–1990+2020
- [CrossRef] [Google Scholar]
- Exploration of Emodin to treat alpha-naphthylisothiocyanate-induced cholestatic hepatitis via anti-inflammatory pathway. Eur. J. Pharmacol.. 2008;590(1–3):377-386.
- [CrossRef] [Google Scholar]
- Emodin: a review of its pharmacology, toxicity and pharmacokinetics. Phytother. Res.. 2016;30(8):1207-1218.
- [CrossRef] [Google Scholar]
- Modification of emodin and aloe-emodin by glycosylation in engineered Escherihia coli. World J. Microbiol. Biotechnol.. 2015;31:611-619.
- [CrossRef] [Google Scholar]
- Emodin accelerates osteoblast differentiation through phosphatidylinositol 3-kinase activation and bone morphogenetic protein-2 gene expression. Int. Immunopharmacol.. 2008;8(5):741-747.
- [CrossRef] [Google Scholar]
- Neuroprotective effects of emodin against ischemia/reperfusion injury through activating ERK-1/2 signaling pathway. Int. J. Mol. Sci.. 2020;21(8):2899.
- [CrossRef] [Google Scholar]
- The antibacterial activity and action mechanism of emodin from Polygonum cuspidatum against Haemophilus parasuis in vitro. Microbiol. Res.. 2016;186:139-145.
- [CrossRef] [Google Scholar]
- Pharmacokinetics and tissue distribution of resveratrol, emodin and their metabolites after intake of Polygonum cuspidatum in rats. J Ethnopharmacol.. 2012;144(3):671-676.
- [CrossRef] [Google Scholar]
- Traditional usages, botany, phytochemistry, pharmacology and toxicology of Polygonum multiflorum Thunb.: a review. J. Ethnopharmacol.. 2015;159:158-183.
- [CrossRef] [Google Scholar]
- Exploring the journey of emodin as a potential neuroprotective agent: novel therapeutic insights with molecular mechanism of action. Biomedicine & Pharmacotherapy. 2022;149:112877
- [CrossRef] [Google Scholar]
- Park S Y, M L, Ko M J, et al. Anti-neuroinflammatory effect of emodin in LPS-stimulated microglia: involvement of AMPK/Nrf2 activation[J]. Neurochemical research, 2016, 41: 2981-2992. doi: 10.1007/s11064-016-2018-6.
- Emodin-8-O based on UPLC-Q-Exactive MS technology-β-In vivo metabolism of D-glucoside. J. Chin. Med. Mater.. 2021;44(10):2389-2395.
- [CrossRef] [Google Scholar]
- Aloe-emodin exerts cholesterol-lowering effects by inhibiting proprotein convertase subtilisin/kexin type 9 in hyperlipidemic rats. Acta Pharmacol. Sin.. 2020;41(8):1085-1092.
- [CrossRef] [Google Scholar]
- Profiling the metabolic difference of seven tanshinones using high-performance liquid chromatography/multi-stage mass spectrometry with data-dependent acquisition. Rapid Commun Mass Spectrom. 2007;21(14):2211-2226.
- [CrossRef] [Google Scholar]
- Analysis of emodin and its metabolites based on hollow fiber liquid phase microextraction. Chin. J. Chroma.. 2012;30(5):507-514.
- [CrossRef] [Google Scholar]
- Emodin inhibits aggregation of amyloid-β peptide 1–42 and improves cognitive deficits in Alzheimer's disease transgenic mice. J. Neurochem.. 2021;157(6):1992-2007.
- [CrossRef] [Google Scholar]
- Screening of a natural compound library identifies emodin, a natural compound from Rheum palmatum Linn that inhibits DPP4. PeerJ. 2017;5:e3283.
- [Google Scholar]
- Neuroprotective effects of emodin-8-O-β-d-glucoside in vivo and in vitro. Eur. J. Pharmacol.. 2007;577(1–3):58-63.
- [CrossRef] [Google Scholar]
- Emodin-induced hepatotoxicity is enhanced by 3-methylcholanthrene through activating aryl hydrocarbon receptor and inducing CYP1A1 in vitro and in vivo. Chem. Biol. Interact.. 2022;365:110089
- [CrossRef] [Google Scholar]
- Emodin-induced hepatotoxicity was exacerbated by probenecid through inhibiting UGTs and MRP2. Toxicol. Appl. Pharmacol.. 2018;359:91-101.
- [CrossRef] [Google Scholar]
- Use of liquid chromatography hybrid triple-quadrupole mass spectrometry for the detection of emodin metabolites in rat bile and urine. Biomed Chromatogr.. 2017;31(10)
- [CrossRef] [Google Scholar]
Appendix A
Supplementary data
Supplementary data to this article can be found online at https://doi.org/10.1016/j.arabjc.2024.105905.
Appendix A
Supplementary data
The following are the Supplementary data to this article:Supplementary Data 1
Supplementary Data 1
Supplementary Data 2
Supplementary Data 2


