

Translate this page into:
A novel colorimetric and “turn-on” fluorescent sensor for selective detection of Cu2+
⁎Corresponding author. zhouchen@cust.edu.cn (Chen Zhou)
-
Received: ,
Accepted: ,
This article was originally published by Elsevier and was migrated to Scientific Scholar after the change of Publisher.
Peer review under responsibility of King Saud University.
Abstract
In this work, a new highly selective and sensitive fluorescent sensor for detecting Cu2+ was developed based on rhodamine fluorophore. It displayed strong fluorescence “turn-on” effect upon addition of Cu2+, and possessed the function of naked eye recognition. The fluorescence enhancement also enabled the sensor to quantitatively analyze Cu2+ due to the formation of a stable 1:1 metal–ligand complex in a short time, and the complex possesses relatively good pH stability. In addition, the density functional theory calculations were adopted to investigate the molecular orbitals as well as the spatial structure. Simultaneously, the cell imaging and zebra fish experiments provided a broader application prospect in biological system.
Keywords
Fluorescent sensor
Copper ions
Rhodamine derivatives

1 Introduction
Copper is one of the essential elements for biological growth and development, it presents in both reduced (Cu+) and oxidized (Cu2+) forms in living organisms (Nakajima et al., 2019; Li et al., 2019). Cu+ is highly chemically reactive and only consists in extremely acidic environments or in combination with other molecule, on the contrary, Cu2+ exists stably in acidic and neutral aqueous solutions (Que, et al., 2008). Thereinto, Cu2+ participates in important biological processes such as photosynthesis, oxidative phosphorylation and the elimination of reactive oxygen species, on account of taking part in many physiological and biochemical reactions, excessive Cu2+ will produce virulence to the organism (Falcone et al., 2019). The toxicity of Cu2+ is also likely to result from improper binding of Cu2+ to cysteine, methionine, and histidine side chains on biological macromolecules, the misbinding leads to the failure of normal metal ions in binding with the correct site, generating the misfolding and inactivation of proteins or other biological macromolecules (Kang, 2011; Marshall, et al., 1994). In plants, Cu2+ poisoning is mainly manifested as the destruction of cell membrane system at the cellular level. The increased content of peroxide ions in chloroplasts destroy the thylakoid membrane and affect the electron transfer between photosystem I and photosystem II to a certain extent, resulting in a serious decrease in the efficiency of photosynthesis, and finally the growth of plants was inhibited and the leaves gradually withered (Deng et al., 2020; Xu et al., 2019). Moreover, the lack of Cu2+ is also harmful to plant growth, since about half of the Cu2+ in plants exist in chloroplasts, the deficiency of Cu2+ will lead to leaves chlorosis, plants grow slowly, even wither and die (Sadeghi and Davami, 2020). So, it is very important to develop a low-cost, fast responsive recognition method to effectively identify Cu2+ in organisms. In recent years, fluorescent sensor has been widely used in the molecular recognition, because of its simple preparation, high selectivity and sensitivity (Tay and Beer, 2021; Dai et al., 2019; Fernandes et al., 2022; Sahoo, 2021). Accordingly, reports on Cu2+ sensors are also common, but most of the previously reported sensing systems for Cu2+ were based on fluorescence quenching, because the paramagnetism of copper ions is easy to form electrons or energy transfer process resulting in fluorescence quenching (Cho et al., 2019; Ghosh et al., 2016; Kumar et al., 2021; Guan et al., 2020). Furthermore, with the continuous development of life science, people have been studying the biological components, cell activities and gene behavior in cells more and more deeply. Fluorescence imaging analysis is an efficient visualization method widely used in living cell analysis. It not only has the advantages of non-ionic low energy radiation and high sensitivity, but also can be continuously monitored in real time to achieve highly selective imaging of observed objects. Due to the good biocompatibility, fluorescent sensor has also been utilized to study the interactions between heavy metal ions and biomolecules in cells through non-invasive visualization technique (Lv et al., 2017; Wang et al., 2018; Meng et al., 2020; Li et al., 2020), and abundant fluorescent sensors were designed and synthesized to detect and recognize intracellular ion via fluorescence imaging analysis.
In this research, a new Cu2+ fluorescent sensor 1 is successfully designed and prepared. As a transition metal ion, the fluorescence quenching phenomenon often occurs when it binds to sensor due to the electron configuration of Cu2+, Compared with the most previous reported fluorescent “turn-off” Cu2+ sensors, sensor 1 exhibits good selectivity and sensitivity to Cu2+, and also displays fluorescence enhancement as a result of Cu2+ binding complex, inducing a remarkable color change, and the “naked eye” recognition ability enhances the potential value in practical application. At the same time, HI-7702 cells and zebra fish are adopted to determinate the biocompatibility of sensor 1, and the experimental results also achieve the application value in the field of biological fluorescent tracer.
2 Experimental section
2.1 Materials and instrumentations
The chemical reagents and solvents used in this experiment were all commercially available analytical grade, without further purification, and solvents for spectra detection were HPLC reagent without fluorescent impurity. 1H and 13C NMR spectra were taken on a Varian mercury-300 spectrometer with TMS as an internal standard. UV–visible absorption spectrum was performed on a UV-1900 spectrometer. Fluorescence spectrum was performed on a Hitachi F-4600 spectrofluorometer. The pH measurement was made with Mettler-Toledo Instruments DELTE 320 pH. Cell experiments were applied on an inverted fluorescence microscope (Olympus IX-70) connected to a digital camera (Olympus, c-5050).
2.2 UV–vis and fluorometric analysis
The metal ions (Na+, K+, Mg2+, Ca2+, Ba2+, Zn2+, Cd2+, Hg2+, Ni2+, Pb2+, Cu2+, Hg2+,Co2+ Fe3+, Cu+, Au2+, Ag+) required for the test in deionized water were purchased from Aladdin reagent official website and stored in the vacuum storage boxes. The above metal ions used throughout the experiments were prepared as buffer solution (HEPES-NaOH, pH = 7.4) and diluted to 5*10−4 M to obtain the corresponding ionic solution, the test samples were prepared by placing appropriate amounts of ions stock into matching concentration solutions of sensor 1[v(acetonitrile)/v(H2O) = 1:1, pH = 7.4]. The fluorometric analysis of sensor 1 was measured with 370 nm as excitation wavelength, and emission was collected from 525 to 650 nm, both the excitation and emission slit widths were 5 nm and 5 nm, respectively.
2.3 Synthesis of sensor 1
Rhodamine 6 G (2.39 g, 5 mmol) was dissolved in 50 mL ethanol, and excess hydrazine hydrate (85 %, 5 g, 85 mmol) was dropped into the system during stirring for 30 min. After the dripping, the solution refluxed for 12 h. After cooling, a large amount of light pink solid appeared. Filtered the solid and washed with 15 mL ethanol for three times. After vacuum drying, the intermediate (0.43 g, 1.0 mmol) and trifluoroacetic anhydride (0.42 g, 2.0 mmol) were dissolved in 10 mL ethanol, several drops of acetic acid were added to the system, and refluxed for 12 h under intense agitation. After the reaction, the solvent was evaporated and collected the resulting solid. The crude product was separated and purified by column chromatography (developing agent: methylene chloride/ethyl acetate = 10:1). Finally sensor 1 was obtained about 0.31 g as pale pink solid, yield 35 %. 1H NMR (300 MHz DMSO, 25◦C, TMS): δ 1.01 (d, J = 3.0 Hz, 6H), 3.46(s, 2H), 3.47(s, 2H), 3.50(s, 2H), 3.68(s, H), 3.69(s, H), 3.72(s, H), 3.74(s, H), 6.15(s, 2H), 7.18(s, 2H), 7.20(s, H), 7.24(s, H), 7.26(s, H), 7.64(s, H), 7.66(s, H), 8.21(s, H), 11.30(s, H). 13C NMR (75 MHz DMSO, 25◦C, TMS): 15.75, 15.80, 22.39, 22.43, 35.64, 35.98, 69.59, 102.76, 102.79, 115.72, 115.78, 122.82, 123.07, 123.23, 123.29, 125.11, 125.3, 125.53, 128.24, 128.76, 143.59, 144.09, 146.23, 149.33, 149.39, 149.88, 154.53, 169.18. LC-MS. Calc. [(M+1)] + m/z for: C28H27F3N4O3 = 524.20, found [(M+1)] + m/z = 525.4 (see Scheme 1).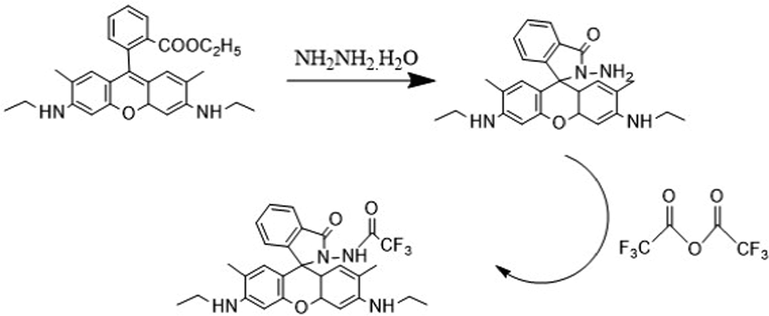
Synthesis of sensor 1.
3 Results and discussion
3.1 Absorption spectral response
The changes of the UV–vis spectra for sensor 1 in the absence and presence of Cu2+ were investigated. 5 × 10⁻⁴ M sensor 1 solution was prepared with acetonitrile: HEPES-NaOH buffer solution (V: V = 1:1, pH = 7.4). Then added different metal ion (Cu2+, Na+, K+, Mg2+, Ca2+, Ba2+, Zn2+, Cd2+, Hg2+, Ni2+, Pb2+, Co2+, Cu+, Au2+, Ag+ and Fe3+) buffer solutions of equal volume and concentration into sensor 1 solutions, respectively. The UV–vis absorption spectrum of the different metal ions in sensor 1 solution was illustrated in Fig. 1a. As the amide spiral ring structure of sensor 1 was in the closed state, the absorption band was not notable in absorption spectrum, the introduction of Na+, K+, Mg2+, Ca2+, Ba2+, Zn2+, Cd2+, Hg2+, Ni2+, Pb2+, Cu+, Au2+, Ag+ and Fe3+did not lead to any distinct change in absorption spectrum, whereas the addition of Cu2+ induced a new absorption peak located at 491 nm, and this change was also intuitively reflected in the color of the solution, upon the addition of Cu2+, the color of sensor 1 solution changed gradually from colorless to green, so this performance allowed the colorimetric detection of Cu2+ by naked eye. Furthermore, it was worth noting that Co2+ also caused a certain amount of change at 523 nm, but the absorbance was weaker than Cu2+, so Co2+ would not affect the detection of Cu2+. Then the influence of different concentrations of Cu2+ions (1 × 10⁻³ M ∼ 5 × 10⁻³ M) on UV–vis absorption spectrum of sensor 1 was measured, as shown in Fig. 1(b), with the gradual addition of Cu2+, the absorption intensity at 491 nm increased evidently, so in the subsequent fluorescence response experiments, the maximum excitation wavelength was set as 491 nm. Furthermore, such strong enhancement in the absorption behavior changed the color of the solution from colorless to green, the reason for this phenomenon was that sensor 1 existed in the form of amide screw ring closure (OFF) without the addition of Cu2+, showing no UV absorption and fluorescence. When Cu2+ was added, the N atom in the imine, the N atom and O atom in amide coordinated with Cu2+ to form a stable five-membered ring structure, which forced the amide spiral ring structure to open (ON), showing the enhancement of long-wavelength UV absorption and fluorescence. On account of the strong electron-absorbing effect of trifluoroacetyl group, the UV–vis absorption spectrum of sensor 1 had a blue shift compared with Rhodamine 6G, so the solution of sensor 1- Cu2+ complex appeared green, and it was because of the ability to change colors, sensor 1 was allowed to detect Cu2+ with naked eye colorimetry.![(a) UV–vis absorption response of sensor 1 in different metal ions solutions; (b) UV–vis absorption response of sensor 1 in different in different concentration of Cu2+ [v(acetonitrile)/v(H2O) = 1:1, pH = 7.4].](/content/184/2022/15/11/img/10.1016_j.arabjc.2022.104176-fig2.png)
(a) UV–vis absorption response of sensor 1 in different metal ions solutions; (b) UV–vis absorption response of sensor 1 in different in different concentration of Cu2+ [v(acetonitrile)/v(H2O) = 1:1, pH = 7.4].
3.2 Fluorescence spectral response
Selectivity is an important basis for measuring fluorescence sensors, in order to verify the fluorescence response of the sensor 1 towards common metal ions, Cu2+, Na+, K+, Mg2+, Ca2+, Ba2+, Zn2+, Cd2+, Hg2+, Ni2+, Pb2+, Co2+, Cu+, Au2+, Ag+ and Fe3+ were selected to conduct selective experiments of sensor 1. The experiments took advantage of sensor 1 solution with the concentration of 5 × 10⁻⁴ M, and added equal volume of 5 × 10⁻⁴ M HEPES-NaOH buffer solution containing different kinds of metal ions (pH = 7.4), respectively. As illustrated in Fig. 2(a), sensor 1 itself had no obvious fluorescence emission, meanwhile the addition of Na+, K+, Mg2+, Ca2+, Ba2+, Zn2+, Cd2+, Hg2+, Ni2+, Pb2+, Cu+, Au2+, Ag+ and Fe3+ did not change fluorescence emission significantly, whereas Cu2+ distinctly enhanced fluorescence intensity at 550 nm, compared with other metal ions, the fluorescence enhancement is very prominent, and it was worth noting that Co2+ also induced a slight fluorescence enhancement of sensor 1, and compared with Cu2+, the fluorescence enhancement caused by Co2+ at 550 nm in the fluorescence spectrum was much weaker, which was about 1/18 of the effect of Cu2+, so Co2+ was not enough to affect the detection of Cu2+ by sensor 1. In addition, the unique fluorescence response of sensor 1 to Cu2+ reflect clear color changes under 365 nm UV lamps, only Cu2+ induced sensor 1 solution to emit noticeable yellow fluorescence among common metal ions, this also verified the s ability of sensor 1 to recognize Cu2+ under UV light. Similar to many reported rodaminespirolactam-based fluorescent chemosensors, the fluorescence enhancement response of sensor 1 toward Cu2+ is most likely the result of the spiro ring-opening mechanism rather than an ion-catalyzed hydrolysis reaction, and resulted in a remarkable fluorescence boost (Jung et al., 2009; Zhang et al., 2007).![(a) Fluorescence spectrum of sensor 1 in different metal ions solutions (λex = 491 nm, slits: 5 nm/5 nm) and Fluorescence response of sensor 1 in different metal ions under 365 nm UV lamp; (b) Histograms of fluorescence selective experiments (green) and competitive experiments (red) of sensor 1 in different metal ions [v(acetonitrile)/v(H2O) = 1:1, pH = 7.4].](/content/184/2022/15/11/img/10.1016_j.arabjc.2022.104176-fig3.png)
(a) Fluorescence spectrum of sensor 1 in different metal ions solutions (λex = 491 nm, slits: 5 nm/5 nm) and Fluorescence response of sensor 1 in different metal ions under 365 nm UV lamp; (b) Histograms of fluorescence selective experiments (green) and competitive experiments (red) of sensor 1 in different metal ions [v(acetonitrile)/v(H2O) = 1:1, pH = 7.4].
For further evaluate the selectivity of sensor 1, the above-mentioned metal cations were adopted to conduct competitive experiments. Under the same solvent conditions [v(acetonitrile)/v(H2O) = 1:1, pH = 7.4], sensor 1 solution was first induced to fluorescence enhancement by Cu2+ solution at the same concentration (5 × 10⁻⁴ M) then 10 equivalent (5 × 10⁻³ M) other kinds of metals ion buffered solutions (Na+, K+, Mg2+, Ca2+, Ba2+, Zn2+, Cd2+, Hg2+, Ni2+, Pb2+, Co2+, Cu+, Au2+, Ag+ and Fe3+) were added into the fluorescent-enhanced solution, the fluorescence intensities of mixed system in emission spectrum at 550 nm were selected as the data of the competitive experiments, meanwhile the selective experiments with the competitive experiments were contrast to explain experimental results. In Fig. 2(b), the black histograms represented the data of the selective experiments, and the red histograms represented the competitive experiments, as shown in red histograms, the fluorescence intensities of the solutions mixed with competing metal ions did not change visibly and was always in enhanced states. So we could conclude that the specific bonding between Cu2+ and sensor 1 was stronger than other metal ions, which also proved that sensor 1 had good selectivity and anti-interference to Cu2+, and provided a certain guarantee for sensor 1 in detecting Cu2+ under actual complex conditions.
The sensitive experiments were utilized to further explore the recognition performance of sensor 1 to Cu2+. The effect of fluorescence emission spectra of sensor 1 solution [v(acetonitrile)/v(H2O) = 1:1, 5 × 10⁻⁴ M] was studied under different concentrations of Cu2+ (5 × 10⁻⁵ M ∼ 5 × 10⁻⁴ M, HEPES-NaOH buffer solution, pH = 7.4), the Cu2+ concentrations dependent changes in fluorescence spectra of sensor 1 was illustrated in Fig. 3. Sensor 1 alone exhibited negligible fluorescence (excitated at 491 nm), with the concentration of Cu2+ increased, the fluorescence intensity at 550 nm gradually heightened. Besides, in the range of 50–500 μM Cu2+, the fluorescence enhancement of sensor 1 toward concentration of Cu2+ revealed good linear relationship, with a coefficient R = 0.99047. According to the detection limit formula: LODs = 3σ/m (Hu et al., 2021), the detection limit of sensor 1 was calculated to be 1.85 × 10⁻⁷ M, so the minimum detection concentration of sensor for Cu2+ could reach the level of 10−7 M. And it confirmed that sensor 1 had potential application for the quantitative determination of Cu2+.![Normalized response of fluorescence signal to changing Cu2+ concentrations [v(acetonitrile)/v(H2O) = 1:1, pH = 7.4].](/content/184/2022/15/11/img/10.1016_j.arabjc.2022.104176-fig4.png)
Normalized response of fluorescence signal to changing Cu2+ concentrations [v(acetonitrile)/v(H2O) = 1:1, pH = 7.4].
The fluorescence quantum yields of sensor 1 and sensor 1-Cu2+ were determined according to the equation: , where FU and FS denoted the integral fluorescence intensity of determinand and standard substance, AU and AS denoted the relevant maximum absorbance of determinand and standard substance, respectively (Rhodamine 6 G was used as reference quantum yield standard, λex = 488 nm, quantum yield = 0.65 in water).
Job’s plot curve was adopted to account for the association principle between sensor 1 and Cu2+ (Zhang et al., 2021). This curve method was evaluated from the fluorescence spectra of sensor 1 and Cu2+ with a total concentration of 0.2 mM. It could be seen from Fig. 4 that the strongest fluorescence intensity occurred at 0.5, this proved a 1:1 binding stoichiometry between sensor 1 and Cu2+. According to the form of 1:1 binding mode, and referred to previous relevant literature reports, the possible binding model between sensor 1 and Cu2+ was further inferred as revealed in Fig. 4. In the absence of Cu2+, sensor 1 existed in the form of amide screw ring closure (OFF), displayed no UV absorption and fluorescence. When Cu2+ was added, it bonded with one oxygen atom and two nitrogen atoms on the amide spiral ring, resulted in amide screw ring opened, which characterized by ultraviolet absorption and fluorescence emission enhancement.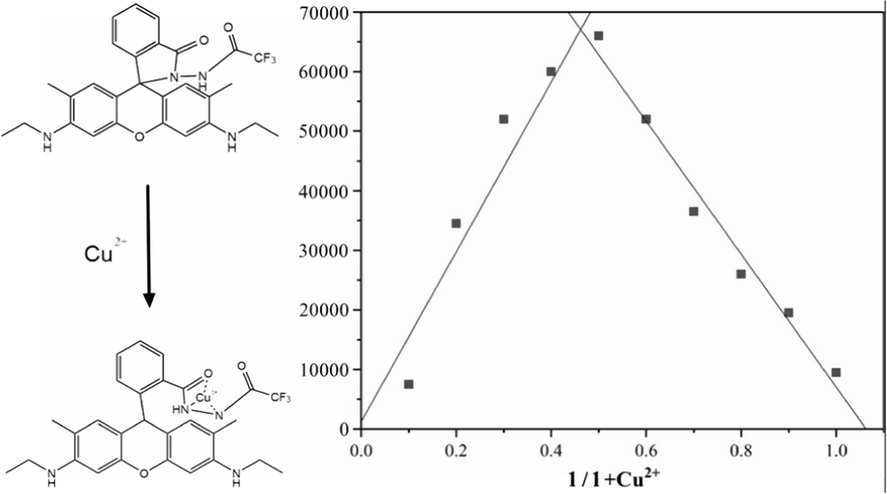
The Job's plot curve of sensor 1 and Cu2+.
To study the practical applicability, the effects of pH on the fluorescence response of sensor 1 in the absence and presence of Cu2+ were investigated. The pH range of experiments were collected from pH 3.0 to pH 9.0. Fig. 5 illustrated the fluorescence responses of sensor 1 without and with Cu2+ in different pH. Experimental results revealed that alone sensor 1 emitted a certain intensity of fluorescence at acidic conditions (pH < 5) on account of the formation of the open-ring state due to the strong protonation. But there was almost no fluorescence emission (λex = 491 nm) from alone sensor 1 in the range from pH 4.0 to pH 9.0. But there was almost no fluorescence emission (λex = 491 nm) from alone sensor 1, because of the amide helix ring was in the closed state. Upon the addition of Cu2+, the fluorescence enhancement was very obvious in different pH range. So the pH-control emission experiments proved that sensor 1 could effectively respond to Cu2+ ions in the pH range from 5 to 9, attesting that sensor 1 was capable of recognizing Cu2+ in a wide pH range. We could also assume that the 1:1 complexes formed between sensor 1 and Cu2+ was stable in the pH 5–9. In addition, considering that most samples for Cu2+ analysis were neutral, so the media for Cu2+ quantification was buffered at pH 7.4.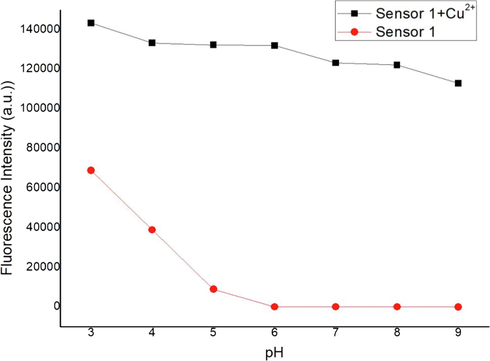
Fluorescence intensity of sensor 1 (0.5 mM) measured with and without Cu2+ ions (0.5 mM) as a function of pH.
Fast response time and reversible response are important factors of sensor detection efficiency. The time dependence of the response of sensor 1 to Cu2+ was shown in Fig. 6, the experimental results proved that the recognizing process finished in less than 1 min, therefore, sensor 1 could be used as a rapid Cu2+ monitor. Because EDTA is a good metal coordination agent and has good coordination ability with common metal ions, we selected EDTA to research the chemical reversibility behavior of sensor 1 and Cu2+ in acetonitrile–water buffered solution. As shown in Fig. 7, according to the complexing ability of EDTA toward Cu2+, EDTA was added into sensor 1-Cu2+ complex solution to try to displace Cu2+ from the metal–ligand complex. Upon addition of excess EDTA, the color of the metal–ligand mixture did not change from green to colorless and fluorescent emission intensity of the system was stable, indicating that EDTA did not separate Cu2+ from sensor 1-Cu2+ complex, this was probably due to the better coordination ability of sensor 1 with Cu2+ compared with EDTA.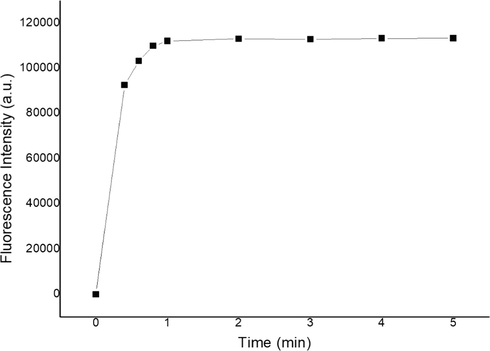
Response time course of sensor 1 (10 μM) upon addition of Cu2+ (2 equiv).
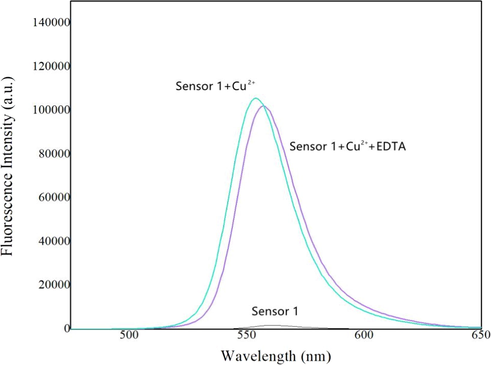
Fluorescence spectra of 0.5 mM sensor 1 in the presence of 0.5 mM Cu2+ and 3.0 mM EDTA.
3.3 Theoretical calculation research
To understand the recognition ability of sensor 1 towards Cu2+, the HOMO (highest occupied molecular orbitals) and LUMO (lowest unoccupied molecular orbitals) distributions of sensor 1 were determined by DFT calculations with PBE0, using the Gaussian 09 package to calculate the optimal geometry configuration, spatial electron cloud arrangement and spatial structure of molecules. The 3-21G basis set was employed for the H, C, N, and O atoms, for the Cu atom, the LANL2DZ effective core potential was employed. The HOMO-LUMO electron transition of sensor 1 was illustrated in Fig. 8, the theoretical calculation of absorption peak at 471 nm was from the ground state to the excited state (oscillator strength f = 0.01), meanwhile the maximum absorption peak came from the benzene ring unconjugated system, and the spironolactone structure did not reveal noticeable electronic transition. After sensor 1 bonded with Cu2+, the first electron transition became HOMO → LUMO (λem = 542 nm, f = 0.06). HOMO and LUMO were mainly distributed on oxanthracene units, indicated that the maximum absorption peak came from rhodamine 6G fluorophore, which generated a strong fluorescence signal. The results of theoretical calculation were highly consistent with the actual experimental data, which also verified the scientific nature of our experimental results from the theoretical perspective.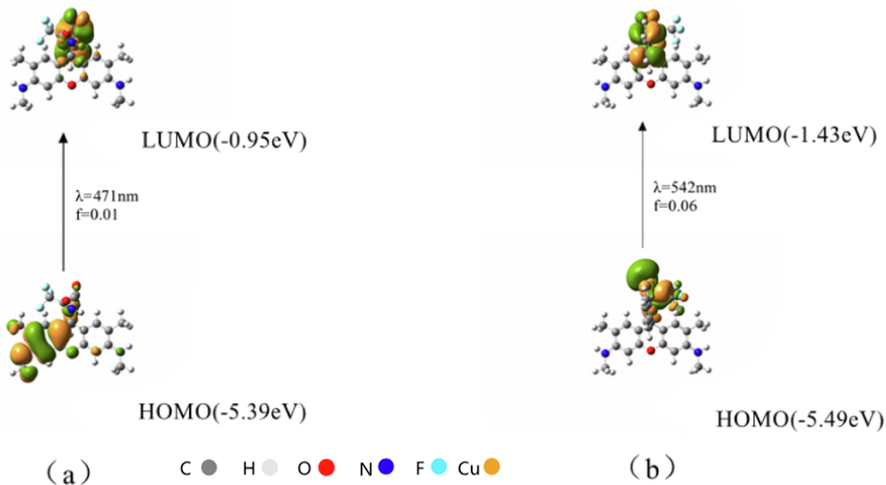
Molecular orbitals involved in the vertical emission of (a) sensors 1 and (b) sensor 1-Cu2+.
3.4 Biological investigation
In order to ulteriorly explore the potential biological application, the MTT assay was performed in Hi-7702 cells (normal liver cells) to confirm the cytotoxicity in different concentrations (100.0, 50.0, 10.0, 5.0, 1.0, 0.5 and 0.1 μM) of sensor 1. As illustrated in Fig. 9, the cells were healthy and did not display any remarkable reduction in cell viability in the concentration range of 50.0–0.1 µM. At the highest concentration of sensor 1 (100 µM), the cells revealed mild decrease in the viability (63 %). These experimental results proved that sensor 1 has extraordinary low cytotoxicity under the experimental conditions. Furthermore, the IC50 value was ascertained as 217.6 μM. Accordingly, the sensor 1 was suggested for monitoring Cu2+ status in vivo. Whereafter, Hi-7702 cells were used to measure the capability of the sensor 1 to track the changes of Cu2+. The live Hi-7702 cells were first incubated with 5 × 10⁻⁵ mol/L sensor 1 in the solution [v(acetonitrile)/v(H2O) = 1:1] for 30 min at room temperature in 5 % CO2 atmosphere, washed with phosphate buffered saline (PBS, PH = 7.4) for three times, and induced 5 × 10⁻⁵ mol/L Cu2+ into the solution [v(acetonitrile)/v(H2O) = 1:1] for 30 min. As shown in Fig. 10(a) and Fig. 10(b), cells treated by sensor 1 revealed no obvious fluorescence phenomenon and still maintained clear contours, which indicated sensor 1 smoothly penetrate the cell membrane into HI-7702 cell. After the inducing of Cu2+, we found bright green fluorescence in Hi-7702 cells clearly from Fig. 10(c). According to the pictures we could identify that sensor 1 had successfully immersed into the cells and could track the intracellular Cu2+ in live Hi-7702 cells. The live cell imaging also demonstrated that sensor 1 was membrane-permeable and could be a useful molecular sensor for studying the biological processes involving Cu2+ in live cells. Therefore, it was concluded that sensor 1 had good biocompatibility and potential application in the field of biological tracer.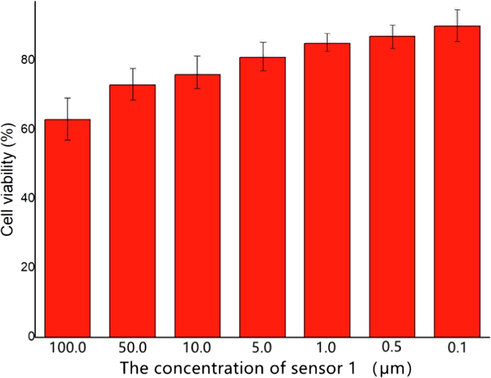
Concentration-dependent cell viability assay.

(a) Bright field transmission image of Hi-7702 cells treated with sensor 1; (b) Fluorescence imaging of Hi-7702 cells treated with sensor 1;(c) Fluorescence imaging of Hi-7702 cells treated with sensor 1-Cu2+.
Zebra fish is a common tropical freshwater fish with strong vitality, the average body length of it is about 2–4 cm and its genetic similarity to humans is 87 %. For the sake of expand the biological application value of the sensor 1, zebra fish was selected to find out whether sensor 1 could be employed for visual detecting Cu2+ in live animals. In this experiment, zebra fish were bred in sterile purified water for two days at room temperature, and added DMF solution dissolved with sensor 1(10 mM) into the feeding system for cultivation 1 h. Then removed the zebra fish and washed it with HEPES-NaOH buffer solution for three times. After finishing the above operations, as illustrated in Fig. 11(a), it could be seen that the zebra fish absorbed sensor 1 displayed almost no apparent fluorescence emission, the shape outline of it could only be vaguely seen under 365 nm UV light. But after further breeding of zebra fish with Cu2+ (20 mM) for another 1 h, the image of zebra fish under UV lamp was illustrated in Fig. 11(b). The morphology of zebra fish could be clearly observed with obvious fluorescence emission. The experimental results revealed that sensor 1 was successfully absorbed into the body of zebra fish, and the detection of Cu2+ by sensor 1 had occurred in zebra fish successfully. This indirectly proved that sensor 1 could be utilized in the field of biological imaging and had certain practical application value.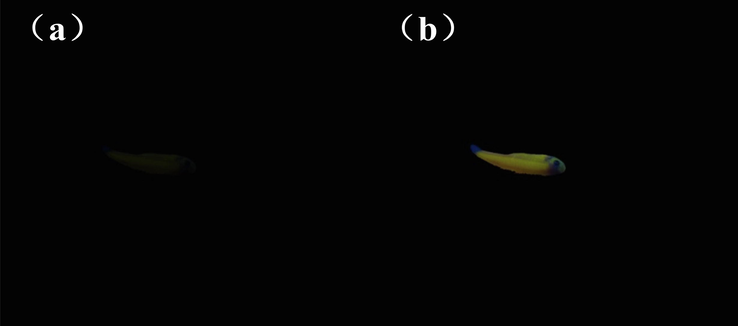
Images of zebra fish under 365 nm UV light at 365 nm: (a) Zebra fish bred with only sensor 1 for 1 h; (b) Fish bred with sensor 1 and then bred with Cu2+ for 1 h.
4 Conclusion
In conclusion, we successfully developed a highly selective and sensitive fluorescent sensor 1 by chemically modifying rhodamine 6G fluorophore. Cu2+ was able to induce the sensor 1 to emit notable fluorescence, and the fluorescence“off–on”effect was accompanied by color change from colorless to green, which made the sensor 1 as a naked eye recognition method. And the detection limit of sensor 1 to Cu2+ was calculated to be 1.85 × 10⁻⁷ M. Moreover, through the biological imaging experiments, sensor 1 indeed visualized the changes of intracellular Cu2+ in Hi-7702 cells and live zebra fish. Thus, it was expected that sensor 1 could serve as a valuable “turn-on” fluorescent sensor in chemical and biomedical application.
Acknowledgement
We acknowledge the Scientific research project of Education Department of Jilin Province (JJKH20220730KJ) for the support of our work.
Declaration of Competing Interest
The authors declare that they have no known competing financial interests or personal relationships that could have appeared to influence the work reported in this paper.
References
- Sensors. Actuat. B-Chem.. 2019;279:204-212.
- Arab. J Chem.. 2019;12:1895-1901.
- Front. Chem. Sci. Eng.. 2020;14:105-111.
- Dalton. T.. 2019;48:14233-14237.
- J. Fluoresc.. 2022;32:19-56.
- Dalton. T.. 2016;45:11042-11081.
- React. Funct. Polym.. 2020;146:104400-104407.
- Talanta. 2021;233:122480-122487.
- J. Am. Chem. Soc.. 2009;131:2008-2012.
- Pharmacol. Ther.. 2011;129:321-331.
- Dalton. T.. 2021;50:2705-2721.
- Anal. Methods. 2020;34:4181-4184.
- Dyes. Pigments. 2019;163:243-248.
- Spectrochim. Acta. A. 2017;177:63-68.
- J. Cancer Res. Clin. Oncol.. 1994;120:S3-S10.
- Res. Chem. Intermediat.. 2020;46:5517-5533.
- Environ. Sci. Pollut. R.. 2019;36:36754-36763.
- Chem. Rev.. 2008;108:1517-1549.
- Microchimi. Acta.. 2020;187:147-156.
- Dalton. T.. 2021;50:11681-11700.
- Org. Biomol. Chem.. 2021;21:4652-4677.
- Sens. Actuat. B-Chem.. 2018;273:1070-1076.
- Spectrochim. Acta. A. 2019;216:404-410.
- J. Fluoresc.. 2021;31:29-38.
- Org. Lett.. 2007;9:5039-5042.
Appendix A
Supplementary material
Supplementary data to this article can be found online at https://doi.org/10.1016/j.arabjc.2022.104176.
Appendix A
Supplementary material
The following are the Supplementary data to this article:Supplementary data 1
Supplementary data 1


