Translate this page into:
A pseudotargeted peptidomics strategy for screening natural signature peptides in animal-derived drugs: Taking Pheretima as a case
⁎Corresponding authors at: Shanghai Research Center for Modernization of Traditional Chinese Medicine, National Engineering Laboratory for TCM Standardization Technology, Shanghai 201203, China. University of Chinese Academy of Sciences, No. 19A Yuquan Road, Beijing 100049, China. 1620154332@cpu.edu.cn (Yurong Wang), daguo@simm.ac.cn (De-an Guo)
-
Received: ,
Accepted: ,
This article was originally published by Elsevier and was migrated to Scientific Scholar after the change of Publisher.
Abstract
Natural peptides (NPs) are ubiquitous throughout the organism with diversified structures and wide dynamic concentration range, which leads to serious challenge for their comprehensive analysis. Herein, a pseudotargeted peptidomics strategy based on dynamic multiple reaction monitoring (DMRM) with high-throughput data acquisition and accurate quantification was established. Specifically, an in-house software Pep-MRMer was developed for extraction of ions information of peptides, followed by de-redundancy and fusion to construct a transition list. Additionally, retention time (RT) calibration method was optimized by using high content components for effective transference of ion pairs between different detection conditions (e.g., instruments, chromatographic gradients). This strategy was applied for profiling NPs and screening signature peptides for species authentication of Pheretima, a multi-source animal-derived drug widely used in Asian countries. In all, a total of 3307 peptides had excellent quantitative detection after transference. Subsequently, nine signature peptides with extraordinary specificity were screened, identified, and confirmed by comparing with the synthetic standards. Ultimately, a 10 min specific chromatogram based on signature peptides was developed, which realized rapid and accurate identification of Pheretima. Taken together, this research provides a robust strategy for species discrimination of animal-derived drugs without adequate quality control measures.
Keywords
Natural peptides
Pseudotargeted peptidomics
Signature peptides
Animal-derived drugs
Pheretima
- NPs
-
Natural peptides
- DMRM
-
dynamic multiple reaction monitoring
- ESI
-
electron spray ionization
- RT
-
retention time
- PA
-
Pheretima aspergillum
- PV
-
Pheretima vulgaris
- PG
-
Pheretima guillemi
- MM
-
Metaphire magna
- HRMS
-
high resolution mass spectrometry
- HAI-RT_cal
-
high abundance ion-based retention time calibration
Abbreviations
1 Introduction
Natural peptides (NPs) are widely distributed in organisms with diverse structures and considerable bioactivities. In recent years, more and more NPs have been reported successively with multiple bioactivities, such as antibacterial peptides (Zasloff et al., 2002), toxic peptides (Diochot et al., 2012), neuropeptides (Hokfelt et al., 1991), immune peptides (Rudra et al., 2010), anticancer peptides (Anand et al., 1999), etc. Up to now, >400 peptides are in the clinical development stage, and 60 plus peptide drugs have already been approved for clinical therapeutics worldwide (Lee et al., 2019). Additionally, NPs were also used as clinical markers for disease diagnosis, such as Amyloid-beta peptides for Alzheimer's Disease (Nakamura et al., 2018).
Untargeted and targeted peptidomics are the most frequently taken strategies for peptide analysis with irreplaceable advantages (Villaño et al., 2022; Zhao et al., 2021). The untargeted strategy is capable of covering many classes of constituents, as it is unbiased and able to detect “all” ionic features in biological samples (Zhong et al., 2021). However, the quantification capabilities of this method have been questioned, including limited linear quantitative range and repeatability (Vreeke et al., 2022; Zeigler et al. 2008), and the data post-processing is cumbersome and complex, which will inevitably bring ambiguity or mismatch (Xuan et al., 2018; Esposito et al. 2021). Targeted strategy based on multiple reaction monitoring (MRM) or parallel reaction monitoring (PRM) improves detection sensitivity, guarantees quantitative accuracy and robustness (Chambers et al., 2013; Luo et al. 2016), but it is just confined to known compounds (Shao et al., 2015).
Pseudotargeted approach, combining the advantages of both untargeted and targeted strategy, was firstly developed to characterize plasma metabolic markers (Zheng et al., 2020). Up to now, various kinds of components, including regular metabolites (Xu et al., 2020) and lipids (Xu et al., 2021), have been characterized by pseudotargeted method. The method was demonstrated with high coverage of analyte and high data quality (Wang et al., 2016) and was suitable for the analysis of large-scale samples (Luo et al., 2016). To our knowledge, however, there is a lack of a comprehensive pseudotargeted method that fully characterizes the entire peptidome of NPs. Different from singly charged metabolites, the peptides could coexist with multiple multi-charged forms in electron spray ionization (ESI) source tandem mass spectrometry and better detection capability of instruments is needed, all this leads to complexity in the data. Hence, establishing a high coverage pseudotargeted peptidomics method that fully characterizes the entire peptidome of NPs in complex matrices is an irresistible and promising trend.
Pheretima, a multi-source animal-derived drug, has been used for thousands of years in Asian countries and recorded in the 2020 edition of Chinese Pharmacopoeia (ChP), including Pheretima aspergillum (PA), P. vulgaris (PV), P. guillemi (PG), and P. pectinifera (PP) (Ch.P., 2020). But the dominant marketed official species are PA and PV. In addition, Metaphire magna (MM), a non-pharmacopoeia fake variety of PA, circulated in large quantities in the market (Ge et al., 2019). The deficiency of specific quality control indices has resulted in over 50% adulteration in the market of Pheretima.
In this study, we proposed an integrated pseudotargeted peptidomics method based on dynamic multiple reaction monitoring (DMRM) for global profiling and relative quantification analysis of NPs, and eventually used for species authentication of multi-source Pheretima. This strategy could be summed up in four steps: Firstly, the MRM transitions of the peptides were extracted from high resolution mass spectrometry (HRMS) data by in-house software Pep-MRMer written in C++ language. Secondly, retention times (RTs) of the transitions were calibrated by the high abundance ion-based retention time calibration (HAI-RT_cal) method according to ions with high abundance. Subsequently, the dMRM method, combining the transitions and calibrated RTs, was put into quantitative analysis of NPs in multiple batches of samples to screen signature peptides and authentication of multi-sourced Pheretima.
2 Materials and methods
2.1 Sample collection and pretreatment
A total of 24 batches of commercial Pheretimas were purchased from herbal drug market (Bozhou of Anhui province and Zhangshu of Jiangxi province, China), including 5 batches of PA, 9 batches of PV, and 10 batches of MM, which were identified by means of macroscopic and microscopic identification by Professor De-an Guo (Shanghai, China), together with DNA barcode technique and signature enzymatic peptides analysis (Liu et al., 2022; Liu et al. 2021). Detailed information of the samples was shown in Table S1.
For sample preparation, each sample (25 mg) was lysed in a solution with 1 mL 8 M Urea and sonicated for 30 min at room temperature (23℃ ∼ 27℃). Following centrifugation at 14,000 rpm for 10 min, 200 μL supernatant were precipitated by addition of 600 μL (3 times volume of supernatant) acetone at 4℃ for 30 min. And centrifugation at 14,000 rpm for 10 min, the NPs in supernatant was collected and then air dried. Ultimately, the samples were desalted using Sep-Pak C18 Cartridges and reconstituted in 50 μL 20% ACN. Both intraspecific quality control (QC) sample and interspecific QC were prepared by pooling equal powder of the samples.
2.2 LC-MS analysis
2.2.1 HRMS analysis
The untargeted analysis was performed on the Ultimate 3000 UHPLC system (Thermo Scientific) coupled with a linear ion-trap quadrupole-Orbitrap Velos Prohybrid mass spectrometry (Thermo Fisher Scientific, San Jose, CA, USA). The chromatography separation was carried out on a ACQUITY UPLC® BEH C18 column (2.1 mm × 100 mm, 1.7 μm), operated in the positive electrospray ionization (ESI + ) mode. The mobile phase was consisted of 0.1% (v/v) formic acid aqueous solution (A) and 0.1% formic acid (v/v) acetonitrile solution (B) with an optimized gradient program: 0–5 min, 5% (B); 5–55 min, 5%–25% (B); 55–75 min, 25%–35% (B); 75–83 min, 35%–95% (B); 83–87 min, 95% (B); 87–87.1 min, 95%–5% (B); 87.1–90 min, 5% (B).The column temperature was 30℃. The flow rate was 0.3 mL min−1 and the injection volume was 4 μL.
The optimized source parameters were set as follows: spray voltage, 3 kV; capillary temperature, 300 °C; source heater temperature, 400 °C; sheath gas (N2), 40 arbitrary units; and auxiliary gas (N2), 10 arbitrary units. The Orbitrap analyzer scanned over a mass range of m/z 300–2000 at the resolution of 30,000 for MS1 scan in profile format and the resolution of 7500 for MS2 scan in centroid format. Multiple-charged ions dependent acquisition was applied for eliminating the interference of single-charged ions. The normalized collision energy (NCE) for MS/MS product ions was set at 10, 20, 30, 40 V, respectively. Dynamic exclusion was enabled by the following parameters: repeat count, 1; repeat duration, 20 s; exclusion list size, 50; and exclusion duration, 20 s. An isolation width of 2 Da was set. The minimum signal intensity that could trigger MS2 fragmentation was set at 5000. Data processing were performed by Xcalibur 2.1 software (Thermo Fisher Scientific, San Jose, CA, USA).
2.2.2 Triple quadrupole mass spectrometer analysis
Targeted peptide analysis was performed on 1290 Infinity II UPLC system coupled with Agilent 6495 Triple Quad (Agilent, Santa Clara, USA) in positive ion mode. The chromatographic separation was performed on an ACQUITY UPLC® BEH C18 column (2.1 mm × 50 mm, 1.7 μm). The optimized gradient program was set as follows: 0–13 min, 5%–15% (B); 13–20 min, 15%–20% (B); 20–25 min, 20%–35% (B); 25–26 min, 35%–95% (B); 26–28 min, 95% (B); 28–28.1 min, 95%–5%; 28.1–30 min, 5% (B).
The ESI source parameters were set as follows: Gas temperature, 200 ℃; Gas flow (N2), 14 L min−1; Nebulizer, 35 psi; Sheath gas temperature, 250 ℃; Sheath gas flow, 11 L min−1; Capillary voltage, 4000 V; Nozzle voltage, 500 V.
2.3 Data conversions and analysis
The HRMS data (*.raw files) was first converted into *.mgf files by MSconvert (Chambers et al., 2012). The ion pairs information list construction of peptide was performed by in-house software Pep-MRMer with C++, including precursor ion alignment, characteristic product ion selection and ion fusion from multiple LC-MS runs at different CE voltage. The list includes RT (s), MS1 (m/z), CHARGE, MS1_INTENSITY, MS2first (m/z), MS2first_INTENSITY, MS2second (m/z), MS2second_INTENSITY, M (Da), FILE_NAME and SCAN. The RT calibration was performed referring to the algorithm developed by Zheng. et al (Zheng et al., 2020).
The chemometrics analysis were performed by using SIMCA-P software (Umetrics, Umeå, Sweden), including Analysis of Variance (ANOVA), Principal Component Analysis (PCA) and Orthogonal Projections to Latent Structures Discriminant Analysis (OPLS-DA).
2.4 Peptide identification
The peptide identification was performed based on both database search and spider search by the PEAKS Studio® Xpro software (Bioinformatics Solutions Inc., Waterloo, Canada). The databases referred to the theoretical protein sequence of Pheretima reported before (Liu et al., 2022). The parameters were set as follows: oxidation (M) and acetyl (N-term) were designated as variable modifications. The mass tolerance of precursor ions and fragment ions were set at 10 ppm and 0.05 Da, respectively. The false discovery rate (FDR) was set at 1 %.
3 Results and discussions
3.1 The development of pseudotargeted peptidomics strategy
A DMRM-based pseudotargeted peptidomics strategy was established to deeply characterize the NPs, which integrated transition list construction and RT calibration. The typical workflow is illustrated in Fig. 1.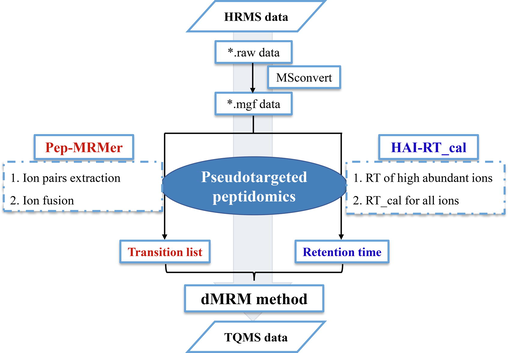
Workflow of pseudotargeted peptidomics strategy for comprehensively profiling the NPs in complex matrices.
3.1.1 Construction of transition list
Peptide is polymers of amino acids linked by amide bonds. In ESI source mass spectrometry, peptides have unique ionization behaviors, which is different from metabolites and lipids. For MS1 spectrum, the peptides are mainly characterized with multiple multi-charge ions simultaneously. For MS2 spectrum, the fragmentation of peptide is dominated in bx-yz channels (Paizs et al., 2005) and the richness of its product ions information is greatly affected by the CE voltage.
The software Pep-MRMer was developed to extract and fuse the ion pairs. As shown in Fig. 2A, several crucial principles were set: for precursor ion, the ion fusion was performed to de-replicate the same ions with various charged forms, and the same ion in different acquisition parameters or different sample by the filter of tolerance of RT (tolRT) and tolerance of Mass (tolM), which were adjusted according to the experiment (e.g., 30 s, 0.02 Da, respectively). For product ion, the top two relative abundance ions were selected and the min MS2 and max MS2 were set to control the m/z within a range so as to obtain characteristic product ions. Notably, the minimum absolute m/z tolerance between precursor ion and product ion is 2 Da for eliminating isotope ion, which is different from that of 13.9 Da (—CH2—) for the metabolites in MRM-Ion Pair Finder (Zheng et al., 2020). Another difference could be that the m/z of product ions might be higher than precursor ions’, which caused by the higher charge states of precursor ions. Eventually, the corresponding information of ion pairs with highest product ion abundance was remained and constructed a transition list.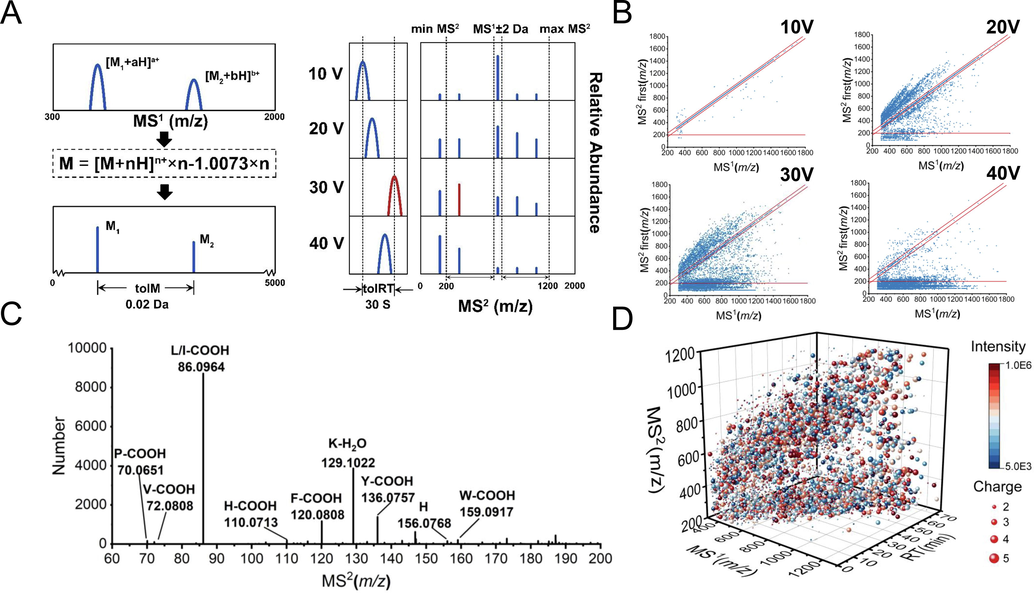
The principles and performance of in-house software Pep-MRMer. A, The principles of ion fusion and transition list construction. B. The distribution of m/z of the highest product ion at CE voltage 10, 20, 30, 40, respectively. C, The statistic and identification of product ions with m/z less than 200. D, The 3D scatter diagram of ion pairs extracted from HRMS of three Pheretima. Different sizes represent different charges and different colors represent different abundance levels.
Herein, the software was used for the transition list construction for QC samples of three Pheretima acquired at CE voltage of 10 V, 20 V, 30 V, and 40 V, respectively. As shown in Fig. 3B, the distribution of m/z of the highest product ions varies with CE voltage when the range was not restricted. This can be interpreted as the lower CE is not enough to fragment the peptide ion and the MS2 spectrum is mainly the quasi-molecular ion peak of the compound; as CE increases, a part of ions is fragmented and produce abundant product ions with a wide range of m/z; further, the richness and relative abundance of peptide fragments with small m/z (<2 0 0) increases gradually. In order to illustrate what was produced, we counted the frequency of 20,000 MS/MS spectra with highest product ion m/z less than 200 at CE 30 V (Fig. 2C), the main product ions were fragment ions of mono-amino acid (e.g., [P-COOH] − 70.0651; [L/I-COOH] − 86.0964; [K-H2O] − 129.1022). Therefore, we recommend a MS2 range 200–1200 to establish more specific ion pair, that is, a peptide-peptide ion pair system, while eliminating noise or impurities signal interference. Moreover, for experimental purposes, high-abundance features with the ion abundance exceeds pre-defined threshold were remained. 5884 non-redundant ion pairs were extracted with widely distributed over the whole chromatographic gradient time, with diverse m/z, charges, and intensity (Fig. 2D).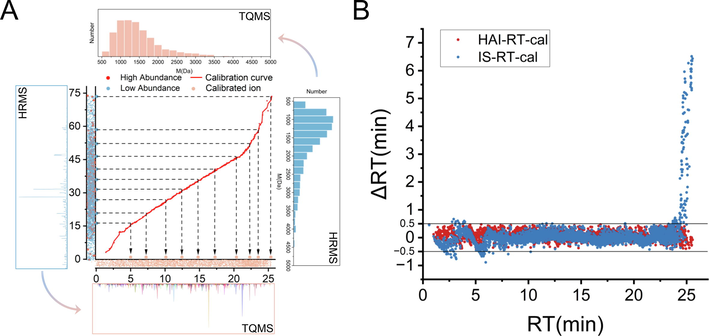
The establishment and performance of HAI-RT-cal method. A, The principle of HAI-RT-cal method. B, The ΔRT distribution histogram of the 3307 ions by HAI-RT-cal and IS-RT-cal.
3.1.2 Retention time calibration
Internal standards-based retention time calibration algorithm (IS-RT-cal) has effective performance for transferring RT between instruments for metabolite analysis (Zheng et al., 2020; Wang et al., 2016). Adversely, the method is severely restricted due to over-reliance on internal standards and stringent conditions, such as equal distribution in chromatogram, no interference for constituents, diverse structures, and stability.
A novel method named HAI-RT-cal was proposed, which replaced IS with easily accessible high abundance ions in matrices. In detail, the transition ion pairs with high abundance and equally distributed in whole chromatographic time were firstly selected and detected in QQQ6495 in MRM mode. Subsequently, according on the rule that the elution order of compounds is theoretically invariant under similar chromatography elution system, the high content peptides were manually refined to establish a calibration curve, which led to that all peptides within a time range of 90 min were calibrated into a time range of 30 min and without change in distribution of peptide. (Fig. 3A).
To verify the feasibility of HAI-RT_cal, two methods are simultaneously used for ion pairs transfer in this paper. A total of 304 high abundance ions were obtained and provided to HAI-RT-cal, while 21 standard peptides (Purity > 95%) were synthesized for the IS-RT-cal. The 5884 ion pairs extracted from HRMS were calibrated and detected by dMRM methods, of which 4664 (79.2%) transitions were clearly detected in 1 min detection window and 3307 (56.5%) transitions exhibited canonical chromatographic peak shape (Figure S2). The experimental and theoretical RT deviations (ΔRT) of 3307 ions by both methods were compared. As shown in Fig. 3B, ΔRTs of most ions were in the range of ± 0.5 min, which is the maximum threshold that allows to be detected in 1 min MRM window. But a considerable fraction of the post-eluting ions produced a large deviation after calibration by IS-RT-cal, even up to ± 7 min. The inadequate RT distribution of the standards will inevitably impact the effect of calibration. Overall, this method intelligently resolves the reliance of ion pairs transference on internal standard and improves the efficiency of sample acquisition.
3.1.3 Construction of dMRM method
Several parameters (e.g., cycle time, dwell time) greatly influence the detecting number of MRM transitions and the accuracy of quantitation in a single run. Considering the upper limit of detection performance of QQQ6495, 960 high intensity transitions with species specificity were remained, and then used to construct the quantitative dMRM method. To evaluate the quantitative performance of the pseudotargeted peptidomics dMRM method, methodological investigation was conducted, including linearity, precision, and repeatability. The linearity of the 960 transitions was evaluated by calculating the R2 value of the 28-fold gradient diluted QC samples. As shown in Fig. 4A, >94% ions had an R2 > 0.8, and > 76% ions had an R2 > 0.95. Repeatability and instrument precision were evaluated by calculating relative standard deviation (RSD) of 6 repeated injections. 90% and 93% of the transitions had RSD less than 20%, respectively (Fig. 4B and C).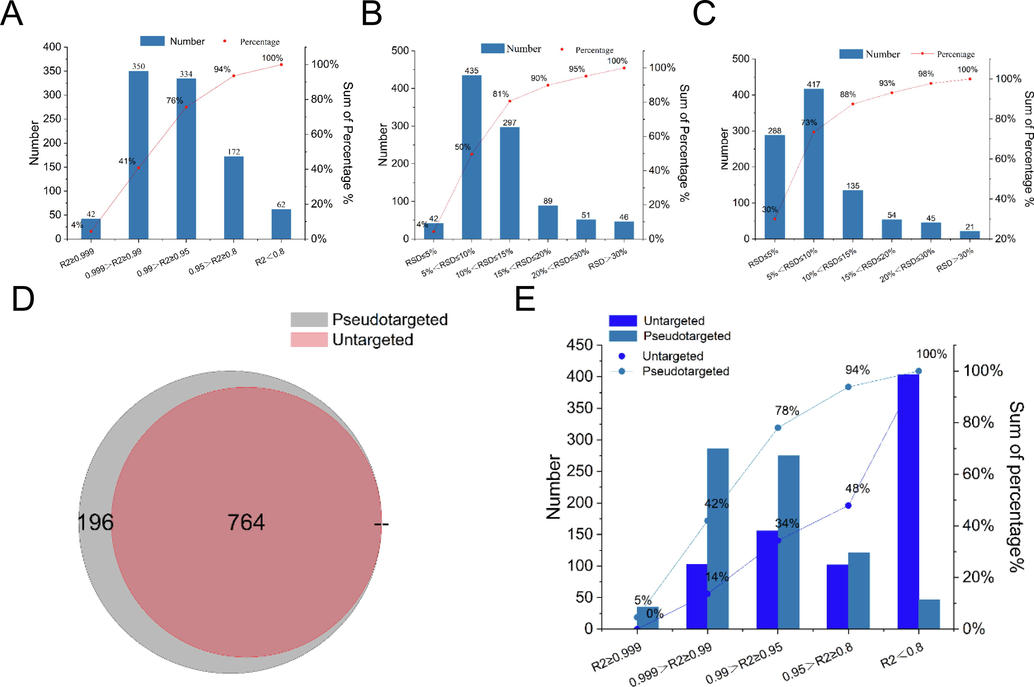
Quantitative performance of the pseudotargeted peptidomics method and untargeted omics. A, Linearity of 960 dMRM transitions in QC samples with 28-fold series dilution. B, Repeatability in positive ion mode evaluated in 6 QC samples. C, Instrument precision in positive ion mode evaluated in QC samples with 6 replicates. D, Venn diagram of 960 transition screened by pseudotargeted and untargeted strategy. E, Linearity of 764 transitions screened by untargeted and pseudotargeted method.
Compared with untargeted strategy, pseudotargeted strategy was demonstrated with better quantitative ability and simplified data post-processing. As shown in Fig. 4D, of the 960 components retained in pseudotargeted strategy, 764 components could be assigned by Progenesis QI in untargeted strategy. While among the remaining 196 ions, 178 ions were not detected, and 18 ions were extracted with wrong charge value. All these components can be manually checked in MS1 scans of original *.raw data file, indicating that the data post-processing of untargeted method is more problematical. Furthermore, linearity comparison of the 764 transitions acquired by both untargeted and pseudotargeted methods showed that this strategy has a lower quantification threshold and higher accuracy (Fig. 4E). As reported, the minimum limit of detection (LoD) and limit of quantification (LoQ) of the targeted strategy are typically two orders of magnitude lower than that of untargeted strategy (Domon et al., 2010).
In brief, the pseudotargeted peptidomics successfully integrated advantages of high detection coverage of the untargeted strategy and quantitative accuracy of the targeted strategy.
3.2 Screening signature peptides from three Pheretima species
For signature peptides screening, we performed chemometric analysis of quantitative data acquired by the dMRM method on three commercial Pheretima species. As shown in Fig. 5A, The principal component analysis (PCA) scores plot showed that different kinds of Pheretima were separated into distinctive clusters (Barri et al., 2013). The first two principal components (PCs) explained the most variation with PC1 and PC2 for 63.8% and 22.7%, respectively. OPLS-DA was employed to analyze the signature components of each group (Fig. 5B). Features with Variable Importance for Projection (VIP) >1 were filtered out as potential markers. Significant differences between each group were selected (Fig. 5C). Finally, 56 components with outstanding discriminating potential for three Pheretima species were screened out (Fig. 5D).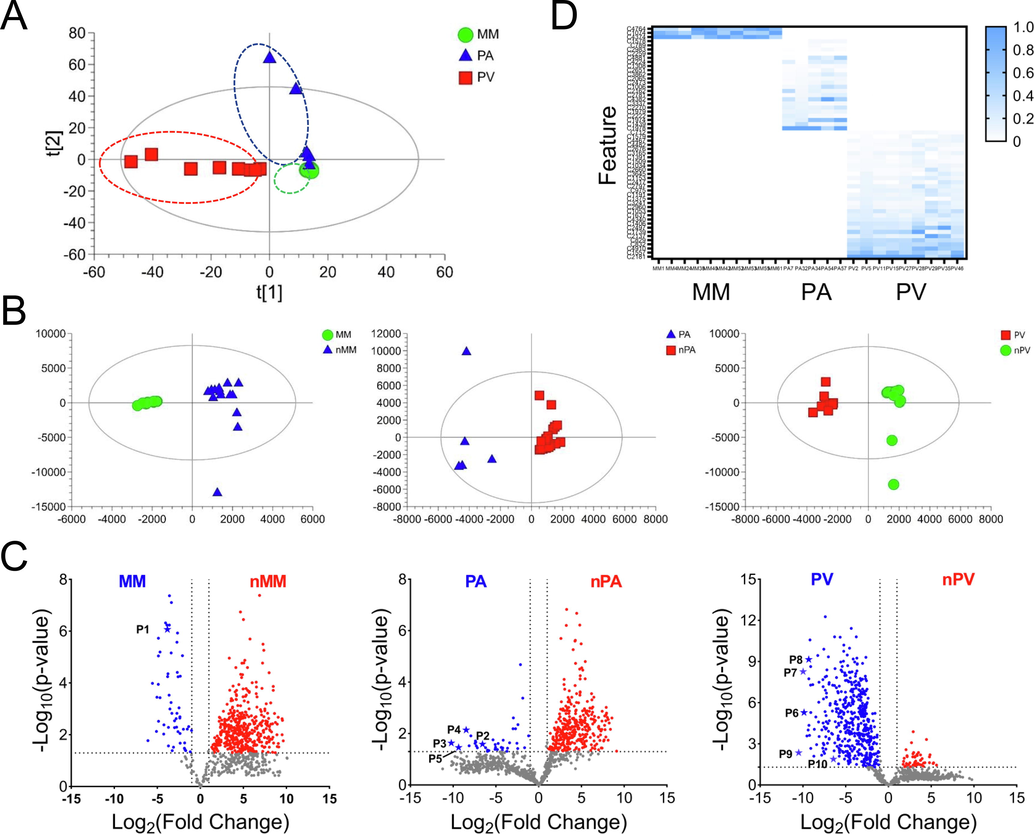
The chemometric analysis result of peak area of three kinds of Pheretima (n = 24). A, PCA-X score plot of three kinds of Pheretima (n = 24), with R2 X and Q2 X of 0.939 and 0.711, respectively. B, OPLS-DA score plots of MM and nMM, PA and nPA, PV and nPV, respectively. C, The volcano plots of statistical significance against a (log 2)-fold change between MM and nMM, PA and nPA, PV and nPV, respectively. The signature peptides were marked. D, The normalized heatmap of peaks area of 56 features in 24 batches of Pheretima.
3.3 Peptide identification and validation
Database search is one of the most effective and frequently-used method for peptide sequence analysis in both peptidomics and proteomics research. But for Pheretima, the protein database is poorly annotated, which lead to the method improbable to implement. With the development of the sequencing technology, transcriptomic data is increasingly used for the construction of the annotated theoretical database (Nesvizhskii et al., 2014; Cogne et al., 2020). In this paper, two in-house theoretical protein databases of Pheretima were constructed by translating the RNA-seq data of P.A and P.G, which were reported before (Liu et al., 2022). Figure S3 revealed the sequence length distribution of the databases. Database search and spider search modes were combined for peptide identification, thereby increasing the success rate, especially for the peptides containing mutation amino acids and various modifications (Han et al., 2004). In all, 2562 peptides in three species were identified with FDR less than 1%. As shown in Figure S4, >80% of the peptides are 6–20 amino acids in length. For 56 specific components, 32 of them were sequenced.
The identification accuracy of NPs is influenced by various factors, including PTMs, database richness, and so on. Thus, ten high-content specific peptides were selected and validated by synthetic peptides with following conditions: Firstly, multiple multi-charged ions were used to confirm the presence of a peptide in MS1 scan to reduce the interference of fragment ions. Secondly, the peptides with chimeric spectrums were excluded. Thirdly, the mass tolerance of peptides should be within ± 5 PPM and the fragment ions in MS2 scan ought to have a good match with the b, y ions. As shown in Table 1, nine peptides proved to be successfully identified by comparing MS1 spectrum, MS2 spectrums and RTs between QC sample and standards, the detailed comparison of P6 (490.2–577.3) was shown as an example in Fig. 6. Nevertheless, although the transition of P1 (706.4–448.2) showed great specificity for MM, and was identified as G(+42.01)NKTLVLPVPAFN with the acetylation at C-term, its synthetic peptide was not well matched. The potential reasons need to be further investigated.
No.
Sequences
Length
RT
m/z
Charge
M
PPM
Specificity
P1a
G(+42.01)NKTLVLPVPAFN
13
54.2
706.4005
2
1410.7865
0.1
MM
P2
SFGGLGGSR
9
20.1
419.2135
2
836.4140
1.8
PA
P3
LSNGVHLV
8
27.7
419.7423
2
837.4708
0.9
PA
P4
AGTNRFATQA
10
12.9
518.7618
2
1035.5097
0.7
PA
P5
GINVHDIEGTVTSPA
15
38.6
755.3800
2
1508.7471
1.1
PA
P6
TATEPGPHAV
10
13.4
490.2455
2
978.4770
0.5
PV
P7
TEQLQDAENRATVGER
16
21.2
606.2963
3
1815.8711
2.2
PV
P8
DTDVETAKVQLT
12
27.3
660.3367
2
1318.6616
2.1
PV
P9
TTVMSGIPTGPRTQ
14
30.3
723.3722
2
1444.7344
3.2
PV
P10
TTVTSGADDFGDVPAVQ
17
37.7
840.3905
2
1678.7686
1.3
PV
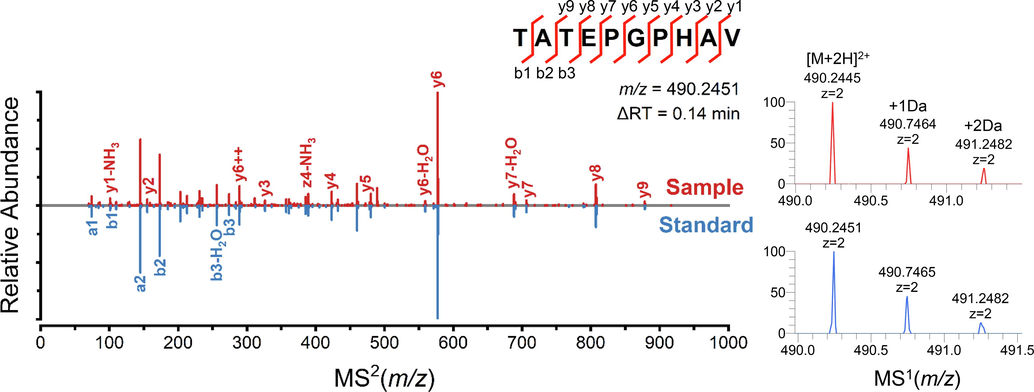
The MS1 and MS2 spectrum comparison of P6 (490.2–577.3) in sample and standard.
3.4 Specific chromatogram of the Pheretima based on signature peptides.
For species authentication of these three kinds of Pheretima, a 10 min rapid detection method based on signature peptides were established (Fig. 7B). As shown in Fig. 7A, all peptides showed superb specificity with P1 for MM, P2, P3, P4, and P5 for PA, and P6, P7, P8, P9, and P10 for PV, respectively.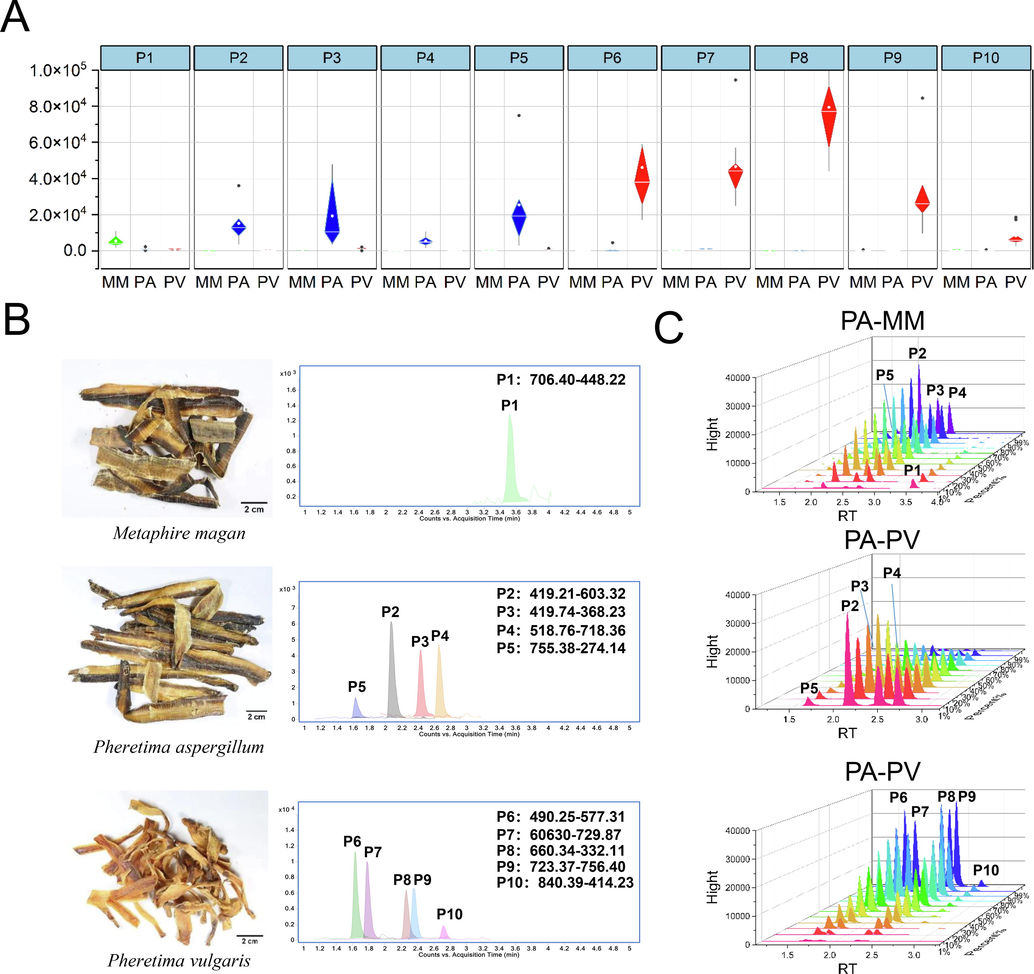
A, The Grouped scatter plots of 10 signature peptides. B, The individual specific chromatogram established by 10 peptides by 10 min MRM methods for each species. C, The 3D waterfall plot of peak area of signature peptides detected by MRM method for different proportion mixture of PA, and PV.
Afterwards, the specificity of the signature peptides was further tested by the artificial adulteration experiments, which mixed QC samples of every two of the three species in different proportions. As shown in Fig. 7C, PA and PV were mixed with each other in the proportions from 0% to 100%. The content of the signature peptides was increased or reduced proportionally for corresponding species, indicated a robust specificity. The similar situations could also be found between MM and PV, and PA and MM (Figure S5). Surprisingly, the method displayed excellent sensitivity with the capacity of discernment of 1% adulterants.
4 Conclusions
In the present study, we developed a novel pseudotargeted peptidomics strategy for high-throughput characterization of NPs. To our knowledge, this is the first attempt to use pseudotargeted strategy in NPs analysis. The in-house software Pep-MRMer could high throughput extract the information of multi-charged peptides and ensure a refined transition list. The HAI-RT_cal method enables precisely RT calibration, which could be used for transferring ion pair between different instruments. The strategy was applied for NPs screening and species authentication of multi-sourced Pheretima. In all, a total of 3307 NPs were well relatively quantified by the DMRM method and three kinds of commercial Pheretima were distinctly discriminated by using 10 signature peptides after systematic analysis.
In conclusion, the pseudotargeted peptidomics strategy has been demonstrated to be general and robust with great quantification ability, high peptide coverage for NPs analysis. It could be used for screening signature natural peptides, which have great application potential for enhancing the quality control capability of traditional Chinese medicines, especially for animal-derived drugs. Furthermore, we anticipate that it will also has a good prospect for biomarker discovery of disease models.
CRediT authorship contribution statement
Dongdong Huang: Software, Writing – original draft, Investigation, Data curation, Formal analysis. Xiaoxiao Luo: Writing – original draft, Investigation, Data curation, Formal analysis. Qirui Bi: Conceptualization, Methodology, Data curation, Writing – review & editing. Yelin Ding: Writing – review & editing. Yun Li: Data curation, Formal analysis. Cuicui Wang: Formal analysis. Min Gao: Formal analysis. Yong Huang: Data curation. Changliang Yao: Formal analysis. Jianqing Zhang: Formal analysis. Wenlong Wei: Formal analysis. Yurong Wang: Writing – review & editing. De-an Guo: Supervision, Writing – review & editing.
Acknowledgement
This work was financially supported by the Key Program of National Natural Science Foundation of China [NO. 82130111]; National Natural Science Foundation of China [No. 81803716]; and Qi-Huang Chief Scientist Project of National Administration of Traditional Chinese Medicine (2020).
References
- UPLC-ESI-QTOF/MS and multivariate data analysis for blood plasma and serum metabolomics: effect of experimental artefacts and anticoagulant. Anal Chim Acta.. 2013;768:118-128.
- [CrossRef] [Google Scholar]
- Chinese pharmacopoeia commission, Pharmacopoeia of people's republic of China (Vol. I), 2020th ed., China Medical Science and Technology Press, Beijing, 2020.
- A cross-platform toolkit for mass spectrometry and proteomics. Nat. Biotechnol.. 2012;30(10):918-920.
- [CrossRef] [Google Scholar]
- Multiplexed quantitation of endogenous proteins in dried blood spots by multiple reaction monitoring - mass spectrometry. Mol Cell Proteomics.. 2013;12(3):781-791.
- [CrossRef] [Google Scholar]
- Proteogenomics-guided evaluation of RNA-Seq assembly and protein database construction for emergent model organisms. Proteomics. 2020;20(10):e1900261.
- [Google Scholar]
- Black mamba venom peptides target acid-sensing ion channels to abolish pain. Nature. 2012;490(7421):552-557.
- [CrossRef] [Google Scholar]
- Options and considerations when selecting a quantitative proteomics strategy. Nat. Biotechnol.. 2010;28(7):710-721.
- [CrossRef] [Google Scholar]
- A quantitative UHPLC-MS/MS method for the growth hormone-releasing peptide-6 determination in complex biological matrices and transdermal formulations. Talanta. 2021;233:122555
- [CrossRef] [Google Scholar]
- DNA sequence to identify zoological origin of commercial pheretima from chinese herbal markets and discussion on its herbal textual research. Mod Chin Med.. 2019;21:1206-1214.
- [CrossRef] [Google Scholar]
- SPIDER: software for protein identification from sequence tags with de novo sequencing error. Proc. IEEE Comput. Syst. Bioinform. Conf.. 2004;206–215
- [CrossRef] [Google Scholar]
- Neuropeptides in prespective: the last ten years. Neuron. 1991;7:867-879.
- [CrossRef] [Google Scholar]
- A comprehensive review on current advances in peptide drug development and design. Int. J. Mol. Sci.. 2019;20(10):2383.
- [CrossRef] [Google Scholar]
- Authentication of three main commercial pheretima based on amino acids analysis. Amino Acids.. 2021;53(11):1729-1738.
- [CrossRef] [Google Scholar]
- A rapid and simple signature peptides-based method for species authentication of three main commercial pheretima. J. Proteomics.. 2022;255:104456
- [CrossRef] [Google Scholar]
- Optimization of large-scale pseudotargeted metabolomics method based on liquid chromatography-mass spectrometry. J. Chromatogr. A.. 2016;1437:127-136.
- [CrossRef] [Google Scholar]
- High performance plasma amyloid-beta biomarkers for Alzheimer's Disease. Nature. 2018;554(7691):249-254.
- [CrossRef] [Google Scholar]
- Proteogenomics: concepts, applications and computational strategies. Nat. Methods.. 2014;11(11):1114-1125.
- [CrossRef] [Google Scholar]
- Fragmentation pathways of protonated peptides. Mass Spectrom Rev.. 2005;24(4):508-548.
- [CrossRef] [Google Scholar]
- A self-assembling peptide acting as an immune adjuvant. P Natl. Acad. Sci. USA. 2010;107(2):622-627.
- [CrossRef] [Google Scholar]
- Development of urinary pseudotargeted lc-ms-based metabolomics method and its application in hepatocellular carcinoma biomarker discovery. J. Proteome Res.. 2015;14(2):906-916.
- [CrossRef] [Google Scholar]
- A UHPLC/MS/MS method for the analysis of active and inactive forms of GLP-1 and GIP incretins in human plasma. Talanta. 2022;236:122806
- [CrossRef] [Google Scholar]
- A method to identify and quantify the complete peptide composition in protein hydrolysates. Anal. Chim Acta.. 2022;1201:339616
- [CrossRef] [Google Scholar]
- An improved pseudotargeted metabolomics approach using multiple ion monitoring with time-staggered ion lists based on ultra-high performance liquid chromatography/quadrupole time-of-flight mass spectrometry. Anal Chim Acta. 2016;927:82-88.
- [CrossRef] [Google Scholar]
- Pseudotargeted lipidomics strategy enabling comprehensive profiling and precise lipid structural elucidation of polyunsaturated lipid-rich echium oil. J. Agric. Food Chem.. 2021;69(32):9012-9024.
- [CrossRef] [Google Scholar]
- The application of pseudotargeted metabolomics method for fruit juices discrimination. Food Chem.. 2020;316:126278
- [CrossRef] [Google Scholar]
- Development of a high coverage pseudotargeted lipidomics method based on ultra-high performance liquid chromatography-mass spectrometry. Anal Chem.. 2018;90(12):7608-7616.
- [CrossRef] [Google Scholar]
- Antimicrobial peptides of multicellular organisms. Nature. 2002;415(6870):389-395.
- [CrossRef] [Google Scholar]
- Total alkylated polycyclic aromatic hydrocarbon characterization and quantitative comparison of selected ion monitoring versus full scan gas chromatography/mass spectrometry based on spectral deconvolution. J. Chromatogr. A.. 2008;1205(1–2):109-116.
- [CrossRef] [Google Scholar]
- Evaluation and verification of the characteristic peptides for detection of Staphylococcus aureus in food by targeted LC-MS/MS. Talanta. 2021;235:122794
- [CrossRef] [Google Scholar]
- Development of a plasma pseudotargeted metabolomics method based on ultra-high-performance liquid chromatography-mass spectrometry. Nat. Protoc.. 2020;15(8):2519-2537.
- [CrossRef] [Google Scholar]
- Integration of untargeted and pseudotargeted metabolomics for authentication of three shrimp species using UHPLC-Q-Orbitrap. J. Agric. Food Chem.. 2021;69(31):8861-8873.
- [CrossRef] [Google Scholar]
Appendix A
Supplementary material
Supplementary data to this article can be found online at https://doi.org/10.1016/j.arabjc.2023.104980.
Appendix A
Supplementary material
The following are the Supplementary data to this article:Supplementary data 1
Supplementary data 1
Supplementary data 2
Supplementary data 2


