

Translate this page into:
A study on highly active Cu-Zn-Al-K catalyst for CO2 hydrogenation to methanol
⁎Corresponding author. nsampathra@kau.edu.sa (Nagaraju Pasupulety)
-
Received: ,
Accepted: ,
This article was originally published by Elsevier and was migrated to Scientific Scholar after the change of Publisher.
Abstract
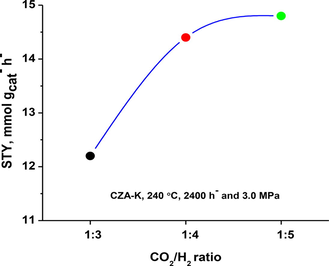
Effect of CO2/H2 mole ratio on methanol yield.
Abstract
Excellent CO2 hydrogenation activity results were obtained on Cu-Zn-Al-K (CZA-K) catalyst with 10% of CO2 conversion and 98% of methanol selectivity at 220 °C. The CZA-K catalyst was precipitated by using 4 M K2CO3/KOH solution. For comparison purpose, CZA-Na and CZA catalysts were synthesized by using 4 M solutions of Na2CO3/NaOH and (NH4)2CO3/NH4OH respectively. Characterization of these catalysts was done by using BET-poresize, XRD, FTIR-DRIFTs, high pressure-TPR, CO2-TPD-mass, XPS and HAADF-STEM-EDX techniques. Among the catalysts studied maximum methanol space time yield of 14.4 mmol·gcat−·h− was obtained on CZA-K at 240 °C with 2400 h− GHSV of CO2/H2 mole ratio equals to 1:4. Greater methanol yield was associated with superior surface Cu+/Cu0 content in CZA-K was obtained through K2CO3/KOH precipitation. Further, FTIR-DRIFTs spectra suggests the interaction of CO2 with the potassium existed in the CZA framework (0.65% K, EDX) led to the formation of K—O—(CO)—O surface species. To some extent, CO2 dissociation to CO and subsequent CH4 formation was limited by this species in presence of H2. At 240 °C, steady catalytic activity was observed for 100 h of continuous operation on CZA-K. It was associated with fewer carbon deposits formation and segregated active metals in CZA-K catalyst. The decreasing order of CO2 hydrogenation activity at 240 °C with 3.0 MPa feed-gas pressure as follows: CZA-K (14% CO2 conversion and 96% methanol selectivity) > CZA-Na (11% and 94%) > CZA (9% and 92%).
Keywords
CO2 hydrogenation
Methanol and Cu-Zn-Al-K catalyst

1 Introduction
Industrial methanol production is mainly associated with catalytic hydrogenation of CO by using Cu-ZnO-Al2O3 type catalyst. However, the industrial Cu-ZnO-Al2O3 catalyst was not very active for CO2 hydrogenation reaction (Hansen et al., 2008). Utilization of bulk CO2 to useful chemicals addresses the greenhouse gas effect on the environment to some extent (Prapatsorn and Aroonsri, 2019). Hydrogenation of CO2 using a suitable catalyst is one of the route to produce useful chemicals such as methanol, C2-C4 olefins and DME (Xiao et al., 2020; Samrand et al., 2014; Enrico et al., 2018). Further, to improve the catalytic performance of Cu-Zn-Al catalyst in CO2 hydrogenation reaction, different Cu loadings, preparation methods and metal promoters were extensively studied (Chiang et al., 2018; Raudaskoski et al., 2007; Köppel et al., 1998; Choi et al., 2001; Carnes and Klabunde, 2003; Díez-Ramírez et al., 2017; Chunjie et al., 2015). To the best of our knowledge, methanol selectivity was reported as maximum as 90–97% on Cu-Zn-Al or Cu-Zn-Al-Zr catalysts with 10–15% of CO2 conversion (Chen et al., 2020; Wang et al., 2017; Gao et al., 2015; Gao et al., 2012; Shuo et al., 2017). In our previous research work, gold promoted Cu-Zn-Al catalysts were studied for CO2 hydrogenation reaction. Further, gold played a vital role in suppressing the reverse water gas shift reaction and there by achieved 80% of methanol selectivity with 20% CO2 conversion at 240 °C with 7000 h− GHSV of CO2/H mole ratio equals to 1:6 (Pasupulety et al., 2015a, 2015b). However, only 10 h of steady catalytic activity was observed on Au-Cu-Zn-Al catalyst. On the other hand, promotional effect of potassium was reported for CO hydrogenation to oxygenates reaction (Sharif et al., 2017). Greater oxygenates selectivity was attributed to associative CO insertion in —CHx species on K-Mo2N catalyst. Based on this experience we wanted to study the influence of potassium for CO2 hydrogenation reaction. Hence, the conventional Cu-Zn-Al ternary oxide catalyst was selected wherein considerable amount of CO byproduct formation was well documented due to CO2 dissociation in the presence of hydrogen on this catalyst (Binglian et al., 2019; Djaouida et al., 2019). The primary assumption was K existence in Cu-Zn-Al framework may promote the associative CO2 hydrogenation process to methanol.
Therefore, Cu-Zn-Al catalyst was synthesized by using 4 M K2CO3/KOH solution with Cu-Zn-Al mole ratio of 1:1:1. For comparison purpose, CZA-Na and CZA catalysts were synthesized by using 4 M solutions of Na2CO3/NaOH and (NH4)2CO3/NH4OH respectively. The unwashed catalyst powders were calcined at 400 °C for 5 h in static air and the resultant catalyst was denoted as CZA-K cal or CZA-Na cal etc. STEM-EDX and XRF analysis was used to quantify the alkali content present in the CZA catalysts. The main objective of this work is to understand the possible structure–activity correlation of CZA catalyst with alkali content (K or Na) studied for CO2 hydrogenation reaction at 220–250 °C with 2400 h− GHSV of CO2/H2 mole ratio equals to 1:4.
2 Experimental
2.1 Catalyst preparation
CuZnAl samples were synthesized by using traditional coprecipitation method with Cu/Zn/Al mole ratio of 1:1:1. In a typical procedure, 0.1074 mol of Cu(NO3)2·3H2O (Panreac, 98%), 0.1074 mol Zn(NO3)2·6H2O (Aldrich, 99%) and 0.1074 mol Al(NO3)3·9H2O (Panreac 98%) were dissolved in deionized water for preparation of a 2 M solution (Solution 1). Solution 2 was prepared by dissolving K2CO3 (0.203 mol) (CDH, 98%) and KOH (0.7406 mol) (CDH, 98%) in deionized water for 4 M solution. Solution 2 was added into solution 1 drop wise under constant stirring condition. The precipitation continued until pH of the solution reached 11. Then the mixture was stirred for 30 min after the base addition and the precipitate was aged at 70 °C for 18 h. Further, the suspension was filtered and the solid residue was seperated. The wet solid was dried at 110 °C for overnight to obtain the CZA-K catalyst. Identical procedure was followed for the synthesis of CZA-Na and CZA catalysts by using 4 M solutions of Na2CO3/NaOH and (NH4)2CO3/NH4OH respectively. The resultant dried solids were calcined at 400 °C for 5 h under static air.
2.2 Characterization of samples
All the calcined and spent CZA samples were characterized by using the following techniques.
BET surface area-poresize analysis was done by using Quantachrome Nova Station (USA). The samples were pretreated under vacuum for 2 h at 150 °C. XRD analysis was done by using EQUINOX 1000 Inel XRD machine at Co Kα = 1.7902 Å with acquisition of 2θ from 10° to 110°. X-ray Fluorescence (XRF) analysis was carried out using AMPTEK XRF Kit in Equinox 1000 (France) system and was operated at 100 kV and 30 mA. XPS analysis was done by using SPECS GmbH analysis system containing Mg Kα 1253.6 eV X-ray source and the samples binding energy (BE) was attained by using C1s 284.8 eV correction.
CO2-TPD analysis was done by using micromeritics AutoChem HP 2950 V3.02 instrument. The mass spectral data was obtained by using ThermoStarTM GSD 320 quad core mass spectrometer. The m/z values followed were: m/z = 18 (H2O), m/z = 28 (CO) and m/z = 44(CO2). In a typical experiment, calcined samples of 150 mg each was placed in a quartz tube and pretreated at 200 °C in He flow (50 cm3 min−1) for 1 h. Subsequently, the temperature of the sample was brought to 40 °C and saturated with 10% CO2-He for 1 h. Then, the sample was purged with He flow (50 cm3 min−1) for 1 h. Desorption of CO2 was performed over the temperature range of 75–400 °C at a ramping rate of 10 °C min−1. Desorption stream was analyzed simultaneously by using a TCD and mass detector through an automated split valve. HAADF-STEM-EDX images were collected on Tecnai 200 kV D1234 SuperTwin microscope with camera length of 97 cm. TG analysis was carried out on STA-449 F3, NETZSCH instrument by using 20 mg of spent sample loading.
Insitu DRIFTs analysis was carried out using BrukerTensor-II FTIR spectrometer equipped with DLATGS detector, Harrick praying mantis with high temperature and high pressure reaction chamber (4 mm thick ZnS windows (≥6 MPa)). Approximately 0.1 g of catalyst was loaded and it was reduced at 300 °C for 2 h under the flow of H2 (20 cm3 min−). Subsequently, the chamber flushed with argon gas for 1 h. Then the reaction feed-gas (CO2/H2 = 1:4 mol ratio) was introduced into the chamber with an applied pressure of 3.0 MPa and collected the sample data.
High pressure temperature programmed reduction (HP-TPR) of the calcined CZA samples (0.150 g) were studied using 10% H2–Ar mixture gas (50 cm3 min−) at 3.0 MPa applied pressure by using micromeritics AutoChem HP 2950 V3.02 instrument at a ramping rate of 10 °C min−.
2.3 Activity tests
Catalytic activity tests were performed using PID Eng & Tech micro reactor equipped with gas flowmeters and temperature controllers. These tests were carried out in the temperature range of 220–250 °C at 2400 h− GHSV of CO2/H2 mole ratio equals to 1:4 and 3.0 MPa applied pressure. For example, 0.5 g of calcined catalyst was loaded into a stainless steel (SS) tube reactor and subsequently catalyst was treated with hydrogen gas (20 cm3 min−) at 300 °C for 2 h. Further, the reactor temperature was set back to 220 °C and purged with nitrogen gas. After attaining the steady state at set temperature, CO2/H2 feed gas was introduced into the reactor to attain the required pressure. The reaction stream at each temperature directed to Agilent 7890A GC equipped with TCD detector with Restek Plot Q column for CO2 and CO evaluation and FID detector with HP Plot Q column for methane and methanol estimation. The CO2 conversion (%X CO2), methanol selectivity (%S MeOH) and methanol space time yield (STY, mmol. gcat−. h−) calculated using following equations. The calibrated results were reproducible with in the sample standard deviation of ± 0.1%.
3 Results and discussion
3.1 Influence of CO2/H2 mole ratio on methanol space time yield
The CO2 to H2 mole ratio in the present study was varied between 1:3 and 1:5 and the obtained results on CZA-K at 2400 h− GHSV and 240 °C are presented as Fig. 1. Methanol yield was found low at 1:3 CO2/H2 ratio (12.2 mmol·gcat−·h−), on the other side, maximum methanol yield was obtained at 1:5 CO2/H2 ratio (14.8 mmol·gcat−·h−). It is obvious from the results that sluggish improvement in the methanol yield was observed from 1:4 CO2/H2 mole ratio to 1:5. The results suggest that at 1:3 ratio the partial pressure of H2 was low while at 1:5 ratio the CO2 partial pressure was low to improve the methanol formation at 2400 h− GHSV. Hence, the optimum mole ratio of CO2/H2 was found to be around 1:4 on CZA-K catalyst and it was used for further studies.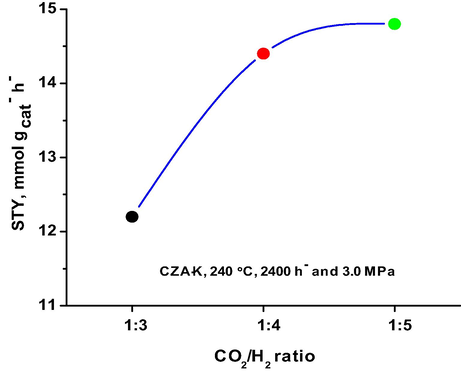
Effect of CO2/H2 mole ratio on methanol yield.
3.2 Catalytic activity studies
Catalytic activity results of CZA catalysts are presented as Fig. 2. Activity studies were carried out in the reaction temperature range of 220–250 °C under 3 MPa applied pressure of CO2/H2 feed-gas (1:4 mol ratio) with 2400 h− GHSV. Among the studied catalysts, the maximum CO2 conversion of 16% was obtained on CZA-K at 250 °C. On the other hand, only 13 and 12% of CO2 conversion was obtained on CZA-Na and CZA catalysts respectively at this temperature. Further, maximum methanol selectivity of 98% was obtained on CZA-K with 10% CO2 conversion at 220 °C. Methanol selectivity of studied catalysts was decreased about 5 to 7% with increase in the reaction temperature from 220 to 250 °C. Besides, selectivity of CO and CH4 was slightly increased with increase in the reaction temperature. At 240 °C, 96% methanol selectivity with 14% of CO2 conversion was observed on CZA-K catalyst. Whereas, only 11 and 94% followed by 9 and 92% CO2 conversion and methanol selectivity was observed on CZA-Na and CZA catalysts respectively at this temperature. The greater catalytic activity of CZA-K was attributed to its greater reduced surface copper content (0.42%) followed by CZA-Na (0.30%). For comparison purpose, CZA-K washed catalyst activity was also studied under identical reaction conditions. However, the CO2 conversion and methanol selectivity was decreased to 11.5 and 92% respectively at 240 °C. The results are in agreement with FTIR-DRIFTs data wherein intense CO formation was observed on CZA-K washed catalyst over unwashed one. Moreover, FTIR-DRIFTs spectra suggests the interaction of CO2 with the potassium existed in the CZA framework led to K—O—(CO)—O species formation. To some extent, CO2 dissociation to CO and subsequent CH4 formation was limited by this species in presence of H2. Residual sodium effect on the catalytic activity of Cu-Zn-Al in methanol synthesis using CO2 and H2 was reported by Jun et al. (1998). Lower CO2 hydrogenation activity on this catalyst was attributed to low Cu dispersion and non-facile reduction of CuO phase in the presence of residual sodium. In contrast, we have observed very good CO2 hydrogenation activity on our lab synthesized CZA-Na catalyst studied under similar reaction conditions. The major differences between Jun et al., and the present study as follows: (i) Jun et al., studied the lower mole ratio of Zn and Al in Cu-Zn-Al catalyst (1:0.8:0.15) whereas, Cu-Zn-Al mole ratio in this study was 1:1:1 (ii) The precipitation of CZA-Na was done at pH = 7, on the other hand, we precipitated at pH = 11 (iii) CZA-Na catalyst was air calcined at 350 °C for 12 h, whereas, we calcined our catalyst at 400 °C for 5 h in static air (iv) the overall reducibility of our CZA-Na catalyst was about 95% and copper metal area was about 18.0 m2/g versus 1.0 m2/g.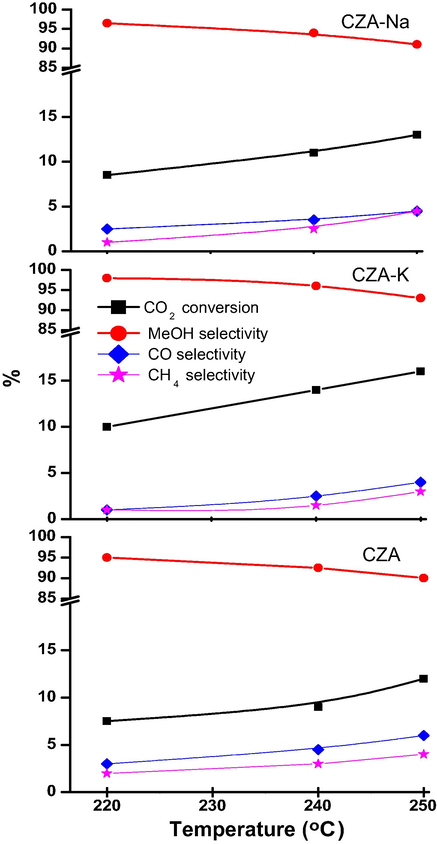
Catalytic activity results of CZA catalysts at CO2/H2 (1:4) GHSV 2400 h− and 3.0 MPa.
Fig. 3 demonstrates time on stream results on CZA catalysts at 240 °C with CO2/H2 (1:4 mol ratio) feed-gas pressure of 3.0 MPa and 2400 h− GHSV. Steady catalytic activity was observed for 100 h of continuous operation on CZA-K catalyst with 14% of CO2 conversion and 96% of methanol selectivity. On the other hand, CZA-Na and CZA catalysts showed steady CO2 hydrogenation activity for 54 and 36 h respectively. Further, a slight decrease in the activity results was associated with carbon deposits formation on the active sites of CZA-Na and CZA catalysts observed through TGA studies (Table 1, Fig. S4). In addition, the particle size of spent CZA (60–120 nm) and CZA-Na (50–100 nm) catalysts found high over CZA-K (20–40 nm) suggests that sintering of active metal could be another reason for their low catalytic activity. Hence, CZA-K is a promising catalyst for mass production of methanol from CO2 and H2. Further, detailed catalyst characterization was reported and possible structure–activity correlation was discussed.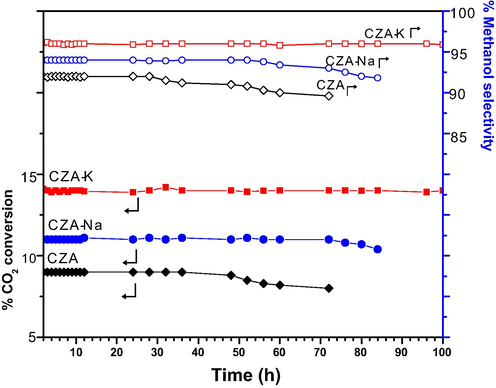
CZA catalysts stability test at 240 °C with CO2/H2 (1:4) GHSV 2400 h− and 3.0 MPa.
3.3 XRD analysis
Powder X-ray diffraction patterns of calcined and spent CZA catalysts were obtained by using Co (Kα = 1.7902 Å) source are presented as Fig. 4. All the calcined samples showed a broad X-ray pattern in the 2θ range between 40 and 45° with X-ray reflection maxima at 2θ = 42.7° which suggests the existence of Cu2O and CuO phases. However, CuO phase was prominent in CZA-Na calcined sample over other two CZA calcined samples. On the other hand, spent CZA catalysts principally demonstrated metallic copper and Cu2O phases. Furthermore, γ-Al2O3 phase was observed at 2θ = 65.7, 67.2 and 82.1° for CZA-Na and CZA spent samples. The results suggest that small sized metallic copper and Cu2O crystals were obtained for CZA-K catalyst through K2CO3/KOH precipitation.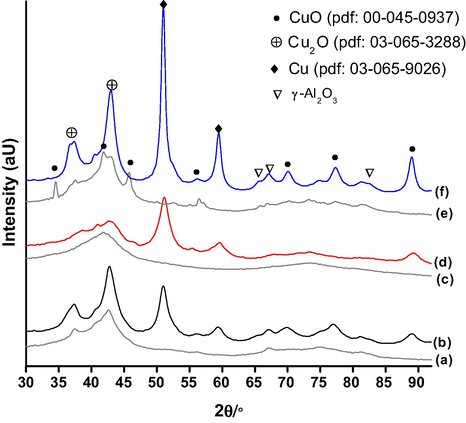
(a) CZA-cal (b) CZA-spent (c) CZA-K cal (d) CZA-K spent (e) CZA-Na cal and (f) CZA-Na spent.
3.4 High-pressure TPR studies
Reducibility of CZA calcined samples were studied under high pressure (3 MPa) of 10% H2-Ar probe gas and the obtained profiles were presented as Fig. 5. A wide range of TCD signal was observed in the reduction temperature range between 175 and 340 °C for all the three CZA samples. Further, reduction peak temperature maximum (Tmax) at 240 or 260 °C was associated with the reduction of dispersed and or isolated CuO to Cu2O in CZA ternary oxide.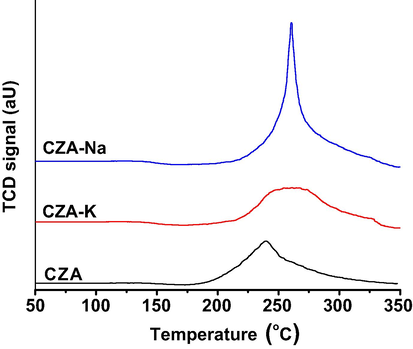
HP-TPR profiles of CZA samples.
The sharp reduction profile of CZA-Na sample suggests the existence of relatively large sized CuO crystals over other two samples. On the other hand, a broad reduction profile in the temperature range between 260 and 350 °C for CZA-K sample suggests the continuous process of Cu2O reduction into metallic copper. TPR results are in agreement with XRD results wherein, broad X-ray reflections were obtained for CZA-K sample. Furthermore, higher reducibility (95%) was observed for CZA-Na sample compared to CZA-K (70%) and CZA (63%) samples. No ZnO reduction was observed in these samples upto 350 °C of HP-TPR. We have also performed ambient pressure TPR experiments for these samples and observed a similar reduction pattern, however, the TPR profiles was shifted to higher side of the temperature scale by 10–20 °C.
3.5 CO2-TPD-mass analysis
CO2-TPD-mass analysis results of CZA samples are presented as Fig. 6. It is obvious that a broad desorption of CO2 in the temperature range between 100 and 275 °C was observed with peak Tmax at 145 °C for CZA-Na and CZA-NH3 samples. On the other hand, a broad CO2 desorption peak in the temperature range between 75 and 300 °C was observed for CZA-K sample with Tmax at 110 and 145 °C. According to Kai et al. (2018) CO2 can adsorb on potassium in Mg-Al-K hydrotalcites at lower adsorption temperatures. Further, Pasupulety et al. (2015a, 2015b) reported a CO2 desorption peak at 130 °C for C2ZA sample and attributed to linear mode of CO2 sorption on metallic copper. In the present study, the CO2 desorption observed at Tmax equals to 110 °C was attributed to K interacted CO2 in CZA-K sample. Further, CO2 interacted with metallic copper was desorbed at Tmax equals to 145 °C in all the three samples. The decreasing order of CO2 desorption capacity (Table 1) as follows: CZA-K (22.0 µmol gcat−) > CZA (19.0 µmol gcat −) > CZA-Na (18.0 µmol gcat−). Hence, the results suggest that the potassium presence in the CZA framework improved the sorption capacity of CO2 for CZA-K sample and there by influenced the CO2 hydrogenation activity.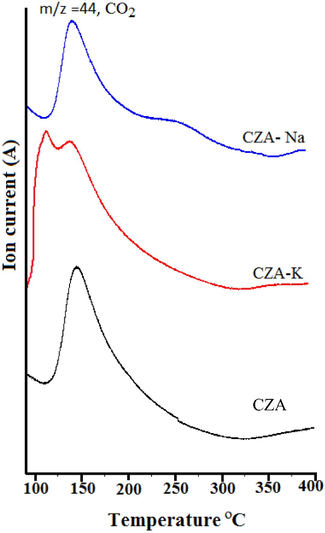
CO2-TPD-mass analysis results of CZA samples.
3.6 FTIR-DRIFTs studies
FTIR-DRIFTs studies on CZA-K catalyst was carried out at different chamber temperatures under CO2/H2 atmosphere (1:4 mol ratio) at 3.0 MPa pressure and the results are presented as Fig. 7A. All the spectra were collected for 2 h. No methoxy (—OCH3) species was detected on this catalyst upto 180 °C. However, at 180 °C, symmetric and asymmetric vibrations of bidentate carbonate species were observed at 1360 and 1600 cm−1 respectively. These carbonate vibrations were intensified with increase in the chamber temperature from 180 to 240 °C. Further, at 220 and 240 °C weakly intensified new bands were appeared at 2100 and 3000 cm−1 respectively corresponds to CO and hydrocarbons. It is well established that CO formation was due to the reverse water gas shift reaction under the studied conditions. These type of surface carbonate intermediates were reported on K promoted hydrotalcites by Kai et al. (2018). After 2 h of CO2 hydrogenation reaction on CZA-K at 3 MPa, the gas flow was switched to argon (20 cm3 min−) under ambient pressure at 240 °C to see the existing surface intermediates on this catalyst (brown line, Fig. 7A(g)). Essentially four signals were detected at 1360, 1420, 1580 and 2380 cm−1 respectively corresponds to symmetric bidentate carbonates, K interacted carbonates (K—O—(CO)—O), asymmetric bidentate carbonates (slightly shifted to lower frequency in the absence of water vapor) and CO2—H2 vibrations in argon gas flow. The carbonates formation on K is in agreement with CO2-TPD-mass analysis data wherein low temperature (Tmax = 110 °C) CO2 sorption was observed for CZA-K sample. Under different gas atmospheres and chamber temperatures negligible variation in the formation of symmetric bidentate carbonates over asymmetric bidentate carbonates was observed on CZA-K. Hence, assymmetric bidentate carbonates were active and converting into methoxy species to methanol. According to Wang et al. (2020) bicarbonates were more active in the presence of water vapor and transformed into methanol via formate intermediate on Cu-ZnO-ZrO2 catalyst. For comparison purposes, we have carried out the DRIFTs analysis on CZA-K washed catalyst to find out the role of K in the formation of methanol under identical reaction conditions (dark yellow line, Fig. 7A(f)). It is noteworthy that, K washed catalyst demonstrated relatively higher CO intermediate formation with considerable methoxy species. The results suggest that K presence in the CZA framework playing a vital role in methanol formation on CZA-K catalyst via K—O—(CO)—O species.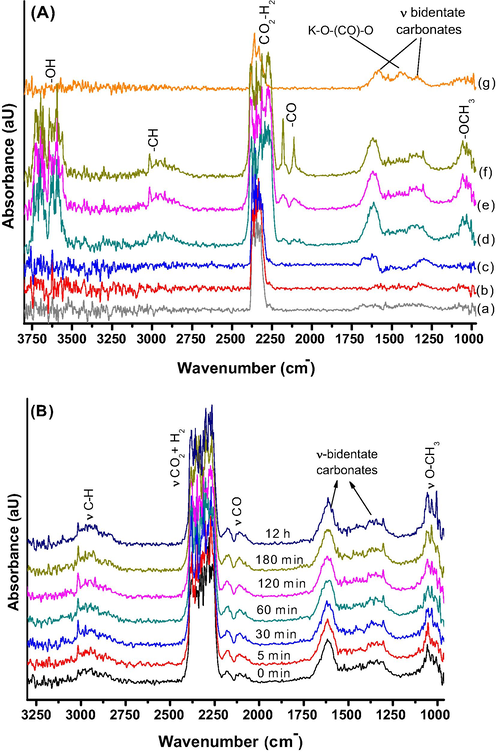
(A) DRIFTs spectra collected on CZA-K at different chamber temperatures (a) 23 °C, 3.0 MPa (b) 100 °C, 3.0 MPa (c) 180 °C, 3 MPa (d) 220 °C, 3 MPa (e) 240 °C, 3 MPa (f) spectra collected on CZA-K washed catalyst at 240 °C, 3 MPa and (g) spectra collected on CZA-K at 240 °C in argon gas flow, 0.1 MPa. (B) Time resolved transient DRIFTs spectra on CZA-K catalyst at 240 °C under CO2-H2 feed-gas pressure of 3.0 MPa.
The time resolved transient DRIFTs spectra on CZA-K catalyst at 240 °C under CO2-H2 feed-gas pressure of 3.0 MPa is presented as Fig. 7B. Apart from CO2-H2 vibrations, new bands corresponds to —OCH3, mono, bi-dentate carbonates, —CO and -C-H vibrations were detected on CZA-K catalyst. It is noteworthy that, a slight improvement in the relative intensity of —CO and —OCH3 species was observed on this catalyst at different time intervals. The results indicate the steady formation of —OCH3 and mono, bi-dentate carbonate intermediates on CZA-K catalyst for12h duration. In addition, DRIFTs spectra obtained on CZA-Na and CZA catalysts were presented as supplementary Fig. S1. Relatively higher CO formation was observed for these catalysts compared to CZA-K at 240 °C under 3.0 MPa CO2/H2 (1:4) feed gas pressure.
3.7 BET surface area and pore size distribution
BET surface area and poresize distribution results of spent CZA samples are presented as Fig. 8(a), (b) and Table 1. All the three samples exhibited type-IV isotherm with H4 hysteresis loop (Fig. 8a). Loop H4 often associated with narrow slit like pores (Sing et al., 1985) in studied samples. However, CZA-Na and CZA samples illustrated hysteresis loop starting from P0 = 0.4 to 1, whereas, hysteresis loop was observed from P0 = 0.8 to 1 in CZA-K sample. Among the studied catalysts, greater BET surface area was observed for CZA-Na (56.0 m2 g−) followed by CZA-K (50.0 m2 g−) and CZA sample (49.0 m2 g−).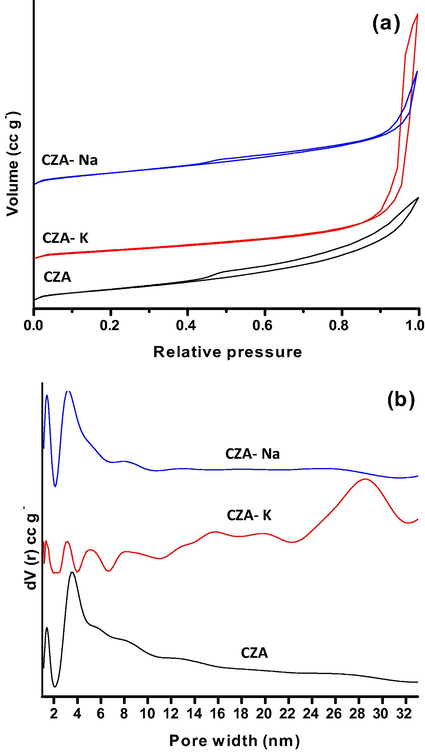
BET surface area and poresize distribution results of spent CZA samples.
It is obvious from the poresize distribution graph in Fig. 8b that micro (<2 nm) and mesopores (2–7 nm) were dominant in CZA-Na and CZA samples. On the other hand, mespores in the pore width range of 2 to 7 nm were diminished for CZA-K sample. However, mesopores in the pore width range between 23 and 32.5 nm with pore width maximum of 28.5 nm were observed in potassium sample. The decreasing order of estimated pore volume for these samples as follows (Table 1): CZA-K (0.243 cc g−) > CZA (0.121 cc g−) > CZA-Na (0.105 cc g−). The results suggest that different precipitating agent used in the synthesis of CZA samples yielded different pore width and BET surface area.
3.8 HAADF-STEM-EDX studies
HAADF-STEM technique was used to identify the particle shape /size in spent CZA, CZA-K and CZA-Na catalysts and the images are depicted in Fig. 9. Irregular shaped particles with 60–120 nm size was observed for spent CZA sample (Fig. 9(a)). The corresponding EDX analysis revealed Cu, Zn and Al elements (Fig. 9(d)) in CZA sample. No nitrogen related EDX signals were detected in CZA sample. The result suggests that CZA precipitation with (NH4)2CO3/NH4OH volatizes nitrogen residues during the calcination and or CO2 hydrogenation process. On the other hand, two types of particles with platelet shape and tetragonal shape were obvious in Fig. 9(b). The focused beam EDX analysis of bulk tetragonal particles revealed Al as a main component. Whereas, the platelet particles were mainly associated with Cu and Zn elements with approximate length of 20–40 nm and the width of 2–5 nm. It is noteworthy that, potassium was found in the platelet particles of CZA upon careful EDX scanning (Fig. 9(e)). Further, The EDX analysis quantification of spent CZA-K sample as follows: Cu = 17.35 atm.%, Zn = 15.0 atm.%, Al = 21.0 atm.%, O = 46.0 atm.%, and K = 0.65 atm.%. Fig. 9(c) image revealed spherical particles about 50–100 nm size in Spent CZA-Na sample. The EDX analysis of CZA-Na revealed mainly Cu, Zn and Al elements. However, Na signal was masked by Cu and Zn EDX signal and it was not possible to quantify the Na content through this technique. Hence, Na content in spent CZA-Na sample was estimated through XRF technique as 0.60%.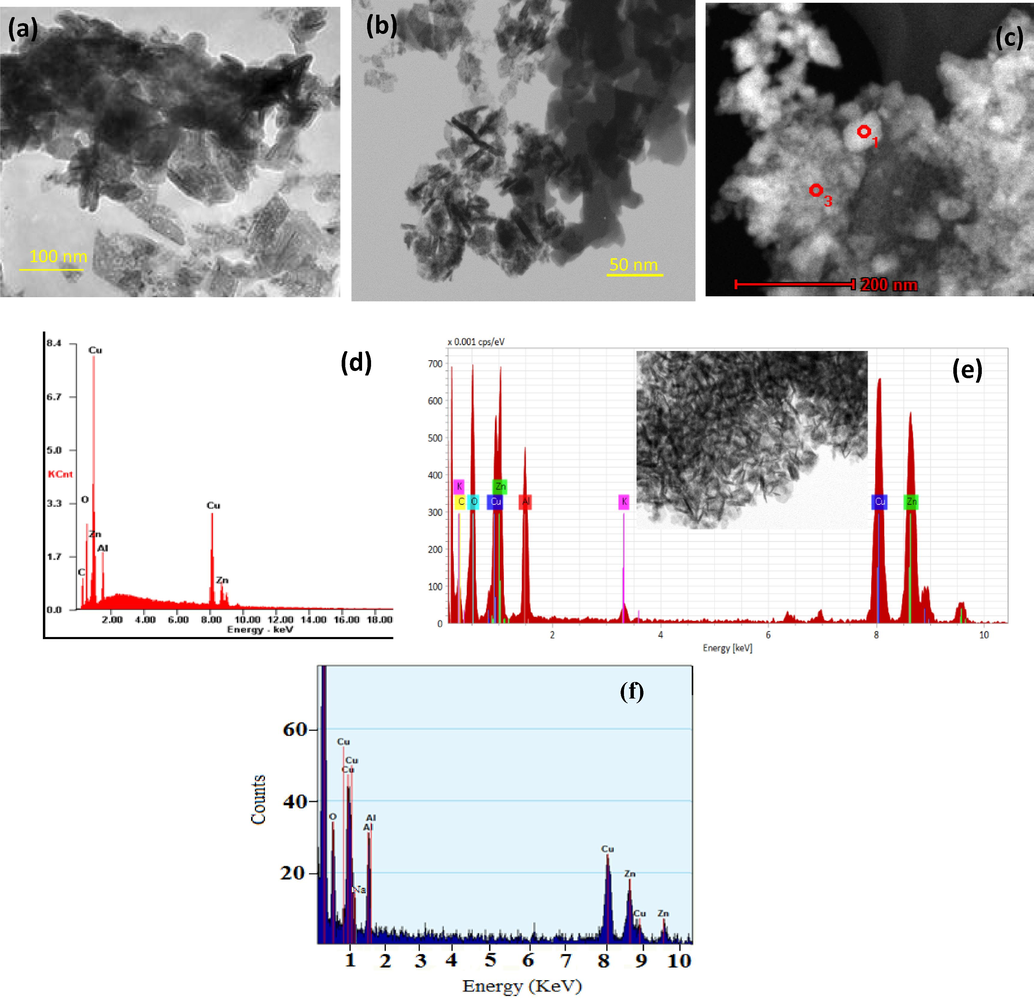
HAADF-STEM-EDX analysis of spent CZA samples (a) CZA HAADF image and (d) CZA EDX; (b) CZA-K HAADF image and (e) CZA-K EDX; (c) CZA-Na HAADF image (f) CZA-Na EDX.
3.9 XPS studies
XPS analysis of spent CZA samples are presented as Fig. 10. XPS results of Cu 2P3/2 orbital was depicted in Fig. 10a. Two peaks were observed at 935.0 and 933.0 eV after deconvolution of Cu 2P3/2 orbital corresponds to Cu2+ oxidation state related to CuO crystals and Cu1+/Cu0 oxidation state was ascribed to Cu2O/metallic copper (Pasupulety et al., 2015a, 2015b) in studied samples. However, the extent of the copper species on the surface was varied with respect to precipitating agent used in synthesis of these catalysts. The decreasing order of surface Cu1+/Cu0 species as follows: CZA-K (0.42 atm.%) > CZA-Na (0.30 atm.%) > CZA (0.23 atm.%). Auger analysis of Zn was depicted in Fig. 10b. Principally Zn2+ species exhibited on the surface with minor portion of metallic zinc due to the partial reduction of ZnO at 987.4 and 991.0 eV respectively.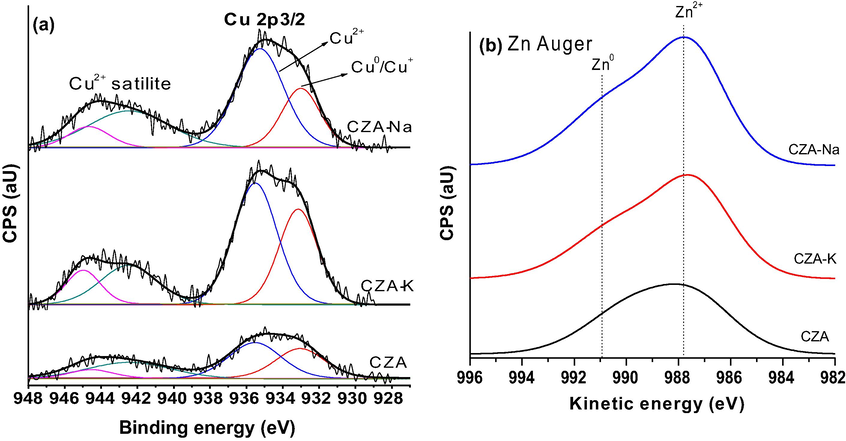
XPS and Auger analysis of spent CZA samples.
In addition, CO2 hydrogenation activity of CZA-K catalyst was compared to literature reports studied under similar conditions.
Table 2 shows the CO2 conversion and methanol selectivity results reported on CZA hydrotalcite and Cu-Zn-Zr synthesized by different preparation methods. It is clear that excellant catalytic activity results were obtained on the present CZA-K catalyst due to the presence of K in the framework of CZA.
Catalyst
Temp., °C/Pres., MPa
GHSV h−
% CO2 Conversion
%Methanol selectivity
Reference
CZA-K
240/3.0
2400
14.0
96.0
Present work
CuZnZr/CuBr
250/5.0
3000
10.0
97.0
Chen et al. (2020)
CuZnAl-111 HT
240/3.0
8800
13.0
52.0
Leone et al. (2019)
CuZnZr/TPABr
250/5.0
3000
11.0
93.0
Chen et al. (2019)
4 Conclusions
The greater CO2 hydrogenation activity of CZA-K catalyst was attributed to its superior surface Cu1+/Cu0 content obtained through K2CO3/KOH precipitation. Further, K—O—(CO)—O surface species formation limited the CO2 dissociation to form CO to some extent. Steady CO2 hydrogenation activity was observed for 100 h of continuous operation on CZA-K catalyst under studied reaction conditions. Hence, it is a promising catalyst candidate and has the potential to be employed in the bulk methanol production using CO2 and H2.
Acknowledgements
This project was funded by the Deanship of Scientific Research (DSR) at King Abdulaziz University, Jeddah, under grant no. (G-150-135-1441). The authors, therefore, acknowledge with thanks DSR for technical and financial support.
Declaration of Competing Interest
The authors declare that they have no known competing financial interests or personal relationships that could have appeared to influence the work reported in this paper.
References
- Investigation on deactivation of Cu/ZnO/Al2O3 catalyst for CO2 hydrogenation to methanol. Ind. Eng. Chem. Res.. 2019;58:9030-9037.
- [CrossRef] [Google Scholar]
- The catalytic methanol synthesis over nanoparticle metal oxide catalysts. J. Mol. Catal. A. Chem.. 2003;194:227-236.
- [Google Scholar]
- Effect of vapor-phase-treatment to CuZnZr catalyst on the reaction behaviors in CO2 hydrogenation into methanol. ChemCatChem. 2019;11:1448-1457.
- [CrossRef] [Google Scholar]
- Induced high selectivity methanol formation during CO2 hydrogenation over a CuBr 2-modified CuZnZr catalyst. J. Catal.. 2020;389:47-59.
- [Google Scholar]
- Direct synthesis of formic acid via CO2 hydrogenation over Cu/ZnO/Al2O3 catalyst. J. Clean. Prod.. 2018;172:1957-1977.
- [Google Scholar]
- The role of ZnO in Cu/ZnO methanol synthesis catalysts-morphology effect or active site model? Appl. Catal. A. Gen.. 2001;208:163-167.
- [Google Scholar]
- Catalytic hydrogenation of CO2 to methanol: Study of synergistic effect on adsorption properties of CO2 and H2 in CuO/ZnO/ZrO2 system. Catalysts. 2015;5:1846-1861.
- [Google Scholar]
- Hydrogenation of CO2 to methanol at atmospheric pressure over Cu/ZnO catalysts: Influence of the calcination, reduction, and metal loading. Ind. Eng. Chem. Res.. 2017;56:1979-1987.
- [CrossRef] [Google Scholar]
- Hydrogenation of carbon dioxide performed over CuO/ZnO/Al2O3 catalysts. Bull. Chem. Reac. Eng. Catal.. 2019;14(3):604-613.
- [CrossRef] [Google Scholar]
- CO2 recycling to dimethyl ether: State-of-the-art and perspectives. Molecules. 2018;23:1-28.
- [Google Scholar]
- Preparation and activity of Cu/Zn/Al/Zr catalysts via hydrotalcite-containing precursors for methanol synthesis from CO2 hydrogenation. Catal. Sci. Technol.. 2012;2:1447-1454.
- [Google Scholar]
- Cu/Zn/Al/Zr catalysts via phase-pure hydrotalcite-like compounds for methanol synthesis from carbon dioxide. J. CO2 Util.. 2015;11:41-48.
- [Google Scholar]
- Handbook of Heterogeneous Catalysis. Weinheim, Germany: Wiley-VCH Verlag GmbH & Co KGaA; 2008.
- Residual sodium effect on the catalytic activity of Cu/ZnO/Al2O3 in methanol synthesis from CO2 hydrogenation. Appl. Catal.. 1998;174:231-238.
- [Google Scholar]
- An in-situ IR study on the adsorption of CO2 and H2O on hydrotalcites. J. CO₂ Util.. 2018;24:228-239.
- [Google Scholar]
- Copper- and silver-zirconia aerogels: preparation, structural properties and catalytic behavior in methanol synthesis from carbon dioxide. J. Catal.. 1998;179:515-527.
- [Google Scholar]
- Tailoring of hydrotalcite-derived Cu-based catalysts for CO2 hydrogenation to methanol. Catalysts. 2019;9:1058.
- [Google Scholar]
- Studies on Au/Cu-Zn-Al catalyst for methanol synthesis from CO2. Appl. Catal. A. Gen.. 2015;504:308-318.
- [Google Scholar]
- Influence of preparation method on the catalytic activity of Au/Cu-Zn-Al catalysts for CO2 hydrogenation to methanol. Comptes Rendus de L'Academie Bulgare des Sciences. 2015;68(12):1511-1518.
- [Google Scholar]
- Methanol production via CO2 hydrogenation: Sensitivity analysis and simulation-based optimization. Front. Energy. Res.. 2019;7:81.
- [CrossRef] [Google Scholar]
- The effect of ageing time on co-precipitated Cu/ZnO/ZrO2 catalysts used in methanol synthesis from CO2 and H2. Top. Catal.. 2007;45:57-60.
- [CrossRef] [Google Scholar]
- Hydrogenation of CO2 to value-added products-A review and potential future developments. J. CO2 Util.. 2014;5:66-81.
- [Google Scholar]
- Carbon monoxide hydrogenation on potassium promoted Mo2N catalysts. Appl. Catal. A. Gen.. 2017;532:133-145.
- [CrossRef] [Google Scholar]
- Highly efficient Cu-based catalysts via hydrotalcite-like precursors for CO2 hydrogenation to methanol. Catal. Today.. 2017;281:327-336.
- [Google Scholar]
- Reporting physisorption data for gas/solid systems with special reference to the determination of surface area and porosity. Pure. Appl. Chem.. 1985;57:603-619.
- [Google Scholar]
- Strong evidence of the role of H2O in affecting methanol selectivity from CO2 hydrogenation over Cu-ZnO-ZrO2. Chem. 2020;6:419-430.
- [Google Scholar]
- A highly selective and stable ZnO-ZrO2 solid solution catalyst for CO2 hydrogenation to methanol. Sci. Adv.. 2017;3(10):e1701290.
- [Google Scholar]
- Recent advances in carbon dioxide hydrogenation to methanol via heterogeneous catalysis. Chem. Rev.. 2020;120:7984-8034.
- [CrossRef] [Google Scholar]
Appendix A
Supplementary material
Supplementary data to this article can be found online at https://doi.org/10.1016/j.arabjc.2020.102951.
Appendix A
Supplementary material
The following are the Supplementary data to this article:


