

Translate this page into:
An evaluation strategy of high-quality traditional Chinese patent medicines with consistency as the core: A case study of Huoxiang Zhengqi Shui
* Corresponding authors: E-mail addresses: xiaodikou2013@163.com (X.D. Kou), aliu@icmm.ac.cn (A. Liu), yliu1980@icmm.ac.cn (Y. Liu).
-
Received: ,
Accepted: ,
Abstract
To promote the development of high-quality Chinese patent medicine (CPM), we previously proposed a quality consistency evaluation (QCE) strategy based on intra- and inter-batch differences. In this study, Ultra-high performance liquid chromatography coupled with triple quadrupole mass spectrometry and gas chromatography coupled with triple quadrupole mass spectrometry (UPLC/GC-QQQ-MS) were separately developed and applied to determine non-volatile and volatile index components’ contents, representing the quality attributes of different raw medicines from Huoxiang Zhengqi Shui (HXZQS). Furthermore, the LPS-induced RAW264.7 cell model was applied to evaluate NO inhibitory activity, which ranged from 24.52% to 76.95%. Then the QCE strategy was applied to distinguish between superior and inferior levels from different manufacturer′s products based on the consistency of chemical contents and bioactivity. The results showed that intra-batch consistency (11.96% ‒ 47.93%) was better than inter-batch consistency (8.53% ‒ 131.25%), and inter-batch difference was the key factor affecting the quality consistency. The correlation coefficient (0.516) of chemical contents and NO inhibition rate suggested that their consistency basically followed a similar trend. The results were further graded by PCA analysis, where M7, M15, M6, M16, M3, and M5 were the best six manufacturers, and M7 had the highest content. Whereas M12 and M13 had the worst consistency and the lowest content. This study aimed to guide manufacturers to focus on process design and quality control, which not only improves the quality and safety of CPM but also promotes innovation and development of the pharmaceutical industry.
Keywords
Consistency of chemical contents
Consistency of NO inhibitory activity
Huoxiang Zhengqi Shui
Quality consistency evaluation

1. Introduction
Chinese patent medicine (CPM) is a kind of traditional Chinese medicine (TCM) product that is made from Chinese medicinal materials and processed into certain dosage forms according to the prescribed prescription and preparation technology. CPM is a class of commercial Chinese medicine preparations, which are approved by the National Medical Products Administration. There are 3088 kinds of drugs in the medical insurance drug catalog (2023), with CPM accounting for 45%, which showed that CPM is widely used in clinical treatment. CPM is safe, effective, and convent, and can well meet the needs of modern treatment. In 2023, the data of China’s urban physical pharmacy terminals showed that 220 CPMs sold more than 100 million RMB, of which seven varieties sold more than one billion RMB, indicating that people would independently choose CPM to deal with diseases in their daily lives. However, CPM is produced by multiple manufacturers, and the quality and price of products from different manufacturers vary greatly [1]. As a result, CPMs with high quality and favorable prices find it difficult to stand out in the market.
In China, centralized bidding and procurement of drugs is the policy that affects the pharmaceutical industry most at present. ‘‘Quality first’’ is the first principle to ensure clinical drug demand, effectively reduce the burden of patients, and ensure drug quality and supply. In terms of quality evaluation, the “consistency evaluation” similar to chemical drugs has not been carried out for CPM. Therefore, a comprehensive scoring method was adopted in the centralized bidding and procurement of drugs, including price, recognition by medical institutions, innovation ability, quality of medicinal materials, supply security, and other factors to ensure fairness and reasonableness [2]. Although this way avoids the simple model of “the lowest price wins” and improves the quality standard of adopted CPM to a certain extent, it still cannot ensure the selection of high-quality and favorable-price drugs. Therefore, quality evaluation is undoubtedly the key to solving the dilemma of centralized bidding and procurement of CPM. However, compared with chemical drugs, the quality evaluation system is relatively complicated, and there is no recognized quality evaluation standard for CPM.
Although good consistency is not equal to superior quality, the premise of superior quality must be good consistency. Based on this, our team put forward the evaluation standard system of high-quality CPM with consistency as the core [1], and applied it to the quality consistency evaluation (QCE) of compound Danshen tablets, Liuwei Dihuang pills, Yangyin Qingfei pills, Babao Dan capsule, etc. [3-6]. At present, the QCE methods of CPM mainly rely on the quality standards of Chinese Pharmacopeia to develop a series of methods to evaluate product quality differences in appearance traits, chemical constituents, bioequivalence, and other aspects. In our previous work, the quality consistency of the three CPMs from different manufacturers was evaluated by the parameters of intra-batch content difference, inter-batch content difference, fingerprint similarity, and dissolution rate. As we all know, chemical consistency is not the same as efficacy consistency. Therefore, it is more convincing to jointly evaluate the quality consistency of CPM from the two dimensions of chemical composition and biological activity.
In this paper, we took Huoxiang Zhengqi Shui (HXZQS) as an example to evaluate the quality consistency of CPM based on quality attribute indicators and biological activity and distinguish between superior and inferior levels from different manufacturers’ products. UPLC-QQQ-MS and GC-QQQ-MS analytical methods were separately developed and applied to determine the content of non-volatile and volatile index components, which represent the quality attribute of different raw medicines from HXZQS. In addition, the lipopolysaccharide (LPS)-induced RAW264.7 cell model was applied to evaluate the NO inhibitory activity of HXZQS. The QCE strategy was used to evaluate the quality consistency of different HXZQS products based on chemical composition and biological activity. This study can be a reference for rational drug use for doctors and patients and provide data support for centralized bidding and procurement of drugs. Quality comes from design, not evaluation. We also hope that QCE can guide manufacturers to pay attention to process design and quality control in the product development stage, which not only improves the quality and safety of TCM but also promotes innovation and development of the pharmaceutical industry.
2. Materials and Methods
2.1. Reagents and chemicals
20 reference standards were purchased from Jiangxi Baicaoyuan Biotechnology Co. ltd. Hundred batches of HXZQS of 20 manufacturers were purchased from different pharmacies in Beijing, China, and the batch numbers have been listed in Table S1 (for supplementary materials refer Tables S1-S13 and Figures S1-S8). Ethanol and water for diluting the samples were purchased from Tianjin Fuyu Fine Chemical Co., Ltd. and Hangzhou Wahaha Group Co., Ltd., respectively. LC-MS grade reagents (methanol and formic acid) were obtained from Fisher Scientific (Pittsburgh, PA, USA). Ultrapure water used for LC-MS analysis was provided by Guangzhou Watson’s Food & Beverage Co., Ltd. HPLC grade ethyl acetate was purchased from Shanghai CINC High Purity Solvent Co., Ltd. Dulbecco’s modified eagle medium (DMEM), fetal bovine serum (FBS), trypsin, penicillin-streptomycin solution (PS), and phosphate-buffered saline (PBS) were obtained from Gibco® (Life Technologies Inc., Grand Island, NY, USA). LPS, and Griess reagent were provided by Sigma (Shanghai Sigma-Aldrich Trading Co., Ltd.). The Cell Counting Kit-8 was purchased from Dojindo (Dojindo Laboratories, Japan).
2.2. Preparation of standard and sample solutions
An appropriate weight of standards for LC-MS analysis was dissolved into 5 mL brown volumetric bottles using methanol and prepared into a 1 mg/mL stock solution. According to preliminary experiment results, the above solutions were taken and prepared into the proper concentration of the mixed standard stock solution, which was subsequently diluted into a series of concentrations of calibration standard solutions. The sample solutions for LC-MS analysis were obtained using 50% ethanol to dilute HXZQS one hundred times.
The standard stock liquids for GC-MS analysis were prepared by dissolution of anhydrous ethanol for 4, 6, 19, and 20 and dimethyl sulfoxide for 18. They were prepared as a mixed standard solution before use and subsequently diluted into a series of concentrations of calibration standard solutions. The sample solutions for GC-MS analysis were obtained using ethyl acetate to dilute HXZQS one hundred times.
2.3. UPLC-QQQ-MS/MS and GC-QQQ-MS/MS conditions
The UPLC-QQQ-MS/MS system was equipped with a 1200 infinity series liquid chromatography (LC) system and a 6460 triple-quadrupole tandem mass spectrometer equipped with electrospray ionization (ESI) source. The chromatographic separation was accomplished via Waters ACQUITY UPLC® BEH C18 column (1.7 μm, 100 mm × 2.1 mm). The mobile phase was water containing 0.1% formic acid (A) and methanol (B). The gradient elution program was as follows: 0‒4 min, 1% B; 4‒4.1 min, 1%‒25% B; 4.1‒10 min, 25%‒55% B; 10‒12 min, 55%‒80% B; 12‒12.1 min, 80%‒95% B; 12.1‒16 min, 95% B. The flow rate was 0.3 mL/min. The column temperature was 35°C. Multiple reaction monitoring (MRM) mode was used to optimize the precursor ion (Q1), product ion (Q3), collision energy (CE) of 15 standards. The MS parameters were as follow: Gas temperature: 300°C; drying gas flow rate: 8 L/min; nebulizer gas pressure: 45 psi; sheath gas temperature: 250°C; and sheath gas flow: 11 L/min.
GC-QQQ-MS/MS system was equipped with a Trace 1600 gas chromatograph and a 9610 triple-quadrupole mass spectrometer equipped with electron impact ion (EI) source. Separation of volatile constituents was achieved by a 30-m capillary column with 0.250-mm diameter. Carrier gas was helium supplied at a constant flow rate of 1.2 mL/min. The GC oven program was a thermal gradient as follows: maintained at 60°C for 1 min, rising from 60°C to 115°C at the rate of 5°C/min, followed by a 0.8°C/min ramp to 120°C, rising to 200°C at the rate of 5°C/min, subsequently reached to 240°C at 38.85 min, and maintaining for 3 min. The MS parameters were as follow: MS Transfer Line Temperature: 250°C; Ion Source Temperature: 250°C; Acquisition Threshold: 1000; Scan Type: Timed Srm Scan.
2.4. UPLC-QQQ-MS/MS and GC-QQQ-MS/MS method validation
The specificity, linearity, lower limit of detection (LLOD), lower limit of quantification (LLOQ), precision, repeatability, stability, and recovery of the above analysis method were validated. Specificity refers to the ability of the analytical method to accurately and selectively identify the analyte in the presence of other ingredients or impurities. Linearity means the degree of proportional relationship for response value and concentration of the analyte. LLOD and LLOQ were determined by a signal-to-noise ratio (S/N) of approximately 3 and 10, respectively. The mixed standard solutions in the middle concentration were analyzed repetitively three times a day for three consecutive days, to evaluate intra-day precision and inter-day precision. Six test solutions from the same batch sample were prepared and analyzed for verified repeatability. A test sample solution was prepared and injected for analysis at 1, 2, 4, 6, 8, 12 hrs, to check the stability of the samples. The high, medium, and low concentrations of mixed standard solutions were added to known content of samples, whose concentrations were calculated using the standard curve. The recovery was calculated by the measured and the actual added amounts.
2.5. Cell culture and analysis of NO inhibitory activity
RAW264.7 cells were cultured in the 10% Dulbecco’s Modified Eagle Medium (DMEM) media at 37°C and 5% CO2. When the cell confluence reached 90%, they were scraped off and seeded into a 96-well plate at the cell density of 3×10⁵ cells/mL, with 100 µL per well. The samples from three manufacturers (M1, M4, and M10) were used to screen the non-toxic concentration of HXZQS. After incubation for 24 hrs, 50 µL of LPS (µg/mL) and 50 µL of drug (the concentrations of HXZQS: 50 µL/mL, 20 µL/mL, 10 µL/mL, 5 µL/mL, 1 µL/mL, 0.5 µL/mL and 0.1 µL/mL) were added to cells. After culturing for another 24 hrs, 100 µL of supernatant was transferred to a new 96-well plate and mixed with 100 µL of Griess reagent. After allowing reaction for 15 mins, the optical density (OD) at 540 nm was measured. 10 µL of CCK8 was added to the remaining 100 µL of cell culture and the OD at 450 nm was measured after 2 hrs. The NO inhibition rate and cell survival rate were calculated according to the following formula. A cell survival rate of more than 90% was considered non-cytotoxic. All samples from 20 manufacturers were tested for the NO inhibition rate at non-toxic concentrations.
NO inhibition rate = (1 ‒ (OD of drug treated cell ‒ OD of untreated cell)/ (OD of LPS treated cell ‒ OD of untreated cell)) × 100% cell survival rate = (OD of drug treated cell ‒ OD of the medium without inoculated cells)/ (OD of LPS treated cell ‒ OD of the medium without inoculated cells) × 100%
2.6. QCE strategy
The quality evaluation of TCM is a complicated process, which involves the consideration of many quality markers. Thanks to the development of analytical techniques, simultaneous determination of multiple components is widely used in various fields. Multicomponent determination is also the core technology of the QCE strategy. In order to simplify the consistency evaluation process, the evaluation results of multicomponent were calculated by homogenization of different components according to Eq. (1) to explain the equal importance of raw medicines in prescription [6].
where PA/B means multicomponent consistency difference; Pi means single component consistency difference; and n is the number of index components measured. In this study, PA and PB represented intra-batch difference and inter-batch consistency difference, respectively.
The Pi values were calculated by the relative range method. The intra-batch consistency difference was calculated by three samples in each batch and was finally presented as the average of all intra-batch consistency. The inter-batch consistency difference was calculated by the average content of every batch, where the average content of each batch represented an inter-batch sample.
Where X means the actual measured result; Xmax and Xmin means the maximum and minimum measured results, respectively. ¯X means the average measured result (Eq. 2).
2.7. QCE statistical analysis
Principal component analysis (PCA) was applied to statistically analyze PA and PB by origin 2022 and statistical IBM SPSS Statistics.
3. Results and Discussion
3.1. Quantitative analysis of 20 constituents by UPLC-QQQ-MS/MS and GC-QQQ-MS/MS
3.1.1. Screening and detection of 20 quality attribute indicators
The prescription composition of HXZQS and the source of 20 quality attribute indicators were shown in Figure 1, and their structures are illustrated in Figure S5. HXZQS consist of Citri Reticulatae Pericarpium, Atractylodis Rhizoma, Radix Glycyrrhizae, Pinellia Rhizoma, Poria, Angelicae Dahuricae Radix, Magnolia Officinalis Cortex, Arecae Pericarpium, Perilla Leaf Oil and Patchouli Oil. To comprehensively analyze the quality of HXZQS, its representative quality attribute indicators were selected for each raw medicinal material according to qualitative analysis results (Figure S3, Figure S4, and Table S2-1 – Table S2-10) by UPLC-Orbitrap-MS/MS and GC-EI-MS, quality control constituents in Chinese pharmacopeia [7] and related references. The quality control constituents of Chinese pharmacopeia were hesperidin (1) for Citri Reticulatae Pericarpium, atractylodin (4) for Atractylodis Rhizoma, glycyrrhizic acid (7) and liquiritin for Radix Glycyrrhizae, imperatorin (12) for Angelicae Dahuricae Radix, honokiol (14) and magnolol (15) for Magnolia Officinalis Cortex, perillaldehyde (19) and perillene for Perilla Leaf Oil, and patchouli alcohol (20) for Patchouli Oil, where hesperidin, magnolol, and honokiol were the quality markers of HXZQS [7]. Except for perillaldehyde and perillene, other components were qualitatively detected in HXZQS. Medicinal materials Citri Reticulatae Pericarpium, Atractylodis Rhizoma, Angelicae Dahuricae Radix, and Magnolia Officinalis Cortex were impregnated with 60% ethanol for 24 hrs and then percolated to give a 400 mL or 500 mL initial percolation. The remaining percolation was concentrated and incorporated into the initial percolate for standby. Therefore, complementary quality markers, narirutin (2) and nobiletin (3) for Citri Reticulatae Pericarpium [8-10], atractylenolide III (5) and β-Eudesmol (6) for Atractylodis Rhizoma [11], and isoimperatorin (13) for Angelicae Dahuricae Radix [12], were assigned to the polarity of the extraction solvent. Among them, only atractylenolide III was not found in qualitative results. However, medicinal materials Radix Glycyrrhizae, Pinellia Rhizoma, Poria, and Arecae Pericarpium were boiled or decocted in water to give their extracting solutions, where water-soluble ingredients were more likely to appear. At first we selected glycyrrhizic acid, liquiritin and liquiritigenin (8) as quality markers of Radix Glycyrrhizae [13], on the basis of the qualitative analysis results (Table S2-3). But the chromatographic peak of liquiritin was interfered with by other substances, so it was not considered in the final analysis method. Medicinal materials Pinellia Rhizoma, Poria, and Arecae Pericarpium had no characteristic quantitative constituents in Chinese pharmacopeia. In the preliminary experiment, pachymaric acid, poricoic acid A, poricoic acid B, 16α-hydroxydehydrotrametenolic acid were used as indicator constituents to evaluate the quality of Poria [14]. However, these compounds were not detected in the twenty manufacturers. Fortunately, adenosine (9), guanosine (10) and uridine (11) were qualitatively detected (Table S2-4). Therefore, the three constituents, shared main constituents of Pinellia Rhizoma and Poria, served as indicative constituennts of the two medicinal materials [15]. Arecoline, arecaine (16), guvacoline and guvacine (17) were the characteristic alkaloid constituents of Arecae Semen, however, there were no arecoline and guvacoline in most of Arecae Pericarpium [16]. Consequently, arecaine and guvacine were used as quality markers of Arecae Pericarpium. In Chinese pharmacopeia, the quantitative constituents of Perilla Leaf Oil were perillylene and perillaldehyde (19), and that of Patchouli Oil was patchouli alcohol (20) [7]. Previous studies have shown that Perillaketone (18) was also the main constituents of Perilla leaves, and thus it should be the quantitative index [17]. Finally, the above 20 constituents were determined as the quality attribute indicators of HXZQS. An UPLC-QQQ-MS/MS method was applied to analysis of non-volatile constituents, whose response values were investigated after the samples were diluted with different proportions of aqueous ethanol. The response values were the highest in the sample diluted with 50% aqueous ethanol (Figure S7). The volatile constituennts from Atractylodis Rhizoma, Perilla Leaf Oil, and Patchouli alcohol were detected by a GC-QQQ-MS/MS method. The samples were diluted for GC-MS analysis with petroleum ether, ethyl acetate, and mixed solutions, respectively. Obviously, the maximum peak area was obtained by diluting the sample with ethyl acetate (Figure S8). Thus, the methods of sample dilution and analysis were established.
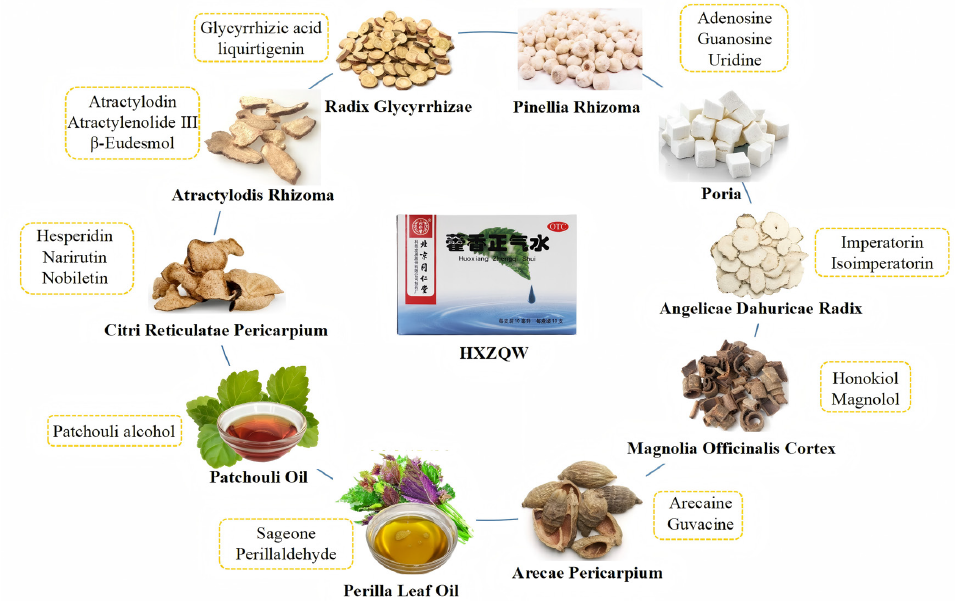
- The prescription composition of HXZQS and the source of 20 quality attribute indicators. HXZQW: Huoxiang Zhengqi Shui.
3.1.2. Method validation of UPLC-QQQ-MS/MS and GC-QQQ-MS/MS
MRM parameters of 20 quality attribute indicators were listed in Table 1. MRM chromatograms of blank solvent, samples, and mixed standards were shown in Figure S6, where no obvious interference peaks appeared near the retention times of 20 analytes. The calibration curves equation, correlation coefficients (R2), LLOQ, and LLOD of 20 compounds have been shown in Table 2. The values of R2 over 0.9991 showed that all calibration curves had good linearity. The data on precisions, stability, repeatability, and recovery have been listed in Table S3. The within-day precision and intraday precision were less than 4.9%, except for that of perillaldehyde. Only atractylodin had an RSD% of stability of more than 5%, but other constituents were stable within 24 hrs, with the value of their RSD% lower than 4.72%. RSD% of repeatability was in the range of 1.97% and 5.05%. The recovery of most constituents was between 95% and 105%. However, the recovery of atractylodin at three concentrations ranged from 84% to 88% and that of Perillaketone at the low concentration was 110.53%. The UPLC-QQQ-MS/MS and GC-QQQ-MS/MS quantitative analysis methods were sensitive, accurate, and reliable, and they could be applied to quantitative analysis of HXZQS.
| No. | Compounds | Rt (min) | Precursor ion species | Precursor ion | Product ion | Fragmentor (eV) | Collision energy (eV) |
|---|---|---|---|---|---|---|---|
| 1 | Hesperidin | 6.69 | [M – H]+ | 611.2 | 302.8 | 116 | 18 |
| 2 | Narirutin | 6.52 | [M – H]+ | 581.2 | 272.8 | 116 | 18 |
| 3 | Nobiletin | 10.41 | [M – H]+ | 403.1 | 387.8 | 160 | 22 |
| 4 | Atractylodin | 30.91 | [M]+ | 182.0 | 152.0 | 8 | |
| 5 | Atractylenolide III | 11.40 | [M – H]+ | 249.1 | 162.9 | 116 | 14 |
| 6 | β-Eudesmol | 28.02 | [M – C3H7OCH2]+ | 149.1 | 93.1 | 10 | |
| 7 | Glycyrrhizic acid | 9.54 | [M – H]+ | 823.4 | 453.3 | 220 | 24 |
| 8 | Liquiritigenin | 7.65 | [M – H]+ | 257.1 | 137.2 | 156 | 20 |
| 9 | Adenosine | 2.61 | [M – H]+ | 268.1 | 136.0 | 1 | 16 |
| 10 | Guanosine | 3.03 | [M – H]+ | 284.1 | 151.9 | 50 | 10 |
| 11 | Uridine | 1.744 | [M – H]+ | 245.1 | 112.9 | 58 | 4 |
| 12 | Imperatorin | 11.97 | [M – H]+ | 271.1 | 202.8 | 116 | 8 |
| 13 | Isoimperatorin | 12.60 | [M – H]+ | 271.1 | 146.9 | 66 | 34 |
| 14 | Honokiol | 12.32 | [M – H]– | 265.1 | 224.0 | 192 | 18 |
| 15 | Magnolol | 12.86 | [M – H]– | 265.1 | 247.0 | 160 | 18 |
| 16 | Arecaine | 0.96 | [M – H]+ | 142.1 | 53.1 | 128 | 26 |
| 17 | Guvacine | 0.95 | [M – H]+ | 128.1 | 53.2 | 58 | 26 |
| 18 | Perillaketone | 13.48 | [M – C3H7CO]+ | 95.0 | 39.1 | 8 | |
| 19 | Perillaldehyde | 14.41 | [M – CH3C=O]+ | 107.1 | 77.0 | 8 | |
| 20 | Patchouli alcohol | 28.42 | [M – C4H9C=O]+ | 138.1 | 110.1 | 10 |
MRM: Multiple reaction monitoring
| Compound | Linear equation | R2 | Range (ng/mL) | LLOD (ng/mL) | LLOQ (ng/mL) |
|---|---|---|---|---|---|
| 1 | y = 15.26x + 5558.5 | 0.9993 | 195.3-25000 | 32.5 | 97.6 |
| 2 | y = 20.307x – 128.51 | 0.9997 | 24.4-6250 | 8.1 | 24.4 |
| 3 | y = 1831.8x - 23551 | 0.9998 | 12.2-3125 | 4.1 | 12.2 |
| 4 | y = 527.98x-14104 | 0.9991 | 1.9-950 | 0.6 | 1.9 |
| 5 | y = 20.951x - 350.06 | 0.9995 | 39.1-1250 | 13.0 | 39.1 |
| 6 | y =177.34x – 1365.7 | 0.9991 | 39.1-10000 | 0.8 | 2.4 |
| 7 | y = 38.743x + 2759 | 0.9994 | 48.8-12500 | 16.3 | 48.8 |
| 8 | y = 12.085x - 32.275 | 0.9995 | 19.5-1250 | 6.5 | 19.5 |
| 9 | y = 569.72x + 2506.2 | 0.9993 | 4.9-625 | 1.6 | 4.9 |
| 10 | y = 263.46x – 2654.8 | 0.9991 | 4.9-1250 | 1.6 | 4.9 |
| 11 | y = 39.482x - 226.98 | 0.9996 | 19.5-1250 | 6.5 | 19.5 |
| 12 | y = 2059.3x + 39016 | 0.9995 | 6.1-3125 | 2.0 | 6.1 |
| 13 | y = 455.25x + 42568 | 0.9993 | 15.2-3906.2 | 5.1 | 15.2 |
| 14 | y = 0.7394x + 139.23 | 0.9991 | 390.6-25000 | 130.2 | 390.6 |
| 15 | y = 9.3874x + 793.19 | 0.9995 | 125-4000 | 8.1 | 24.4 |
| 16 | y = 1.6067x + 301.08 | 0.9979 | 156.2-5000 | 52.1 | 156.3 |
| 17 | y = 0.472x + 185.23 | 0.9999 | 312.5-10000 | 104.2 | 312.5 |
| 18 | y = 136.3x + 5962.4 | 0.9991 | 2.8-23200 | 0.9 | 2.8 |
| 19 | y = 549.04x - 4049.7 | 0.9994 | 2.6-5400 | 0.9 | 2.6 |
| 20 | y =307.42x + 9018.2 | 0.9992 | 19.2-10000 | 0.8 | 2.4 |
LLOD: Lower limit of detection, LLOQ: Lower limit of quantification.
3.1.3. Quantitative analysis of HXZQS
The above methods were used to analyze the content of 100 batches of samples from 20 manufacturers. The contents of 20 quality attributed indicators in 100 batches of samples have been shown in Table S7, and the manufacturer’s average contents which have been shown in Figure 2 and Table S6. The concentrations range of 20 constituents in 100 batches of HXZQS were 20.90 ‒ 1080.50 μg/mL for hesperidin, 3.28 ‒ 474.84 μg/mL for narirutin, 0 ‒ 237.76 μg/mL for nobiletin, 0 ‒ 53.06 μg/mL for atractylodin, 0 ‒ 41.37 μg/mL for atractylenolide III, 0 ‒ 1221.24 μg/mL for β-eudesmol, 0 ‒ 1019.08 μg/mL for glycyrrhizic acid, 0 ‒ 95.77 μg/mL for liquiritigenin, 0.65 ‒ 48.07 μg/mL for adenosine, 0.93 ‒ 43.65 μg/mL for guanosine, 2.47 ‒ 75.84 μg/mL for uridine, 0.51 ‒ 234.79 μg/mL for imperatorin, 0.00 ‒ 335.28 μg/mL for isoimperatorin, 76.12 ‒ 1515.04 μg/mL for honokiol, 19.05 ‒ 334.93 μg/mL for magnolol, 0 ‒ 268.15 μg/mL for arecaine, 0 ‒ 263.56 μg/mL for guvacine, 0 ‒ 875.37 μg/mL for Perillaketone, 0 ‒ 17.36 μg/mL for perillaldehyde, and 2.18 ‒ 215.16 μg/mL for patchouli alcohol. The content of the above constituents varied greatly in the manufacturers, and their RSD were 35.80%, 55.62%, 125.79%, 156.20%, 142.01%, 109.54%, 47.62%, 69.87%, 70.28%, 89.61%, 65.50%, 97.38%, 128.59%, 51.20%, 33.90%, 146.09%, 147.60%, 190.23%, 245.05% and 34.31%, respectively.
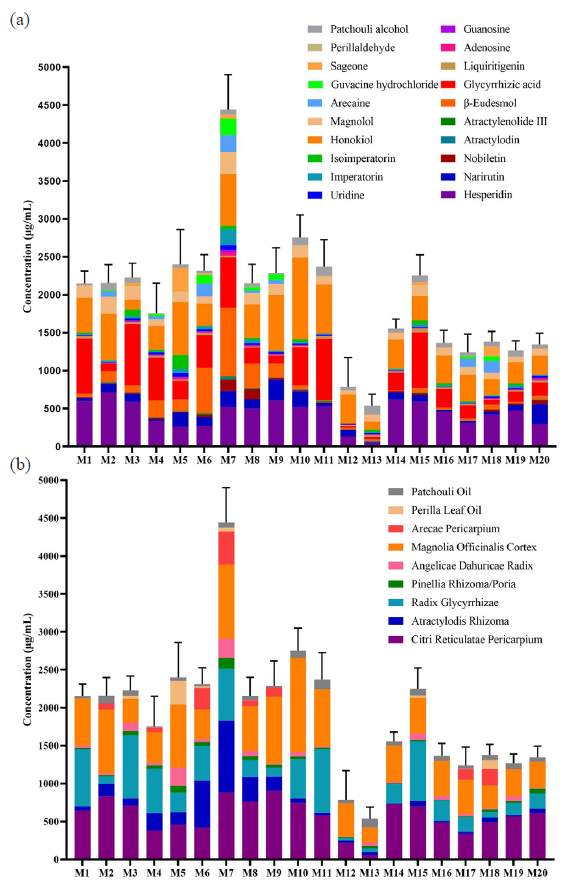
- The contents of HXZQS from 20 manufacturers. (a) the contents of 20 quality attribute indicators; (b) The contents of 10 medicinal materials. HXZQS: Huoxiang Zhengqi Shui.
The constituents that varied greatly in content came from medicinal materials Atractylodis Rhizoma, Arecae Pericarpium, and Perilla Leaf Oil. In all manufacturers, the high-concentration constituents found were hesperidin, glycyrrhizic acid, and honokiol. Correspondingly, the Chinese medicinal materials with the top content were Citri Reticulatae Pericarpium, Radix Glycyrrhizae, and Magnolia Officinalis Cortex, whose contents accounted for 50% to 90% of the total contents. Other herbs could be quantitatively detected in the 20 manufacturers′ samples, except for Arecae Pericarpium, which could be quantitatively analyzed only in eight manufacturers’ products, such as M2, M4, M6, M7, M8, M9, M17, and M18. The manufacturers’ total content varied greatly and ranged from 538.09 to 4440.60 μg/mL, among which the content of M7 was 2-8 times that of other manufacturers. The contents of M12 and M13 were found to be low, i.e. only 787 μg/mL and 538 μg/mL respectively. The contents of the other manufacturers were at the range of 1200 and 2700 μg/mL. The hesperidin content in HXZQS was specified to be no less than 180 μg/mL in Chinese pharmacopeia. HXZQS samples were obtained by the same sample preparation method as the Chinese pharmacopeia, and the concentrations of hesperidin in M12 and M13 were found to be only 133.27 and 47.37 μg/mL, suggesting that the quality of the two manufacturers was not up to standard.
According to the daily dosage of 10 mL/tube twice a day, the above data was converted into daily dosage, as shown in Table 3. Daily usage of HXZQS ranged from 10.76 mg/day to 88.81 mg/day, where the dosage of the high-concentration product was eight times as much as that of the low-concentration product. Hesperidin is a designated test indicator in the Chinese Pharmacopeia, requiring a concentration greater than 0.18 mg/mL, which means a daily concentration greater than 3.6 mg/day. Daily usage of hesperidin in 20 manufacturers’ HXZQS was between 0.95 mg/day and 14.36 mg/day, among which the dosage of M12 and M13 was not adequate. The above results show that the quality of HXZQS from most manufacturers on the market conformed to the Chinese pharmacopeia, but the content of constituents varied greatly. Interestingly, although M13 had a total content of only 538 μg/mL, its volatile component content was as high as 155 μg/mL (Table S5), especially the content of patchouli alcohol up to 116 μg/mL (Table S6-2). In all manufacturers, the patchouli alcohol’ content of M13 came in second. Therefore, the dosage of patchouli oil was qualified. As we all know, the sovereign medicine of HXZQS is patchouli oil. It is possible that the manufacturer M13 ensured the effect of HXZQS by ensuring the dosage of patchouli oil. As mentioned in section 3.3 below, M12 and M13 had the lowest total content, but their activity was not the worst. To sum up, quantitative index constituents of HXZQS in Chinese pharmacopeia should be improved and consider incorporating ingredients of patchouli oil.
| Manufacture |
Hesperidin daily use (mg) |
Total amount daily use (mg) | Manufacture |
Hesperidin daily use (mg) |
Total amount daily use (mg) |
|---|---|---|---|---|---|
| M1 | 11.95 | 43.06 | M11 | 10.56 | 47.43 |
| M2 | 14.36 | 43.17 | M12 | 2.67 | 15.74 |
| M3 | 11.80 | 44.60 | M13 | 0.95 | 10.76 |
| M4 | 6.74 | 35.09 | M14 | 12.40 | 31.12 |
| M5 | 5.24 | 48.02 | M15 | 11.78 | 45.03 |
| M6 | 5.46 | 46.29 | M16 | 9.26 | 27.35 |
| M7 | 7.81 | 88.81 | M17 | 6.22 | 24.81 |
| M8 | 9.96 | 43.11 | M18 | 8.46 | 27.58 |
| M9 | 12.14 | 45.75 | M19 | 9.50 | 25.34 |
| M10 | 10.39 | 55.07 | M20 | 5.87 | 26.97 |
3.1.4. The Effect of different packaging on volatile components′ content
HXZQS uses alcohol as a solvent to promote the dissolution of volatile and fat-soluble components into the liquid, to play a better therapeutic effect. Volatile components are sensitive to environmental factors such as temperature, light, and oxygen. Therefore, the choice of packaging materials is very important to maintain the stability and efficacy of volatile oil in HXZQS. The ideal packaging material should have good sealing, light resistance, and air isolation performance to reduce the oxidation and degradation of volatile components. Therefore, based on our quantitative analysis data, we discussed the effect of different packaging on volatile components’ content to provide data support for the packaging selection of HXZQS.
Three packaging types for the 20 manufacturers were collected, containing polyvinyl fluoride-low density ethylene medicinal composite hard sheet (packaging 1), low-density ethylene plastic bottle (packaging 2), and sodium-calcium glass tube oral liquid bottle (packaging 3). We calculated the content of six volatile components (compound 4, 5, 6, 18, 19, and 20) from Atractylodis Rhizoma, Perilla Leaf Oil, and Patchouli Oil, and analyzed the effects of different packaging materials on the content of volatile components in 18 qualified manufacturers (Table S5 and Figure 3). The four manufacturers of packaging 1 are M2, M4, M11, and M20, whose average content percentage was 10.39 ± 2.91%. Nine manufacturers (M1, M3, M5, M10, M14, M15, M16, M17, and M19) used packaging 2 with an average content percentage of 8.28 ± 5.15%. Manufacturers M6, M7, M8, M9, and M18 adopted packaging 3 and had an average content percentage of 19.67 ± 6.66%. The volatile component content percentage was packaging 3, packaging 1, and packaging 2 in order from largest to smallest, among which there is a significant difference (P < 0.01) between packaging 2 and packaging 3. The above result showed that packaging 3 seemed to provide the best protection against volatile ingredients, and it was recommended that manufacturers use packaging 3 for the production of HXZQS. In the following study, we should investigate the impact of packaging on volatile oil contents while ensuring the consistency of product processes and raw materials of HXZQS, to verify the above conclusions.
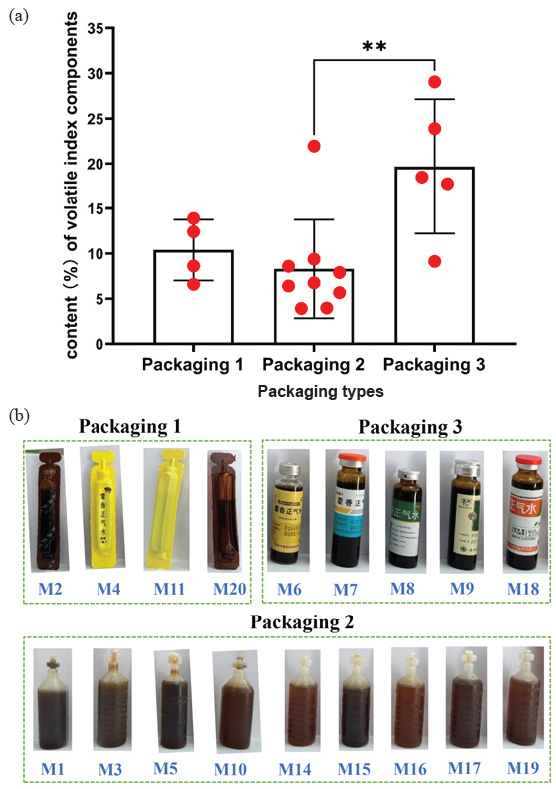
- (a) The volatile index components content (%) of the three packages and (b) the corresponding qualified manufacturer of each package. *p<0.05 and red dots indicate the average content percentage of volatile index components for each manufactures.
3.2. Consistency evaluation of chemical contents
According to QCE strategy as described in section 2.6, we have calculated the PA and PB of each medicinal material from 20 manufacturers (Table S8). However, Arecae Pericarpium was not taken into account because it was not detected in most manufacturers’ contents. The PA and PB (Table 4 and Figure 4) of the manufacturers’ HXZQS were calculated by the average of the PA and PB of the corresponding manufacturer′s medicinal materials. The PA of 20 manufacturers ranged from 11.96% to 37.53%, suggesting that the production process parameters of the manufacturers were stable and consistent. Among them, M4 and M12 were the manufacturers with the best and the worst intra-batch consistency, respectively. Thanks to the standardization and automation of pharmaceutical equipment, the intra-batch variation of the product was controlled to a small extent. According to the data in Table S7, the quality of Perilla Leaf Oil was the key factor that affected intra-batch consistency, which might be because the volatilization of Perilla Leaf Oil in the production process led to the instability of quality.
| Manufacture | Chemical contents | NO inhibitory rates | ||||
|---|---|---|---|---|---|---|
| PA | PB | Paverage | PA | PB | Paverage | |
| M1 | 21.02 | 81.19 | 51.11 | 15.79 | 11.53 | 13.66 |
| M2 | 25.63 | 101.88 | 63.76 | 16.94 | 70.92 | 43.93 |
| M3 | 23.48 | 62.33 | 42.91 | 8.52 | 17.90 | 13.21 |
| M4 | 11.96 | 77.33 | 44.65 | 12.68 | 25.95 | 19.32 |
| M5 | 26.49 | 67.45 | 46.97 | 10.22 | 8.53 | 9.38 |
| M6 | 12.77 | 64.88 | 38.83 | 12.61 | 13.62 | 13.12 |
| M7 | 19.08 | 47.00 | 33.04 | 9.43 | 19.29 | 14.36 |
| M8 | 17.72 | 66.63 | 42.18 | 14.50 | 29.30 | 21.90 |
| M9 | 14.43 | 131.25 | 72.84 | 21.51 | 34.69 | 28.10 |
| M10 | 14.64 | 54.80 | 34.72 | 13.30 | 38.91 | 26.11 |
| M11 | 12.27 | 88.15 | 50.21 | 28.20 | 67.30 | 47.75 |
| M12 | 37.53 | 120.35 | 78.94 | 17.22 | 51.96 | 34.59 |
| M13 | 21.21 | 122.41 | 71.81 | 26.45 | 93.46 | 59.96 |
| M14 | 22.98 | 68.16 | 45.57 | 47.93 | 43.51 | 45.72 |
| M15 | 21.45 | 49.28 | 35.37 | 9.54 | 14.44 | 11.99 |
| M16 | 24.05 | 61.47 | 42.76 | 7.71 | 18.35 | 13.03 |
| M17 | 25.73 | 98.43 | 62.08 | 15.26 | 16.59 | 15.93 |
| M18 | 19.77 | 76.01 | 47.89 | 20.66 | 28.24 | 24.45 |
| M19 | 29.98 | 68.45 | 49.22 | 17.50 | 31.12 | 24.31 |
| M20 | 13.50 | 98.38 | 55.94 | 14.64 | 65.51 | 40.08 |
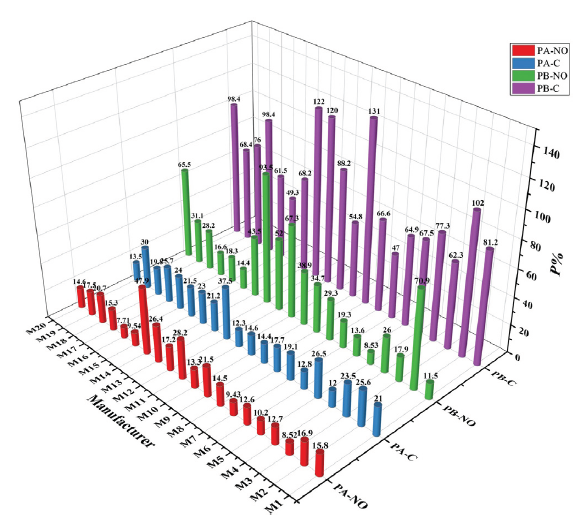
- The PA and PB results of chemical contents and NO inhibitory rate from 20 manufacturers.
The PB of 20 manufacturers ranged from 47% to 131.25%, indicating that the quality difference of inter-batch was the key factor affecting the quality consistency of CPM. M7 had the smallest quality difference between batches However, M9 had the worst inter-batch quality control. The PA of 20 manufacturers was smaller than the PB, which showed that the quality difference of medicinal materials from different batches affected the quality consistency from the source. The Chinese pharmacopeia only specified the low limit of the content of medicinal materials, which led to a phenomenon that the Chinese medicinal materials on the market were qualified, but their quality was inconsistent. As we all know, this was also an important factor restricting the internationalization of TCM. Therefore, the key to solving this problem was to guarantee quality consistency of TCM from the origin. Effective strategies included TCM planting standardization, processing standardization, and establishment of the content limit range [18]. Furthermore, the mode of mixed batch feeding was proposed to reduce inter-batch difference of CPM [18,19].
The above analysis of PA and PB by QCE strategy uncovered the key factors affecting the quality of CPM in the production process. Next, we comprehensively evaluated the consistency of chemical contents by the average of PA and PB, the values ranging from 33.04% to 78.94% (Table 4). Consistency was ranked from best to worst as follows: M7, M10, M15, M6, M8, M16, M3, M4, M14, M5, M18, M19, M11, M1, M20, M17, M2, M13, M9, and M12 (Figure S11). This ranking basically agreed with that based on PB, further confirming that the quality difference of inter-batch was the key factor affecting the quality consistency of CPM.
3.3. Evaluation of NO inhibitory activity
HXZQS had the effect of relieving superficial dampness, regulating qi for harmonizing stomach [7]. It was used for the cold caused by external wind cold, internal dampness stagnation, or summer dampness and isomania. HXZQS consisted of ten medicinal materials, and its pharmacological effects were concentrated on bacteriostasis, regulating the imbalance of intestinal bacteria, relieving spasm, pain, etc. [20-22]. However, the experimental models of the above pharmacological effects were time consuming and difficult to carry out when evaluating 300 samples from 20 manufacturers. Notably, most of the medicinal materials in HXZQS had anti-inflammatory activity. And the inflammation model was widely used and easy to carry out [23]. Consequently, the LPS-induced RAW264.7 cell model was applied to evaluate the NO inhibitory activity of HXZQS. We screened the test concentration through M1, M4, and M10 samples and found that HXZQS had no effect on cell survival rate at concentrations ≤ 10 μL/mL (Figure S9). Furthermore, 50% ethanol in HXZQS, corresponding to 0.5% ethanol in the culture system, had no effect on cell survival and NO production (Figure S10). Nevertheless, samples from M7, M10, and M20 had mild cytotoxicity at the concentration of 10 μL/mL in the formal experiment, so the NO inhibitory rate was evaluated at 7.5 μL/mL.
The NO inhibitory rate (Table S7-2) of 20 manufacturers ranged from 24.52% to 76.95%. The top six manufacturers with the best inhibitory activity were M5, M6, M15, M16, M7, and M8 in turn, whereas the manufacturer with the worst inhibitory activity was M14. Analyzing the relationship between total content and inhibitory rate, we found that the two do not correspond exactly. For example, M12 and M13 had the lowest total content, but their activity was not the worst. This indicated that the NO inhibitory activity was only related to the presence of certain constituents. Therefore, we analyzed the correlation between the content of each constituent and the NO inhibitory rate. The result (Table S9) showed that the correlation coefficient (r) of β-Eudesmol was 0.518, the maximum r-value meaning the important contribution to NO inhibitory activity of HXZQS. Followed by magnolol, imperatorin, uridine, adenosine, Perillaketone, and atractylenolide III, their contents had a mild positive correlation with NO inhibitory activity. Moreover, it was reported that these constituents had anti-inflammatory activities [24-29]. To sum up, the above analysis suggested that the evaluation based on anti-inflammatory activity was reasonable and related to the chemical evaluation.
3.4. Consistency evaluation of NO inhibitory rate
According to the QCE strategy as described in section 2.6, we have calculated the PA and PB of NO inhibitory rate (Figure 4 and Table 4). The ranges of PA and PB were 7.71% ‒ 47.93% and 8.53% ‒ 93.46%, respectively. As with consistency evaluation of chemical content, PA was generally smaller than PB, indicating that intra-batch consistency was controlled well. Among them, the manufacturers with the smallest and the largest intra-batch differences were M16 and M14, and the manufacturers with the smallest and the largest inter-batch differences were M5 and M13. Next, we calculated the average of PA and PB, which was used to evaluate the consistency of NO inhibitory activity. Consistency was ranked from best to worst as follows: M5, M15, M16, M6, M3, M1, M7, M17, M4, M8, M19, M18, M10, M9, M12, M20, M2, M14, M11, and M13 (Figure S11). Notably, M5, M15, M16, and M6 were also the top four with the best activity.
3.5. Comprehensive consistency evaluation based on chemical constituents and activity
The correlation coefficient of chemical contents and NO inhibition rate on PA and PB was 0.516, suggesting that their consistency basically followed the same trend. Next, the PCA of the four evaluation factors from 20 manufacturers′ samples was carried out. The KMO and Bartlett test results (Table S10), where the KMO value was more than 0.5, and the significance was less than 0.05, indicate that these sample data were suitable for PCA. The percentage variance of the first two components was 75.078% (Table S11), suggesting that they contained most of raw data information. Therefore, the four evaluation factors were dimensionally reduced into two principal components for statistical analysis. Component matrix results have been shown in Table S12, and the eigenvectors calculated accordingly have been shown in Table S13. The scores of the two principal components, namely Z1 and Z2, were calculated according to the following Eq. (3) and Eq. (4). Finally, the comprehensive score, represented by F, was calculated from the percentage variance of the two principal components according to Eq. (5).
The comprehensive scores of 20 manufacturers have been shown in Table 5, and the values of F ranged from 28.39 to 78.75. According to F values, the manufactures were ranked as M7, M15, M6, M16, M3, M5, M10, M8, M4, M1, M18, M19, M17, M14, M11, M20, M9, M2, M12, and M13. Combining with the score chart of PCA (Figure 5), these manufacturers were divided into three levels: M7, M15, M6, M16, M3, M5 in the first level, M10, M8, M4, M1, M18, M19, M17 in the second, M14, M11, M20, M9, M2, M12, and M13 in the third level.
| Manufacture | Z1 | Z2 | F |
|---|---|---|---|
| M1 | 63.48 | 32.18 | 39.55 |
| M2 | 113.78 | 34.02 | 64.74 |
| M3 | 52.96 | 31.40 | 34.17 |
| M4 | 68.30 | 21.74 | 39.21 |
| M5 | 51.04 | 36.02 | 34.42 |
| M6 | 53.31 | 21.39 | 31.75 |
| M7 | 45.20 | 23.81 | 28.39 |
| M8 | 65.43 | 24.40 | 38.49 |
| M9 | 109.72 | 32.33 | 62.31 |
| M10 | 63.87 | 18.26 | 36.13 |
| M11 | 108.65 | 16.82 | 57.77 |
| M12 | 113.25 | 51.12 | 68.92 |
| M13 | 144.56 | 29.69 | 78.75 |
| M14 | 92.70 | 22.02 | 51.28 |
| M15 | 43.63 | 27.04 | 28.46 |
| M16 | 52.36 | 31.87 | 34.00 |
| M17 | 76.63 | 39.69 | 47.95 |
| M18 | 73.46 | 27.23 | 43.17 |
| M19 | 69.78 | 35.74 | 43.57 |
| M20 | 106.55 | 22.74 | 58.27 |
PCA: Principal component analysis, HXZQS: Huoxiang Zhengqi Shui

- PCA score plots of 20 manufacturers. PCA: Principal component analysis.
According to the above results, the manufactures with excellent comprehensive consistency had good consistency of chemical content and activity, while the manufactures with poor comprehensive consistency had bad consistency of chemical content and activity. Consequently, our QCE strategy based on chemical constituents and biological activity could fully reflect the quality of CPM. The purpose of our consistency evaluation was to improve the overall quality of CPM. The requirements of manufacturers themselves could not be just to produce qualified products. On the basis of qualification, manufacturers should pursue standardized and normalized production processes to ensure the stability and consistency of product quality. In addition, manufacturers should also pay special attention to the quality consistency of the raw materials. We hoped that the consistency evaluation could provide some reference for the improvement of manufacturers′ production process, to help them produce stable and high-quality products.
4. Conclusions
The QCE strategy proposed by our team was applied to evaluate the inter-batch consistency and intra-batch quality consistency of CPM, to ensure the safety, effectiveness, and quality control of CPM, to improve the overall level of the pharmaceutical industry, and promote the internationalization of TCM. This study has a demonstration significance for the quality evaluation of CPM and simple preparations. In this paper, we applied the QCE strategy to the comprehensive quality evaluation of chemical contents and biological activity of CPM. HXZQS, a daily household medicine, was used as a typical example of CPM. The quantitative analysis of 20 quality attribute indicators was completed by UPLC-QQQ-MS/MS and GC-QQQ-MS/MS, and NO inhibitory activity was assessed. The manufacturers’ total contents and NO inhibitory activity varied greatly. And the content of volatile components was affected by the packaging material. The PA and PB of chemical contents and biological activity were calculated, and their consistency was evaluated. The consistency of chemical contents from 20 manufacturers’ samples basically maintained similar trends to that of biological activity. The consistency results of 20 manufacturers were further graded by PCA analysis, and comprehensive consistent results from different manufacturers were presented. M7 has the highest content and good uniformity among the 20 manufacturers and should be first recommended, followed by M15, M6, M16, M3, and M5, which have good uniformity. However, M12 and M13 have the worst product consistency, and the lowest content should be excluded from purchase. In conclusion, our QCE work was to allow patients to obtain low-cost and effective drugs, and it can help manufacturers improve the standardization and normalization of production processes, which further improve the overall quality of CPM.
Acknowledgment
This work was supported by the National Natural Science Foundation of China [grant number: 82374179], the Fundamental Research Funds for National Natural Science Foundation Cultivation Program [grant number: ZXKT23010], and the Major Scientific and Technological Special Project for “the Fundamental Research Funds for the Central public welfare research institutes” [grant number: ZZ16-XRZ-070 and ZZ17-YQ-024].
CRediT authorship contribution statement
Qingxia Xu: Methodology, Validation, Formal analysis, Investigation, Data curation, Writing - Original draft preparation, Reviewing and Editing, Visualization; Qian Ma: Methodology, Data curation, Validation, Writing - Original draft preparation; Anyi Zhao: Resources, Methodology, Writing - Editing and Reviewing; Sha Chen: Methodology and Editing; Cong Guo: Visualization, Software, Methodology; Jun Zhang: Visualization and Methodology; Chang Chen: Writing and Editing; Jintang, Cheng: Validation and Editing; Xiaohui Rong: Validation; Xianju Liu: Editing; Jinzhu Jiang: Software; Jipeng Di: Methodology; Xiaodi Kou: Writing - Reviewing and Editing, Supervision; An Liu: Writing - Reviewing and Editing, Supervision, Funding acquisition; Yan Liu: Writing - Editing and Reviewing, Investigation, Project administration, Funding acquisition.
Declaration of competing interest
The authors have no conflicts of interest to declare.
Declaration of Generative AI and AI-assisted technologies in the writing process
The authors confirm that there was no use of artificial intelligence (AI)-assisted technology for assisting in the writing or editing of the manuscript and no images were manipulated using AI.
Supplementary data
Supplementary material to this article can be found online at https://dx.doi.org/10.25259/AJC_130_2024.
References
- Current studies on quality of Chinese patent drugs with consistency as core and discussions on new high-quality evaluation model. China Journal of Chinese Materia Medica. 2020;45:3740-8. https://doi.org/10.19540/j.cnki.cjcmm.20200506.601
- [CrossRef] [PubMed] [Google Scholar]
- Study on the policy of centralized volume-based procurement of Chinese Patent Medicine in China. Health Economics Research. 2023b;40:18-21. https://doi.org/10.14055/j.cnki.33-1056/f.2023.06.004
- [Google Scholar]
- Quality consistency evaluation method and application for three kinds of Chinese patent medicines like Liuwei Dihuang Pill. https://link.cnki.net/doi/10.27282/d.cnki.gsdzu.2023.000751.
- Quality uniformity analysis of 7 commercially available Yangyin Qingfei Preparations. Chinese Journal of Experimental Traditional Medical Formulae 2024:1-10. https://doi.org/10.13422/j.cnki.syfjx.20240963
- [Google Scholar]
- Quality uniformity evaluation of babao dan capsule based on its 14 main chemical compounds and in vitro anti-inflammatory activity. Arabian Journal of Chemistry. 2023;16:105276. https://doi.org/10.1016/j.arabjc.2023.105276
- [CrossRef] [Google Scholar]
- Comprehensive quality consistency evaluation strategy and analysis of compound danshen tablet. Journal of Pharmaceutical and Biomedical Analysis. 2022;219:114951. https://doi.org/10.1016/j.jpba.2022.114951
- [CrossRef] [PubMed] [Google Scholar]
- Pharmacopoeia of the People’s Republic of China. China Medical Science and Technology Press; 2020. https://ydz.chp.org.cn/
- Extraction of flavonoids from citri reticulatae pericarpium viride using a deep eutectic solvent. RSC Advances. 2022;12:26975-26988. https://doi.org/10.1039/d2ra04276b
- [CrossRef] [PubMed] [PubMed Central] [Google Scholar]
- Combination of in silico prediction and convolutional neural network framework for targeted screening of metabolites from LC-HRMS fingerprints: A case study of “Pericarpium Citri Reticulatae - FructusAurantii”. Talanta. 2024;269:125514. https://doi.org/10.1016/j.talanta.2023.125514
- [CrossRef] [PubMed] [Google Scholar]
- Optimization of mechanically assisted coamorphous dispersion extraction of hydrophobic compounds from plant tea (Citri reticulatae pericarpium) using water. Food Chemistry. 2022;393:133462. https://doi.org/10.1016/j.foodchem.2022.133462
- [CrossRef] [PubMed] [Google Scholar]
- Species differentiation and quality evaluation for atractylodes medicinal plants by GC/MS coupled with chemometric analysis. Chemistry & Biodiversity. 2023;20:e202300793. https://doi.org/10.1002/cbdv.202300793
- [PubMed] [Google Scholar]
- Simultaneous determination of imperatorin and isoimperatorin in Radix angelicae by HPLC. Chinese Journal of Hospital Pharmacy. 2017;37:427-9. https://doi.org/10.13286/j.cnki.chinhosppharmacyj.2017.05.06
- [Google Scholar]
- Determination of six active ingredients in Gycyrrhizae Radix et Rhizoma by quantitative analysis of multi-components with a single-marker. Chinese Journal of Experimental Traditional Medical Formulae. 2013;19:56-9.
- [Google Scholar]
- Quality evaluation of Poria based on specific chromatogram and quantitative analysis of multicomponents. China Journal of Chinese Materia Medica. 2019;44:1371-1380. https://doi.org/10.19540/j.cnki.cjcmm.20181220.005
- [CrossRef] [PubMed] [Google Scholar]
- Identification of potentially suitable areas for nucleosides of pinellia ternata (Thunb.) breit using ecological niche modeling. Environmental Monitoring and Assessment. 2023;195:1479. https://doi.org/10.1007/s10661-023-12065-0
- [CrossRef] [PubMed] [Google Scholar]
- Comparative study on contents of four alkaloids in homologous herbal medicines-Arecae Pericarpium and Arecae Semen. China Journal of Chinese Materia Medica. 2018;43:2850-6. https://doi.org/10.19540/j.cnki.cjcmm.20180514.009
- [CrossRef] [PubMed] [Google Scholar]
- GC-MS analysis of volatile compounds of perilla frutescens britton var Japonica accessions: Morphological and seasonal variability. Asian Pacific Journal of Tropical Medicine. 2017;10:643-651. https://doi.org/10.1016/j.apjtm.2017.07.004
- [CrossRef] [PubMed] [Google Scholar]
- Status, problems and warranty strategy of quality uniformity for traditional Chinese medicine preparations. China Journal of Chinese Materia Medica. 2017;42:3826-3830. https://doi.org/10.19540/j.cnki.cjcmm.20170907.013
- [CrossRef] [PubMed] [Google Scholar]
- Overview and prospects of traditional Chinese medicine blending technology oriented by quality consistency. China Journal of Chinese Materia Medica. 2019;44:4786-4792. https://doi.org/10.19540/j.cnki.cjcmm.20190901.302
- [CrossRef] [PubMed] [Google Scholar]
- Preventive effects of traditional chinese medicine formula huoxiangzhengqi against lipopolysaccharide-induced inflammatory response. Phytomedicine: International Journal of Phytotherapy and Phytopharmacology. 2022;99:153968. https://doi.org/10.1016/j.phymed.2022.153968
- [CrossRef] [PubMed] [Google Scholar]
- Clinical progress on management of pneumonia due to COVID-19 with chinese traditional patent medicines. Frontiers in Pharmacology. 2021;12:655063. https://doi.org/10.3389/fphar.2021.655063
- [CrossRef] [PubMed] [PubMed Central] [Google Scholar]
- Research progress on the pharmacodynamic material basis and quality control of Huoxiang Zhengqi Liquid. Drug Evaluation. 2023a;20:1418-1422. https://doi.org/10.19939/j.cnki.1672-2809.2023.11.30
- [Google Scholar]
- Research progress on the pharmacodynamic material basis and quality control of Huoxiang Zhengqi Liquid. Modern Chinese Medicine 2024:1-19. https://doi.org/10.13313/j.issn.1673-4890.20240226001
- [Google Scholar]
- Anti-inflammatory and antioxidant properties of carvacrol and magnolol, in periodontal disease and diabetes mellitus. Molecules (Basel, Switzerland). 2021;26:6899. https://doi.org/10.3390/molecules26226899
- [CrossRef] [PubMed] [PubMed Central] [Google Scholar]
- Uridine supplementation exerts anti-inflammatory and anti-fibrotic effects in an animal model of pulmonary fibrosis. Respiratory Research. 2015;16:105. https://doi.org/10.1186/s12931-015-0264-9
- [CrossRef] [PubMed] [PubMed Central] [Google Scholar]
- Anti-inflammatory activity of atractylenolide III through inhibition of nuclear factor-κB and mitogen-activated protein kinase pathways in mouse macrophages. Immunopharmacology and Immunotoxicology. 2016;38:98-102. https://doi.org/10.3109/08923973.2015.1122617
- [CrossRef] [PubMed] [Google Scholar]
- Identification of quality markers for pudilan xiaoyan oral liquid. China Journal of Chinese Materia Medica. 2020;45:4299-4306. https://doi.org/10.19540/j.cnki.cjcmm.20200423.301
- [CrossRef] [PubMed] [Google Scholar]
- Anti-inflammatory property of imperatorin on alveolar macrophages and inflammatory lung injury. Journal of Natural Products. 2019;82:1002-8. https://doi.org/10.1021/acs.jnatprod.9b00145
- [CrossRef] [PubMed] [Google Scholar]
- Βeta-eudesmol reduces stem cell factor-induced mast cell migration. International Immunopharmacology. 2017;48:1-7. https://doi.org/10.1016/j.intimp.2017.04.017
- [CrossRef] [PubMed] [Google Scholar]


