

Translate this page into:
Berberine isolated from Mahonia nepalensis as an eco-friendly and thermally stable corrosion inhibitor for mild steel in acid medium
⁎Corresponding authors at: Central Department of Chemistry, Tribhuvan University, 44613, Kathmandu, Nepal shova_n@yahoo.com (Shova Neupane), amar2y@yahoo.com (Amar Prasad Yadav)
-
Received: ,
Accepted: ,
This article was originally published by Elsevier and was migrated to Scientific Scholar after the change of Publisher.
Abstract
Background
The environmental and economic benefits have been the driving force in search of efficient corrosion inhibitors for iron/steel used in industrial acidic medium. This study reports on berberine isolated from methanol extract of high-altitude (1347 m) shrub Mahonia nepalensis as a highly efficient and thermally stable corrosion inhibitor for mild steel (MS) in 1.0 M H2SO4 simulating acid pickling condition.
Methods
The weight-loss and electrochemical methods revealed the fast adsorption of berberine.
Significant Findings: It achieved above 91% inhibition efficiency (IE) in 0.25 h and reached 94% in 6 h for 1000 ppm berberine. The IE increased with concentration and temperature, giving an IE of 97.2% at 328 K, which makes it a promising candidate for industrial application. It behaved as a mixed type of inhibitor as revealed by open circuit potential and polarization curves. The results indicated suppression of the corrosion by effectively forming an adsorbed berberine layer on the MS surface. Adsorption of the berberine followed a Langmuir adsorption isotherm. The thermodynamic parameters such as activation energy (43.19 kJ/mol), free energy (−35.05 kJ/mol), enthalpy (40.55 kJ/mol), and entropy (−97.83 J/molK) of adsorption supported both physical and chemical interactions of berberine with MS surface. The obtained results also revealed that the adsorption process was endothermic and spontaneous in nature.
Keywords
Acid corrosion
Weight loss
Polarization
EIS
Adsorption isotherm
Mixed inhibitor

1 Introduction
Mild steel (MS) is one of the widely used materials for infrastructural construction (“NACE International Institute IMPACT PLUS,”) as well as for innovation (Gotman, 1997; McCafferty, 2010a). It has gained popularity since its development in the middle age and replaced the traditional structural development concept (“NACE International Institute IMPACT PLUS,”) with its mechanical property, availability, and low cost (Murmu et al., 2019). The MS is widely used for human civilization and sustainable development, so its degradation due to corrosion is a big problem (Stansbury and Buchanan, 2009; McCafferty, 2010b). The undesirable dissolution of MS in the acidic atmosphere leads to a considerable impact on the world’s economy (“NACE International Institute IMPACT PLUS,”). Also, acid solutions are extensively used to remove rust and scale in acid pickling, clean boilers, acidization in the oil well, and petrochemical process (Khadom et al., 2018; Ostovari et al., 2009). Controlling the exposure of metallic structures to the acidic environment is the primary prevention strategy to protect the material from its corrosion, but it is practically not feasible. Fortunately, corrosion prevention methods such as barrier coating, alloying, galvanization, and cathodic protection are practiced to control corrosion. Among them, the use of inhibitors is relatively cost-effective, easy to use, and efficient to protect the metal surface (Ashassi-Sorkhabi et al., 2008).
Inorganic inhibitors inhibit corrosion by forming a passive layer on the surface of oxidized metal (El-Etre, 2007). On the other hand, organic inhibitors cover a large metal surface area with a physically adsorbed layer by displacing water molecules (Muralidharan et al., 1995). They may also adsorb chemically. The lone pairs of electrons or π-electrons in inhibitor molecules form a coordinate covalent bond with metal (Bedair et al., 2017; Fernandes et al., 2019; Hackerman and Hard, 1962; Ju et al., 2012; Li et al., 2008; Ma et al., 2017; Murmu et al., 2019; Qiang et al., 2018; Sadeghi Erami et al., 2019; Wu et al., 2020).
Many organic and synthetic chemicals containing oxygen, sulfur, and nitrogen work as effective corrosion inhibitors (Bedair et al., 2017; Douche et al., 2020; Elmsellem et al., 2015; Fernandes et al., 2019; Hassan et al., 2016; Ju et al., 2012; Li et al., 2008, 2005; Ma et al., 2017; Murmu et al., 2019; Sadeghi Erami et al., 2019; Wu et al., 2020; Zuo et al., 2021). However, most of these compounds have hazardous effects on humans and the environment. Therefore, there is a need for alternative inhibitors that should be non-toxic, biodegradable, environmentally acceptable, renewable, and cost-effective. The recent research trend is growing to develop eco-friendly inhibitors from phytochemicals present in the plant extract (Tan et al., 2021b). Phytochemicals have similar molecular and electronic structures to conventional organic inhibitor molecules (Abdul Rahiman and Sethumanickam, 2017; Karthikaiselvi and Subhashini, 2014; Umoren et al., 2014; Verma et al., 2015). Plant extracts work as inhibitors due to the existence of complex organic species such as alkaloids, flavonoids, polyphenol, tannins, nitrogen bases, carbohydrates, protein, and their hydrolysis products in their composition (Cang et al., 2013). A number of research reports showing plant extracts as effective corrosion inhibitors are available such as Lilium brownii (Zuo et al., 2021), Xanthium strumarium (Khadom et al., 2018), Papaya (Tan et al., 2021b), Apricot (Yaro et al., 2013), Eucalyptus (Hafez et al., 2019), Kiwi (Khadom and Rashid, 2018), Olive (El-Etre, 2007), Citrus aurantium (Hassan et al., 2016), Chamaerops humilis (Fekkar et al., 2020), Ginko (Qiang et al., 2018), Ocimum basilicum (Elmsellem et al., 2019), Coconut (Umoren et al., 2014), Aloes (Cang et al., 2013), Henna (Hamdy and El-Gendy, 2013; Ostovari et al., 2009), Betel (Tan et al., 2021a), Peach (Yaro et al., 2011), etc. Electrochemical and thermodynamic evidences have been used to disucss the corrosion protection mechanism by organic compounds present in plant extracts (Bedair et al., 2017; Ju et al., 2012; Li et al., 2008, 2005; Qiang et al., 2018; Sadeghi Erami et al., 2019; Wu et al., 2020). Nevertheless, there is limited study on the effects of molecular structure, type of functional group present, the steric consideration, and dipole moment of inhibitor molecules (Ju et al., 2012; Qiang et al., 2018; Sadeghi Erami et al., 2019), on the efficeiny of plant extract, which motivates more studies for practical applications of such green inhibitors.
The flora of high-altitude Himalaya is one of the potential source of green corrosion inhibitors as it is not yet explored (Tiwari et al., 2019). This study attempted to study endemic plant species of Nepal, not explored before, to add to the growing list of plant-based inhibitors. A summary of plant extracts with particular reference to phyto-resources of Nepalese origin studied as corrosion inhibitors for MS is in Table 1 (Bohara, 2019; Chaudhary et al., 2016; Gupta et al., 2020; Karki et al., 2018, 2020, 2021; Lama et al., 2016, 2018; Shrestha et al., 2019; Thapa et al., 2019).
S. No.
Phyto-resource
Corrosion Medium
IE %
Method
1
Artemisia vulgaris [Karki et al., 2018]
1.0 M H2SO4
71.8
Weight Loss
2
Lantana camara [Shrestha et al., 2019]
1.0 M HCl
97.33
Potentiodynamic polarization
3
Euphorbia royleana [Thapa et al., 2019]
1.0 M HCl
99.60
Weight Loss
4
Progostemon benghalesis [Lama et al., 2016, Chaudhary et al., 2016]
1.0 M H2SO4
1.0 M H2SO4
99.4
90.6Potentiodynamic polarization
Weight Loss
5
Gaultheria fragrantisima [Lama et al., 2018]
1.0 M H2SO4
94.56
Potentiodynamic polarization
6
Jatropha curcas [Gupta et al., 2020]
1.0 M H2SO4
91.34
Potentiodynamic polarization
7
Crotalaria spectabilis [Bohara, 2019]
1.0 M H2SO4
90.43
92.86Weight loss
Potentiodynamic polarization
8
Berberis aristata [Karki et al., 2020]
1.0 M H2SO4
96.0
98.18Weight loss
Potentiodynamic polarization
9
Equisetum hyemale [Karki et al., 2021]
1.0 M H2SO4
86.28
92.74EIS
Potentiodynamic polarization
There are many unreported plants traditionally used to protect metallic weapons, agricultural tools, and household utensils. Equisetum hyemale, Artemisia vulgaris, Berberis aristata, and Mahonia nepalensis are examples of such plants traditionally used to protect the metallic wares in Nepalese villages. The potentials of such plants need to be investigated. Mahonia nepalensis, family: Berberidaceae is one of the commonly available plants in the urban region close to Kathmandu, and the powder of its branches has been used to protect the iron agricultural tools from corrosion. It is a perennial and evergreen shrub species reported to be rich in alkaloids, flavonoids, quinones, terpenoids, steroids, glycosides, cardiac glycosides, and saponins (Thusa and Mulmi, 2017). The primary chemical constituents isolated from the extract are Berberine, Jatrorrhizine, 7,8-dihydro-8- methoxy berberine, (Thusa and Mulmi, 2017) Homoaromoline, and Isotetrandine, (Nguyen et al., 2009). The primary component present in the extract is berberine, a cationic dye as shown in Fig. 1. It is a non-toxic alkaloid used as an antibiotic for years in China (Li et al., 2005). Berberine, being a heterocyclic compound with the planar isoquinoline structure containing π-bonds, N, and O atoms, could be a promising non-toxic inhibitor.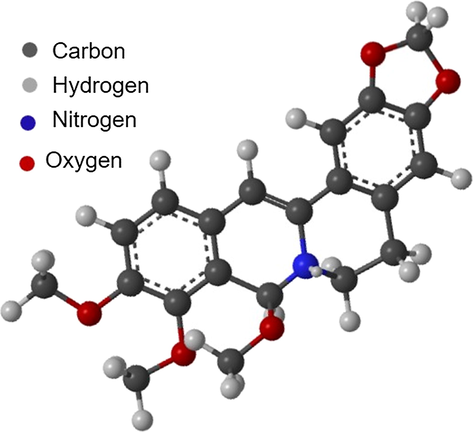
Structure of Berberine.
Here, we report on the corrosion inhibition behavior of berberine isolated from Mahonia nepalensis for a mild steel sample for industrial applications. The work aimed to explore the macro-scale corrosion inhibition properties of the compound using electrochemical and weight loss methods. Kinetics of adsorption were investigated by polarization and impedance measurements, while adsorption isotherm studies were carried out to estimate the thermodynamic parameters in order to understand the adsorption mechanism.
2 Material and methods
2.1 Berberine isolation and its primary characterization
Areal branches and stem of Mahonia nepalensis were collected from Nangkhel (latitude: 27°39′23.3″N, longitude: 85°27′19.0″E and altitude 1347 m) Bhaktapur, Nepal. The raw plant material was cut into smaller pieces, dried in the shade at room temperature (RT) for four weeks, ground to a fine powder in a mixer/blender, and stored in an airtight container. The prepared powder was extracted in methanol with 200 g/1000 ml for 72 h with occasional shaking followed by filtration using an ordinary filter paper. The process was repeated until a colorless solution appeared. Then, the extract was concentrated using a digital rotary evaporator (IKA RV-10), and finally, the concentrated extract was evaporated to dryness to obtain a solid residue. This extract was loaded in a column packed with activated silica gel (60–120) mesh. The column was then eluted with a gradient of hexane, ethyl acetate, and methanol to obtain a number of fractions. Fraction (190–191), eluted with 20% methanol in ethyl acetate, was concentrated to obtain needle-shaped yellow crystals. Crystals were washed several times with chloroform, acetone, and ether, followed by recrystallization in ethanol. Yield obtained after recrystallization was soluble in methanol, and a single spot was found on its TLC with R.F. value (0.45) in 20% methanol in chloroform. The melting point of the crystal was reported as 144 °C. Further, it gave pale yellow precipitation on Meyer's test and orange-red ppt. in Dragendrroff’s test, which implies that the compound is an alkaloid.
A Fourier transform infrared (FTIR) spectra in attenuated total reflectance (ATR) mode of the isolated berberine and commercial sample of berberine were recorded using a Shimadzu FTIR spectrophotometer. Also, the UV–visible spectra of these samples were recorded using Labtronics (LT-2802) double beam spectrophotometer. The obtained spectra were compared to ensure the authenticity of the isolated compound as berberine.
Initially, a stock berberine solution of 1000 ppm in warm 1.0 M H2SO4 was prepared. Further, a series of berberine solutions of 800 ppm, 600 ppm, 400 ppm, and 200 ppm, respectively, were prepared in 1.0 M H2SO4 by serial dilution. All the analytical reagent grade chemicals and laboratory-grade solvents were procured from Fisher Scientific, India, and used without further purification.
2.2 Surface preparation of the MS sample
A flat sheet of commercial MS available in the local market of Nepal was cut into 3.5 cm × 3.5 cm × 0.15 cm. The composion of the MS was carbon (0.17%), silicon (0.40%), manganese (0.8%), sulphur (0.04%), phosphorous (0.04%) and balance iron. The MS samples were abraded with silicon carbide (SiC) paper of different grades, starting with coarse one (#100 grade) and proceeding in six steps to fine grade (#1200 grade). Abraded MS samples were ultrasonicated for 10 min in ethanol, dried, and stored in desiccators.
2.3 Weight-loss measurements
The inhibition efficiency (IE) of berberine was investigated by the weight loss method. Weight of abraded MS sample was recorded with an Ohaus E1RR80 four-digit electronic analytical balance before and after immersion in 100 ml of 1.0 M H2SO4 and with 1.0 M H2SO4+ berberine of different concentrations. The effect of the inhibitor was evaluated by various parameters such as immersion time, inhibitor concentration, and temperature. The effect of immersion time on corrosion rate and inhibition efficiency was studied at 1000 ppm berberine at a time interval of 0.25 h, 0.75 h, 1.5 h, 3.0 h, 6.0 h, 9.0 h, 12.0 h, and 24.0 h, respectively. Similarly, the effect of inhibitor concentration was recorded by immersing the MS samples in berberine solutions of 200 ppm, 400 ppm, 600 ppm, 800 ppm, and 1000 ppm for 6.0 h. Finally, the effect of temperature was studied in 1000 ppm berberine at 298 K, 308 K, 318 K, 328 K, and 338 K, respectively. A Clifton water bath (NE2-4D) was used to adjust the desired temperature.
The MS samples were washed thoroughly with distilled water, rinsed with acetone, dried with air, and weighed after each measurement. All the experiments were carried out in triplicates, and their mean values were used for data illustrations. Corrosion rate (CR), surface coverage (θ), and inhibition efficiency (IE%) were calculated using the following standard equations (Ashassi-Sorkhabi et al., 2008; Cang et al., 2013; Ostovari et al., 2009):
W, A, t, and D represent weight loss in mg, surface area in cm2, time of immersion in hour, and density in g/mL of the MS sample, respectively. The geometric surface coverage (θ) of MS due to the blocking action of the berberine molecule was expressed as:
W1 and W2 represent the weight loss of the MS sample in 1.0 M H2SO4 and 1.0 M H2SO4 + berberine, respectively. Finally, the inhibition efficiency of the inhibitor molecule was estimated from the weight loss data as:
2.4 Electrochemical measurements
The prepared MS samples were immersed in the test solution to get a stable open circuit potential (OCP) for 10 min before each polarization measurement. Electrochemical measurements were performed with a Gamry potentiostat (Reference 600) supported with Gamry framework software. All the measurements were carried out with a 300 ml test solution in a three-electrode cylindrical glass cell. A polished MS sample having an exposed surface area of 0.608 cm2 was employed as a working electrode, a saturated calomel electrode (SCE) as a reference electrode, and a platinum wire as a counter electrode. The potential value mentioned in this paper hereafter is referred to as an SCE.
Potentiodynamic polarization were recorded from −0.3 V to +0.3 V vs. OCP with a scan rate of 0.5 mV/s. The potential was scanned from the cathodic limit to the anodic limit. Cathodic and anodic slopes were determined from corresponding polarization curves. Corrosion potential (Ecorr) and corrosion current (icorr) for each test solutions were determined by a standard Tafel extrapolation method, and corrosion inhibition efficiency (IE) was calculated by the Eq. (4) (Ostovari et al., 2009):
and are corrosion current densities in 1.0 M H2SO4 + berberine and 1.0 M H2SO4, respectively.
The electrochemical impedance measurements were carried out using an AC signal of 10 mV amplitude for the frequency range of 100 kHz to 0.01 Hz. The value of charge transfer resistance (Rct) was obtained from the diameter of Nyquist plots, and IE was calculated by the following Eq. (5) (Ashassi-Sorkhabi et al., 2008):
and are charge transfer resistances in 1.0 M H2SO4 + berberine and 1.0 M H2SO4, respectively.
2.5 Surface analysis
The MS samples were immersed in berberine solutions of 400 ppm and 1000 ppm in 1.0 M H2SO4 for 24 h as well as in 1.0 M H2SO4 to get a bare corrosion counterpart. Then, the samples were washed with distilled water, dried, and stored in a desiccator. The surface morphology as well as its elemental compositions under different experimental conditions were carried out by scanning electron microscope (SEM) (M470 Ac-SECM) with energy dispersive X-ray spectrometer (EDX).
3 Results and discussion
3.1 FTIR and UV–visible analysis of isolated compound
The FTIR spectra of the isolated berberine and commercial samples of berberine are compared in Fig. 2. The notable absorption peaks and assigned functional groups are pointed on the FTIR plot and tabulated in the supplementary material (S1). The absorbed peaks at 3549 cm−1, 3402 cm−1, and 3317 cm−1, 3224 cm−1 are assigned to the N-H stretch. Absorption at 3055 cm−1 indicates the C—H stretch in the aromatic functional group. The absorption bands at 2908 cm−1, 2846 cm−1 are designate to the C—H stretch of alkanes. A peak at 2121 cm−1 is assigned to the C≡N stretch. A peak at 1605 cm−1 is allocated to C—C stretching in an aromatic ring. The absorption bands at 1396 cm−1, 1365.60 cm−1 indicate C—H bending. The absorbed peaks at 1293.02 cm−1, 1204.44 cm−1 are assigned to C—O stretch and C—N stretch in aromatic amines. Similarly, the absorbed peaks at 1111 cm−1, 1041 cm−1 are assigned to C—O—O stretching and a peak at 970 cm−1 indicates the O—H bending. The absorption peaks at 825 cm−1, 640 cm−1, 524 cm−1, 424 cm−1, 393 cm−1 are due to C—H out of plane bending. The functional groups and fingerprint regions of the FTIR spectrum of the isolated compound are similar to that of the FTIR spectrum of an commercial sample of berberine.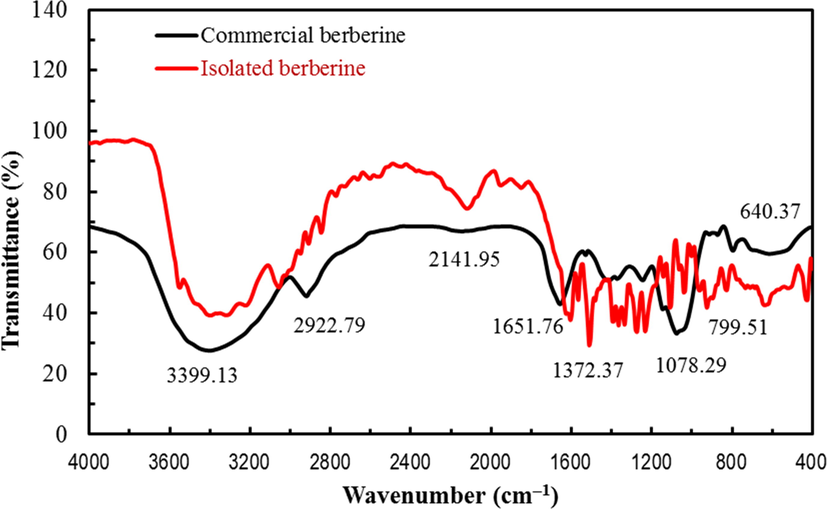
Comparison of FTIR spectra of commercial berberine and isolated berberine.
The UV–Vis absorption spectra of both the isolated berberine and commercial samples of berberine were recorded in a methanolic solution and are presented in Fig. 3. The absorption spectra exhibit two bands with maxima around 275 and 358 nm, which are strong, and other relatively weak bands at about 210 and 416 nm. In methanol solution, berberinol is believed to have been formed. Berberinol shows absorption peaks at 275 nm and 358 nm (Sangster and Stuart, 1965). The methanolic extract of berberine may contain reduced and oxidized form of berberine as well. So, the limited reduction of berberine might yield tetrahydro berberine, which results in maxima at 210 nm (Sangster and Stuart, 1965). According to Diaz (Díaz et al., 2009), berberine shows a relatively high molar extinction coefficient in all solvents, giving a characteristic π → π* transition in the 250–350 nm range. The weak shoulder at 416 nm is attributed to H-bonding, which is blue-shifted with an increase in polarity of solvent and strength of the H- bonding.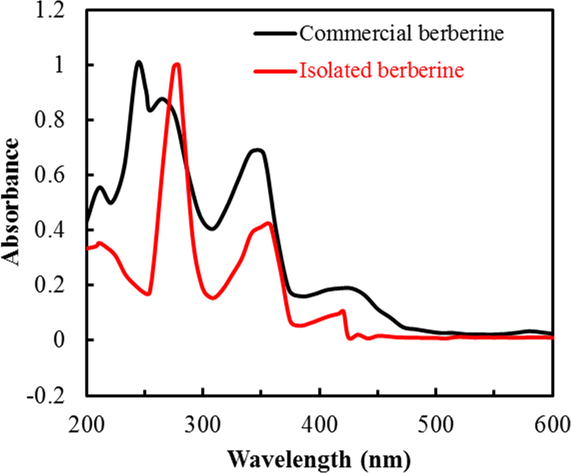
Comparison of UV–Vis spectra of commercial berberine and isolated berberine.
3.2 Weight loss measurement
Fig. 4 shows the weight change of MS coupon in 1.0 M H2SO4 and 1.0 M H2SO4 + berberine and Fig. 5a shows IE of berberine at various time intervals calculated from weight-change data, and the values are tabulated in the supplementary S2. The result compares weight loss variation of MS samples immersed in 1.0 M H2SO4 vs 1.0 M H2SO4 + 1000 ppm of berberine. The corrosion rates in different time intervals, such as in 0.25 h, 0.75 h, 1.5 h, 3 h 6 h, 9 h, 12 h, and 24 h were calculated. The corrosion rate of MS sample is almost 12 times lower after 0.25 h of exposure and 25 times lower after 24 h of exposure in 1.0 M H2SO4 containing berberine as compared to the bare one, as shown in supplementary table S2.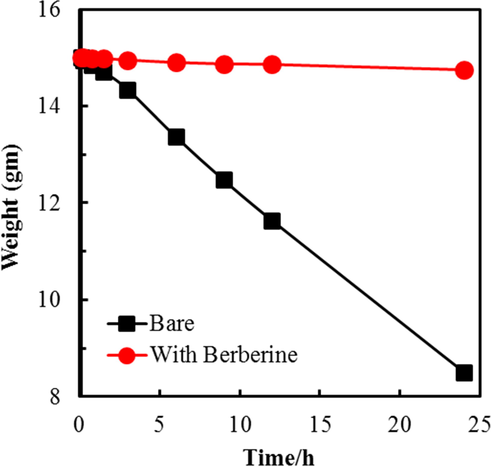
Weight change of MS specimen in the presence of berberine in 1.0 M H2SO4.
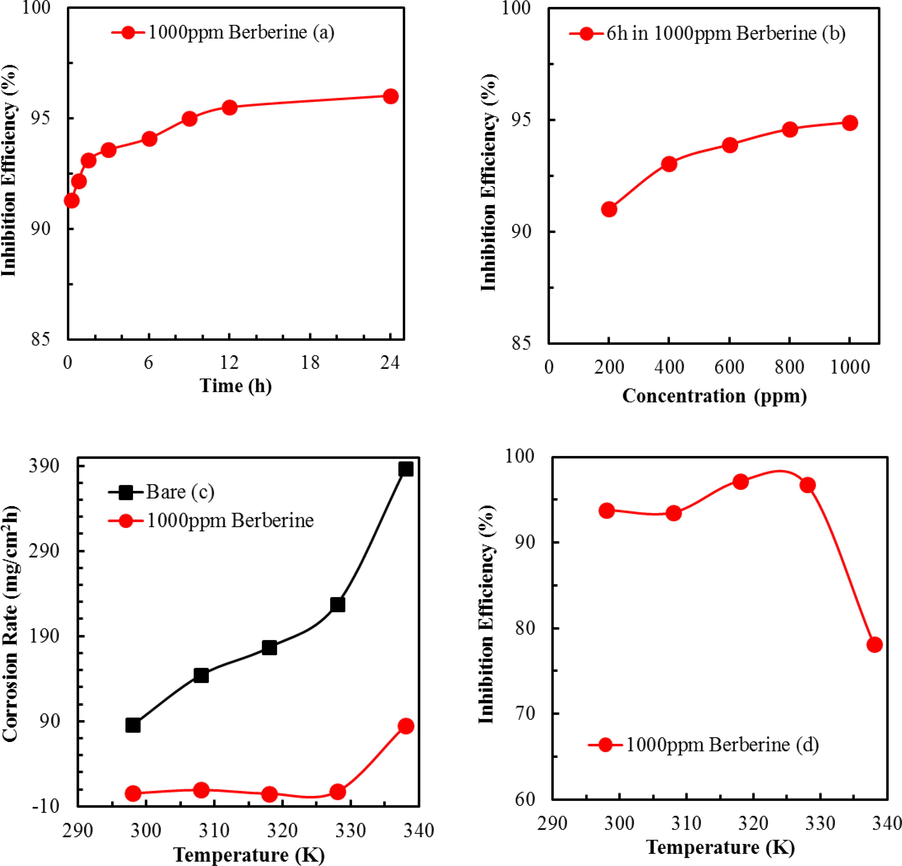
(a) Time variation of corrosion inhibition efficiency of berberine on mild steel at RT (b) Effect of concentration of berberine on its inhibition efficiency on mild steel (c) Effect of temperature on the corrosion rate of mild steel in the presence of berberine and d) Effect of temperature on the corrosion inhibition efficiency of berberine on mild steel.
This result indicates that the adsorption of berberine on the MS surface is highly efficient and fast. The corrosion IE is above 91% within 0.25 h of immersion in the berberine containing 1.0 M H2SO4 (Fig. 5a). The IE continuously increases with exposure time and goes up to approximately 96% in 24 h. Results reveal the potential of the berberine for inhibiting the corrosion of MS. A protective layer due to the efficient and fast adsorption of berberine onto the metal surface appears to be the driving force behind the observed corrosion inhibition.
Fig. 5b shows the effect of berberine concentrations on the corrosion of MS after 6.0 h of immersion at 298 K. The calculated values of IE are tabulated in supplementary S3. The results show that the berberine concentration of 200 ppm effectively limits the corrosion of the MS by 91%. The IE increases marginally with concentration, reaching a value of 95% at 1000 ppm of berberine. The geometric surface coverage of the MS by berberine is high (0.95), therefore blocking most of the active site of the MS surface.
Similarly, the effect of temperature on the corrosion inhibition of MS by berberine was studied. For this, the corrosion of the MS sample immersed in 1000 ppm berberine solution for 6 h was studied at various temperatures. The corrosion rate and corresponding inhibition efficiency were estimated from the weight loss data of Table 2 and plotted in Fig. 5c and d. The results show that IE peaked at 97.2% at 328.15 K (55.0 °C). Further increase in temperature results in a decrease in IE, indicating desorption or decomposition of inhibitor at temperatures above 55.0 °C (328.15 K) (Bentiss et al., 2009).
Temperature (K)
Corrosion Rate (mg/cm2h)
Inhibition Efficiency (IE %)
For Acid without inhibitor
For acid with inhibitor
298
85.70
5.31
93.80
308
144.12
9.35
93.51
318
176.60
4.94
97.20
328
227.65
7.44
96.73
338
386.51
84.60
78.11
It is worth notice that such a high efficiency (97.2%) at 328.15 K (55.0 °C) is not common among plant extracts, which had shown IE as low as 30% at such temperature (Choudhary et al., 2015; El-Etre, 2007; Ostovari et al., 2009). Authors have found that extract of Berberis aristata, a berberine-rich plant, showed IE of 80% at 328.15 K (55.0 °C) (Karki et al., 2020). Berberine extracted from Coptis chinesis, though showed similar IE to this study (Li et al., 2005; Na et al., 2019), but temperature stability was not like berberine isolated from methanol extract of Mahonia nepalensis. Therefore, the higher thermal stability of berberine isolated from Mahonia nepalnesis can be used in applications such as effectively removing corrosion products for weight loss estimation and faster removal of scales and oxide layers in the industrial process used for surface finish instead of using other toxic chemicals. The marginal but steady increase of inhibition efficiency with temperature up to 328.15 K hints at the chemical adsorption of the berberine on the MS surface. The above results are pertinent to decipher the nature and mechanism of the adsorption process offered by berberine.
3.3 Adsorption isotherm
Adsorption isotherms help to collect necessary basic information on the interaction between the inhibitor and MS surface. The inhibition of corrosion of metals by organic compounds is due to the adsorption of molecules on their surface. The polar functions of molecule preferentially get adsorbed on a positively charged metal surface by either physical or chemical interactions or both. The adsorbed compound functions as a barrier for charge and mass transfer between metal and the environment. Therefore, the study of the adsorption behavior of inhibitor is an essential part of the study. It helps to know about the mode and extent of inhibitor interaction to the metal surface by evaluating some important thermodynamic parameters such as free energy, activation energy, enthalpy, and entropy of adsorption. It is a well-understood fact that water dipoles make the first raw of adsorbed molecules on the metal surfaces in an aqueous solution. Therefore, the adsorption phenomena of inhibitor molecules from aqueous solution requires the replacement of water dipoles resulting in a quasi-substitution process (Chauhan and Gunasekaran, 2007). An adsorption isotherm is determined by working on a linear relation between θ (surface coverage) value and Cinh (concentration of inhibitor). Langmuir adsorption isotherm appeared the best fit among various isotherms examined. The plot in Fig. 6a shows a linear correlation coefficient (R2), and the slope values almost equal to 1. It indicates the monolayer adsorption of the inhibitor molecules on the MS surface without lateral interaction between the adsorbed molecules (Sadeghi Erami et al., 2019).
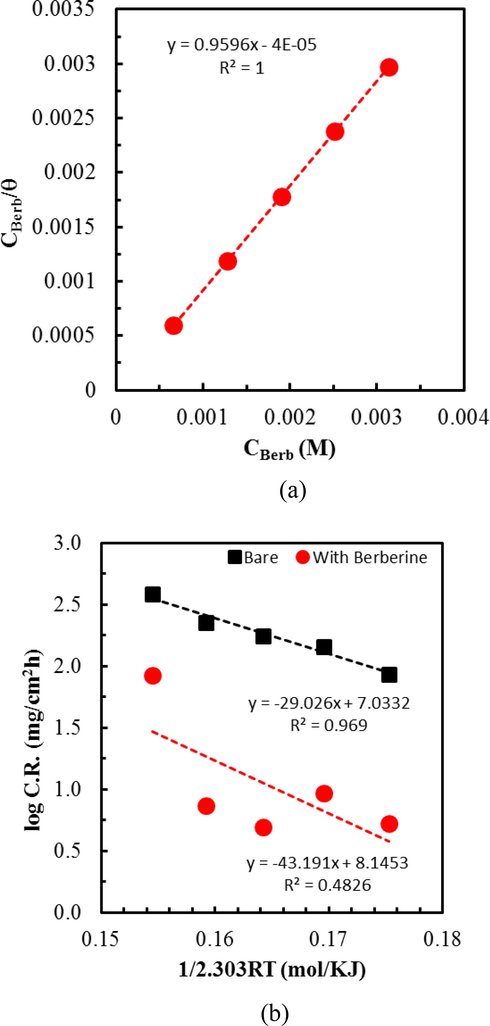
(a) Langmuir adsorption isotherm plot for mild steel in 1.0 M H2SO4 spiked with different concentrations of berberine. (b) Arrhenius plot wherein x-axis 1/2.303 RT is plotted instead of 1/T so that slope directly gives the value of Ea, and (c) Transition state plot for mild steel in 1.0 M H2SO4 with and without berberine. Here too, instead of 1/T, a plot of 1/2.303 RT in the x-axis is used to obtain the enthalpy (ΔH) directly.
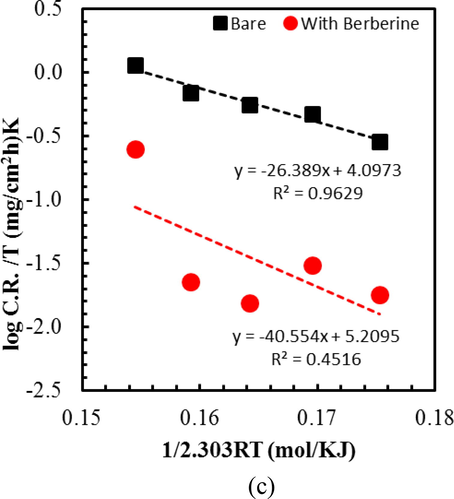
(a) Langmuir adsorption isotherm plot for mild steel in 1.0 M H2SO4 spiked with different concentrations of berberine. (b) Arrhenius plot wherein x-axis 1/2.303 RT is plotted instead of 1/T so that slope directly gives the value of Ea, and (c) Transition state plot for mild steel in 1.0 M H2SO4 with and without berberine. Here too, instead of 1/T, a plot of 1/2.303 RT in the x-axis is used to obtain the enthalpy (ΔH) directly.
The value of adsorption constant Kads from the intercept of the straight line obtained by plotting
vs. CBerb was calculated, according to Langmuir adsorption isotherm Eq. (6) (Ostovari et al., 2009),
The value of Kads can be then used to calculate the value of free energy of adsorption (ΔG°) from the Eq. (7) (Ashassi-Sorkhabi et al., 2008):
55.5 is the water concentration in solution in mol/L, and R is the universal gas constant (8.314 J/mol K). The calculated value of ΔG° from the above relation is −35.05 kJ/mol; therefore, the adsorption of inhibitors is spontaneous. A physical adsorption results in ΔG° value of less negative than or equal to −20 kJ/mol, while a chemical adsorption process results in ΔG° value of more negative than −40 kJ/mol (Sadeghi Erami et al., 2019). The calculated value of ΔG° in the present study is intermediate of these two values. Therefore, the adsorption of berberine on the MS surface involves both physical and chemical interactions (Tan et al., 2020). The reported values of ΔGo in the literature varied depending on the types of inhibitor molecules and their functionalities (Bedair et al., 2017; Fernandes et al., 2019; Ju et al., 2012; Li et al., 2008; Ma et al., 2017; Mourya et al., 2014; Qiang et al., 2018; Sadeghi Erami et al., 2019).
3.4 Calculation of activation energy and thermodynamic parameters
Several useful thermodynamic parameters such as activation energy, enthalpy, and entropy of adsorptions were estimated to investigate the nature of the berberine adsorption on the MS surface. Fig. 6b represents the activation energy (Ea) of adsorption achieved from Arrhenius plots for MS specimens in 1.0 M H2SO4 and 1.0 M H2SO4 + berberine, respectively in accordance to the equation (8) (Ostovari et al., 2009),
Ea estimated from Arrhenius plots (Fig. 6b) is compared in Table 3. An increase of Ea with the addition of berberine compound indicates difficulty in dissolution of metal due to the adsorption of inhibitor molecules on the MS surface (Shukla and Ebenso, 2011). The activation energy value less than or equal to 20 kJ/mol points to physical adsorption, while a value of more than 80 kJ/mol hints at the chemical nature of the adsorption (Li et al., 2005; Sadeghi Erami et al., 2019). The calculated value of activation energy for berberine adsorption is 43.19 kJ/mol, intermediate between physical and chemical interactions. Therefore, adsorption of berberine on MS surface in acidic medium involves physical and chemical interactions as confirmed by the value of free energy of adsorption.
Electrolyte
Ea (kJ/mol)
ΔH* (kJ/mol)
Ea-ΔH*
ΔS* (J/molK)
1.0 M H2SO4
29.02
26.38
2.64
−119.13
1.0 M H2SO4 + 1000 ppm berberine
43.13
40.55
2.64
−97.83
The enthalpy of activation (ΔH*) and the entropy of activation (ΔS*) can be calculated using an alternative form of the Arrhenius equation called transition state equation (9) (Ostovari et al., 2009):
A significant and negative values of ΔS* for MS in 0.1 M H2SO4 indicates an association step in the rate-determining step. The result means a decrease in disordering from the solution phase to the activated complex formation phase on the MS surface (Hamdy and El-Gendy, 2013). Interestingly, the addition of inhibitor increases the ΔS* value, implying a more randomly arranged transition state of the rate-determining recombination step. The phenomenon may be interpreted as replacing water molecules by berberine on the metal surface (Hamdy and El-Gendy, 2013). In such a case, the rate of discharge of hydrogen ions in the rate-determining step might be decreased with the adsorbed berberine molecules.
3.5 Electrochemical measurements
OCP of the MS in the presence of berberine helps in getting insight into the types of corrosion control the inhibitor has and the surface charge it could acquire in a particular solution. OCP of MS specimens in 1.0 M H2SO4 and 1.0 M H2SO4 + berberine of different concentrations were recorded. Fig. 7a reveals the shifting of OCP towards positive potential in the presence of berberine in 1.0 M H2SO4, but the shift is less than 85 mV, and therefore it might act as a mixed type of corrosion inhibitor (Riggs, 1973). The positive shifting of OCP shows the formation of a protective film of berberine on MS surface in 1.0 M H2SO4 solution, which limited the ingress of aggressive ions towards the metal surface (Sudheer and Quraishi, 2014).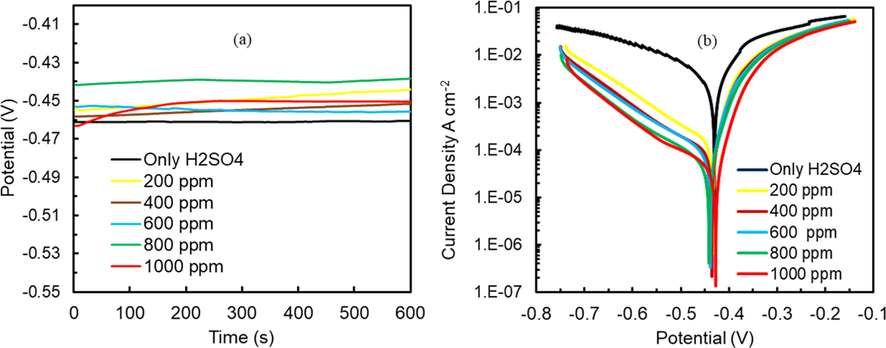
(a) Variation of OCP of mild steel specimen in 1.0 M H2SO4 solution without and with berberine of different concentrations against an SCE reference (b) potentiodynamic polarization of mild steel in 1.0 M H2SO4 without and with berberine of different concentrations.
Tafel plots of MS samples were recorded to study the inhibition effect of berberine on anodic and cathodic reactions. Different concentrations of berberine in 1.0 M H2SO4 were used to perform polarization measurements. The polarization started after OCP got stabilized. The polarization curve in Fig. 7b, Ecorr, Icorr, cathodic and anodic slopes is determined by extrapolation method. The electrochemical parameters are presented in Table 4.
berberine (ppm)
-Ecorr (V/SCE)
icorr (A/cm2)
βa (V/dec)
-βc (V/dec)
IE%
Blank (0)
0.427
1.93 × 10⁻³
0.061
0.111
–
200
0.434
1.46 × 10⁻⁴
0.030
0.115
92.46
400
0.436
7.80 × 10⁻⁵
0.030
0.122
95.97
600
0.440
7.24 × 10⁻⁵
0.029
0.117
96.26
800
0.442
4.49 × 10⁻⁵
0.031
0.121
97.68
1000
0.428
3.5 × 10⁻⁵
0.031
0.142
98.19
The polarization data shows that Icorr decreases more than 55 times in the presence of berberine, confirming it as a suitable inhibitor. However, the inhibition effect is more prominent on the cathodic branch than on the anodic one, and it is a mixed type of inhibitor as corrosion potential shift is less than 85 mV (Riggs, 1973). The calculation shows that the IE increases with the concentration of inhibitor in 1.0 M H2SO4, and it goes up to 98.19% at 1000 ppm concentration. The parallel cathodic Tafel plots reveal that the hydrogen evolution is activation-controlled and that the reduction mechanism is not affected by the addition of inhibitors in the acid solution (Chkirate et al., 2021; Tan et al., 2021c). Both slopes are not much affected by berberine inhibitor addition, which signifies that inhibition is due to berberine adsorption on the MS surface by merely blocking the active sites (Fekkar et al., 2020; Hafez et al., 2019; Oguzie et al., 2007).
To further understand the corrosion kinetics of the MS sample at OCP in 1.0 M H2SO4 and 1.0 M H2SO4 + berberine, electrochemical impedance measurements (EIS) were performed. Nyquist and Bode plots obtained from the EIS study are shown in Fig. 8a-c. Symbols represent the measured data, and solid lines represent the fitted one obtained by using a simple equivalent circuit model consisting of a single time constant, as shown in Fig. 8d.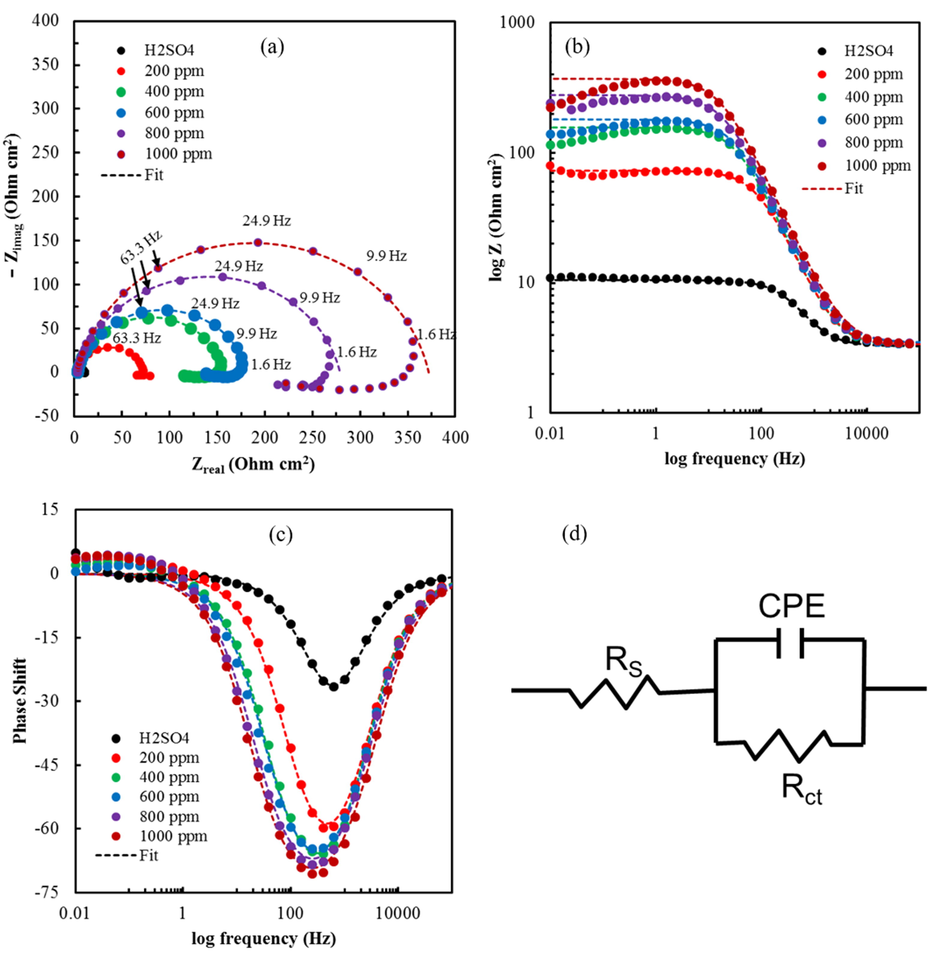
(a) Nyquist plots for mild steel in 1.0 M H2SO4 without and with berberine of different concentrations, (b) Bode plots for mild steel in 1.0 M H2SO4 without and with berberine of different concentrations, (c) Bode plots of phase angle vs. frequency for mild steel in 1.0 M H2SO4 without and with berberine of different concentrations, and (d) the equivalent circuit model used to fit the impedance spectra.
The circuit element Rs is solution resistance, Rct is charge transfer resistance at the metal/solution interface, and CPE is a constant phase element representing the double-layer capacitance of the metal/solution interface. The CPE is used in the circuit model to compensate for non-homogeneity in the system arising from surface roughness, adsorption of inhibitors, and the formation of a porous layer, among others, on the electrode surface (Elmsellem et al., 2014).
The impedance function of CPE is represented by the expression (10) (Ashassi-Sorkhabi et al., 2008; Tan et al., 2021a):
The presence of a single capacitive loop in the Nyquist plot and only one time constant in the Bode plot mean the charge transfer process mainly controls the corrosion of MS in 1.0 M H2SO4 solution without changing the mechanism of dissolution of metal by the presence of berberine molecules (Alagta et al., 2008). The capacitive loop diameter in the Nyquist plot represents the charge transfer resistance, which increases in the presence of berberine. Also, it increases with the increase in concentration of berberine. The increment in Rct is due to more substantial surface coverage by berberine molecules, as evidenced by weight loss data (supplementary material S2) (Bentiss et al., 2000). The increase of phase angle in the Bode-phase plot with the concentration of inhibitor also confirms the inhibitive behavior of berberine (Hegazy et al., 2014; Xu et al., 2014). Electrochemical impedance parameters derived from the equivalent circuit using Z-view software (v3.1c) are tabulated in Table 5.
Concentration (ppm)
Rs (Ωcm2)
CPE (μΩ−1Sncm−2)
n
Rct (Ωcm2)
IE%
Blank (0)
3.26
180.81
0.875
7.29
200
3.33
56.81
0.889
69.8
89.56
400
3.26
56.33
0.887
153.8
95.26
600
3.39
56.02
0.876
177.7
95.90
800
3.47
55.16
0.864
275.4
97.35
1000
3.42
46.91
0.872
368.6
98.02
As described before, an increase in Rct is due to the adsorption of berberine on the MS surface. A decrease in CPE may be initiated by a decrease in the dielectric constant or an increase in the thickness of the electric double layer due to the adsorption of berberine molecules of large size (Bentiss et al., 1999). Rct and CPE changes may be ascribed to the gradual replacement of water dipoles by the berberine molecules on the metal surface, which decelerates the rate of metal dissolution (Quraishi and Ansari, 2003).
3.6 Surface analysis
SEM and EDX were employed to get the information about the surface morphology and composition of the MS surface immersed in 1.0 M H2SO4 without and with berberine for 24 h. The bare surface appears highly porous with deep and large cracks due to the high rate of dissolution, and surface composition shows mostly iron (Fig. 9a). However, the surface is relatively smooth by forming the protective film after 24 h of immersion in berberine with 400 and 1000 ppm, as shown in Fig. 9b and 9c. Berberine molecules protect the MS surface by forming such a protective layer. The percentage composition of different elements present in the MS surface is listed in a supplementary table S4. There is a decrease in iron content and an increase in N, C, and O on MS surface immersed in 1.0 M H2SO4 with berberine. The information again confirms the formation of the protective film due to the adsorption of berberine on MS surface, which inhibits the iron dissolution.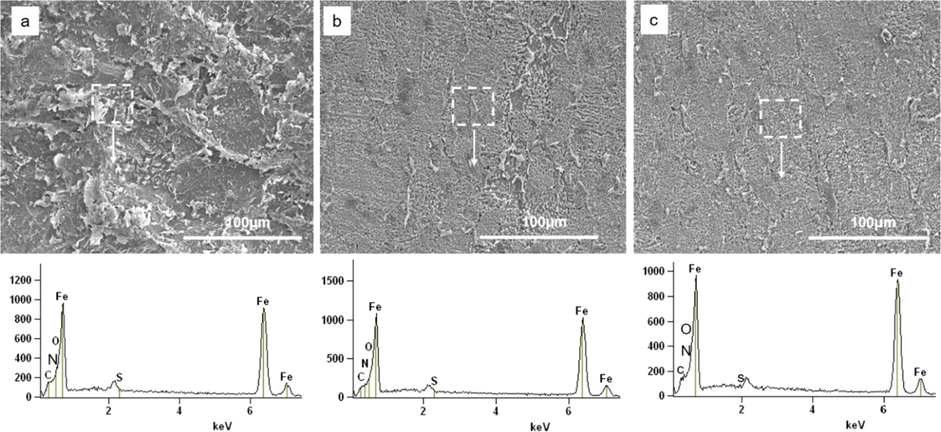
SEM images and corresponding EDX spectra of mild steel specimen after 24 hrs immersion in (a) 1.0 M H2SO4 (b) 400 ppm berberine solution in 1.0 M H2SO4 (c) 1000 ppm berberine solution in 1.0 M H2SO4.
3.7 Mechanism of inhibition
Corrosion inhibition of metals by organic compounds can be ascribed to the adsorption of large size molecules on the metal surface hence blocking the active site of the corrosion. The functionality of the molecules and heteroatoms present in them influence the effectiveness of the inhibition. The adsorption of inhibitors molecules is facilitated by the replacement of water dipoles from a metal surface according to:
Org(sol) represents the aqueous phase solvated organic molecules, Org(ads) is the organic molecules adsorbed onto the metallic surface. Similarly, H2O(ads) is the water molecule adsorbed on the metal surface, where (x) is the size ratio representing the number of water molecules replaced by one organic molecule. The Gibb's free energy of adsorption (-35.05 kJ/mol) and energy of activation (43.19 kJ/mol) revealed that the adsorption of berberine on mild steel involves both physical and chemical interactions.
The OCP of MS with berberine was recorded to be around −0.43 V. The potential of zero charge (PZC) of MS in sulfate solution has been reported to be negative compared to OCP value (Qiang et al., 2018). An OCP value nobler than PZC can result in positively charging the metal surface. Therefore, the inhibitor molecules in acidic solution having acquired positive charge due to abstraction of a proton by lone pair of oxygen and nitrogen may get electrostatically adsorbed on the negatively charged metal surface due to SO42−(ads).
Berberine contains an amino group, and amino nitrogen can be protonated and bears a positive charge in acidic solution. Due to a small degree of hydration, sulfate radicals can be adsorbed on a positively charged MS surface, therefore making it negatively charged (Li et al., 2005; Sadeghi Erami et al., 2019). The positively charged berberine molecules might be adsorbed via electrostatic force of attraction with sulfate ion. The positively charged berberine may start competing with H+ ions for electrons initially on the MS surface in acid solution. But berberine returns to its neutral form after releasing H2 molecules. Then, vacant d-orbital of iron may interact with the highest occupied molecular orbital (HOMO) of the berberine molecule to form a coordinate bond (donor–acceptor) (Qiang et al., 2018; Sadeghi Erami et al., 2019). In the berberine molecule, the bonding π-orbital of cycles 1 and 2 (shown in Fig. 10) having a more significant electron density can act as HOMO (Li et al., 2005).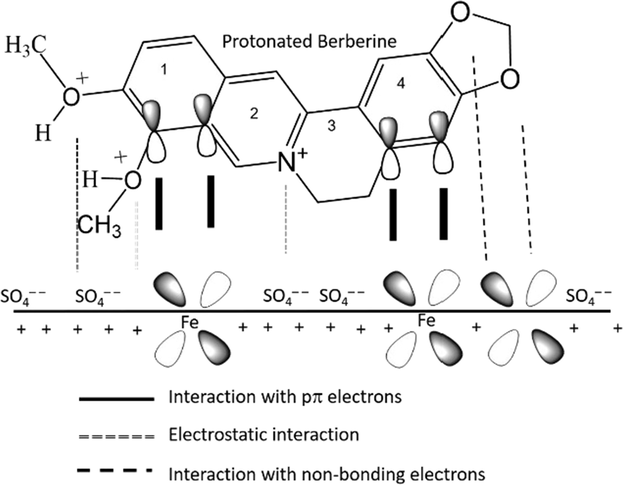
The Schematic illustration of different modes of adsorption of the berberine molecule on mild steel/1.0 M H2SO4 interface.
The donor–acceptor bonding makes the MS surface accumulates extra negative charge; therefore, iron may give back electrons to the lowest unoccupied molecular (LUMO). The LUMO is the vacant π* (antibonding) orbital of inhibitor molecules. In the berberine molecule, antibonding π* orbital of cycles 2, 3, and 4 (shown in Fig. 10) having larger orbital density can act as LUMO (Li et al., 2005; Sadeghi Erami et al., 2019). The formation of a feedback bond (retro-donation) further strengthens the adsorption of a molecule on the metal surface.
Fig. 10 shows a simple inhibition mechanism of molecule of berberine on the MS sample. The presented molecular interactions were illustration without proper theoretical calculation.
4 Conclusion
Berberine, a non-toxic compound isolated from methanol extract of Mahonia nepalensis performs as an effective and thermally stable corrosion inhibitor for macroscale corrosion of MS in the 1.0 M H2SO4 solution. It gives above 91% efficiency in 15 min in 1000 ppm solution and an extremely high inhibition efficiency of 97.2% at 328.15 K (55.0 °C). The inhibition efficiency (IE) increases with increased berberine concentration, giving a maximum efficiency of 98.19% in 1000 ppm solution. The adsorption of berberine on the MS surface follows the Langmuir adsorption isotherm. Values of ΔG° (-35.05 kJ/mol) and Ea (43.19 kJ/mol) indicate the spontaneous adsorption of berberine molecules on the MS surface by both physical and chemical interaction. The difference in the value of ΔH* and Ea (Ea – ΔH* = 2.64 kJ/mol) nearly equals to RT indicates that the corrosion process is unimolecular and kinetically controlled. The adsorption process is endothermic (positive value of ΔH*) and occurs by increased randomness in the transition state in the presence of berberine molecules (positive ΔS* value). The marginal change of OCP shows the inhibitor is a mixed type. Parallel cathodic Tafel slopes with the concentration of berberine reveal no shift of cathodic reaction mechanism and that corrosion inhibition is due to the formation of a protective layer by adsorbed berberine molecules, which suppressed the hydrogen reduction reaction. The EIS results also indicate no change in reaction mechanism by showing only one time constant in all the berberine concentrations. EDX and SEM confirm the formation of a protective film of berberine on MS surface that inhibits the corrosion. The high thermal stability of the berberine molecules makes it a promising candidate for applications in corrosion products removal for weight-loss measurements and acid pickling.
Acknowledgements
N. Karki would like to acknowledge the Nepal Academy of Science and Technology (NAST) for Ph.D. grants. Thanks to Prof. V.S. Raja and staff, Indian Institute of Technology, Bombay, India, for helping with EIS measurements and surface analysis by SEM-EDX.
Declaration of Competing Interest
The authors declare that they have no known competing financial interests or personal relationships that could have appeared to influence the work reported in this paper.
References
Appendix A
Supplementary material
Supplementary data to this article can be found online at https://doi.org/10.1016/j.arabjc.2021.103423.
Appendix A
Supplementary material
The following are the Supplementary data to this article:


