

Translate this page into:
Characterization of metabolism feature and potential pharmacological changes of morusin-a promising anti-tumor drug-by ultra-high-performance liquid chromatography coupled time-of-flight mass spectrometry and network pharmacology
⁎Corresponding author. hqyylrm@126.com (Rui-man Li)
-
Received: ,
Accepted: ,
This article was originally published by Elsevier and was migrated to Scientific Scholar after the change of Publisher.
Abstract
Morusin, a prenylated flavone isolated from Morus species, was treated as a potential anti-tumor drug since it inhibited effects on numerous types of human cancer cells. In some sense, drugs-related metabolites always contribute to pharmacological changes, inducing therapy improvement, reduced efficacy, or side-effects. Thus, the characterization of metabolites and the potential functions exerted great importance in clinical applications. Till now, the metabolism feature of morusin was still unclear, and its pharmacological changes were still unconducted, too. In this work, an integrated strategy based on metabolites profiling and network pharmacological was applied to characterize the metabolism feature and reveal pharmacological changes of morusin in vivo. As a result, a total of 31 metabolites (19 in plasma, 8 in urine, 30 in feces, 6 in heart, 17 in liver, 4 in spleen, 6 in lung, 6 in kidney, and 3 in brain) were screened out in rats, and 11 of them were characterized for the first time. Among them, metabolites M6, M18, M19, M20, and M28, were the main metabolites. Phase I metabolic reactions of hydroxylation, dehydrogenation (cyclization), isomerization and phase II reactions of glucuronidation occurred, and glucuronidation and hydroxylation were the two main metabolic reactions. Moreover, the pharmacological difference between morusin and five main metabolites was predicted by an network pharmacological method, and these 6 candidates targeted 177 targets. Meanwhile, in addition to common pathways (PI3K-Akt signaling pathway, proteoglycans in cancer, hepatitis B, cAMP signaling pathway, and viral carcinogenesis) of morusin in cancer, six metabolites’ targets were involved in prostate cancer, chemokine signaling pathway, ras signaling pathway and neuroactive ligand-receptor interaction, indicating that these functional changes might result in novel pharmacological mechanism and new indications. Our work provided the metabolism feature and functional modifications of morusin in vivo for the first time, and meaningful information for further pharmacological validations or potential indications in clinic were supplied.
Keywords
Morusin
Metabolism feature
Network pharmacology
UHPLC-Q/TOF MS
Pharmacological changes

- ADME
-
absorption, distribution, metabolism and excretion
- UHPLC-Q/TOF MS
-
ultra-high-performance liquid chromatography time-of-flight mass spectrometry
- TCM
-
traditional Chinese medicine
Abbreviations
1 Introduction
Traditional Chinese medicine (TCM) attracted world attention since its definite effects on chronic diseases, such as diabetes mellitus (Cao et al., 2020). Meanwhile, oral administration was the primary way to access patients in clinical (Zhang et al., 2018b). The constituents in TCM are usually absorbed into the circulatory system as the format of prototypes or metabolites after consumption, contributing to therapy or side effects (Zhang et al., 2020b, 2020c). Thus, characterizing xenobiotics in vivo and subsequent induced functional changes of TCM after consumption was of great importance to its clinical applications.
With the development of liquid chromatography (LC) and mass spectrometry (MS), high-resolution mass spectrometry (HRMS) was devised to profile and characterize the trace constituents in different types of samples since its higher sensitivity and resolution than before. Nowadays, it was widely used in the field of herbs, or traditional chinse medicine preparations (TCMs) in vitro or in vivo to profile chemical constituents and metabolites, such as Scutellariae Radix (Zhang et al., 2020d), Forsythiae Fructus (Zhang et al., 2020a), Periplocae Cortex (Li et al., 2020), Shuang-Huang-Lian oral liquid (Zhang et al., 2018a), etc. It was found that metabolite profiling gave the chemical structure and exposure information of metabolites in vivo, and this data was helpful in further target prediction analysis. Network pharmacology, with the advantages of systematically revealing the pharmacological index and functional basis of the complex system, was expansively applied in the field of TCM, such as Chai-Hu-Shu-Gan in non-alcohol fatty liver disease (Nie et al., 2020) and Lian-Hua-Qing-Wen in COVID-19 (Zheng et al., 2020). Notably, the combination of metabolite profiling and network pharmacology effectively revealed the potential pharmacological mechanism since the constituents in vivo were revealed with potential pharmacological functions. This was useful and meaningful in the pre-clinical application. In our previous work, this strategy was successfully applied to characterize the functional changes of arctiin and SDG in vivo based on HRMS technology and network pharmacology (Zhang et al., 2020b, 2020c).
Morusin (Fig. 1), a prenylated flavone, was isolated from the branch and root bark of various Morus species, which possesses diverse pharmacological activities, such as anti-tumor (Kim et al., 2016), antibacterial (Sohn et al., 2004), anti-inflammatory activities (Lee et al., 2014), etc. More attention, in recent years, has been paid to morusin since its excellent anti-tumor activity. It was found that morusin exhibited obvious cytotoxicity against various types of human cancer cells, including lung carcinoma (Wang et al., 2020), renal cell carcinoma (Yang et al., 2020), hepatocellular carcinoma (Gao et al., 2017), colorectal cancer (Lee et al., 2008), cervical cancer (Wang et al., 2013), breast cancer (Kang et al., 2017), prostate cancer (Lim et al., 2015), etc. Commonly, good ADME (absorption, distribution, metabolism and excretion) parameters and pharmacological properties are essential and vital to the clinical application of a natural product (Lin et al., 2006). Till now, the metabolism feature of morusin in vitro (Hou et al., 2018; Shi et al., 2016) and pharmacokinetics of morusin in rats (Liu et al., 2019) were conducted, revealing that morusin could be absorbed into the circulatory system with Tmax of 1.33 ± 2.06 h and cleaned up with t1/2 of 8.46 ± 3.17 h. Accordingly, the metabolites with glucuronide conjugates were presented in plasma and subsequently eliminated after relatively long exposure. To date, the metabolism character of morusin in rats was not summarized, and the functional changes induced by metabolites were not revealed.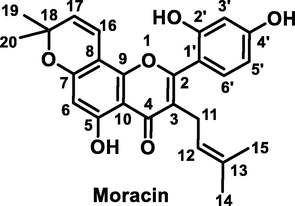
Chemical structure of morusin.
In this work, a strategy based on the UHPLC/Q-TOF MS method and network pharmacology was applied to characterize the metabolites of morusin and reveal their pharmacological changes in vivo.
2 Material and methods
2.1 Materials
Morusin was purchased from Chengdu Push Bio-Technology Co., Ltd. (Chengdu, China), and its purity was more than 98% HPLC grade. Water, methanol and ethanol were HPLC grade. LC-MS grade acetonitrile and water were obtained from Fisher Scientific (Fair Lawn, New Jersey, USA). LC-MS grade formic acid was purchased from Sigma-Aldrich (St. Louis, USA).
2.2 Animals and drug administration
Specific pathogen-free (SPF) male adult Sprague-Dawley rats (200–220 g) were obtained from Jinan Pengyue Experimental Animal Breeding Co. Ltd (Jinan, China). Rats were housed at an ambient temperature of 20 ± 2 °C with 12-h light/dark cycles for two weeks, and in the meantime, a standard diet and water were free to rats. Before drug investigation, rats were fasted in metabolic cages separately for 12 h to avoid food interference. The animal protocols were approved with the Guide for the Care and Use of Laboratory Animals of Jinan University, and procedures were following Guide for the Care and Use of Laboratory Animals (National Institutes of Health).
Twelve rats were classified into two groups, including a control group (n = 3) and three morusin groups (n = 3). Three morusin groups were set up according to three time-points post dosage, including 0.5 h, 1 h, and 2 h group (n = 3). Rats in morusin groups were administrated with morusin at a dosage of 30 mg/kg/day; the equal volume of water was administrated to rats in the control group. Morusin was weighed and suspended in oil at a final concentration of 7.5 mg/mL.
2.3 Sample collection and pretreatment
Plasma: The rats (n = 9) were administrated with morusin (30 mg/kg/day) for three days. On Day 3, rats were anesthetized by intraperitoneal injection of 10% aqueous chloral hydrate and sacrificed at 0.5, 1, and 2 h after the last ingestion. The blood samples were collected from the hepatic portal vein contained heparin sodium. Further, the blood samples were centrifugated at 13,000 rpm for 10 min (4 °C) to prepare plasma. The plasma at three time-points was mixed and further treated with acetonitrile at a ratio of 1:4 to precipitated protein. The supernatant was obtained after centrifugation at 13,000 rpm for 10 min (4 °C), and then, it was dried by nitrogen gas under room temperature. The residue was reconstituted in 300 μL 60% methanol-water (v/v), and further centrifugated at 13,000 rpm for 10 min (4 °C) to obtain supernatant for analysis.
Urine: During drug administration, urine was collected for 48 h post dose, and it was stored at −80 °C before pretreatment. For pretreatment, urine samples (10 mL) were thawed and subsequently centrifuged at 13,000 rpm for 10 min (4 °C), and 2 mL supernatant was directly loaded on a pre-activity HLB column (6 cm3, 200 mg, Waters Oasis, Ireland). Then, it was orderly eluted by 6 mL of 5% methanol and 6 mL of methanol. The methanol eluate was collected and dried by nitrogen gas under room temperature. The residue was reconstituted in 300 μL 60% methanol–water (v/v), and further centrifugated at 13,000 rpm for 10 min (4 °C) to obtain supernatant for analysis.
Feces: During drug administration, feces were collected for 48 h post dose, and it was dried under room temperature. Then, feces (10 g) were extracted by methanol and subsequently centrifuged at 13,000 rpm for 10 min (4 °C). The supernatant was obtained and dried by nitrogen under room temperature; further, they were reconstituted by water. The reconstituted samples were centrifuged by the same method, and 2 mL supernatants were directly loaded on a pre-activity HLB column (6 cm3, 200 mg, Waters Oasis, Ireland). Then, they were eluted by 6 mL of 5% methanol and 6 mL of methanol successively. The methanol eluate was collected and dried by nitrogen gas under room temperature. The residue was reconstituted in 600 μL 60% methanol–water (v/v), and further centrifugated at 13,000 rpm for 10 min (4 °C) to obtain supernatant for analysis.
Heart, spleen, brain, lung, and liver: The organs (liver, heart, spleen, lung, kidney, and brain) were subsequently obtained after blood collection, and they were washed by normal saline until there was no blood. Then, they were stored at −80 °C before pretreatment. For the pretreatment, organs were thawed and weighted. Then, 2 g of tissues were homogenized by adding 2 mL normal saline and subsequently treated with acetonitrile at a ratio of 1:4 to precipitate protein. After centrifugation at 13,000 rpm for 10 min (4 °C), the supernatant was obtained and dried by nitrogen gas under room temperature. The residue was reconstituted in 300 μL 60% methanol–water (v/v), and further centrifugated at 13,000 rpm for 10 min (4 °C) to obtain supernatant for analysis.
The above samples were detected by UHPLC/Q-TOF MS equipment with an injection volume of 2 μL, and three replicates were conducted. The collected MS information was analyzed by Masslynx 4.1 (Waters, USA).
2.4 Instrumentation and conditions
A Waters AcquityTM ultra-performance LC system (Waters, Milford, USA) coupled with an Acquity UPLC BEH C18 Column (2.1 × 100 mm, 1.8 μm, Waters, Milford, USA, held at 35 °C) was used for chromatographic separation. Two solvent mobile phases system consisted of eluent A (0.1% formic acid in water, v/v) and eluent B (0.1% formic acid in acetonitrile, v/v) was used for separation, and the flow rate was set as 0.4 mL/min by using a linear gradient program. Detail information was listed as follows: 0–1.0 min, 5% B; 1.0–7 min, 5–70% B; 7–13 min, 70–100% B; 13–15 min, 100% B; 15–16 min, 100–5% B; 16–17 min, 5% B.
A Waters Xevo™ G2-XS QTOF (Waters, Manchester, UK) connected to the UPLC system via an ESI interface was used for profiling the substances. The optimal conditions were set as follows: ESI− mode, the capillary voltage was 3 kV, sampling cone voltage 35.0 V, and extraction cone voltage 4.0 V, respectively. The temperature was set at 100 °C, the desolvation gas temperature at 300 °C, and the desolvation gas flow rate at 800 L/h, respectively. The full scan MSE data, in centroid mode, was acquired across the mass range of 50–1200 Da. During data acquisition, the mass was corrected using an external reference (Lock-SprayTM) comprising a 200 pg/mL solution of leucine enkephalin via a lockspray interface, generating a reference ion at m/z 554.262 Da ([M−H]−) under the negative ion mode and m/z 556.277 Da under positive ion mode, respectively.
2.5 Target network analysis
The targets (Homon species) were retrieved and collected from two online target prediction platforms-Swiss Target Prediction (http://www.swisstargetprediction.ch) (Daina et al., 2019) and Similarity Ensemble Approach (SEA, http://sea.bkslab.org/) (Keiser et al., 2007). The protein-protein interactions (PPIs) were achieved by STRING database (version 11.0, https://string-db.org/) (Szklarczyk et al., 2019), and protein interactions, with a confidence score >0.7, were obtained after eliminating duplicates. The chemical constituent-target networks and protein-protein interactions (PPIs) networks were constructed and viewed by Cytoscape software (version 3.2.1) (Shannon et al., 2003). The network was analyzed by default setting with “degree” value. All proteins/genes were subjected to pathway enrichment analysis (KEGG analysis) using the DAVID Bioinformatics resources 6.7 databases (Huang et al., 2009).
3 Results and discussion
3.1 Fragmentation pathways of morusin
Before screening the metabolites of morusin in vivo, its mass fragmentation behaviors were summarized. As shown in Fig. 2a, it was found that morusin (C25H24O6) presented obvious [M−H]− at m/z 419.1498 and [M+H]+ at m/z 421.1651, respectively. Under positive ion mode, the prominent ion at m/z 365.1027 [M+H-C4H8]+ was produced by losing C4H8 via the ortho effect at the C-11 position (Fig. 2b). Subsequently, losses of H2O, CO, and CH3 resulted in fragments at m/z 347.0919 [M-H-C4H8-H2O]+, 337.1075[M-H-C4H8-CO]+, and 350.0788[M-H-C4H8-CH3]+, respectively. It was found that m/z 350 could lose H2O to produce m/z 332.0681[M-H-C4H8-CH3-H2O]+. Fragment ion m/z 337 could orderly lose CH2, CO, and CH4 to produce m/z 323.0920[M-H-C4H8-CO-CH2]+, 295.0973[M-H-C4H8-CO-CH2-CO]+, and 279.0653[M-H-C4H8-CO-CH2-CH4]+.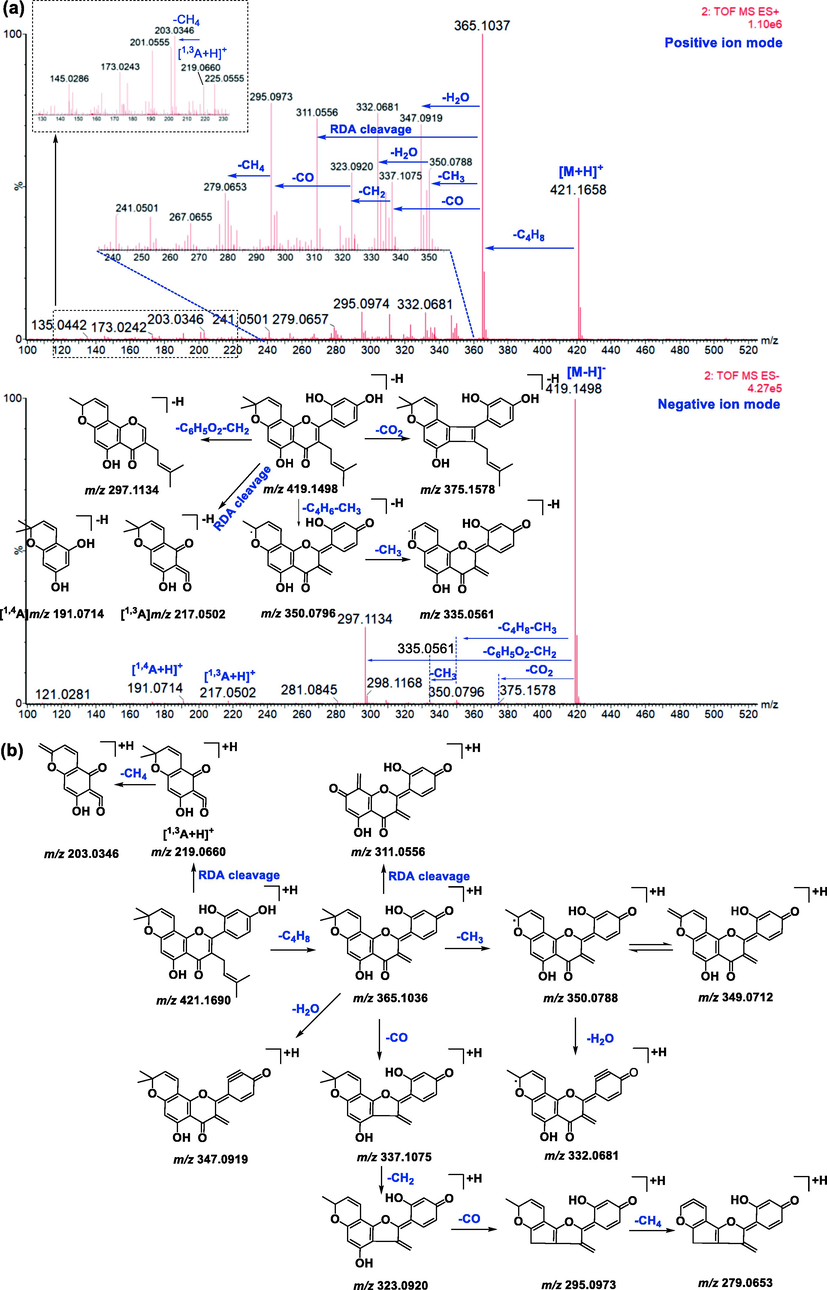
Proposed mass fragmentation behaviors of morusin.
Under the negative ion mode, the prominent ion at m/z 350.0796 [M-H-C4H6-CH3]− was produced by the loss of C4H8 via the ortho effect at the C-11 position and CH3 at C-18 position. The subsequent loss of CH3 from m/z 350 resulted in fragments at m/z 335.0561 [M-H-C4H6-CH3]−. It was found that morusin could lose CO2 to produce a fragment at m/z 375.1578[M-H-CO2]−. Meanwhile, the B ring was also lost and resulted in a fragment at m/z 309.1138 [M-H-C6H6O2]− (Ding et al., 2017), and subsequent loss of CH3 resulted in m/z 297.1132. However, the response value of m/z 309 was weak. Simultaneously, two minor ions at m/z 217.0502 [1,3A-H]− and 191.0714 [1,4A-H]− were also detected, owing to RDA fragmentation at the 1,3-position and 1,4-position of the C-ring, respectively (Fig. 2a).
It was found that mass fragment ions of morusin were richer under positive ion mode than negative ion mode. Although the fragments under negative ion mode were few, the deprotonated ions were obvious under this condition, and it was used as a complementary material for identification. Then, the mass spectrometry information under both the positive and negative ion modes was used to screen out and characterize morusin-related metabolites.
3.2 Characterization of morusin-related metabolites in rats
Base on the metabolite prediction platform and diagnostic ion extraction method reported in previous work (Zhang et al, 2018b), morusin-related metabolites were quickly screened out and further characterized with the help of MS information. The detailed parameters used in Metabolynx platform were showed in Fig. S1 Table S1. As a result, a total of 31 morusin-related metabolites were characterized in rats, including 19 in plasma, 8 in urine, 30 in feces, 6 in heart, 17 in liver, 4 in spleen, 6 in lung, 6 in kidney, and 3 in brain (Table 1, Fig. 3). Among them, dehydroxylation and glucuronidation were the main metabolic reactions of morusin in vivo. As compared to reported work (Shi et al., 2016; Hou et al., 2018), 11 metabolites (M1/M3/M8/M10/M11/M14/M22/M23/M24/M26/M29) were characterized in morusin-related metabolites for the first time. Moreover, it was the first time to characterize the metabolites of morusin in rat heart, spleen, lung, kidney and brain. Notes: P-plasma, U-urine, F-feces, H-heart, S-spleen, Li-liver, Lu-lung, K-kidney, B-brain.
No
RT(min)
MS/Error(ppm)
Formula
MS fragments
Characterization
Origin
M0
8.65
[M+H]+:421.1651(0.0)
[M−H]−:419.1504(−2.2)C25H24O6
MS+:365.1027, 350.0782, 347.0916, 337.1060, 232.0913, 311.0554, 295.0970
MS−:375.1578, 350.0796, 297.1134, 217.0502, 191.0714morusin
P, U, F, Li, H, S, Lu, K, B
M1
4.40
[M+H]+:773.2289(−0.5)
C37H40O18
MS+:597.1970, 421.1653, 365.1036
morusin-di-glucuronide
P, U, F, H
M2
4.89
[M+H]+:613.1934(2.1)
C31H32O13
MS+:437.1601, 381.0982, 311.0558
morusin + O + glu A (Hou et al., 2018)
F, Li
M3
5.32
[M+H]+:773.2289(−0.5)
C37H40O18
MS+:597.1970, 421.1653, 365.1036
morusin-di-glucuronide
F
M4
5.56
[M+H]+:597.1983(1.8)
C31H32O12
MS+:421.1643, 365.1021, 295.0890 MS−:419.1499, 297.1136
morusin glucuronide (Hou et al., 2018)
P, F, Li, Lu
M5
5.62
[M+H]+:453.1550(−0.2)
C25H24O8
MS+:435.1445, 379.0814
morusin + 2O (Shi et al., 2016)
F, Li
M6
5.75
[M+H]+:613.1924(0.5)
[M−H]−:611.1784(3.1)C31H32O13
MS+:437.1593, 381.0965
MS−:435.1481, 191.0756morusin + O + glu A (Hou et al., 2018)
P, U, F, Li, Lu, K, B
M7
5.92
[M+H]+:613.1935(2.3)
[M−H]−:611.1754(−1.8)C31H32O13
MS+:595.1827, 419.1514, 363.0887
MS−:435.1742, 191.0739morusin + O + glu A (Hou et al., 2018)
P, F
M8
5.92
[M+H]+:595.1811(−0.8)
C31H30O12
MS+:419.1485, 363.0865
morusin-2H + glu A
P, F, Li
M9
6.07
[M+H]+:613.1915(−1.0)
[M−H]+:611.1732(−5.4)C31H32O13
MS+:437.1591, 381.0968
MS−:435.1407, 191.0758morusin + O + glu A (Hou et al., 2018)
F
M10
6.11
[M+H]+:595.1804(−2.0)
C31H30O12
MS+:419.1490, 363.0869
morusin-2H + glu A
P, F, Li
M11
6.20
[M+H]+:595.1807(−1.5)
C31H30O12
MS+:419.1484, 363.0844
morusin-2H + glu A
P, F
M12
6.20
[M+H]+:613.1921(−1.5)
[M−H]−:611.1714(−8.3)C31H32O13
MS+:437.1605, 381.0993
MS−:435.1448, 191.0741morusin + O + glu A (Hou et al., 2018)
P, F
M13
6.31
[M+H]+:453.1551(0.4)
C25H24O8
MS+:435.1440, 379.0800
morusin + 2O (Shi et al., 2016)
F, Li
M14
6.37
[M+H]+:595.1816(0.0)
C31H30O12
MS+:419.1494, 363.0858
morusin-2H + glu A
F, Li
M15
6.37
[M+H]+:613.1921(−1.5)
[M−H]−:611.1759(−1.0)C31H32O13
MS+: 437.1598, 381.0987
MS−:435.1411, 419.1438, 191.0732morusin + O + glu A (Hou et al., 2018)
P, F, Li
M16
6.41
[M+H]+:453.1543(−1.3)
C25H24O8
MS+:435.1407, 379.0811
morusin + 2O (Shi et al., 2016)
Li
M17
6.74
[M+H]+:613.1927(1.0)
[M−H]−:611.1783(2.9)C31H32O13
MS+:437.1594, 381.0982
MS−:435.1457, 217.0515, 191.0706morusin + O + glu A (Hou et al., 2018)
F, Li
M18
6.99
[M+H]+:597.1978(1.0)
[M−H]−:595.1837(3.5)C31H32O12
MS+:421.1652, 365.1033 MS−:419.1503, 297.1158
morusin glucuronide (Hou et al., 2018)
P, U, F, Li, H, S, Lu, K, B
M19
7.05
[M+H]+:437.1606(1.4)
[M−H]−:435.1451(1.6)C25H24O7
MS+: 381.0910, 363.0869
MS−:405.1336, 313.1083morusin + O (Shi et al., 2016; Hou et al., 2018)
P, U, F, H, S, Lu, K, B
M20
7.13
[M+H]+:597.1964(−1.3)
[M−H]−:595.1840(4.0)C31H32O12
MS+: 421.1647, 365.1024, 347.0917, 311.0547
MS−:419.1499, 297.1136morusin glucuronide (Hou et al., 2018)
P, U, F, Li
M21
7.24
[M+H]+:597.1976(0.7)
C31H32O12
MS+:421.1264, 365.1024, 347.0917, 337.1105, 323.0894, 311.0547, 295.0934
morusin glucuronide (Hou et al., 2018)
P, F
M22
7.38
[M+H]+:595.1816(0.0)
[M−H]−:593.1681(3.7)C31H30O12
MS+:419.1491, 363.0870
MS−:417.1364, 191.0690dehydro-morusin + glu A
P, F, Li
M23
7.41
[M+H]+:579.1868(0.3)
C31H30O11
MS+:419.1487, 363.0888
dehydro-morusin + glu A-2H
P, F
M24
7.56
[M+H]+:595.1815(−0.2)
[M−H]−:593.1699(6.7)C31H30O12
MS+:363.0870
MS−:417.1356, 191.0712dehydro-morusin + glu A
P, F, Li
M25
7.66
[M+H]+:435.1438(−1.4)
C25H22O7
MS+:379.0810, 184.0740
morusin-2H + O (Shi et al., 2016)
F
M26
7.68
[M+H]+:593.1661(0.3)
C31H28O12
MS+:435.1445, 379.0810
morusin-2H + O + C6H6O5
F, K
M27
7.82
[M+H]+:435.1448(0.9)
[M−H]−:433.1308(4.8)C25H22O7
MS+:379.0810,184.0737
morusin-2H + O (Shi et al., 2016)
F
M28
8.13
[M+H]+:437.1606(1.4)
[M−H]−:435.1457(3.0)C25H24O7
MS+:419.1495, 363.0874
MS−:191.0717morusin + O (Shi et al., 2016; Hou et al., 2018)
U, F
M29
9.00
[M+H]+:421.1645(−1.4)
C25H24O6
MS+:365.1016, 350.0798, 349.0721, 347.0918, 337.1055, 332.0687
isomers of morusin
F
M30
9.88
[M+H]+:419.1486(−2.1)
[M−H]−:417.1324(−3.4)C25H22O6
MS+:363.0861, 348.0624, 347.0548, 345.0785
MS−:373.1416morusin-2H (Shi et al., 2016)
P, U, F, Li, H, S, Lu, K
M31
10.14
[M+H]+:419.1493(−0.5)
[M−H]−:417.1323(−3.6)C25H22O6
MS+:363.0869, 348.0627, 347.0556, 345.0756
MS−:373.1500morusin-2H (Shi et al., 2016)
P, U, F, Li, H, S, Lu, K
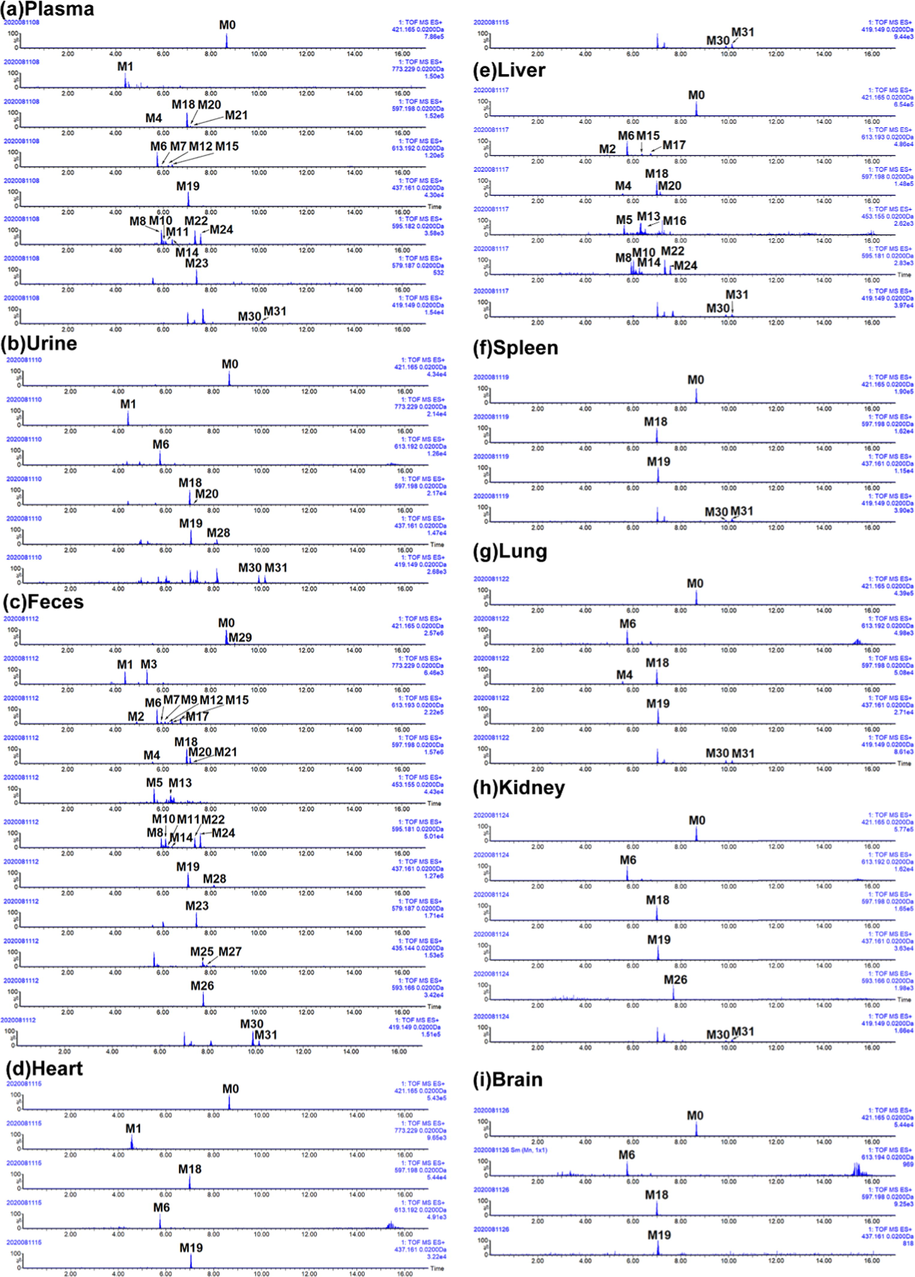
Extracted ion chromatography (EIC) of morusin and its metabolites in rats. (a) plasma, (b) urine, (c) feces, (d) heart, (e) liver, (f) spleen, (g) lung, (h) kidney, and (i) brain.
3.2.1 Phase II reaction
Glucuronidation: Six metabolites were the glucuronidation products of morusin, including M1, M3, M4, M18, M20, and M21. M1/M3 presented [M+H]+ at m/z 773.2289(C37H41O18), and fragment ions at m/z 421.1653 and 365.1036, which was the same as morusin, indicated that M1/M3 had the parent structure of morusin. As compared to morusin, M1/M3 gained an additional C12H16O12 group. Meanwhile, the fragment at m/z 597.1970 [M+H-C6H8O6]+ and m/z 421 [M+H-2C6H8O6]+ indicated that two glucuronides were attached to hydroxyls of morusin. Then, M1/M3 were characterized as morusin-di-glucuronide. M4/M18/M20/M21 both presented [M+H]+ 597.1983(C31H33O12), and the diagnostic ions of morusin were also found, including m/z 421.1643, 365.1021, 295.0890 (Fig. 4). As compared to morusin, M4/M18/M20/M21 had one C6H8O6 (176 Da) more than it. Then, these four metabolites were characterized as morusin glucuronide (Hou et al., 2018). However, only three hydroxyls could be attached, and it was hard to determine glucuronidation sites. Then, they were tentatively characterized.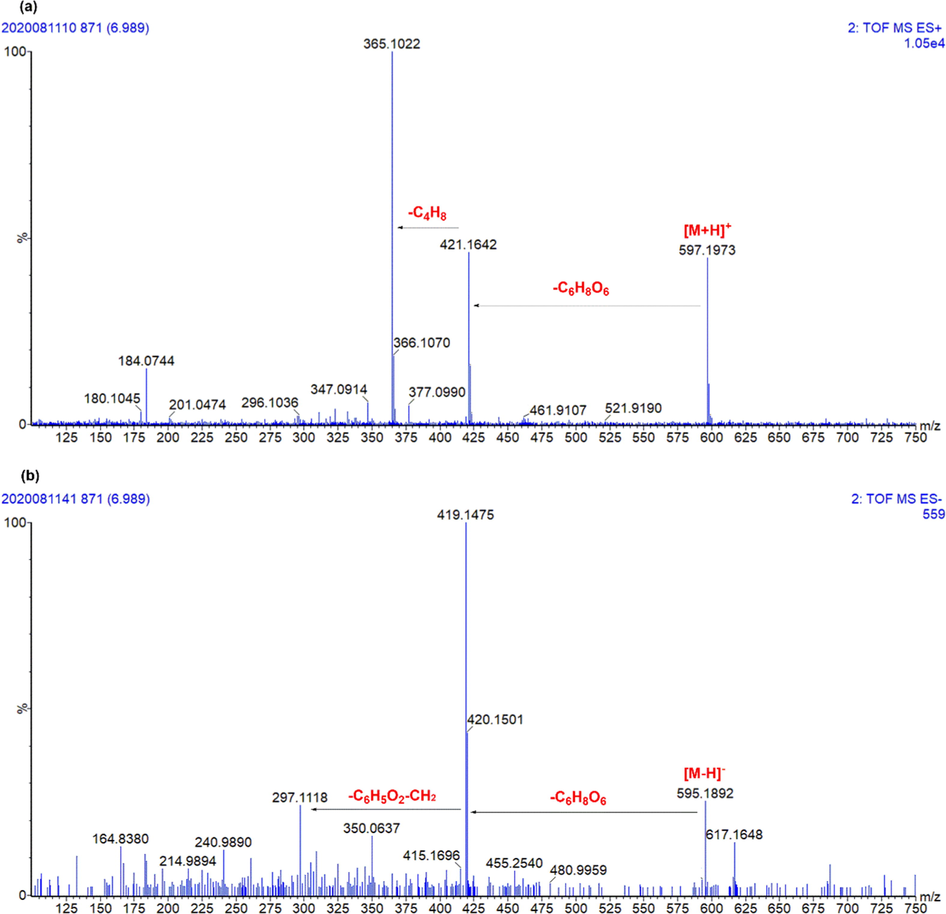
The representative chromatography of M18. (a) Positive ion mode; (b) Negative ion mode.
3.2.2 Phase I reactions
Isomerization: There was one metabolite (M29) had the same deprotonated ions (m/z 421.1645, [M+H]+) and fragments ions as morusin, such as m/z 365.1016, 350.0798, 349.0721, 347.0918, 337.1055, and 332.0687 under positive ion mode. M29 was eluted after morusin in reversed liquid chromatography, indicating that the polarity of M29 was lower than morusin. Meanwhile, a fragment ion at m/z 403.1514 [M+H-H2O]+ under positive ion mode indicated that M29 had o-hydroxyls. It was found that the Clog P value of morusin (ClogP = 5.81) was lower than its isomer with hydroxyls at C3′ and C4′ position (ClogP = 6.18). Then, M29 was tentatively characterized as morusin isomer with hydroxyls at C3′ and C4′ position.
Hydroxylation: Five metabolites (M5/M13/M16/M19/M28) only underwent hydroxylation were detected and characterized. M5/M13/M16 both had [M+H]+ at m/z 453.1543, and their fragment ions at m/z 435.1445, 379.0814 were produced by subsequently losing H2O and C4H8. As compared to morusin, they gained additional two oxygens. The fragment m/z 435 indicated that these metabolites could easily lose H2O, indicating that the attached hydroxlys were not stable when applied an energy. In previous work, hydroxylation on C-5′, C-12, and C-14 position was found (Shi et al., 2016). Three possible metabolites were predicted, including 5′, 12-dihydroxyl morusin, 5′, 14-dihydroxyl morusin and 12,14-dihydroxyl morusin. With the ClogP value (Cambridge, UK), M5/M13/M16 were tentatively characterized as 12,14-dihydroxyl morusin (ClogP = 3.41), 5′, 14-dihydroxyl morusin (ClogP = 3.42), and 5′, 12-dihydroxyl morusin (ClogP = 4.39), respectively. M19/M28 both presented the same [M+H]+ at m/z 437.1606 (C25H25O7) and [M−H]− at m/z 435.1451 (C25H23O7). As compared to morusin, they had one oxygen more than morusin, and then, they were characterized as hydroxylation products of morusin. Notably, fragments at m/z 381.0910 and 363.0869 indicated that there were two o-hydroxyls. As the reported metabolites of morusin in vitro (Shi et al., 2016), their fragmentation behavior and ClogP value, M19 and M28 were characterized as 11-hydroxyl morusin (ClogP = 4.15) and 5′-hydroxyl morusin (ClogP = 5.11), respectively.
Dehydrogenation: Two metabolites (M30/M31) were transformed from morusin only via dehydrogenation. They both presented in [M+H]+ at m/z 419.1486 and [M−H]− at m/z 417.1342, indicating their formula was C25H22O6. Notably, they had similar fragment behaviors as morusin, such as fragment ions produced by losing C4H8 (m/z 363.0861, [M+H-C4H8]+), CH3 (m/z 348.0624, [M+H-C4H8-CH3]+), and CO2 (m/z 373.1416, [M-H-CO2]−). As compared to morusin, metabolites M30/M31 lacked two hydrogens. In previous work (Shi et al., 2016), morusin could be transformed into dehydro-morusin by forming ring between hydroxyl in C-2 and C11 positions. However, there were two metabolites, and it was hard to determine. Thus, M30/M31 were tentatively characterized as dehydro-morusin.
Hydroxylation and Dehydrogenation: Two metabolites (M25/M27) were transformed from morusin via hydroxylation and dehydrogenation. They both had [M+H]+ at m/z 435.1438 and [M−H]− at m/z 433.1308, indicating a formula of C25H22O7. Moreover, they all presented fragment ions at m/z 379.0810 and 184.0737, which were produced by losing C4H8 and RDA cleavage. This meant that there were no additional attachments on C12-15 positions. As compared to the metabolites only transformed by hydroxylation or dehydrogenation, M25/M27 lacked two hydrogens than M19/M28 and gained one oxygen than M30/M31. Similarly, M19/M28 were predicted as the metabolites of M19/M28 by forming a ring between hydroxyl in C-2′ and C11 position.
Others: M26 presented [M+H]+ at m/z 593.1661 with a formula of C31H28O12. The fragment ions at m/z 435.1445 and 379.0810, produced by losing C6H6O5 and C4H8, were similar with M25/M27. We could not identify this attachment, and then, M26 was tentatively characterized dehydro-hydroxyl morusin+C6H6O5.
3.2.3 Metabolites with phase I and II reactions
Dehydrogenation and glucuronidation: There were six metabolites (M8/M10/M11/M14/M22/M24) were classified into group underwent dehydrogenation and glucuronidation. They both had [M+H]+ at m/z 595.188 with a formula of C31H30O12. The fragment ions at m/z 419.1485 and 363.0865 ere produced by losing C6H8O6 and C4H8 from m/z 595, were similar with M30/M31. As compared to M30/M31, M8/M10/M11/M14/M22/M24 gained additional C6H8O6, and they were characterized as glucuronidation products of M30/M31. It was hard to determine their glucuronidation sites, and then, they were tentatively characterized as dehydro-morusin glucuronide.
Hydroxylation and glucuronidation: Seven metabolites (M2/M6/M7/M9/M12/M15/M17) were sorted into groups underwent hydroxylation and glucuronidation. They were isomers since their same deprotonated ion at m/z 613.1934 with the formula of C21H32O13. The fragment ions at m/z 437.1601[M+H-C6H8O6]+, 381.0982[M+H-C6H8O6-C4H8]+, and 311.0558 were similar with M19/M28. The difference between M19/M28 and M2/M6/M7/M9/M12/M15/M17 was that the later gained additional C6H8O6 (176 Da). Thus, M2/M6/M7/M9/M12/M15/M17 were characterized as the glucuronidation products of M19/M28. Then, they were characterized as hydroxyl-morusin glucuronide.
3.3 Metabolites distribution and metabolism feature of morusin in vivo
For the metabolism feature, four main metabolic reactions were found, and they were mainly occurred at the position of C-11, C-4′, C-5′ and hydroxyls at C-5 and C-2′ position (Figs. 5, 6). Notably, methylation and sulfation, the other phase II reactions, were not found in morusin-related metabolites. This indicated that glucuronidation was the primary eliminated reaction for morusin.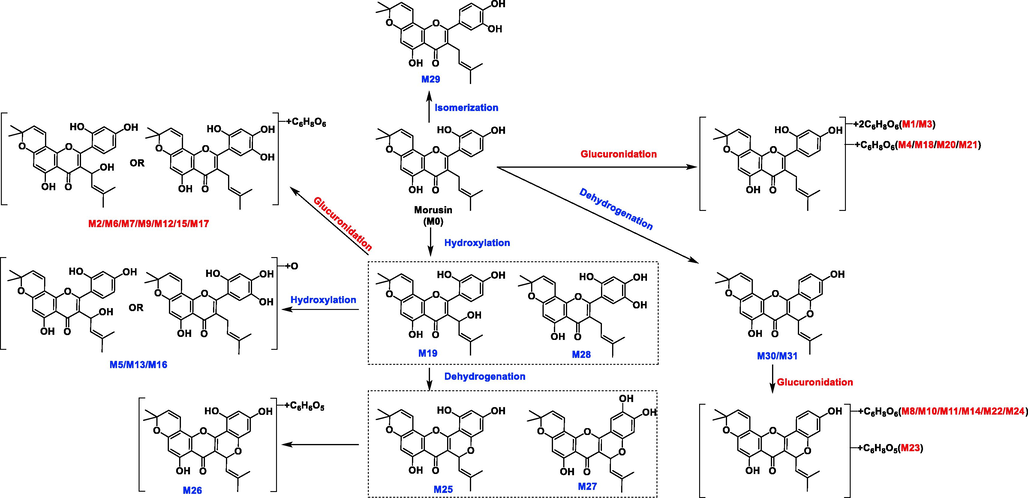
Summarized metabolism pathway of morusin in rats.
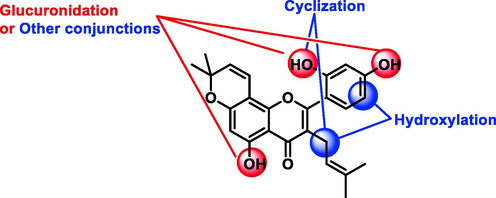
Metabolism sites of morusin.
Through summarizing the exposure of metabolites in rats’ different biosamples based on their peak area (Table S2, Fig. 7), it was found that most of the metabolites were found in rat plasma, liver and feces. It is well known that gut flora could transform the precursor to metabolites, and this transformation could also affect the composition of gut flora, probably resulting in the therapy or side-effects. As reported in previous work, it found that gut flora could affect the process of the tumor (Sethi et al., 2018). Meanwhile, the liver, containing the extensive enzyme system, was the prominent metabolic place. In consideration of the inhibition effects of morusin on hepatocellular carcinoma (Gao et al., 2017), the metabolites in liver might play functions. Moreover, through analyzing the peak area of metabolites in collected samples (Table S2), it was found that five metabolites (M6, M18, M19, M20, M28) had relatively higher values than the other metabolites. Then, these five metabolites were characterized as the main metabolites of moursin in rats.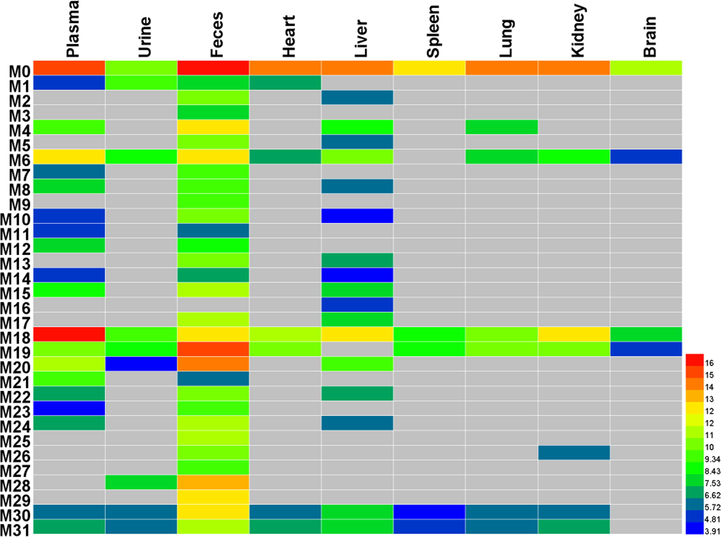
The heatmap of morusin and its metabolites in rats.
3.4 Targets information of morusin and its main metabolites
Generally, drugs always achieved therapeutic effects when they reached an effective therapeutic serum concentration. In our opinion, the metabolites with relatively higher exposure were more possible to achieve their effects. Thus, analyzing the major metabolites was more effective in elucidating the potential pharmacological changes. In this part, six compounds containing one prototype (P1) and five primary metabolites (M6, M18, M19, M20, M28) were selected to construct the pharmacological network since their high abundance in rats. Notably, analyzing them as whole could comprehensively show the potential pharmacological changes of moursin in vivo. A total of 177 targets of six compounds (P1, M6, M18, M19, M20, M28), with the probability of more than 0.1, were obtained in Swiss Target Prediction and SEA. Then, the compound-target network was constructed by using Cytoscape software. As shown in Fig. 8a, the network consisted of 183 nodes and 271 interactions. Among them, 49 overlapped targets were presented both in morusin and its metabolites, including MAPK3, MAPK1, MMP9, MMP2, PTGS2 and NFKB1 (Fig. 8a). Notably, the other 106 targets presented in metabolites were more than 22 additional targets in morusin, indicating the potential pharmacological changes will occur. Meanwhile, the protein-protein interaction network was also constructed (Fig. 8b-c). The main targets from PPI network were screened out by analyzing their degree value in the network, and proteins with a degree of more than 13 were collected. Among them, MAPK3, STAT3, SRC, MAPK1, MMP9, MMP2, PTGS2, HIG1A, RELA, ADAM17, NFKB1, HSP90AB1, MMP3, and RARP1 were the main targets of morusin (Fig. 8b), and the metabolites of morusin mainly targeted MAPK3, CASP3, MARPK1, HSP90AA1, MTOR, PIK3CA, ESR1, PTGS2, MMP9, APP, AR, RELA, MMP2, and KDR (Fig. 8c). The difference of targets between morusin and its two metabolites could result in the diverse mechanism pathways or functional changes of indications.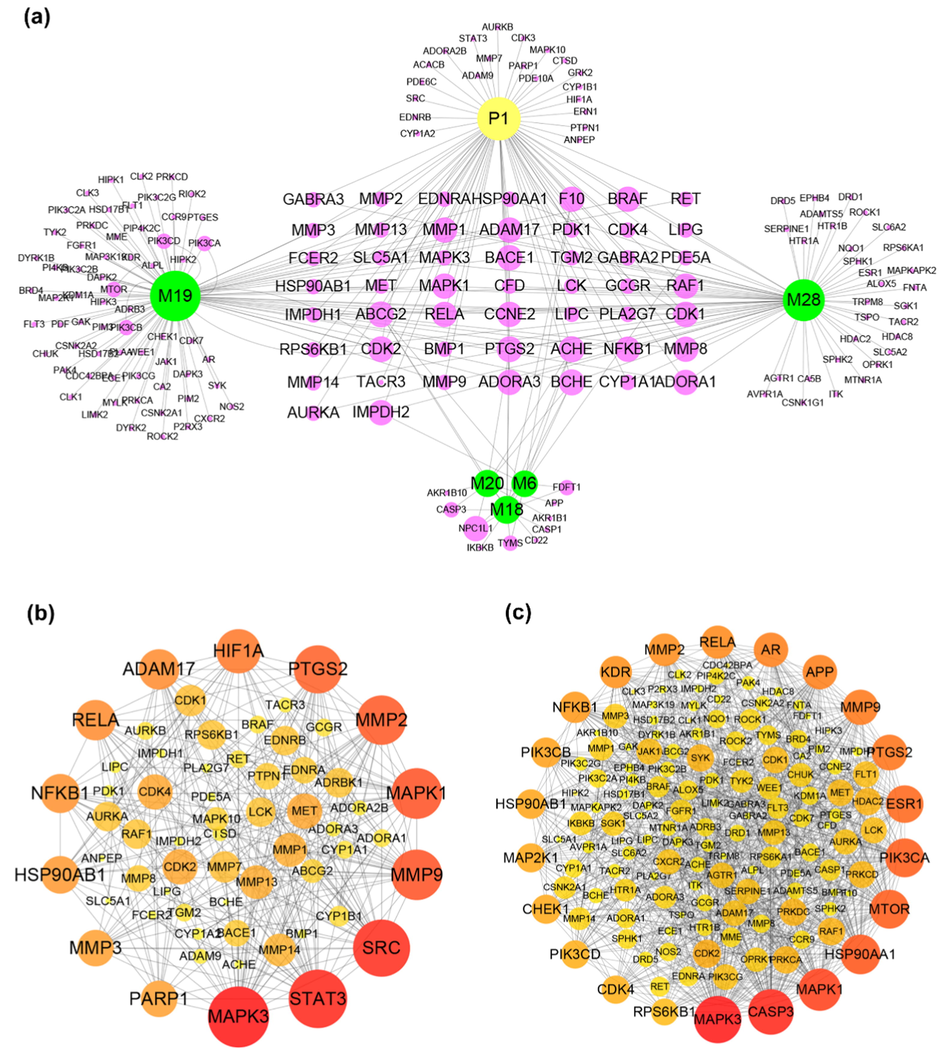
The target information of morusin and its metabolites. (a) The targets of morusin and its five main metabolites (M6, M18, M19, M20, M28); (b) Protein-protein interactions of targets of morusin; (c) Protein-protein interactions of targets of five main metabolites (M6, M18, M19, M20, M28). The size and color were correlated to the degrees of targets in network: the big size and deep color with purple means high degree of this target in PPI network.
KEGG Classification of target proteins: The relationship between target proteins and the pathways were analyzed by using the data extracted from DAVID database, and the top 10 pathways were screened according to the KEGG analysis with BH-corrected P-values less than 0.05. The results showed that the main target proteins of morusin were mainly involved in pathways in cancer, hepatitis B, proteoglycans in cancer, PI3K-Akt signaling pathway, bladder cancer, pancreatic cancer, TNF signaling pathway, sphingolipid signaling pathway, cAMP signaling pathway, viral carcinogenesis, and so on (Fig. 9a). Differently, the metabolites’ target involved in Prostate cancer, Chemokine signaling pathway, Ras signaling pathway and Neuroactive ligand-receptor interaction in addition to six common ones in morusin (Fig. 9b). This indicated that morusin might be used to treat prostate cancer with the functional changes caused by its metabolites.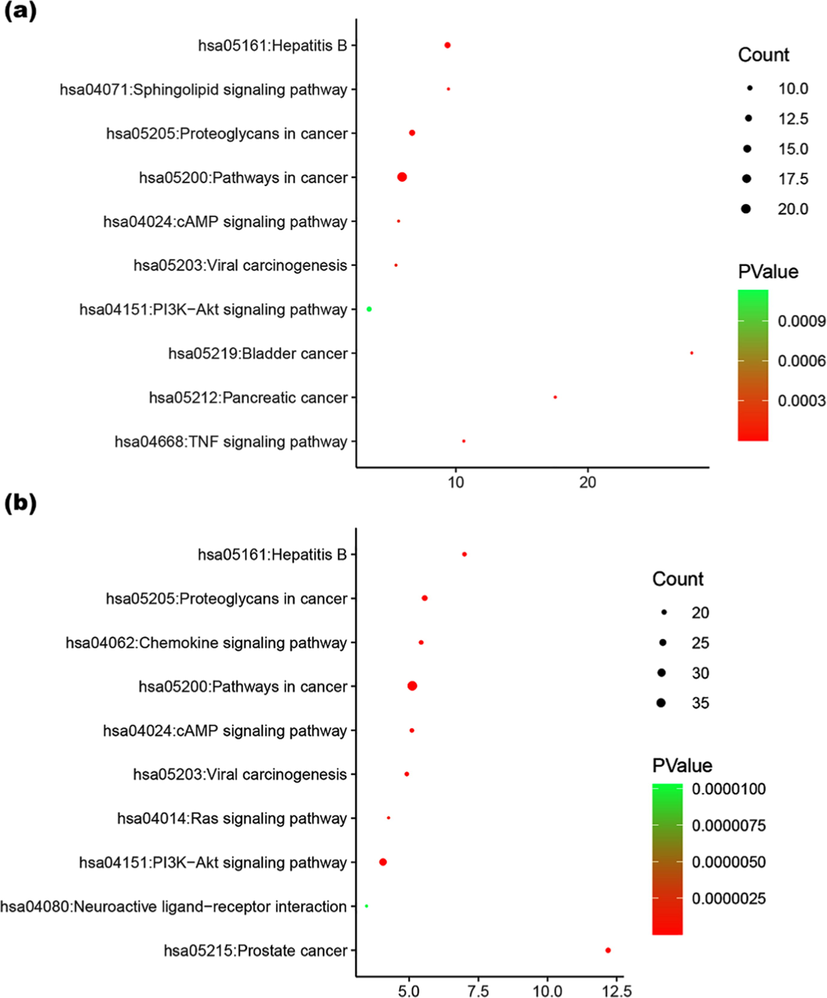
KEGG analysis of the target proteins of morusin (a) and its metabolites (b).
4 Conclusion
Drugs-orientated substances, in some sense, always contribute to pharmacological changes along with treatment, inducing therapy improvement, reduced efficacy, or side-effects, and characterization of metabolites and the potential functions exerted great importance in clinical applications. In this work, an integrated strategy based on metabolite profiling and network pharmacological was applied to characterize the metabolism feature and reveal pharmacological changes of morusin in vivo in order to demonstrate its pharmacological mechanism and potential indications. As a result, a total of 31 metabolites (19 in plasma, 8 in urine, 30 in feces, 6 in heart, 17 in liver, 4 in spleen, 6 in lung, 6 in kidney, and 3 in brain) were screened out and 11 of them were characterized for the first time. Among them, metabolites M6, M18, M19, M20, and M28, were the main metabolites. In the meantime, an optimized liquid chromatography method was also developed for further analysis of mourisn and its metabolties in vivo. Phase I metabolic reactions of hydroxylation, dehydrogenation, isomerization and phase II reactions of glucuronidation occurred, and glucuronidation and dehydrogenation were the two main metabolic reactions. Moreover, network pharmacology revealed that, in addition to common pathways (PI3K-Akt signaling pathway, proteoglycans in cancer, hepatitis B, cAMP signaling pathway, and viral carcinogenesis) of morusin in cancer, six metabolites’ targets involved in prostate cancer, chemokine signaling pathway, ras signaling pathway and neuroactive ligand-receptor interaction, indicating that these functional changes might result in novel pharmacological mechanism and new indications. Our work provided the metabolism feature and functional modifications of morusin in vivo for the first time, and meaningful information for further pharmacological validations or potential indications in clinic were supplied.
Acknowledgement
This work was supported by Science and Technology Planning Project of Guangdong Province of China (No. 2015B020233010).
Declaration of Competing Interest
The authors declare that they have no known competing financial interests or personal relationships that could have appeared to influence the work reported in this paper.
References
- Identification of potential bioactive compounds and mechanisms of GegenQinlian decoction on improving insulin resistance in adipose, liver, and muscle tissue by integrating system pharmacology and bioinformatics analysis. J. Ethnopharmacol., Ahead of Print. 2020
- [CrossRef] [Google Scholar]
- Swiss Target Prediction: updated data and new features for efficient prediction of protein targets of small molecules. Nucleic Acids Res.. 2019;47:W357-W364.
- [CrossRef] [Google Scholar]
- Rapid Analysis of Flavonoids Extraction from Mori Cortex by UPLC-Q-TOF-MS. Chin. J. Exp. Traditional Med. Formulae. 2017;23:78-84.
- [Google Scholar]
- Morusin shows potent antitumor activity for human hepatocellular carcinoma in vitro and in vivo through apoptosis induction and angiogenesis inhibition. Drug Des. Dev. Therapy. 2017;11:1789-1802.
- [CrossRef] [Google Scholar]
- UGT-mediated metabolism plays a dominant role in the pharmacokinetic behavior and the disposition of morusin in vivo and in vitro. J. Pharm. Biomed. Anal.. 2018;154:339-353.
- [CrossRef] [Google Scholar]
- Bioinformatics enrichment tools: paths toward the comprehensive functional analysis of large gene lists. Nucleic Acids Res.. 2009;37:1-13.
- [CrossRef] [Google Scholar]
- Morusin induces apoptosis by regulating expression of Bax and Survivin in human breast cancer cells. Oncology Letters. 2017;13:4558-4562.
- [CrossRef] [Google Scholar]
- Relating protein pharmacology by ligand chemistry. Nat. Biotechnol.. 2007;25:197-206.
- [CrossRef] [Google Scholar]
- Blockage of STAT3 Signaling Pathway by Morusin Induces Apoptosis and Inhibits Invasion in Human Pancreatic Tumor Cells. Pancreas. 2016;45:409-419.
- [CrossRef] [Google Scholar]
- Effects of Morus alba L. and Natural Products Including Morusin on In Vivo Secretion and In Vitro Production of Airway MUC5AC Mucin. Tuberculosis Respiratory Dis. 2014;77:65-72.
- [CrossRef] [Google Scholar]
- Morusin induces apoptosis and suppresses NF-kappa B activity in human colorectal cancer HT-29 cells. Biochem. Biophys. Res. Commun.. 2008;372:236-242.
- [CrossRef] [Google Scholar]
- Characterization of chemical components of Periplocae Cortex and their metabolites in rats using ultra-performance liquid chromatography coupled with quadrupole time-of-flight mass spectrometry. Biomed. Chromatogr.. 2020;34
- [CrossRef] [Google Scholar]
- Morusin induces cell death through inactivating STAT3 signaling in prostate cancer cells. Am. J. Cancer Res.. 2015;5:289-U482.
- [Google Scholar]
- The increased emphasis of ADME properties in hit-to-lead drug discovery. Acta Pharmacol. Sin.. 2006;27:226. 226
- [Google Scholar]
- A UPLC-MS/MS method for comparative pharmacokinetics study of morusin and morin in normal and diabetic rats. Biomed. Chromatogr.. 2019;33
- [CrossRef] [Google Scholar]
- A network pharmacology-based approach to explore the effects of Chaihu Shugan powder on a non-alcoholic fatty liver rat model through nuclear receptors. J. Cell. Mol. Med.. 2020;24:5168-5184.
- [CrossRef] [Google Scholar]
- Gut microbiota promotes tumor growth in mice by modulating immune response. Gastroenterology. 2018;155(1):33-37.
- [CrossRef] [Google Scholar]
- Cytoscape: A software environment for integrated models of biomolecular interaction networks. Genome Res.. 2003;13:2498-2504.
- [CrossRef] [Google Scholar]
- Identification of the metabolic enzyme involved morusin metabolism and characterization of its metabolites by ultraperformance liquid chromatography quadrupole time-of-flight mass spectrometry (UPLC/Q-TOF-MS/MS) Evidence-Based Complement. Alternative Med. 2016
- [CrossRef] [Google Scholar]
- Antimicrobial and cytotoxic activity of 18 prenylated flavonoids isolated from medicinal plants: Morus alba L., Morus mongolica Schneider, Broussnetia papyrifera (L.) Vent, Sophora flavescens Ait and Echinosophora koreensis Nakai. Phytomedicine. 2004;11:666-672.
- [CrossRef] [Google Scholar]
- STRING v11: protein-protein association networks with increased coverage, supporting functional discovery in genome-wide experimental datasets. Nucleic Acids Res.. 2019;47:D607-D613.
- [CrossRef] [Google Scholar]
- Morusin induces apoptosis and autophagy via JNK, ERK and PI3K/Akt signaling in human lung carcinoma cells. Chem. Biol. Interact.. 2020;331
- [CrossRef] [Google Scholar]
- Morusin inhibits human cervical cancer stem cell growth and migration through attenuation of NF-kappa B activity and apoptosis induction. Mol. Cell. Biochem.. 2013;379:7-18.
- [CrossRef] [Google Scholar]
- Morusin exerts anti-cancer activity in renal cell carcinoma by disturbing MAPK signaling pathways. Ann. Transl. Med.. 2020;8(6)
- [CrossRef] [Google Scholar]
- A target and nontarget strategy for identification or characterization of the chemical ingredients in Chinese herb preparation Shuang-Huang-Lian oral liquid by ultra-performance liquid chromatography-quadrupole time-of-flight mass spectrometry. Biomed. Chromatogr.. 2018;32
- [CrossRef] [Google Scholar]
- Characterization of lignans in Forsythiae Fructus and their metabolites in rats by ultra-performance liquid chromatography coupled time-of-flight mass spectrometry. J. Pharm. Pharmacol. 2020
- [CrossRef] [Google Scholar]
- An integrated strategy for revealing the pharmacological changes based on metabolites profiling and network pharmacology: Arctiin as an example. J. Chromatogr. B, Anal. Technol. Biomed. Life Sci.. 2020;1157 122270–122270
- [CrossRef] [Google Scholar]
- A combination of representative compounds, metabolism platform and diagnostic extraction strategy for characterization of metabolites of Shuang-Huang-Lian oral liquid in vivo by ultra-performance liquid chromatography coupled with time-of-flight mass spectrometry. J. Pharm. Biomed. Anal.. 2018;155:216-234.
- [CrossRef] [Google Scholar]
- A combination of metabolite profiling and network pharmacology to explore the potential pharmacological changes of secoisolariciresinol-diglycoside. RSC Adv.. 2020;10:34847-34858.
- [CrossRef] [Google Scholar]
- An integrated strategy for profiling the chemical components of Scutellariae Radix and their exogenous substances in rats by ultra-high-performance liquid chromatography/quadrupole time-of-flight mass spectrometry. Rapid Commun. Mass Spectrom.: RCM. 2020;34:e8823. e8823
- [CrossRef] [Google Scholar]
- Network pharmacology analysis of the therapeutic mechanisms of the traditional Chinese herbal formula Lian Hua Qing Wen in Corona virus disease 2019 (COVID-19), gives fundamental support to the clinical use of LHQW. Phytomedicine. 2020;79:153336
- [CrossRef] [Google Scholar]
Appendix A
Supplementary data
Supplementary data to this article can be found online at https://doi.org/10.1016/j.arabjc.2020.102964.
Appendix A
Supplementary data
The following are the Supplementary data to this article:


