

Chemical characterization and discovery of anti-inflammatory components and their mechanism from Artemisia argyi leaves by UPLC-Q/TOF-MS, spectrum-effect relationship analysis, and MAPK pathway
* Corresponding authors: E-mail addresses: guo_long11@163.com (L. Guo), zhangdanid@163.com (D. Zhang)
-
Received: ,
Accepted: ,
Abstract
Artemisia argyi is a high-value herbaceous plant in the Artemisia genus, and its leaves are commonly used in medicine and aromatic products. A. argyi leaves are a traditional herbal medicine used to treat inflammation, abdominal pain, hemorrhage, and dysmenorrhea. Several studies have reported that the A. argyi leaves extract exhibited significant anti-inflammatory activities, the components and mechanism of which remain uncovered. The study aimed to reveal these components and their mechanisms by ultra performance liquid chromatography-quadrupole time-of-flight mass spectrometry (UPLC-Q/TOF-MS), chemical fingerprint, spectrum effect relationship, and mitogen-activated protein kinase (MAPK) pathway. Firstly, UPLC-Q/TOF-MS was employed to characterize secondary metabolites in A. argyi leaves, and fifty secondary metabolitesx, including 15 phenolic acids, 29 flavonoids, five coumarins, and one terpene were identified. The chemical fingerprint of A. argyi leaves was established using high performance liquid chromatography (HPLC), and 13 secondary metabolites were identified as common components. The contents of the 13 secondary metabolites in different batches of A. argyi leaves were simultaneously determined. The anti-inflammatory capacities of different batches of A. argyi leaves were evaluated using the lipopolysaccharide (LPS)-stimulated RAW 264.7 macrophage inflammation model. The spectrum-effect relationship analysis was applied to investigate correlation between main secondary metabolites and anti-inflammation, and five metabolites, including 3-caffeoylquinic acid, 3,5-dicaffeoylquinic acid, 3,4-dicaffeoylquinic acid, schaftoside, and rutin were explored as latent anti-inflammatory compounds. The five selected metabolites exhibited remarkable inhibition of NO, IL-6, IL-1β, and tumor necrosis factor-α (TNF-α), and 3,5-dicaffeoylquinic acid and schaftoside had relatively great anti-inflammatory capacities. The western blot results indicated that 3,5-dicaffeoylquinic acid and schaftoside could reduce inflammation by inhibiting phosphorylation levels of p38, extracellular signal regulated kinase (ERK), and c-Jun N-terminal kinase (JNK) in the MAPK pathway. This work provided a thorough understanding of anti-inflammatory components of A. argyi leaves and their mechanism and also provided evidence for the utilization of A. argyi leaves as anti-inflammatory ingredients in medicinal products.
Keywords
Artemisia argyi leaves
Anti-inflammatory
Spectrum-effect relationship
UPLC-Q/TOF MS
MAPK


1. Introduction
Artemisia argyi is a perennial herb in the Artemisia genus and commonly distributed over Asia and Europe [1]. As a high-value herbal plant, the leaves of A. argyi are commonly used as pharmaceutical and aromatic ingredients in Asian countries [2]. As a traditional herbal medicine, A. argyi leaves are used in China to treat inflammation, hemorrhage, pain, and dysmenorrhea [3]. Phytochemical research indicates that A. argyi leaves are rich in primary metabolites, including amino acids, microelements, and dietary fibers [4,5]. A. argyi leaves also contain secondary metabolites, including phenolic acids, flavonoids, essential oils, and terpenoids [6,7]. The secondary metabolites contained in A. argyi leaves have various bioactive properties, such as anti-inflammation, anti-oxidation, anti-cancer, and immunoregulation [8-11]. Although A. argyi leaves have been used as herbal medicine for a long time, research into their active functions and bioactive secondary metabolites is still limited. Some studies reported that A. argyi leaves extract or secondary metabolites contained in A. argyi leaves exhibit great anti-inflammatory activities, but the primary anti-inflammatory components and their mechanism is still unclear [12,13]. It is significant to reveal the components and their mechanisms causing the anti-inflammatory effectsd of A. argyi leaves, as it could be helpful for their application in pharmaceutical products.
It is generally considered that the secondary metabolites are closely correlated with the bioactivity of natural products, and screening of bioactive compounds has become a research focus [14]. Spectrum-effect relationship analysis is a reliable and efficient approach for correlating chemical fingerprints with bioactivities and discovering bioactive components from natural products [15]. Spectrum-effect relationship analysis could relate components with their bioactivities and elucidate the relationship between fingerprint characteristics and activities by merging chemical fingerprint data with pharmacodynamics research results. Therefore, spectrum-effect relationship analysis could be a reliable technique in the investigation of bioactive components or secondary metabolites from herbal medicines and plant materials [16-18].
Inflammation is a defensive immune reaction in response to various external agents such as infectious organisms, traumatic injuries, and chemical irritants. The inflammatory mediators’ dysregulation might have a substantial impact on the exacerbation and development of inflammatory diseases [19]. Thus, the modulation of inflammation is a crucial point in the prevention and treatment of inflammation disorders [20]. Macrophages are the principal immune and inflammation cells and play an important role in the inflammation process by releasing various pro-inflammatory mediators. Lipopolysaccharide (LPS) is a composition of the cell wall of Gram-negative bacteria and plays a significant role in inducing various inflammatory responses and diseases. The LPS-induced macrophages are commonly used as an important cell model to identify anti-inflammatory constituents [21,22]. Thus, the anti-inflammatory capacities and compounds of the A. argyi leaves extract were investigated by the LPS-induced macrophage inflammatory model. It is well known that mitogen-activated protein kinases (MAPK) signal pathway plays an important role in the production of pro-inflammatory mediators in macrophages. MAPK activation occurs by phosphorylation through mitogen activated protein (MAP) kinase kinase (MKK), which is phosphorylated 3by MAPK kinase kinase (MKKK). MAPK, including p38, xtracellular signal regulated kinase (ERK), and c-Jun N-terminal kinase (JNK), is associated with inflammation-related disorders through the regulation of the phosphorylation cascade [23,24]. Hence, inhibition of the MAPK signaling pathway could be a key objective and an effective therapeutic method for inflammation disorders [25].
This study applied a comprehensive approach to reveal anti-inflammatory metabolites of A. argyi leaves and their mechanism. First, the chemical profile of A. argyi leaves was characterized by ultra performance liquid chromatography-quadrupole time-of-flight mass spectrometry (UPLC-Q/TOF-MS). Then, chemical fingerprints of A. argyi leaves were constructed by high performance liquid chromatography (HPLC), and the contents of main secondary metabolites in chemical fingerprints were determined. Meanwhile, the preliminary anti-inflammatory capacities of A. argyi leaves were measured by the LPS-induced macrophage inflammation model. The spectrum-effect relationship analysis was applied to investigate the correlation between the components and anti-inflammatory activities and reveal anti-inflammatory components of A. argyi leaves. Furthermore, the effect of anti-inflammatory components on the secretion of pro-inflammatory cytokines (IL-6, IL-1β, and tumor necrosis factor-α (TNF-α)) was detected. Finally, the mechanism of the main anti-inflammation constituents in A. argyi leaves was explored via the MARK signal pathway by regulating the expression of p38, ERK, and JNK kinase.
2. Materials and Methods
2.1. Plant materials
Twenty-four batches of A. argyi leaves were obtained from three main regions in China. The A. argyi leaf samples were harvested at Anguo, Nanyang, and Qichun in June 2023 and dried in the shade. The plant materials were authenticated by Professor LG from Hebei University of Chinese Medicine, and voucher specimens were deposited in Traditional Chinese Medicine Processing Technology Innovation Center of Hebei Province, Hebei University of Chinese Medicine. The sources of different batches of A. argyi leaves have been displayed in Table S1.
2.2. Chemicals and reagents
The reference compounds, including 5-caffeoylquinic acid, 3-caffeoylquinic acid, 4-caffeoylquinic acid, caffeic acid, schaftoside, rutin, 3,4-dicaffeoylquinic acid, 3,5-dicaffeoylquinic acid, 4,5-dicaffeoylquinic acid, hispidulin, jaceosidin, eupatilin, and casticin were obtained from Chengdu Must Bio-Technoligy Co., Ltd. The chemical reagents, such as acetonitrile and methanol were obtained from Fisher Scientific Pvt Ltd.
RAW264.7 mouse macrophage cells were purchased from the Cell Bank of the Chinese Academy of Sciences. Fetal bovine serum and Dulbecco’s modified eagle medium (DMEM) were obtained from Grand Island Biological Company (GIBCO). LPS, pancreatic enzymes, CCK-8, IL-6, IL-1β, and TNF-α enzyme-linked immunosorbent assay (ELISA) kits were purchased in Solarbio. Dexamethasone (DEX, positive control) was obtained from Macklin Biochemcial. The antibodies, iNOS (AB178945), p38 (AB170099), p-p38 (AB195049), ERK (AB17942), p-ERK (AB76299), JNK (AB199380), p-JNK (AB124956), and glyceraldehyde-3-phosphate dehydrogenase (GAPDH) (AB8245) were obtained from AB clonal Biotech.
2.3. Sample preparation
The A. argyi leaves were pulverized and passed through 40 mesh sieves. Then, 0.2 g of sample was extracted in 10 mL 75% (v/v) methanol by ultrasonication. After extraction for 30 mins, the mixture was centrifuged at 13,000 rpm/min. The supernatant was applied for HPLC-Q/TOF-MS and HPLC analysis. For the anti-inflammatory experiment, 20 μL of supernatant was dried using Termovap sample concentrator to remove the methanol, since it might make the cells non-viable. The residue was redissolved with DMEM to prepare sample solutions with different concentrations. The concentrations of A. argyi leaves samples were expressed as the amount of raw material (mg/mL raw material equivalents).
2.4. Standard solutions preparation
Standard solutions of 5-caffeoylquinic acid (150 μg/mL), 3-caffeoylquinic acid (580 μg/mL), 4-caffeoylquinic acid (154 μg/mL), caffeic acid (21 μg/mL), schaftoside (146 μg/mL), rutin (86 μg/mL), 3,4-dicaffeoylquinic acid (336 μg/mL), 3,5-dicaffeoylquinic acid (552 μg/mL), 4,5-dicaffeoylquinic acid (422 μg/mL), hispidulin (12 μg/mL), jaceosidin (34 μg/mL), eupatilin (34 μg/mL), and casticin (70 μg/mL) were prepared by accurately weighing and dissolving the 13 reference compounds in methanol. Then, the standard solutions were diluted with methanol to a series of accurate concentrations for HPLC analysis. All the solutions were stored at 4°C until use.
2.5. UPLC-Q/TOF-MS analysis
The extracts of A. argyi leaves were analyzed by UPLC-Q/TOF-MS. Chromatographic analysis was conducted on an Agilent 1290 UPLC with ACQUITY UPLC BEH C18 column (2.1 mm × 100 mm, 1.7 μm). The mobile phase was composed of 0.1% formic acid (A) and acetonitrile (B), and the elution program was as follows: 0-5 min, 10%B; 5-8 min, 10%-15%B; 8-22 min, 15%-20%B; 22-30 min, 20%-30%B; 30-35 min, 30%-35%B; 35-45 min, 35%-70%B. The flow rate was set at 0.3 mL/min, and the column temperature was set at 25°C. The extracts of A. argyi leaves samples were further analyzed by an Agilent 6545 Q/TOF-MS system, and the parameters of MS were drying gas temperature, 320°C; drying gas flow rate, 10.0 L/min; sheath gas temperature, 350°C; sheath gas flow rate, 11 L/min; fragmentor voltage, 135 V; capillary voltage, 3500 V; collision energy, 40 eV; mass range, m/z 120-1000 Da.
2.6. HPLC analysis
2.6.1. HPLC condition
The HPLC analysis was carried out on a Waters ACQUITY UPLC H-Class PLUS system comprising an auto-sampler, a binary pump, a thermostatically controlled column apartment, and a diode array detector photo-diode array detector. The separation was performed on ACQUITY UPLC BEH C18 column (2.1 mm × 100 mm, 1.7 μm). The mobile phase was composed of 0.1% formic acid (A) and acetonitrile (B), with a gradient elution as follows: 0-5 min, 10%B; 5-8 min, 10%-15%B; 8-22 min, 15%-20%B; 22-30 min, 20%-30%B; 30-35 min, 30%-35%B; 35-45 min, 35%-70%B. The flow rate was set at 0.3 mL/min, and the column temperature was set at 25°C. The detection wavelength was 340 nm, and the injection volume was 1 μL.
2.6.2. Method validation
For the calibration curves, seven different concentrations of standard solutions were analyzed in triplicate. The calibration curves were calculated by plotting the peak areas of each analyte versus its concentration.
The precision of the HPLC method was determined by the intra- and inter-day variations. For intra-day variations, the sample was analyzed six times within the same day. For inter-day variations, the sample was examined in duplicates for three consecutive days. For the stability test, the same sample was stored at room temperature and analyzed by replicate analysis at 0, 2, 4, 8, 12, and 24 hrs. To confirm the repeatability, six replicates of the same sample were extracted and analyzed. The relative standard deviations (RSDs) were used for measuring precision, stability, and repeatability.
The recovery test was performed to evaluate method accuracy. Three known levels (low, medium, and high) of individual standards were added into a certain amount of sample, and then the sample was extracted and analyzed. The recovery of each analyte was calculated by the Eq. (1):
2.7. Anti-inflammatory activity of A. argyi leaves
The anti-inflammatory properties of A. argyi leaves were preliminary assessed through the inhibition of Nitric oxide (NO) in RAW 264.7 macrophage inflammation model [26]. The macrophages (5×10⁵ cells/well) were inoculated into a 96-well plate. After incubation at 37°C for 24 hrs, the cells were exposed to extracts of A. argyi leaves for 1 hr and stimulated with LPS (1 μg/mL) for 12 hrs. Then, NO in culture supernatant were detected by Griess reagent. After reaction in the dark for 15 mins, the absorbance was detected at 540 nm. The inhibition rates of NO production of A. argyi leaves samples were calculated using the formula (Eq. 2):
2.8. Spectrum-effect relationship analysis
2.8.1. Gray relational analysis
The contents of thirteen metabolites were firstly standardized before Gray relational analysis (GRA). Then, contents of thirteen metabolites were set as sequence, and anti-inflammatory capacities of A. argyi leaves were set as parent sequence. The gray correlation degree (GRD) between the two sub-sequences were calculated with the distinguishing coefficient 0.5.
2.8.2. Partial least squares regression analysis
PLSR was applied to reveal the correlation between the 13 metabolites and anti-inflammatory activity of A. argyi leaves. The contents of 13 metabolites were designated as predictor variables, while the anti-inflammatory capacities were set as response variables. Then, a PLSR model was founded. The regression coefficient in the PLSR model was employed to reflect the impact of predictor variables on response variables.
2.9. Anti-inflammatory activities and mechanisms
RAW264.7 macrophages (5 ×10⁵ cells/well) were plated in a 6-well plate and cultured for 24 hrs. The macrophages were treated with different concentrations of the main anti-inflammatory components for 1 hr and activated with LPS for 24 hrs. Then, culture supernatants were collected and centrifuged at 1000 rpm. The concentration of NO was detected by Griess reagent and IL-6, IL-1β, and TNF-α were detected by ELISA assays.
The western blot was employed to explore protein expression of iNOS, p38, p-p38, ERK, p-ERK, JNK, and p-JNK in LPS-induced RAW 264.7 cells. The cells were cultured for 24 hrs and treated with the main anti-inflammatory components for 1 hour. After activated with LPS, the cells were gathered and rinsed twice with phosphate buffered saline (PBS) (pH 7.4). The protein levels were quantified through the bicinchoninic acid (BCA) kit. Target proteins were isolated by sodium eodecyl sulfate - polyacrylamide gel electrophoresis (SDS-PAGE) and transferred to PVDF membranes, blocked for 3 hrs, and incubated with primary antibodies at 4°C. Following three washes with tris buffered saline with Tween 20 (TBST), the membranes were exposed to secondary antibodies for 1 hour. Finally, target proteins were visualized by chemiluminescence. The relative expression of target proteins in relation to loading control (GAPDH) was calculated by ImageJ software.
3. Results and Discussion
3.1. UPLC-Q/TOF-MS analysis
A. argyi leaves contain various secondary metabolites. Phenolics, including phenolic acids and flavonoids, are primary secondary metabolites. To comprehensively characterize the secondary metabolites, A. argyi leaves samples were analyzed by UPLC-Q/TOF-MS. UPLC-Q/TOF-MS can provide high mass resolution and accurate mass measurement for qualitative analysis of constituents in complex samples and has been becoming a predominant tool for the rapid characterization of secondary metabolites in herbal medicines and plant materials. As most of the secondary metabolites in A. argyi leaves exhibited great protonated molecular ions ([M+H]+), the samples were characterized in the positive mode. A typical total ion chromatogram of A. argyi leaves has been displayed in Figure 1. Fifty secondary metabolites were identified in A. argyi leaves according to fragmentation patterns, behaviors, principal fragment ions, literatures, and reference compounds [27-30]. Information of the secondary metabolites identified in A. argyi leaves, including chemical formula, theoretical mass, measured mass, and fragment ions, has been illustrated in Table 1. The identified fifty secondary metabolites included 15 phenolic acids, 29 flavonoids, five coumarins, and one terpene. The chemical structures of fifty secondary metabolites have been displayed in Figure S1.
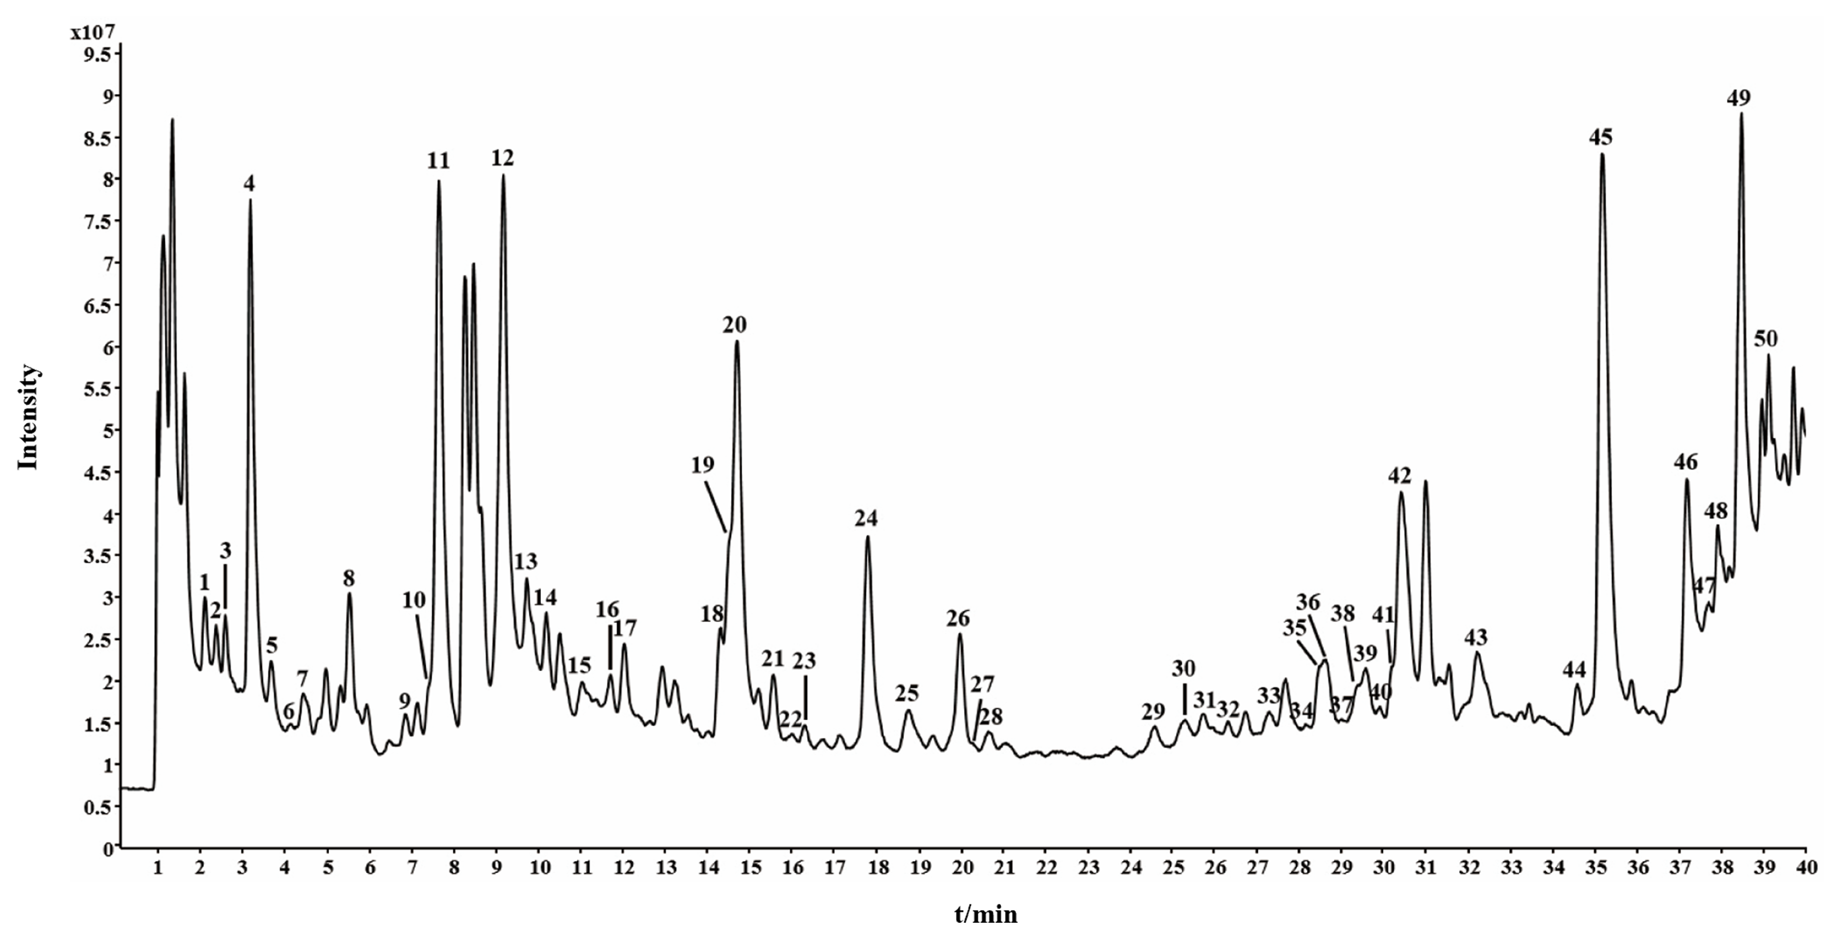
- The typical total ion chromatogram of A. argyi leaves by UPLC-Q/TOF-MS. The numbers are consistent with compound numbers presented in Table 1.
| No | Retention time (min) | Chemical formula |
Theoretical mass (m/z) |
Measured mass (m/z) | Fragment ions (m/z) | Error (ppm) | Identification | Types |
|---|---|---|---|---|---|---|---|---|
| 1 | 2.096 | C16H18O9 | 355.1024 | 355.1024 | 355.1024, 194.1172, 181.0494, 163.0388, 135.0437, 117.0741 | 0.31 | 5-Caffeoylquinic acid* | Phenolic acids |
| 2 | 2.362 | C15H16O9 | 341.0867 | 341.0864 | 341.0864, 163.0387, 143.1061 | -0.51 | Esculin | Coumarins |
| 3 | 2.578 | C16H18O10 | 371.0973 | 371.097 | - | -0.09 | Fraxin | Coumarins |
| 4 | 3.177 | C16H18O9 | 355.1024 | 355.1031 | 355.1031, 183.10115, 181.0494, 163.0387, 135.0438, 119.0885 | 0.46 | 3-Caffeoylquinic acid* | Phenolic acids |
| 5 | 3.677 | C16H18O9 | 355.1024 | 355.1017 | 355.1017, 194.1167, 181.0489, 177.0561, 163.0384, 137.0588, 135.0434, 118.0858, 107.0485 | -0.05 | 4-Caffeoylquinic acid* | Phenolic acids |
| 6 | 4.126 | C9H6O4 | 179.0339 | 179.0338 | 179.0338, 151.1112, 143.0391, 123.1170 | 0.28 | Esculetin | Coumarins |
| 7 | 4.425 | C9H8O4 | 181.0495 | 181.0491 | 181.0491, 163.0385, 143.0395, 137.0956, 95.0853 | -2.7 | Caffeic acid* | Phenolic acids |
| 8 | 5.523 | C18H28O9 | 389.1806 | 389.1799 | 389.1799, 209.1174, 165.0908, 121.1010 | -0.25 | 7-Epi-12-hydroxyjasmonic acid glucoside | Phenolic acids |
| 9 | 6.855 | C27H30O15 | 595.1657 | 595.1655 | - | -0.67 | Apigenin-6,8-di-C-hexoside | Flavonoids |
| 10 | 7.387 | C17H20O9 | 369.118 | 369.1178 | 369.1178, 191.1063, 118.0863 | -0.69 | 5-Feruoyl quinic acid | Phenolic acids |
| 11 | 7.637 | C15H18O5 | 279.1227 | 279.1232 | 279.1232, 233.1171, 201.0908, 191.1064, 173.0957 | -0.44 | Artemargyinolide C | Terpene |
| 12 | 9.167 | C26H28O14 | 565.1552 | 565.1555 | 565.1555, 183.0808, 118.0864 | 0.41 | Schaftoside* | Flavonoids |
| 13 | 9.717 | C26H28O14 | 565.1552 | 565.1546 | 565.1546, 421.1963, 179.1056, 118.0860 | -1.18 | Isoschaftoside | Flavonoids |
| 14 | 10.182 | C10H10O4 | 195.0652 | 195.0652 | 195.0652, 183.0798, 153.1268, 135.1166, 119.0891 | 0.07 | Ferulic acid | Phenolic acids |
| 15 | 11.031 | C27H30O16 | 611.1607 | 611.1593 | 611.1593, 303.0495, 278.1379, 177.0694, 163.0385, 153.1265, 118.0859 | -1.12 | Rutin* | Flavonoids |
| 16 | 11.697 | C15H10O7 | 303.0499 | 303.0493 | 303.0493, 259.0970, 165.0905, 155.0016, 151.1106, 124.0862, 118.0859 | -0.81 | Quercetin | Flavonoids |
| 17 | 12.029 | C27H30O15 | 595.1657 | 595.1647 | 595.1647, 363.1915, 287.1255, 149.0956, 119.0889 | -0.98 | Datiscin | Flavonoids |
| 18 | 14.309 | C25H24O12 | 517.1341 | 517.1335 | 517.1335, 355.1016, 194.1164, 181.0485, 177.0809, 163.0384, 135.0434 | 0.14 | 3,4-Dicaffeoylquinic acid* | Phenolic acids |
| 19 | 14.508 | C25H24O12 | 517.1341 | 517.1345 | 517.1345, 500.1271, 499.1240, 355.1023, 337.0918, 163.0388 | -2.06 | Cynarin | Phenolic acids |
| 20 | 14.692 | C25H24O12 | 517.1341 | 517.1344 | 517.1344, 499.1232, 337.0915, 230.6493, 163.0388 | 0.38 | 3,5-Dicaffeoylquinic acid* | Phenolic acids |
| 21 | 15.557 | C21H20O10 | 433.1129 | 433.1126 | 433.1126, 265.1433, 193.1585 | -0.67 | Vitexin | Flavonoids |
| 22 | 16.006 | C15H12O5 | 273.0757 | 273.0765 | 273.0765, 243.1117, 153.1261, 119.0894 | 2.39 | Naringenin | Flavonoids |
| 23 | 16.305 | C21H18O11 | 447.0922 | 447.0912 | 447.0912, 219.1738, 151.1094, 119.0888 | -0.49 | Apigenin-7-O-glucronide | Flavonoids |
| 24 | 17.786 | C25H24O12 | 517.1341 | 517.1344 | 517.1344, 417.1550, 355.1028, 337.0915, 181.0490, 175.1477, 163.0389, 135.0435 | 0.51 | 4,5-Dicaffeoylquinic acid* | Phenolic acids |
| 25 | 18.768 | C10H8O3 | 177.0546 | 177.0549 | 177.0549, 163.0385, 133.1001, 118.0860, 102.0128 | 1.76 | Herniarin | Coumarins |
| 26 | 19.983 | C9H6O3 | 163.039 | 163.0389 | 163.0389, 135.0431, 119.0890, 102.0125, 91.0061 | 0.59 | 7-Hydroxycoumarin | Coumarins |
| 27 | 20.299 | C26H26O12 | 531.1497 | 531.149 | 531.1490, 243.1014, 163.0388, 119.0890 | -0.85 | 3-Caffeoyl-4-feruoyl-quinic acid | Phenolic acids |
| 28 | 20.665 | C26H26O12 | 531.1497 | 531.1489 | 531.1489, 335.1224, 163.0392, 137.0959, 119.0891, 102.0127 | -0.8 | 3-Caffeoyl-5-feruoyl-quinic acid | Phenolic acids |
| 29 | 24.592 | C15H10O6 | 287.055 | 287.055 | 287.0550, 151.1114, 137.1322, 119.0893, 102.0123 | 0.01 | Luteolin | Flavonoids |
| 30 | 25.307 | C16H12O7 | 317.0656 | 317.0659 | 317.0659, 287.0542, 227.1278, 181.1223, 163.1127, 137.1321, 119.0887 | 0.86 | 6-Methoxyluteolin | Flavonoids |
| 31 | 25.74 | C17H14O8 | 347.0761 | 347.0765 | 347.0765, 317.0657, 243.1013, 201.1638, 137.1319, 119.0893, 102.0125 | 0.99 | 5,7,4′,5′-Tetrahydroxy-6,3′- dimethoxyflavone | Flavonoids |
| 32 | 26.322 | C28H32O14 | 593.1865 | 593.1862 | 593.1862, 287.2042, 151.0961, 119.0892 | -0.61 | Buddleoside | Flavonoids |
| 33 | 27.304 | C17H14O8 | 347.0761 | 347.0761 | 347.0761, 137.1323, 124.0865, 119.0892, 102.0127, 95.0854 | -0.29 | Limocitrin | Flavonoids |
| 34 | 28.152 | C16H12O7 | 317.0656 | 317.0654 | 317.0654, 165.0541, 139.0384, 124.0867, 119.0893 | -1.09 | Rhamnetin | Flavonoids |
| 35 | 28.485 | C34H30O15 | 679.1657 | 679.1644 | 679.1644, 342.1707, 261.1120, 165.0545, 163.0749, 124.0866, 119.0888 | -1.3 | 3,4,5-Tricaffeoylquinic acid | Phenolic acids |
| 36 | 28.652 | C25H24O12 | 517.1341 | 517.1333 | 517.1333, 163.0743, 151.1112, 124.0868, 119.0890, 91.0064 | -1.51 | 1,5-Dicaffeoylquinic acid | Phenolic acids |
| 37 | 29.034 | C15H10O5 | 271.0601 | 271.0602 | 271.0602, 163.0753, 119.0892, 105.0329 | 0.18 | Apigenin | Flavonoids |
| 38 | 29.384 | C16H12O6 | 301.0707 | 301.0708 | 301.0708, 271.0603, 163.0750, 135.1166, 119.0890 | 0.54 | 3’-methoxy-apigenin | Flavonoids |
| 39 | 29.583 | C16H12O6 | 301.0707 | 301.0711 | 301.0711, 181.1222, 163.0750, 124.0870, 119.0890 | 1.01 | Hispidulin* | Flavonoids |
| 40 | 29.916 | C15H10O6 | 287.055 | 287.0549 | 287.0549, 261.1110, 163.0751, 124.0870, 118.0861, 105.0337 | -0.4 | Kaempferol | Flavonoids |
| 41 | 30.199 | C18H16O8 | 361.0918 | 361.0921 | 361.0921, 331.0811, 301.0709, 163.0751, 124.0866, 105.0332 | 0.71 | Centaureidin | Flavonoids |
| 42 | 30.415 | C17H14O7 | 331.0812 | 331.0817 | 331.0817, 163.0749, 118.0861 | 1.26 | Jaceosidin* | Flavonoids |
| 43 | 32.212 | C18H16O8 | 361.0918 | 361.092 | 361.0920, 331.0812, 163.0747, 119.0889 | 0.17 | Centaureidin isomer A | Flavonoids |
| 44 | 34.592 | C17H14O6 | 315.0863 | 315.0865 | 315.0865, 282.0527, 136.0159, 118.0861 | 0.4 | Cirsimaritin | Flavonoids |
| 45 | 35.191 | C18H16O7 | 345.0969 | 345.0982 | 345.0982, 300.0253, 243.0139, 118.0863 | 3.24 | Eupatilin* | Flavonoids |
| 46 | 37.187 | C19H18O8 | 375.1074 | 375.1079 | 375.1079, 147.09115, 118.0864 | 1.12 | Casticin* | Flavonoids |
| 47 | 37.703 | C16H12O5 | 285.0757 | 285.0754 | 285.0754, 279.0934, 124.0866, 118.0860 | -0.99 | Acacetin | Flavonoids |
| 48 | 38.036 | C17H14O6 | 315.0863 | 315.086 | - | -1.23 | Pectolinarigenin | Flavonoids |
| 49 | 38.485 | C19H18O7 | 359.1125 | 359.1128 | 359.1128, 289.1800, 118.0862 | 0.78 | 5-Hydroxy-3’,4’,6,7-tetramethoxyflavone | Flavonoids |
| 50 | 39.118 | C20H20O8 | 389.1231 | 389.1236 | - | 1.07 | Artemetin | Flavonoids |
* Identified with reference compounds.
3.2. HPLC fingerprints analysis
HPLC is the most common and convenient separation and analytical method, widely employed in pharmaceutical and bioanalytical sciences. The HPLC chemical fingerprints could reveal chemical characteristics of the samples, and is widely utilized in identification and quality evaluation [31,32]. Thus, secondary metabolites of A. argyi leaves were further analyzed by the HPLC method, and the chemical fingerprint was established.
3.2.1. Optimization of sample preparation
In order to obtain optimal extraction efficiency of secondary metabolites in A. argyi leaves, several extraction conditions, such as extraction methods, extraction solvents, extraction time, and extraction liquid-solid ratios were optimized. The results showed that both refluxing and extraction exhibited great extraction efficiency, and the ultrasonic extraction method was used in sample preparation because of convenience and operability. Among the tested extraction solvents (25% methanol, 50% methanol, 75% methanol, 100% methanol, and 100% ethanol), 75% methanol (v/v) showed relatively good extraction efficiency. It was found that an extraction time and liquid-solid ratio of 30 mins and 50 mL/g had relatively better extraction effects among the different extraction times (15, 30, 45, and 60 mins) and extraction liquid-solid ratios (25 mL/g, 50 mL/g, 75 mL/g, and 100 mL/g), respectively. Thus, the optimal extraction condition of ultrasonic extraction with 75% methanol at liquid-solid ratios 50 mL/g for 30 mins was used for the extraction of secondary metabolites from A. argyi leaves.
3.2.2. HPLC analysis
Collected from different regions, 24 batches of A. argyi leaves samples were analyzed by HPLC, and their chromatograms have been displayed in Figure 2(a). Then, chemical fingerprints of A. argyi leaves were matched based on the chromatograms. The reference fingerprint of A. argyi leaves was generated by a median method using the Similarity Evaluation System for Chromatographic Fingerprint (Chinese Pharmacopoeia Commission, 2012 version A). After auto-matching, 13 chromatographic peaks existed in chromatograms of A. argyi leaves. Those with great resolution, and segregation were selected as common peaks, which represented the similarity among A. argyi leaves samples. The reference fingerprint chromatogram of A. argyi leaves samples has been displayed in Figure 2(b), and 13 common peaks were identified as 5-caffeoylquinic acid (1), 3-caffeoylquinic acid (4), 4-caffeoylquinic acid (5), caffeic acid (7), schaftoside (12), rutin (15), 3,4-dicaffeoylquinic acid (18), 3,5-dicaffeoylquinic acid (20), 4,5-dicaffeoylquinic acid (24), hispidulin (39), jaceosidin (42), eupatilin (45), and casticin (46) according to UPLC-Q/TOF-MS analysis.
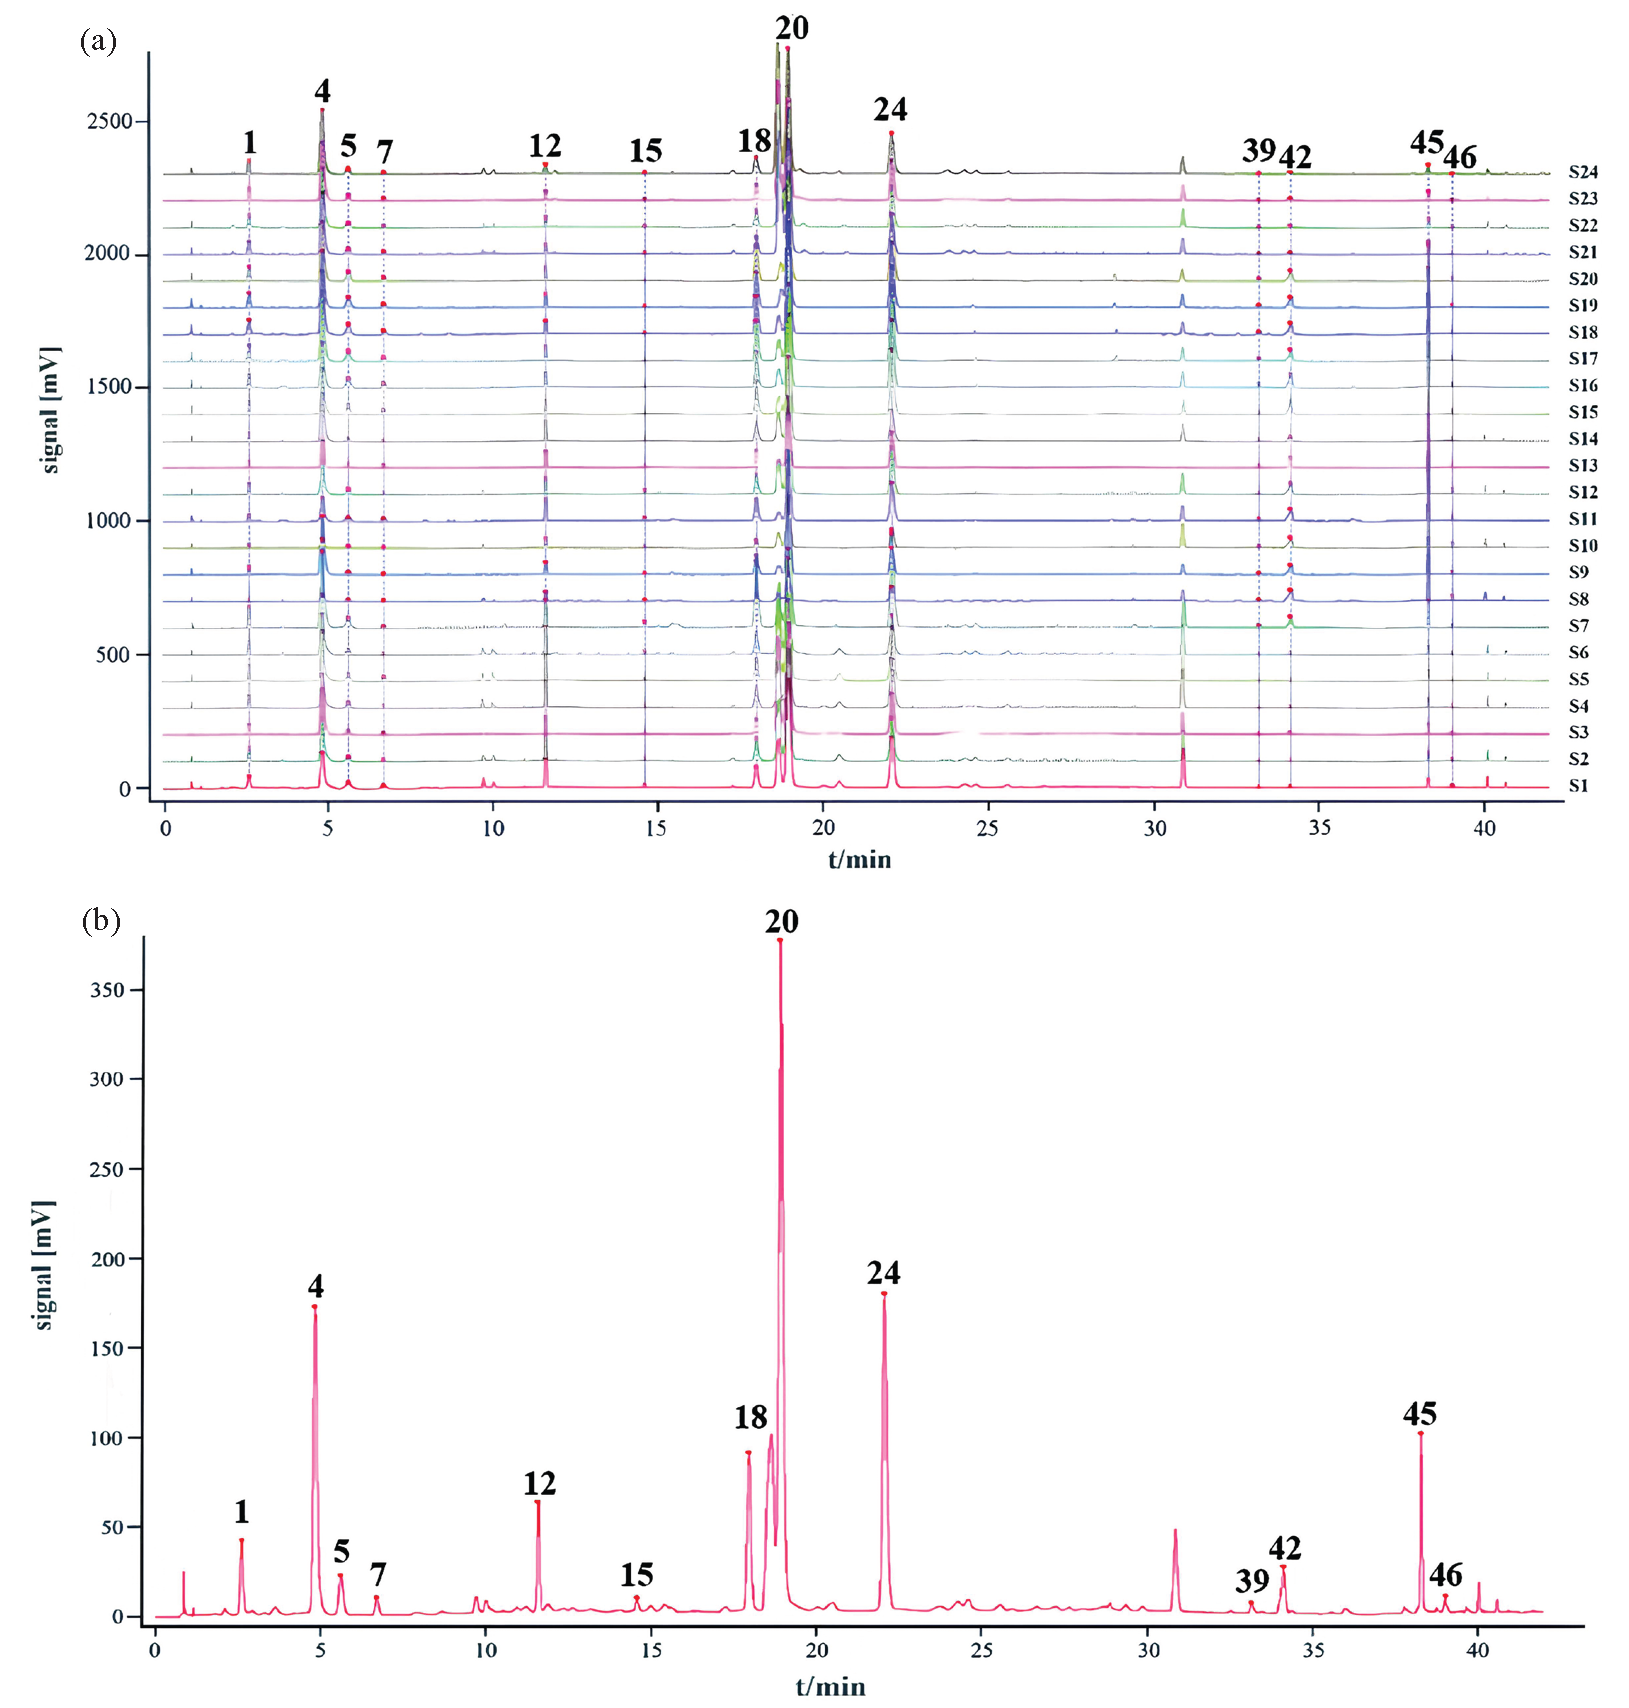
- (a) The HPLC chromatograms and (b) reference fingerprint chromatogram of A. argyi leaves samples. The numbers are consistent with compound numbers presented in Table 1.
Subsequently, similarities between chemical chromatograms and reference fingerprints of A. argyi leaves were conducted. The similarity values among chromatograms of A. argyi leaves and reference fingerprint ranged from 0.878 to1.000 (Table S2), which indicated that the main metabolites contained in different batches of A. argyi leaves samples were similar, but the different origins could not be principal factor influencing the chemical variety of A. argyi leaves.
3.3. Determination of 13 secondary metabolites in A. argyi leaves samples
The chemical fingerprints of A. argyi leaves were established, and 13 metabolites were reorganized as common peaks. According to chemical chromatographic fingerprints of A. argyi leaves samples, all contained the 13 secondary metabolites, but their peak areas varied. The results showed that the main metabolites in different batches of A. argyi leaves were similar, but the concentrations of specific metabolites were different. Thus, to reveal the content variation in the 13 constituents, an HPLC method was applied to quantify them in different batches of A. argyi leaves.
3.3.1. Method validation
The calibration curves, precision, stability, repeatability, and accuracy were performed to validate the HPLC method for quantification of the 13 metabolites in A. argyi leaf samples (Table S3). The 13 compounds exhibited satisfactory linearity with linearity ranges, and the calibration curves demonstrated excellent linearity (r≥0.99). The precision, including intra-day and inter-day precisions (RSD) were no more than 2.1% and 2.5%, respectively. The stability (RSD) was less than 1.7%, and repeatability (RSD) was less than 2.8%. The recoveries of the 13 compounds at low, medium, and high levels were 97.2%-104.2%, 96.4%-104.7%, and 96.2%-103.8%, respectively. The RSD of the recoveries in three levels was less than 2.9%. The above results showed that the quantitative method was characterized by precision, stability, reproducibility, and accuracy, and was appropriate for quantification of the 13 metabolites in A. argyi leaf samples.
3.3.2. Determination of thirteen secondary metabolites
The valid HPLC method was employed for the quantification of 13 secondary metabolites, including 5-caffeoylquinic acid (1), 3-caffeoylquinic acid (4), 4-caffeoylquinic acid (5), caffeic acid (7), schaftoside (12), rutin (15), 3,4-dicaffeoylquinic acid (18), 3,5-dicaffeoylquinic acid (20), 4,5-dicaffeoylquinic acid (24), hispidulin (39), jaceosidin (42), eupatilin (45), and casticin (46) in 24 batches of A. argyi leaf samples. Typical chromatograms of A. argyi leaves and 13 reference compounds have been displayed in Figure 3. The quantitative results of the 13 metabolites in 24 batches of A. argyi leaves have been shown in Table 2. It is clear that the main secondary metabolites are phenolic acids and flavonoids, and the former were relative abundantly compared to the latter. The contents of seven phenolic acids (5-caffeoylquinic acid, 3-caffeoylquinic acid, 4-caffeoylquinic acid, caffeic acid, 3,4-dicaffeoylquinic acid, 3,5-dicaffeoylquinic acid, 4,5-dicaffeoylquinic acid) ranged from 525.33 to 2075.20 μg/g, and the contents of six flavonoids (schaftoside, rutin, hispidulin, jaceosidin, eupatilin and casticin) ranged from 80.04 to 235.01 μg/g. Among the seven phenolic acids, the content of 3,5-dicaffeoylquinic acid was relatively abundant, with contents ranging from 247.71 to 741.96 μg/g. The di-caffeoylquinic acids content was significantly higher than mono-caffeoylquinic acids. Among the six flavonoids, schaftoside and eupatilin had the relatively high contents ranging from 32.03 to 94.14 μg/g and 14.00 to 76.43 μg/g, respectively. In contrast, the content of casticin was ranging from 1.62 to 7.79 μg/g, which was the most rare constitute among the 13 compounds determined in A. argyi leaves. The results indicated that secondary metabolites varied greatly in A. argyi leaves, which might influence the quality, uniformity, and bioactivity of the plant material.
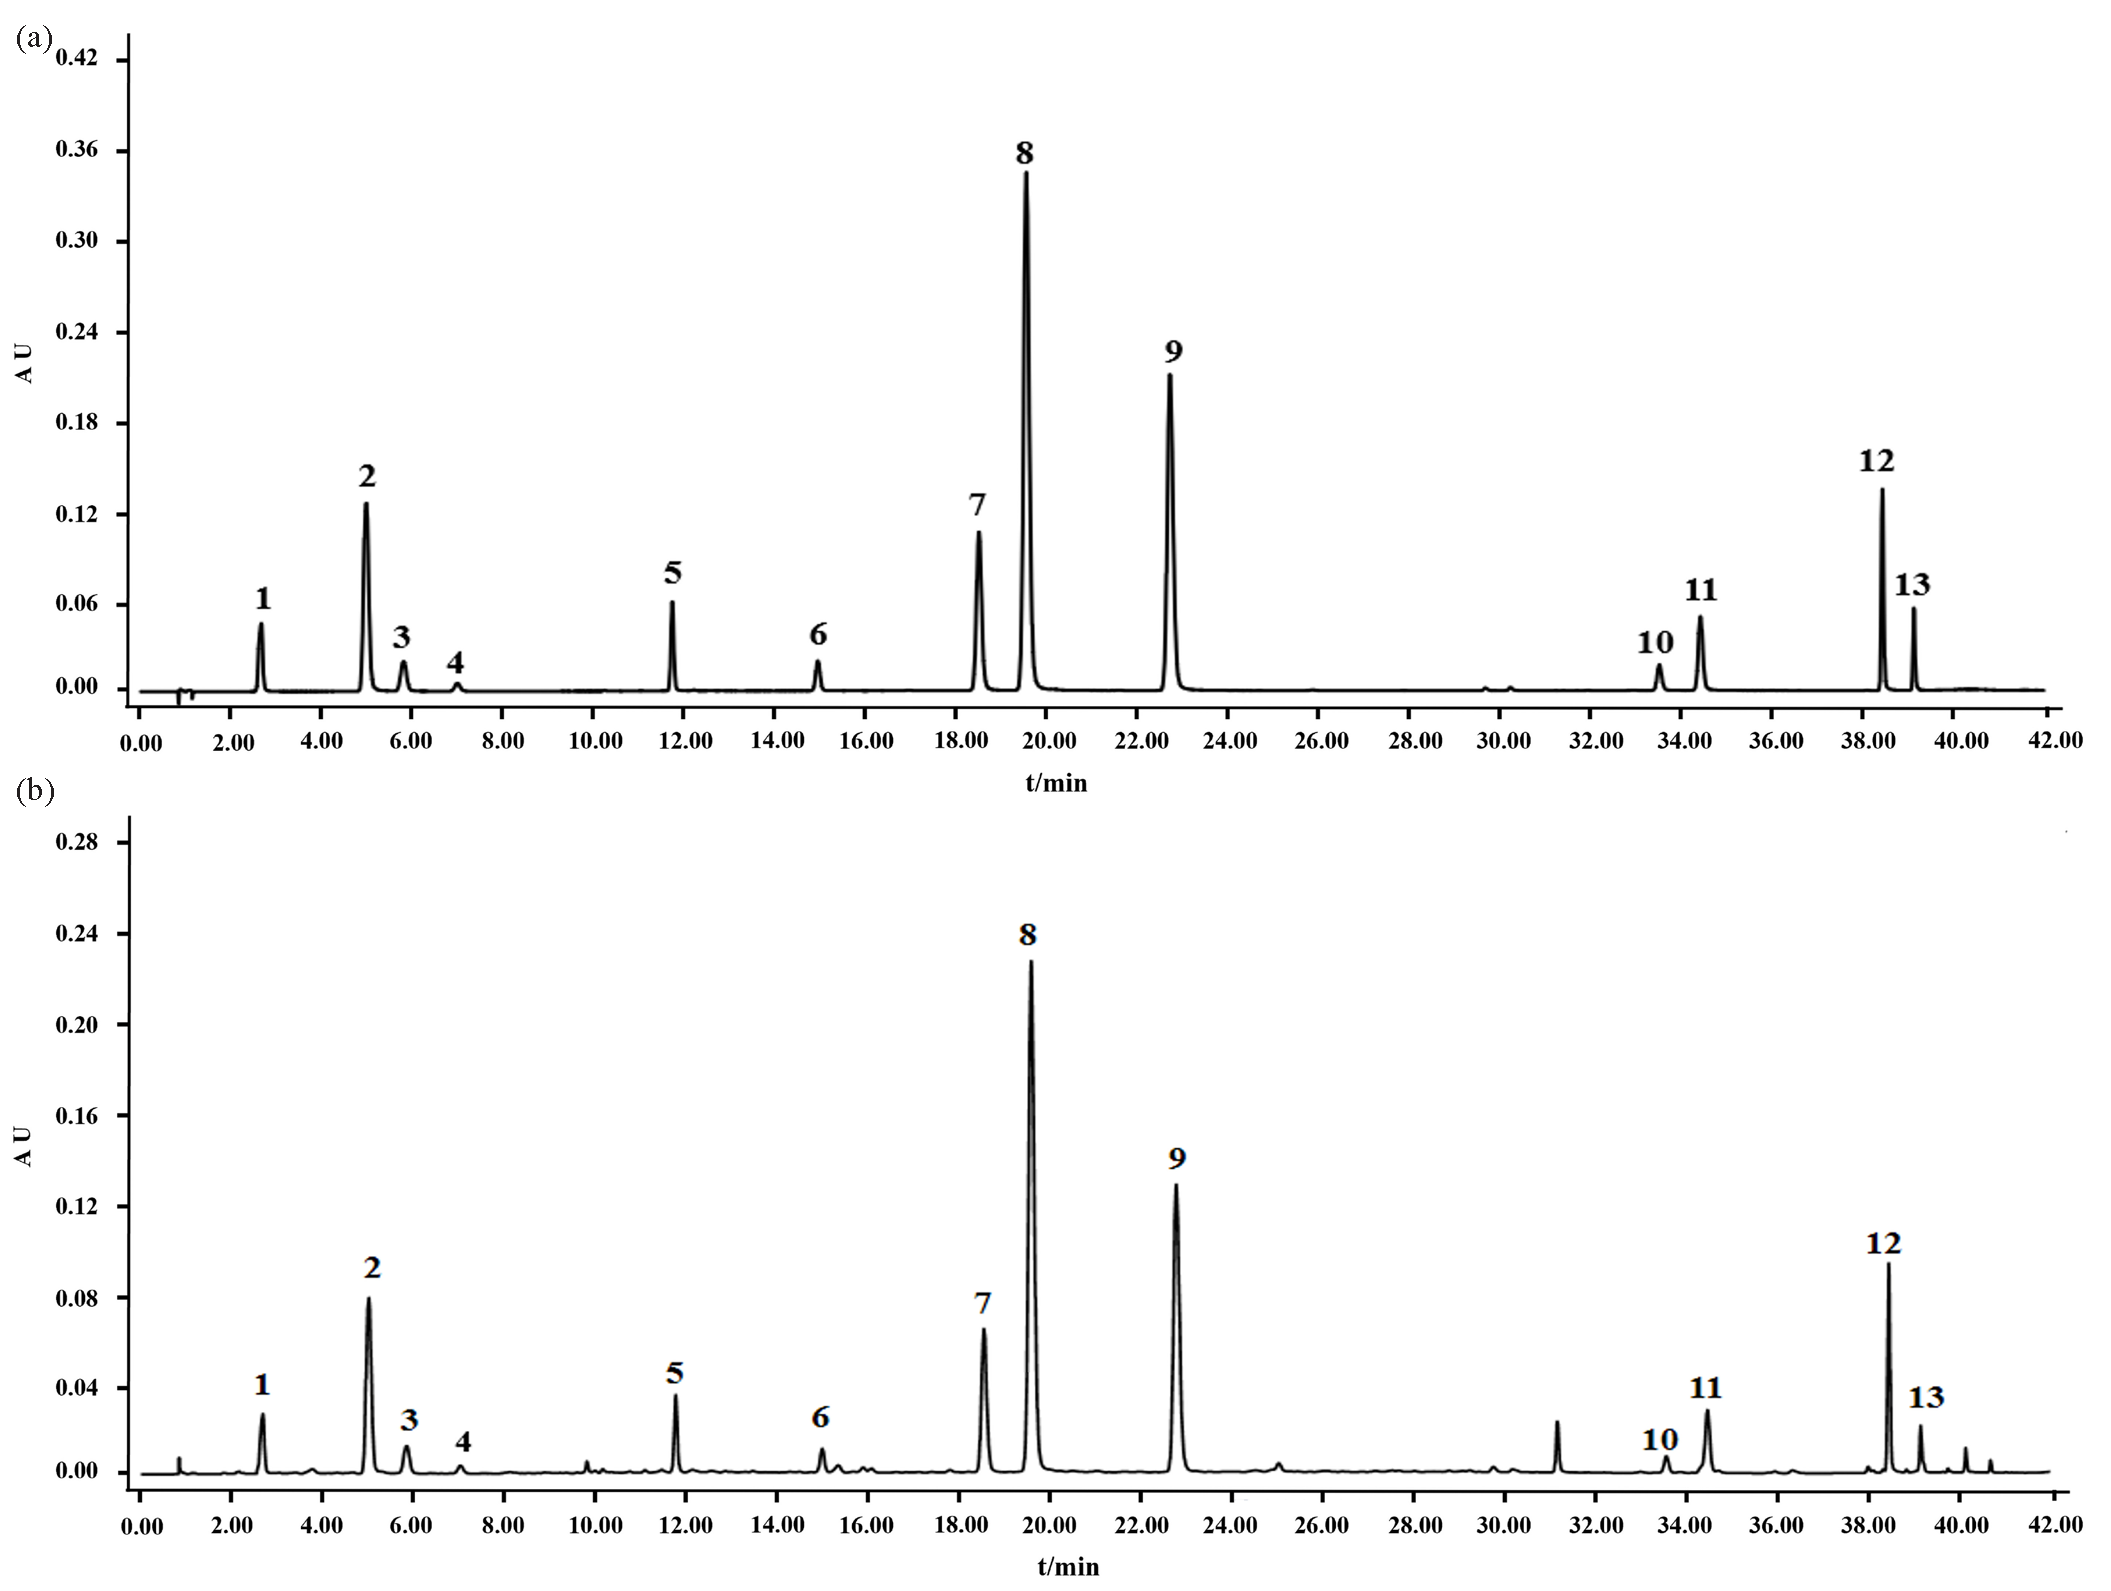
- (a) The typical chromatograms of thirteen reference compounds and (b) A. argyi leaves samples. (1) 5-caffeoylquinic acid, (4) 3-caffeoylquinic acid, (5) 4-caffeoylquinic acid, (7) caffeic acid, (12) schaftoside, (15) rutin, (18) 3,4-dicaffeoylquinic acid, (20) 3,5-dicaffeoylquinic acid, (24) 4,5-dicaffeoylquinic acid, (39) hispidulin, (42) jaceosidin, (45) eupatilin, (46) casticin.
| No. | 5-caffeoylquinic acid | 3-caffeoylquinic acid | 4-caffeoylquinic acid | Caffeic acid | Schaftoside | Rutin | 3,4-dicaffeoylquinic acid | 3,5-dicaffeoylquinic acid | 4,5-dicaffeoylquinic acid | Hispidulin | Jaceosidin | Eupatilin | Casticin |
|---|---|---|---|---|---|---|---|---|---|---|---|---|---|
| S1 | 48.52±0.67 | 212.64±0.13 | 43.90±0.05 | 8.69±0.01 | 93.15±1.39 | 16.29±0.02 | 117.23±0.08 | 466.97±0.73 | 249.69±0.60 | 2.64±0.01 | 7.02±0.01 | 14.38±0.07 | 1.97±0.04 |
| S2 | 55.39±0.13 | 257.91±0.22 | 36.65±0.19 | 4.32±0.01 | 90.43±0.40 | 20.01±0.14 | 126.27±0.14 | 490.81±0.73 | 230.58±3.42 | 2.61±0.01 | 8.46±0.01 | 15.46±0.01 | 2.08±0.01 |
| S3 | 43.63±0.15 | 269.60±0.09 | 34.27±0.08 | 6.28±0.01 | 59.92±0.14 | 21.94±0.06 | 96.26±0.06 | 499.81±0.10 | 221.21±0.64 | 2.55±0.01 | 4.04±0.01 | 18.45±0.01 | 2.74±0.02 |
| S4 | 50.32±0.63 | 209.47±0.02 | 41.97±0.02 | 8.37±0.03 | 90.02±0.37 | 26.52±0.02 | 117.04±0.02 | 471.29±0.89 | 249.38±0.31 | 2.65±0.01 | 7.65±0.01 | 15.64±0.01 | 2.18±0.01 |
| S5 | 68.00±0.12 | 301.83±0.06 | 57.33±0.05 | 15.27±0.05 | 91.99±0.64 | 21.34±0.01 | 122.84±0.01 | 572.07±0.19 | 275.93±0.03 | 2.77±0.01 | 9.37±0.01 | 17.20±0.01 | 2.35±0.01 |
| S6 | 53.24±0.04 | 244.13±0.25 | 35.50±0.01 | 4.45±0.01 | 92.23±0.32 | 27.03±0.06 | 122.75±0.04 | 429.20±0.01 | 208.63±0.06 | 2.59±0.01 | 7.55±0.01 | 14.00±0.01 | 1.87±0.01 |
| S7 | 85.67±0.90 | 423.53±1.16 | 74.00±2.06 | 6.87±0.08 | 94.14±1.04 | 49.21±0.19 | 300.91±1.79 | 741.96±0.55 | 442.26±0.90 | 6.70±0.02 | 34.92±0.12 | 44.37±0.42 | 5.67±0.15 |
| S8 | 33.18±0.03 | 325.09±0.38 | 26.15±0.15 | 4.38±0.01 | 40.98±0.53 | 12.93±0.07 | 113.26±0.34 | 314.75±0.33 | 147.99±0.43 | 5.92±0.01 | 31.76±0.37 | 56.52±0.09 | 4.87±0.03 |
| S9 | 12.73±0.01 | 60.43±0.01 | 16.71±0.04 | 3.34±0.01 | 32.03±0.01 | 12.45±0.01 | 68.73±0.06 | 247.71±0.08 | 115.68±0.78 | 5.12±0.11 | 36.88±0.08 | 70.90±0.35 | 7.51±0.11 |
| S10 | 26.02±0.52 | 132.36±0.27 | 33.15±0.11 | 8.04±0.08 | 66.80±0.07 | 26.34±0.78 | 122.48±0.08 | 276.46±0.60 | 197.79±0.49 | 7.53±0.02 | 41.99±0.09 | 76.43±0.12 | 7.54±0.02 |
| S11 | 46.01±0.82 | 190.02±0.14 | 39.20±0.11 | 6.61±0.11 | 54.84±0.39 | 35.40±0.19 | 117.92±0.06 | 430.73±0.34 | 236.00±0.17 | 5.69±0.19 | 38.14±0.10 | 69.47±0.12 | 7.79±0.14 |
| S12 | 23.11±0.58 | 162.99±0.16 | 30.01±0.28 | 10.21±0.16 | 55.09±0.11 | 21.28±0.09 | 107.41±0.43 | 249.29±0.58 | 186.83±1.12 | 7.88±0.02 | 36.51±0.09 | 68.49±0.15 | 6.62±0.10 |
| S13 | 23.11±0.37 | 162.99±2.51 | 30.01±0.18 | 10.21±0.06 | 55.09±0.77 | 21.28±0.27 | 107.41±1.15 | 249.29±3.66 | 186.83±1.47 | 7.88±0.08 | 36.51±0.29 | 68.49±0.42 | 6.62±0.05 |
| S14 | 45.78±0.06 | 226.37±0.51 | 46.03±0.35 | 9.94±0.42 | 75.94±0.22 | 23.62±0.01 | 142.20±0.08 | 499.46±1.58 | 282.01±0.78 | 5.67±0.07 | 25.54±0.04 | 44.83±0.05 | 4.50±0.02 |
| S15 | 52.57±0.14 | 254.78±0.37 | 64.72±0.18 | 16.63±0.04 | 48.11±1.25 | 15.58±0.34 | 167.93±2.24 | 432.86±0.24 | 312.21±1.99 | 9.28±0.01 | 42.73±0.02 | 70.52±0.01 | 6.47±0.06 |
| S16 | 56.05±0.10 | 257.4±0.33 | 69.07±0.01 | 17.08±0.06 | 50.59±1.26 | 12.38±0.21 | 176.13±0.32 | 443.62±0.73 | 322.06±1.85 | 9.59±0.18 | 43.30±0.09 | 70.18±0.37 | 6.14±0.15 |
| S17 | 66.20±0.24 | 384.77±0.43 | 72.13±0.19 | 12.17±0.05 | 48.52±0.03 | 11.92±0.01 | 195.11±0.06 | 526.49±0.17 | 350.16±0.10 | 9.19±0.02 | 34.38±0.01 | 61.41±0.03 | 4.31±0.01 |
| S18 | 63.58±0.55 | 350.91±0.02 | 69.94±0.14 | 12.22±0.01 | 47.43±0.10 | 16.34±0.02 | 189.55±0.10 | 481.12±0.01 | 323.07±1.77 | 9.03±0.01 | 36.04±0.02 | 62.04±0.03 | 4.86±0.05 |
| S19 | 62.18±0.08 | 312.67±0.02 | 68.55±0.03 | 13.24±0.02 | 47.67±0.46 | 10.84±0.19 | 183.07±0.35 | 457.60±0.27 | 318.30±0.49 | 8.86±0.01 | 34.94±0.65 | 62.47±0.07 | 4.91±0.10 |
| S20 | 63.61±0.12 | 336.06±0.87 | 69.92±0.51 | 13.99±0.14 | 46.14±0.59 | 10.57±0.12 | 181.20±1.73 | 476.28±1.76 | 320.77±1.84 | 8.60±0.01 | 34.95±0.08 | 60.84±0.29 | 4.59±0.02 |
| S21 | 54.84±0.42 | 344.76±1.90 | 42.87±0.53 | 8.29±0.10 | 36.45±1.25 | 14.06±0.38 | 104.06±0.14 | 508.63±2.69 | 211.57±0.79 | 2.26±0.03 | 10.17±0.19 | 15.55±0.13 | 1.65±0.04 |
| S22 | 55.97±0.62 | 336.04±1.58 | 40.88±0.51 | 8.16±0.20 | 37.78±1.19 | 11.70±0.36 | 106.78±1.05 | 537.01±0.88 | 218.79±4.74 | 2.28±0.04 | 10.22±0.10 | 16.22±0.03 | 1.84±0.02 |
| S23 | 52.56±0.07 | 332.28±0.16 | 40.71±0.10 | 8.22±0.06 | 34.75±0.77 | 13.34±0.08 | 100.85±0.07 | 500.19±1.70 | 207.38±1.43 | 2.44±0.15 | 11.65±0.01 | 17.71±0.04 | 2.08±0.02 |
| S24 | 57.74±0.25 | 359.16±0.87 | 41.57±0.12 | 8.43±0.01 | 40.06±0.09 | 19.70±0.44 | 110.32±0.10 | 547.13±0.90 | 224.86±0.63 | 2.89±0.04 | 11.22±0.04 | 17.51±0.01 | 1.98±0.01 |
3.4. Anti-inflammatory activity of A. argyi leaves
The LPS-induced RAW 264.7 cells were employed to estimate the anti-inflammatory effect of A. argyi leaves samples, and the inhibition rates of NO production was selected to assess the anti-inflammatory capacities of A. argyi leaves samples. Firstly, the cytotoxicity of A. argyi leaves samples was evaluated. The macrophages were treated with different concentrations (5, 10, 25, 50, 100 μg/mL) of A. argyi leaves samples, and the cell viability was measured by the CCK-8 kit. As showed in Figure 4(a), cell viabilities with different concentrations of A. argyi leaves samples were greater than 90, which indicated that the A. argyi leaves samples did not exhibit cytotoxic effects on macrophages with concentration ranging from 5 to100 μg/mL, and A. argyi leaves samples with non-cytotoxic concentrations were used in the next anti-inflammatory experiments.
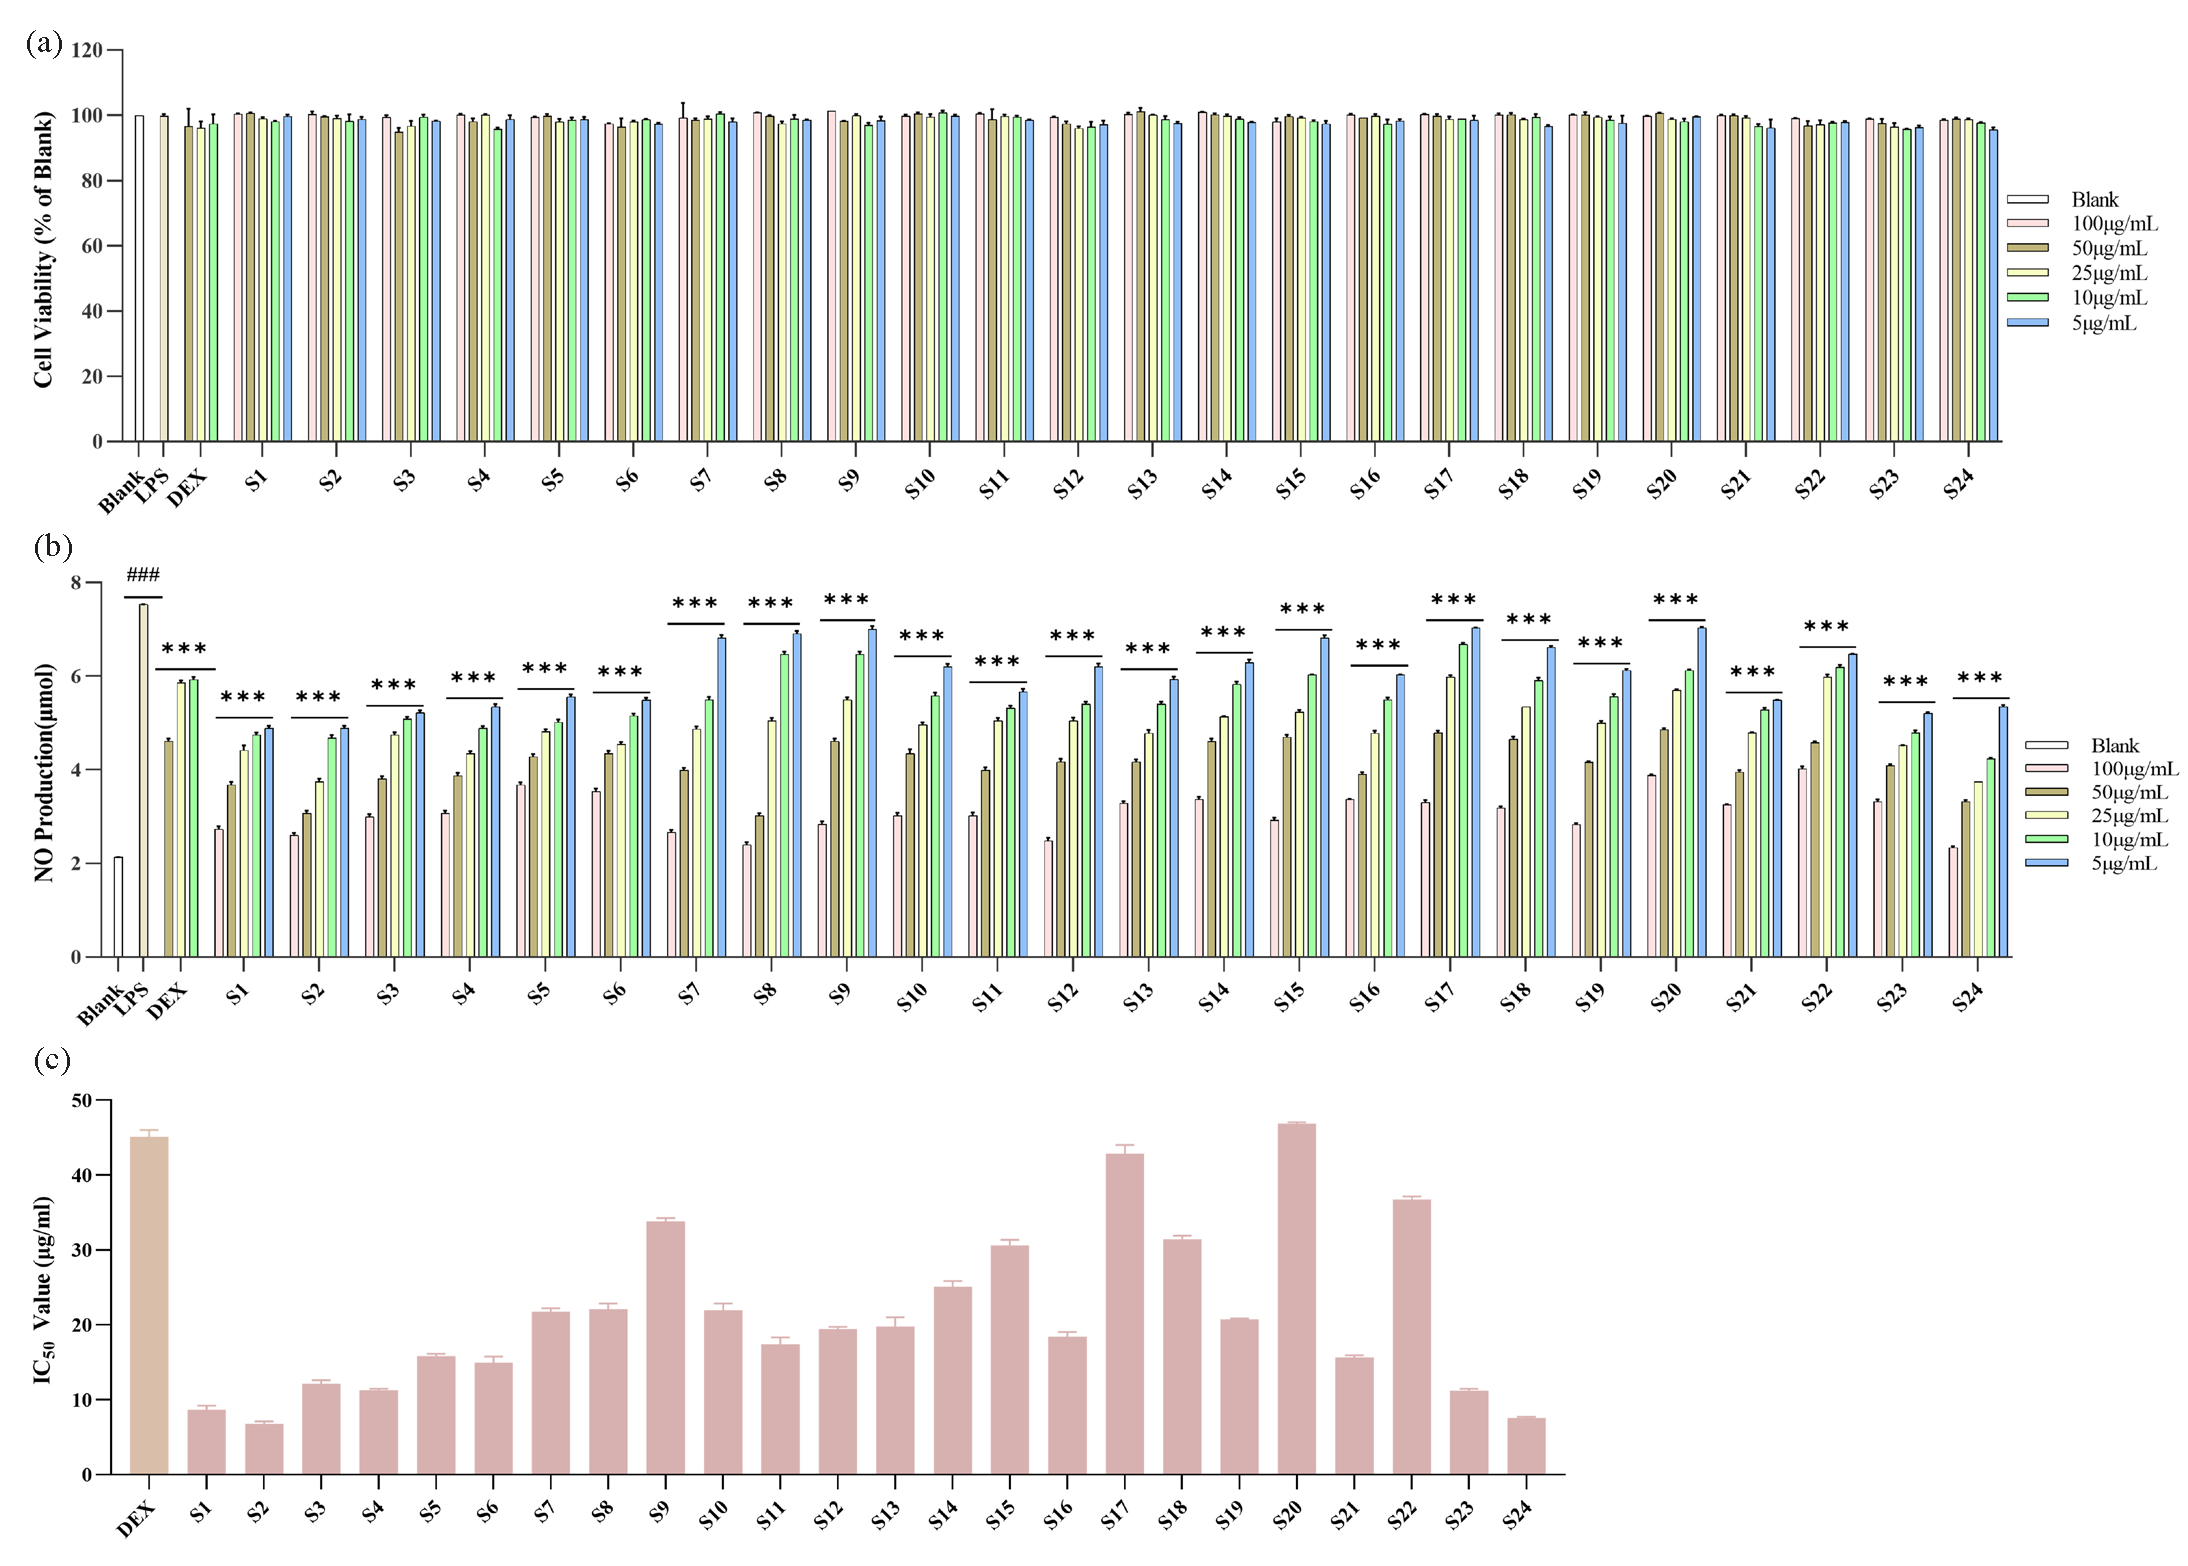
- The effects of A. argyi leaves samples on LPS-induced RAW264.7 cells. (a) Cell viability. (b) NO production. (c) IC50 values of NO production. ###p < 0.001 compared to Blank group, ***p < 0.001 compared to LPS-induce group.
The NO production in LPS-induced RAW264.7 macrophages treated with A. argyi leaves was determined by Griess reagent. The release of NO in the LPS group was significantly greater than that in the blank group (p < 0.001), which indicated the successful construction of the LPS-induced RAW264.7 cells inflammation model (Figure 4b). Compared with LPS group, the NO production of samples group and positive control group (DEX) were significantly decreased (p < 0.001). It could be noted that all 24 batches of A. argyi leaves could inhibit the release of NO production, which indicated that they possessed certain anti-inflammatory capacities. To compare anti-inflammatory capacities of different batches of A. argyi leaves, the IC50 NO inhibition rates were calculated (Table 3). The IC50 values of A. argyi leaves samples were in the range of 6.78 ± 0.28 to 46.91 ± 0.14 μg/mL, and the IC50 values of the positive control (DEX) was 45.12 ± 0.74 μg/mL Figure 4(c). Based on the results of secondary metabolites quantitation and anti-inflammatory capacities of A. argyi leaves, it was demonstrated that these effects vary greatly, and the contents of the 13 secondary metabolites were also different. The differences of anti-inflammatory capacities of A. argyi leaves samples could be due to a variation of active secondary metabolites in different samples. Therefore, spectrum-effect relationships analysis was implemented to reveal latent correlation between secondary metabolites and anti-inflammatory capacities and discover secondary metabolites with anti-inflammatory activity in A. argyi leaves.
| No. | IC50 (μg/mL) | No. | IC50 (μg/mL) |
|---|---|---|---|
| S1 | 8.63 ± 0.48 | S13 | 19.83 ± 0.96 |
| S2 | 6.78 ± 0.28 | S14 | 25.09 ± 0.62 |
| S3 | 12.14 ± 0.37 | S15 | 30.61 ± 0.59 |
| S4 | 11.23 ± 0.19 | S16 | 18.40 ± 0.54 |
| S5 | 15.80 ± 0.27 | S17 | 42.84 ± 0.96 |
| S6 | 14.94 ± 0.68 | S18 | 31.42 ± 0.40 |
| S7 | 21.75 ± 0.39 | S19 | 20.75 ± 0.07 |
| S8 | 22.12 ± 0.61 | S20 | 46.91 ± 0.14 |
| S9 | 33.79 ± 0.37 | S21 | 15.63 ± 0.26 |
| S10 | 21.93 ± 0.77 | S22 | 36.75 ± 0.33 |
| S11 | 17.44 ± 0.71 | S23 | 11.17 ± 0.26 |
| S12 | 19.45 ± 0.23 | S24 | 7.55 ± 0.14 |
3.5. Discovery of the anti-inflammatory components by spectrum-effect relationship
3.5.1. Gray relational analysis (GRA)
GRA is a multivariate statistical approach that could reveal connections among various factors and is widely applied in spectrum-effect relationship analysis [21]. Thus, the GRA was first employed to explore connections between secondary metabolites and the anti-inflammatory capacities of A. argyi leaves. The contents of 13 metabolites were recognized as sub-sequence, and the anti-inflammatory capacities (IC50 of NO inhibition rates) were recognized as parent sub-sequence. The GRA model was established, and GRD was calculated to explore the relationships between secondary metabolites and anti-inflammatory activities. The GRD of 13 metabolites including 5-caffeoylquinic acid, 3-caffeoylquinic acid, 4-caffeoylquinic acid, caffeic acid, schaftoside, rutin, 3,4-dicaffeoylquinic acid, 3,5-dicaffeoylquinic acid, 4,5-dicaffeoylquinic acid, hispidulin, jaceosidin, eupatilin, and casticin were 0.9062, 0.8650, 0.9004, 0.8969, 0.9488, 0.8863, 0.8773, 0.9223, 0.9163, 0.7397, 0.5955, 0.6791, and 0.7601, respectively (Figure 5a). The higher the GRD was, the greater anti-inflammatory effect the constituent had. The GRA results showed that there were nine secondary metabolites with a GRD greater than 0.8, which indicated that A. argyi leaves contain many anti-inflammatory metabolites and their anti-inflammatory effects might be a result of the combined actions of multiple secondary metabolites.
- The results of spectrum-effect relationship analysis. (a) The gray correlation degree (GRD) of thirteen secondary metabolites and anti-inflammation activities in GRA. (b) The regression coefficients of thirteen constituents and anti-inflammation activities in PLSR.
3.5.2. Partial least squares regression analysis (PLSR)
PLSR is a versatile approach that explores the interconnections among different factors and handles multiple independent variables by integrating multiple linear regression and principal component analysis [33]. In the present work, PLSR was further established to investigate connections between secondary metabolites and the anti-inflammatory capacities of A. argyi leaves. The contents of the 13 metabolites were defined as independent variables X, and the IC50 values of NO inhibition rates were defined as dependent variables Y, and the PLSR model was established. The regression coefficients of 13 secondary metabolites in A. argyi leaves were calculated. As shown in Figure 5(b), five secondary metabolites, including 3-caffeoylquinic acid, schaftoside, rutin, 3,4-dicaffeoylquinic acid, and 3,5-dicaffeoylquinic acid showed negative regression coefficients to the IC50 values, which indicated that these five metabolites had significant anti-inflammatory activities. The greater the absolute value of regression coefficient was, the greater the anti-inflammatory capacities the constituent had. The absolute values of regression coefficients were as following order: schaftoside > 3,4-dicaffeoylquinic acid > rutin > 3,5-dicaffeoylquinic acid > 3-caffeoylquinic acid, which was basically consistent with the results of GRA. The PLSR results also indicated that A. argyi leaves contain several anti-inflammatory metabolites, and the anti-inflammatory activities could be a result of combined actions.
3.5.3. Spectrum-effect relationship analysis
GRA and PLSR, two commonly used spectrum-effect relationship methods were applied to reveal relationships between secondary metabolites and anti-inflammatory capacities, and to discover anti-inflammatory components in A. argyi leaves. Based on the GRA and PLSR, some specific metabolites in A. argyi leaves made a significant contribution to the anti-inflammatory effects, and the anti-inflammatory activities of A. argyi leaves could be due to the combined effect of numerous secondary metabolites. Combining GRA and PLSR results, the secondary metabolites that simultaneously satisfied the GRD values greater than 0.8 and negative regression coefficients were discovered as the potential anti-inflammatory active ingredients of A. argyi leaves. According to the above screening principle, five secondary metabolites, including two flavonoids (rutin and schaftoside) and three phenolic acids (3-caffeoylquinic acid, 3,5-dicaffeoylquinic acid, and 3,4-dicaffeoylquinic acid) could be recognized as potential anti-inflammatory constituents in A. argyi leaves.
3.6. Anti-inflammatory effects of the anti-inflammatory constituents in A. argyi leaves
3.6.1. Inhibition of NO, IL-6, IL-1β and TNF-α production
The above results revealed rutin, schaftoside, 3-caffeoylquinic acid, 3,5-dicaffeoylquinic acid, and 3,4-dicaffeoylquinic acid to be the potential anti-inflammatory compounds in A. argyi leaves. To ascertain that the anti-inflammatory activity of A. argyi leaves was ascribed to the selected constituents, the anti-inflammatory capabilities of rutin, schaftoside, 3-caffeoylquinic acid, 3,5-dicaffeoylquinic acid, and 3,4-dicaffeoylquinic acid were evaluated in LPS-induced RAW264.7 macrophage cells. Firstly, cell viabilities of RAW264.7 macrophages treated with rutin (10-80 μM), schaftoside (10-80 μM), 3-caffeoylquinic acid (18-144 μM), 3,5-dicaffeoylquinic acid (12-96 μM), and 3,4-dicaffeoylquinic acid (48- 192 μM) were tested by CCK-8 kits. The results (Figure 6a) showed that the cell viabilities were no significant difference between the sample and control groups, and the cells viabilities of different concentrations of the five compounds were all greater than 90%. Furthermore, the inhibition of the five potential anti-inflammatory constituents with different concentrations of NO, IL-6, IL-1β, and TNF-α production in LPS-induced RAW264.7 cells was investigated. As shown in Figure 6(b-f), the five compounds exhibited certain and dose-dependent inhibitory effects on NO, IL-6, IL-1β and TNF-α production. The IC50 of the five potential anti-inflammatory constituents on release of NO, IL-6, IL-1β and TNF-α were also calculated. As shown in Table 4, for NO release, the IC50 values of rutin, schaftoside, 3-caffeoylquinic acid, 3,5-dicaffeoylquinic acid, and 3,4-dicaffeoylquinic acid were 36.07 ± 0.82 μM, 35.60 ± 0.45 μM, 59.91 ± 1.77 μM, 48.46 ± 0.56 μM, and 94.51 ± 1.05 μM, respectively. For IL-6, the IC50 values were 22.76 ± 0.05 μM, 45.53 ± 0.34 μM, 51.48 ± 0.12 μM, 61.99 ± 0.08 μM, and 78.45 ± 0.58 μM. For IL-1β, the IC50 values were 25.50 ± 0.91 μM, 24.55 ± 0.76 μM, 29.92 ± 1.14 μM, 31.09 ± 1.32 μM, and 52.66 ± 0.66 μM. For TNF-α, the IC50 values were 48.17 ± 0.25 μM, 66.11 ± 0.18 μM, 164.05 ± 0.96 μM, 98.72 ± 0.48 μM, and 122.43 ± 1.04 μM. It is clear that schaftoside presented relatively lower IC50 values on NO, IL-1β, IL-6, and TNF-α production among the flavonoids, while 3,5-dicaffeoylquinic acid presented relatively lower IC50 values on NO, IL-1β, IL-6, and TNF-α production among the phenolic acids. Therefore, 3,5-dicaffeoylquinic acid and schaftoside have relatively great anti-inflammatory effects among the five potential anti-inflammatory constituents, which were further used in mechanism research of the anti-inflammatory metabolites in A. argyi leaves.
- The effects of rutin, schaftoside, 3-caffeoylquinic acid, 3,5-di caffeoylquinic acid and 3,4-dicaffeoylquinic acid on LPS-induced RAW264.7 cells. (a) Cell viability. (b) NO production. (c) IL-6 production. (d) IL-1β production. (e) TNF-α production. (f) IC50 values of NO, IL-6, IL-1β and TNF-α production. ###p < 0.001 compared to Blank group, ***p < 0.001 compared to LPS-induce group.
| Compound | IC50 (μM) | |||
|---|---|---|---|---|
| NO | IL-6 | IL-1β | TNF-α | |
| Rutin | 36.07 ± 0.82 | 22.76 ± 0.05 | 25.50 ± 0.91 | 48.17 ± 0.25 |
| Schaftoside | 35.60 ± 0.45 | 45.53 ± 0.34 | 24.55 ± 0.76 | 66.11 ± 0.18 |
| 3-caffeoylquinic acid | 59.91 ± 1.77 | 51.48 ± 0.12 | 29.92 ± 1.14 | 164.05 ± 0.96 |
| 3,5-dicaffeoylquinic acid | 48.46 ± 0.56 | 61.99 ± 0.08 | 31.09 ± 1.32 | 98.72 ± 0.48 |
| 3,4-dicaffeoylquinic acid | 94.51 ± 1.05 | 78.45 ± 0.58 | 52.66 ± 0.66 | 122.43 ± 1.04 |
3.6.2. 3,5-Dicaffeoylquinic acid and schaftoside exhibited anti-inflammatory effects through MAPK pathway
To further validate the results of spectrum-effect relationship analysis and reveal the anti-inflammatory mechanism of the main metabolites in A. argyi leaves, western blot was employed to measure the expression of proteins in the MAPK pathway. MAPK are important factors involved in controlling the signal transduction pathway of inflammatory mediators in macrophages. LPS stimulation induced phosphorylation of p38, ERK and JNK MAPK, and MAPK had distinct roles in the regulation of pro-inflammatory mediators (IL-6, IL-1β and TNF-α) production [34]. As 3,5-dicaffeoylquinic acid and schaftoside have relatively great anti-inflammatory effects among the five potential anti-inflammatory constituents and these two compounds markedly inhibited the secretion of pro-inflammatory mediators, the mechanism by which 3,5-dicaffeoylquinic acid and schaftoside inhibits LPS-induced inflammation in RAW264.7 cells was further evaluated through MAPK signal pathway Figure 7(a).
- (i) The effects of A. argyi leaves extraction, (ii) 3,5-dicaffeoylquinic acid and (iii) schaftoside on expression of iNOS, p-p38, p38, p-ERK, ERK, p-JNK and JNK proteins in LPS-induced RAW 264.7 cells. (a) The protein levels of iNOS, p-p38, p38, p-ERK, ERK, p-JNK, JNK and GAPDH. (b) Relative density of iNOS. (c) Statistical analysis for ratios of p-p38/p38. (d) Statistical analysis for ratios of p-ERK/ERK. (e) Statistical analysis for ratios of p-JNK/JNK. Each bar represents the mean ± SD (n = 3). ###p < 0.001 compared to Blank group, *p < 0.05 compared to LPS-induced group, **p < 0.01 compared to LPS-induced group, ***p < 0.001 compared to LPS-induced group.
MAPK is crucial for regulating cellular responses to cytokines, and its phosphorylation is linked to the activation of iNOS [35]. Thus, the protein levels of iNOS were measured. As shown in Figure 7(b), the protein expression of iNOS in RAW264.7 cells was up-regulated after LPS treated, whereas A. argyi leaves extraction and the two anti-inflammatory compounds (3,5-dicaffeoylquinic acid and schaftoside) treatment could effectively inhibited LPS-induced inducible nitric oxide synthase (iNOS) upregulation dose-dependently. Furthermore, p38, ERK, and JNK of the MAPK pathway and their phosphorylated proteins were measured. The western blot results showed that LPS could stimulate phosphorylation of p38, ERK, and JNK in macrophages (Figure 7c-e). A. argyi leaves extraction, 3,5-dicaffeoylquinic acid and schaftoside treatment could not impact total p38, ERK, and JNK protein levels in LPS-induced RAW264.7 macrophage, but they could effectively inhibit the expression of p-p38, p-ERK, and p-JNK. Moreover, the ratios of p-p38/p38, p-ERK/ERK, and p-JNK/JNK of the model group was significantly higher than that of control group, and the ratios of p-p38/p38, p-ERK/ERKc, and p-JNK/JNK were markedly down-regulated by A. argyi leaves extraction, 3,5-dicaffeoylquinic acid, and schaftoside dose-dependently. The western blot results showed that 3,5-dicaffeoylquinic acid and schaftoside could block MAPK activation by inhibiting phosphorylation levels of p38, ERK, and JNK, thereby inhibiting the production of pro-inflammatory cytokines. The above results indicated that the main anti-inflammatory compounds in A. argyi leaves could inhibit phosphorylation levels of p38, ERK, and JNK in the MAPK pathway, thus achieving the purpose of treatment and prevention of inflammatory diseases.
4. Conclusions
The research aimed to discover anti-inflammatory constituents in A. argyi leaves and explore their mechanism based on UPLC-Q/TOF-MS, spectrum-effect relationship analysis, and the MAPK pathway. The secondary metabolites in A. argyi leaves were characterized, and the chemical fingerprints of A. argyi leaves were established. Thirteen secondary metabolites in A. argyi leaves were recognized as common peaks, and the contents were quantified by HPLC method. The anti-inflammatory capacities of A. argyi leaves samples were preliminary evaluated by LPS-induced RAW264.7 macrophages. Based on quantitative and anti-inflammatory activities results, the spectrum-effect relationship was carried out using GRA and PLSR. The results showed that five secondary metabolites, including rutin, schaftoside, 3-caffeoylquinic acid, 3,5-dicaffeoylquinic acid, and 3,4-dicaffeoylquinic acid were screen out as anti-inflammatory constituents. The anti-inflammatory activity of the five metabolites was indicated by the fact that they showed great inhibition of NO, IL-6, IL-1β, and TNF-α, and 3,5-dicaffeoylquinic acid and schaftoside showed relatively great anti-inflammatory capabilities. Therefore, the anti-inflammatory mechanisms of 3,5-dicaffeoylquinic acid and schaftoside were further investigated via the MAPK pathway. The present study developed a feasible strategy to reveal the anti-inflammatory components and mechanism of A. argyi leaves. This work provided a comprehensive understanding of the anti-inflammatory constituents and mechanisms of A. argyi leaves and also provided evidence for the utilization of A. argyi leaves as anti-inflammatory supplements.
Acknowledgment
This research was funded by Natural Science Foundation of Hebei Province (H2024423015, H2022418001), S&T Program of Hebei Province (246W2501D, 223777127D, 22372503D), The Central Guidance on Local Science and Technology Development Fund of Hebei Province (226Z7714G), Hebei Province “333 Talents Project” Funded project (C20231013), Research Foundation of Hebei Provincial Administration of Traditional Chinese Medicine (Z2022019, 2022100).
CRediT authorship contribution statement
Yue Zhong: Data curation, Formal analysis, Writing – original draft. Yaqing Chang: Data curation, Formal analysis, Visualization. Yifan Du: Data curation, Formal analysis. Yanli Ji: Validation, Visualization. Ziyu Gu: Data curation, Formal analysis. Yuguang Zheng: Resources, Supervision. Dan Zhang: Conceptualization, Writing – review & editing. Long Guo: Conceptualization, Funding acquisition, Validation, Writing – review & editing.
Declaration of competing interest
The authors declare that they have no known competing financial interests or personal relationships that could have appeared to influence the work reported in this paper.
Declaration of Generative AI and AI-assisted technologies in the writing process
The authors confirm that there was no use of artificial intelligence (AI)-assisted technology for assisting in the writing or editing of the manuscript and no images were manipulated using AI.
Supplementary data
Supplementary material to this article can be found online at https://dx.doi.org/10.25259/AJC_229_2024.
References
- From longevity grass to contemporary soft gold: Explore the chemical constituents, pharmacology, and toxicology of artemisia argyi h.Lév. & vaniot essential oil. Journal of Ethnopharmacology. 2021;279:114404. https://doi.org/10.1016/j.jep.2021.114404
- [Google Scholar]
- Exploring the mechanism of artemisia argyi chemical composition for ulcerative colitis based on network pharmacology. Arabian Journal of Chemistry. 2023;16:105050. https://doi.org/10.1016/j.arabjc.2023.105050
- [Google Scholar]
- Bioactivity-based analysis and chemical characterization of hypoglycemic and antioxidant components from artemisia argyi. Bioorganic Chemistry. 2019;92:103268. https://doi.org/10.1016/j.bioorg.2019.103268
- [Google Scholar]
- Polysaccharides from artemisia argyi leaves: Environmentally friendly ultrasound-assisted extraction and antifatigue activities. Ultrasonics Sonochemistry. 2024;107:106932. https://doi.org/10.1016/j.ultsonch.2024.106932
- [Google Scholar]
- Phytochemical components and biological activities of artemisia argyi. Journal of Functional Foods. 2019;52:648-662. https://doi.org/10.1016/j.jff.2018.11.029
- [Google Scholar]
- Comparison and chemometrics analysis of phenolic compounds and mineral elements in artemisia argyi folium from different geographical origins. Food Chemistry: X. 2024;24:101909. https://doi.org/10.1016/j.fochx.2024.101909
- [Google Scholar]
- Chemical composition analysis and discrimination of essential oils of artemisia argyi folium from different germplasm resources based on electronic nose and GC/MS combined with chemometrics. Chemistry & Biodiversity. 2023;20:e202200991. https://doi.org/10.1002/cbdv.202200991
- [Google Scholar]
- Chemical constituents and biological activities of Artemisia argyi h.Lév. & vaniot. Natural Product Research. 2023;37:1401-5. https://doi.org/10.1080/14786419.2021.2010071
- [Google Scholar]
- Gastro-protective effect of edible plant artemisia argyi in ethanol-induced rats via normalizing inflammatory responses and oxidative stress. Journal of Ethnopharmacology. 2018;214:207-217. https://doi.org/10.1016/j.jep.2017.12.023
- [Google Scholar]
- Dual bioactivities of essential oil extracted from the leaves of artemisia argyi as an antimelanogenic versus antioxidant agent and chemical composition analysis by GC/MS. International Journal of Molecular Sciences. 2012;13:14679-14697. https://doi.org/10.3390/ijms131114679
- [Google Scholar]
- Antitumor and immunomodulatory activities of a polysaccharide from artemisia argyi. Carbohydrate Polymers. 2013;98:1236-1243. https://doi.org/10.1016/j.carbpol.2013.07.018
- [Google Scholar]
- Artemisia argyi polyphenols attenuates DSS-induced colitis in mice by regulating the structural composition of gut microbiota. Phytomedicine : International Journal of Phytotherapy and Phytopharmacology. 2024;132:155897. https://doi.org/10.1016/j.phymed.2024.155897
- [Google Scholar]
- The water-soluble subfraction from artemisia argyi alleviates LPS-induced inflammatory responses via multiple pathways and targets in vitro and in vivo. Journal of Ethnopharmacology. 2024;319:117364. https://doi.org/10.1016/j.jep.2023.117364
- [Google Scholar]
- Ingredients with anti-inflammatory effect from medicine food homology plants. Food Chemistry. 2022;368:130610. https://doi.org/10.1016/j.foodchem.2021.130610
- [Google Scholar]
- Revealing quality chemicals of tetrastigma hemsleyanum roots in different geographical origins using untargeted metabolomics and random-forest based spectrum-effect analysis. Food Chemistry. 2024;449:139207. https://doi.org/10.1016/j.foodchem.2024.139207
- [Google Scholar]
- Identification and quantitation of NF-κB inhibitory components in weichang’an pill based on UHPLC-QE-MS and spectrum-effect relationship. Arabian Journal of Chemistry. 2024;17:105328. https://doi.org/10.1016/j.arabjc.2023.105328
- [Google Scholar]
- Identification of key phenolic compounds for alleviating gouty inflammation in edible chrysanthemums based on spectrum-effect relationship analyses. Food Chemistry: X. 2023;20:100897. https://doi.org/10.1016/j.fochx.2023.100897
- [Google Scholar]
- Differential analysis of phytochemistry and antioxidant activity in five citrus by-products based on chromatography, mass spectrometry, and spectrum-effect relationships. Food Chemistry: X. 2023;20:101010. https://doi.org/10.1016/j.fochx.2023.101010
- [Google Scholar]
- A comprehensive strategy combined chemical spectrum with anti-inflammatory activity for screening combinatorial quality markers of valeriana jatamansi jones. Arabian Journal of Chemistry. 2024;17:105367. https://doi.org/10.1016/j.arabjc.2023.105367
- [Google Scholar]
- Anti-inflammatory effects of flavonoids. Food Chemistry. 2019;299:125124. https://doi.org/10.1016/j.foodchem.2019.125124
- [Google Scholar]
- Screening of anti-inflammatory activities components of angelica dahurica root based on spectrum-effect relationship analysis and NF-κB pathway. Frontiers in Pharmacology. 2024;15:1396001. https://doi.org/10.3389/fphar.2024.1396001
- [Google Scholar]
- Identification and anti-inflammatory activity of flavonoids from cardiospermum halicacabum in murine RAW 264.7 macrophage-A bioassay-guided approach. Food Bioscience. 2024;61:104510. https://doi.org/10.1016/j.fbio.2024.104510
- [Google Scholar]
- Novel modified probiotic gold nanoparticles loaded with ginsenoside CK exerts an anti-inflammation effect via NF-κB/MAPK signaling pathways. Arabian Journal of Chemistry. 2024;17:105650. https://doi.org/10.1016/j.arabjc.2024.105650
- [Google Scholar]
- Ginseng root extract attenuates inflammation by inhibiting the MAPK/NF-κB signaling pathway and activating autophagy and p62-Nrf2-Keap1 signaling in vitro and in vivo. Journal of Ethnopharmacology. 2022;283:114739. https://doi.org/10.1016/j.jep.2021.114739
- [Google Scholar]
- Synergistic anti-inflammatory effects of silibinin and thymol combination on LPS-induced RAW264.7 cells by inhibition of NF-κB and MAPK activation. Phytomedicine : International Journal of Phytotherapy and Phytopharmacology. 2020;78:153309. https://doi.org/10.1016/j.phymed.2020.153309
- [Google Scholar]
- Potential mechanisms underlying the protective effects of tricholoma matsutake singer peptides against LPS-induced inflammation in RAW264.7 macrophages. Food Chemistry. 2021;353:129452. https://doi.org/10.1016/j.foodchem.2021.129452
- [Google Scholar]
- A comparative UPLC-MS-based metabolomics approach for distinguishing four different cultivars of qiai (Artemisia argyi lévl. et van.) Arabian Journal of Chemistry. 2024;17:105452. https://doi.org/10.1016/j.arabjc.2023.105452
- [Google Scholar]
- Characterization of phenolics and discovery of α-glucosidase inhibitors in artemisia argyi leaves based on ultra-performance liquid chromatography-tandem mass spectrometry and relevance analysis. Journal of Pharmaceutical and Biomedical Analysis. 2022;220:114982. https://doi.org/10.1016/j.jpba.2022.114982
- [Google Scholar]
- Integrated strategy for identifying minor components in complex samples combining mass defect, diagnostic ions and neutral loss information based on ultra-performance liquid chromatography-high resolution mass spectrometry platform: Folium artemisiae argyi as a case study. Journal of Chromatography. A. 2018;1550:35-44. https://doi.org/10.1016/j.chroma.2018.03.044
- [Google Scholar]
- Comprehensive characterization and identification of antioxidants in folium artemisiae argyi using high-resolution tandem mass spectrometry. Journal of Chromatography. B, Analytical Technologies in the Biomedical and Life Sciences. 2017;1063:84-92. https://doi.org/10.1016/j.jchromb.2017.08.021
- [Google Scholar]
- Application of polyphenolic compound-based HPLC fingerprint in chinese golden camellias (Camellia sect Chrysantha) Food Control. 2024;161:110414. https://doi.org/10.1016/j.foodcont.2024.110414
- [Google Scholar]
- Geographical origin identification of cinnamon using HPLC-DAD fingerprints and chemometrics. Microchemical Journal. 2024;207:111768. https://doi.org/10.1016/j.microc.2024.111768
- [Google Scholar]
- Chemical characterization of different parts of forsythia suspensa and α-glucosidase and pancreatic lipase inhibitors screening based on UPLC-QTOF-MS/MS and plant metabolomics analysis. Arabian Journal of Chemistry. 2024;17:105723. https://doi.org/10.1016/j.arabjc.2024.105723
- [Google Scholar]
- Anti-inflammatory effect of essential oil and its constituents from fingered citron (Citrus medica l. var. sarcodactylis) through blocking JNK, ERK and NF-κB signaling pathways in LPS-activated RAW 264.7 cells. Food and Chemical Toxicology : An International Journal Published for the British Industrial Biological Research Association. 2013;57:126-131. https://doi.org/10.1016/j.fct.2013.03.017
- [Google Scholar]
- Flavonoid fisetin alleviates kidney inflammation and apoptosis via inhibiting src-mediated NF-κB p65 and MAPK signaling pathways in septic AKI mice. Biomedicine & Pharmacotherapy = Biomedecine & Pharmacotherapie. 2020;122:109772. https://doi.org/10.1016/j.biopha.2019.109772
- [Google Scholar]


