

Translate this page into:
Computational assessment of the reactivity and pharmaceutical potential of novel triazole derivatives: An approach combining DFT calculations, molecular dynamics simulations, and molecular docking
⁎Corresponding author. a.sbai@umi.ac.ma (Abdelouahid Sbai)
-
Received: ,
Accepted: ,
This article was originally published by Elsevier and was migrated to Scientific Scholar after the change of Publisher.
Peer review under responsibility of King Saud University.
Abstract
The worldwide prevalence of cancer and its increasing frequency make it a key research area in drug discovery programs. The current research paper describes the development of QSAR models based on the in vitro against topoisomerase II, which identified the structural origin of anticancer activity for derivatives of triazole moieties linked to mansonone E. The models PLS regression QSARs validated by LOO showed an R2 of 0.92, 0.89 and 0.99 and a Q2 of 0.75, 0.62 and 0.88 for CoMFA, CoMSIA and HQSAR respectively. External validation criteria were used to validate the reliability of the models. These results show the impact of electrostatic and steric fields and of the hydrogen bond donor on the activity of the compounds studied. Based on these results, seven novel inhibitors with high activity were designed, which successfully passed Lipinski's rule of five for oral bioavailability. The evaluations of ADME/Tox parameters and synthetic accessibility for chemical synthesis showed acceptable results. Ligand interactions in binding site protein were assessed using molecular docking. The results show the correct conformational pose of the designed compounds especially the compound T1 where it forms hydrogen and hydrophobic interactions with the main binding site residues. The stability of the complexes was confirmed by the MD study and the calculation of the free binding energy. The T1 synthesis reaction was carried out according to the 1,3 cycloaddition reaction. The study of the local and global reactivity and the energy of activation of this reaction have shown the predicted of the regioselectivity of compound T1. Also we have described the state of transition of two isomers T1,4 and T1.5. Finally, this study would be interesting to help identify and optimize avenues for early discovery of anticancer drugs.
Keywords
QSAR
Topoisomerase IIα
Docking
MD simulation
ADMET

1 Introduction
Despite the interesting scientific progress has been made against the development of cancer in the last year, cancer remains a leading cause of death this century. For this reason, the search for anti-cancer drugs remains one of the main goals of medicinal chemistry. The development of a new anticancer drug must take into consideration certain criteria such as clinical use, a better balance between toxic and pharmacological effects and the ability to overcome the problem of primary or acquired tumor resistance. Among cancer chemotherapeutic agents targeting DNA and enzymes involved in DNA metabolism, we find DNA topoisomerases. Topoisomerases are nuclear enzymes that cause the splitting and resoldering of DNA strands by controlling the topological state of DNA during the different phases of DNA functions (replication, transcription, repair, and recombination(Holden et al., 1990; LaVoie et al., 1999). Unwinding of DNA in the replication phase can lead to the formation of supercoils, hence topoisomerases can prevent the buildup of internal tensions in DNA nucleic acids. According to the mechanism of DNA cleavage in mammals, topoisomerases can be classified into two type topoisomerases type I and type II. Topoisomerase I acts by breaking a phosphodiester bond of one of the two strands of DNA, then binds to the 3′-phosphoryl end of DNA in order to untangle the DNA double helix and allow its replication(Pommier, 2009; Wang, 2002). Topoisomerase II modifies the topology of DNA by the same mechanism, but the transient cut takes place in two DNA strands. In cancerous cells the concentration of topoisomerase is raised to that of healthy cells (Preet et al., 2012). Research has reported topo II levels to be elevated in several breast and ovarian cancer cell lines while topo I levels are higher in colon cancer cell lines(Denny, 2003; Giovanella et al., 1989). Topoisomerases II exert their activity through a catalytic cycle of the ATPase domain (Chen et al., 2018; Roca and Wang, 1994). However, without topoisomerase enzyme there is no normal DNA replication, topoisomerase inhibitors are also cytotoxic can be used as anticancer agents to block the proliferation of malignant cells. The mechanism by which these catalytic inhibitors operate is succinctly examined in the context of the enzyme's catalytic cycle involved in DNA topoisomerization. Recent investigations, encompassing both structural and mechanistic studies, have unveiled the enzyme's dynamic behavior during the catalytic progression of this reaction, as documented in references(Hasinoff et al., 1997), (Kim and Wang, 1989),
Many naturally occurring anticancer drugs have been shown to be topoisomerase II inhibitors such as doxorubicin, their structure shows in Fig. 1.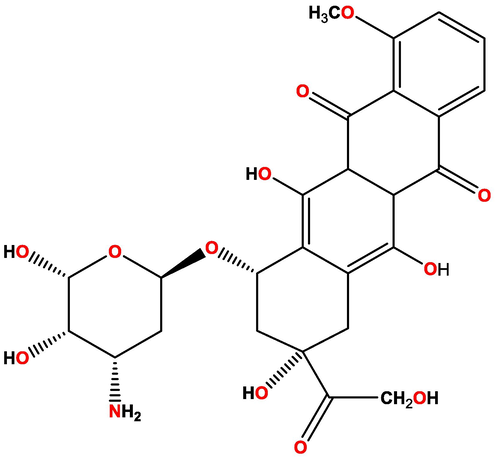
Structure 2D of doxorubicin as control compound used in QSAR study.
Several other SAR studies have also been employed for this purpose on other derivatives. A theoretical investigation in the field of drug design for topoisomerase IIα inhibitors was conducted by Sarfaraz Alam and Feroz Khan. Firstly, they developed and validated QSAR models using the multiple linear regression method, utilizing xanthone derivatives. Subsequently, through a molecular docking study and prediction of pharmacokinetic parameters, they identified ligand–protein interactions and estimated ADMET parameters for the studied derivatives(Alam and Khan, 2014). D. M. Khaled and colleagues used computational chemistry approaches to establish linear models explaining the activity of compounds based on thiouracil derivatives, employing quantum chemical and physicochemical descriptors(Khaled et al., 2022). Olawole Y. Adeniran and collaborators conducted linear regression modeling using the 3D QSAR method to design inhibitors of topoisomerase IIα(Adeniran et al., 2021).
Kairui Feng and colleagues utilized combined studies of 3D-QSAR guided by a pharmacophore, molecular docking, and molecular dynamics for evodiamine analogs as inhibitors of DNA topoisomerase I(Feng et al., 2017).
Recently, several works have been carried out on the development of anticancer inhibition based on mansonone (Liu et al., 2009; Wu et al., 2011). In addition, mansonones E have shown antitumor(Liu et al., 2009; Wang et al., 2004), antibacterial(Shin et al., 2004), antiMRSA(Suh et al., 2006), antiproliferative activities(Liu et al., 2009) and notably topoisomerase (Topo) inhibitory activity (Shin et al., 2004; Wu et al., 2011). The quinon moiety contained in mansonone has been identified by the National Cancer Institute as a pharmacophoric component of potent antitumor compounds (Driscoll et al., 1974). Several studies have shown that pyranic rings fused to naphthoquinone derivatives exhibit more effective anticancer activity(Kongkathip et al., 2003; Shukla et al., 2012; Wu et al., 2011). On the other hand, the triazole is widely explored in nucleoside anticancer agents, kinase inhibitors, tubulin modulators, aromatase and sulfatase inhibitors, and antitumor agents.
In this context, our study is based on analogues composed of mansonone E linked triazole fractions to analyze their biological activity against topoisomerase IIα on the cancer cell line human promyelocytic leukemia cell (HL-60). In recent years, Computer Aided Drug Discovery (CADD) approaches have been actively exploited to increase knowledge on the role of Topo II in cancer and to develop new strategies for its inhibition which has saved time and cost and designed a promoter drugs. These approaches are based on molecular structure such as QSAR modeling (quantitative-structure–activity relationship), molecular docking, and Molecular dynamic simulations(Kakkar et al., 2014; Tabti et al., 2022a). QSAR is a drug design approach based on exploiting the relationship between biological activity and the strictures of bioactive compounds(TABTI, 2020). In the present research work, three different QSAR techniques were used which included Comparative Molecular Field Analysis (CoMFA), Comparative Molecular Similarity Index Analysis (CoMSIA) and Molecular Hologram QSAR (HQSAR)(Tabti et al., 2022b). In CoMFA analysis, the biological activity was explained by steric and electrostatic parameters, while in CoMSIA analysis, the biological activity was explained by electrostatic steric, hydrophobic, hydrogen bond donor (H-Bond D), hydrogen bond acceptor (H-bond A), steric field and electrostatic parameters(OUABANE et al., 2023). In the case of HQSAR, the biological activity was explained by properties of atoms, stereochemistry and structural fractures of each group and atom of the molecules (Zhang et al., 2017). The information generated by these models makes it possible to design new, more powerful molecules. To fully understand the behavior of the predicted compounds in the active site of the protein, a molecular docking analysis was conducted, this study also allows to identify the key residues that govern the activity against topoisomerase IIα. Generally, molecular docking analyzes interactions between protein ligands, but under static conditions(Abdessadak et al., 2022). The results of molecular docking have been reinforced by a study of molecular dynamics and the calculation of free binding energy(En-Nahli et al., 2022). The best predicted T1 compound was subjected to a 1,3 cycloaddition reactivity study,to understand the reactivity of 1,3-dipolar cycloadditions and provide insights into their reaction mechanisms. These studies aim to predict the reaction outcomes, optimize reaction conditions, and design new compounds with enhanced reactivity and selectivity.
2 Research methods
2.1 Data set and training/test separation
A database of Twenty-two mansonone E-linked triazole derivatives and their biological activity against topoisomerase II (expressed as IC50 values) was brought from the literature(Huang et al., 2013). IC50 values of dataset span the entire activity range from 1.49 µM to 98 µM were converted to pIC50 (pIC50 = -log (IC50 [10-6])) and were used as dependent variables in the QSAR analysis(El Masaoudy et al., 2023). The compound dataset was randomly divided into a training set (77 %, 17 compounds) which was used to build the QSAR models and a test set (23 %, 5 compounds) which was used to assess the predictive ability of the models. The structures and their biological activity are shown in Table 1.
Compounds
pIC50 (Exp)
HQSAR
CoMFA
CoMSIA
Affinity Kcal/mol
pIC50 (calc)
Residus
pIC50 (calc)
Residus
pIC50 (calc)
Residus
R1
R2
1
4-F-Ph
Cl
4.973
4.943
0.03
4.973
0.000
4.968
0.005
−10.4
2
4-Cl-Ph
Cl
4.914
4.943
−0.029
4.914
0.067
4.82
0.094
−10.5
3
Ph
Cl
4.735
4.573
0.162
4.735
−0.109
4.7
0.035
−9.9
4
4-CH3-Ph
Cl
4.703
4.85
−0.147
4.703
−0.013
4.87
−0.167
−10.6
5
4-CH2CH3-Ph
Cl
5.538
5.411
0.127
5.538
0.067
5.457
0.081
−10.2
6
−4-(CH2)2CH3-Ph
Cl
5.623
5.65
−0.027
5.623
0.011
5.589
0.034
−10.2
7
−4-(CH2)3CH3-Ph
Cl
5.15
5.66
−0.51
5.593
0.000
5.593
0.000
−9.9
8*
−4-(CH2)4CH3-Ph
Cl
5.593
5.694
−0.101
5.451
0.000
6.145
−0.694
−9.6
9*
4-OCH3-Ph
Cl
5.451
5.019
0.432
5.150
−0.137
5.289
−0.139
−9.6
10

Cl
4.301
4.314
−0.013
4.301
−0.016
4.374
−0.073
−10.1
11
Cl
5.569
5.617
−0.048
5.569
−0.018
5.625
−0.056
−10.7
12
−4-F-Ph
Br
4.91
4.85
0.06
4.910
−0.038
4.912
−0.002
−10.6
13
−4-Cl-Ph
Br
4.813
4.85
−0.037
4.813
−0.033
4.833
−0.020
−10.6
14
Ph
Br
4.533
4.573
−0.04
4.533
0.078
4.463
0.070
−10.1
15*
4-CH3-Ph
Br
4.533
4.85
−0.317
4.988
−0.279
5.037
−0.049
−10.1
16
4-CH2CH3-Ph
Br
5.306
5.411
−0.105
5.306
−0.007
5.226
0.080
−10.4
17
−4-(CH2)2CH3-Ph
Br
5.827
5.65
0.177
5.827
−0.064
5.896
−0.069
−9.6
18
−4-(CH2)3CH3-Ph
Br
5.593
5.66
−0.067
5.593
0.014
5.615
−0.022
−9.9
19*
−4-(CH2)4CH3-Ph
Br
5.630
5.694
−0.064
5.631
0.003
5.939
−0.308
−9.6
20
4-OCH3-Ph
Br
4.987
5.019
−0.032
4.987
0.002
5.026
−0.039
−9.8
21*

Br
4.643
4.314
0.329
4.644
0.045
4.432
0.212
−9.7
22

Br
5.676
5.617
0.059
5.676
0.000
5.629
0.047
−10.5
2.2 Structural optimisation and alignment of the dataset
All chemical structures of molecules in the dataset were constructed and drawn in SYBYL X2.0 software (Tripos, Inc., St. Louis, MO, USA). The Tripos force field was included to minimize the structural energy of molecules while accounting for Gasteiger-Huckel atomic partial charges. Then, a convergence threshold of the Powell gradient algorithm was set at 0.05 kcal/mol. To ensure the conformational stability of the molecules, the number of iterations has been increased to 10,000 iterations. On another side, the molecular alignment of the dataset is a crucial phase for QSAR modeling, and the best alignment is reflected on the statistical results of the generated 3D QSAR models (Lu et al., 2010; Pandey and Saxena, 2006). In this present work, the distill rigid method has been adapted thanks to its better results for the generation of the 3D-QSAR model(El Mchichi et al., 2022). The most active molecule N17 was taken as a template, the results are shown in Fig. 2.
(a) Molecular alignment by rigid distill of the dataset, (A) most active N17 as template, (B) Common core of the data set compounds and (c) dataset alignment employed by distill rigid for 3D-QSAR modeling.
2.2.1 3D QSAR models
In our research, the 3D-QSAR approach includes Comparative Molecular Field Analysis (CoMFA), Comparative Molecular Similarity Index Analysis (CoMSIA). Generally the CoMFA hypothesis is based on when compounds of similar structures interact with the receptor site in the same way. Then, the molecular fields surrounding them must be similar. At the molecular level, compounds and receptors interact mainly through non-covalent bonds (van der Waals interactions and electrostatic interactions), therefore the steric and electrostatic interaction fields of the CoMFA model were calculated respectively by the Lennard/Jones potential and Coulomb potential on a 3D cubic lattice with a grid spacing of 2 Å in the three directions of space (x, y and z). Calculated energy values were truncated at 30.0 kcal/mol. In fact, most interactions between ligand and receptor are more complex, and therefore the steric field and the electrostatic field are not sufficient enough to build a present model. To rectify this lack the CoMSIA method has been included (Abdizadeh et al., 2017). Besides the calculation of static and electric fields, the CoMSIA approach also counts additional fields such as hydrophobicity, hydrogen bond donor and hydrogen bond acceptor fields. The calculation of the CoMSIA descriptors is done in the same network box. 3D-QSAR models allow visualization of molecular properties that inform biological activity in the form of contour maps, and therefore, these contours allow us to explain and identify regions that govern the activity of these compounds. However, among the limitations of the 3D QSAR contour map is that it is equipotential and does not allow to identify in exact the degree of influence of each atom of a molecular structure on the improvement of the biological activity. That's why we added the QSAR hologram method.
2.2.2 Hologram QSAR models
Given that the molecular fragments of compounds strongly contribute on the biological activity, thus to understand the influence of various molecular fragments on the activity, an HQSAR study was carried out on different possible combinations of parameters of distinction of fragments as well as the fragment generation parameters using SYBYL-X 2.0 software(Tabti et al., 2022b). Discrimination parameters including atomic number (A), bond type (B), atomic connection (C), hydrogen (H), chirality (Ch) and donor–acceptor (DA)(Amin et al., 2017). The lengths of the chosen holograms were set by default in the SYBYL-X 2.0 program to the values 53, 59, 61, 71, 83, 97, 151, 199, 257, 307, 353 and 401 bins. HQSAR models can be visualized as color-coded structure diagrams where each color code reflects its fragment's contribution to biological activity. Generally, the white-colored fragment indicates the intermediate contribution of a fragment while the green-colored and red-colored fragment suggests the positive and negative contribution respectively of this fragment on the biological activity.
2.3 Regression analysis and validation of QSAR models
The PLS regression, executed using SYBYLY-X2.0 software, was employed to quantify the linear relationship between biological activity (pIC50) and molecular descriptors. To determine the optimal number of components and the cross-validation coefficient Q2, as well as to statistically evaluate the established models (Vong et al., 1988), cross-validation was performed using the Leave-One-Out (LOO) method. However, to assess the statistical confidence of the generated models, a non-validation was carried out by calculating the coefficient of determination R2 and the standard error of estimation (SEE). It is important to note that a reliable evaluation of 3D-QSAR and HQSAR models through internal cross-validation alone is insufficient. Therefore, external validation is required, such as employing the Golbraikh-Tropsha criteria and Roy's metrics(Tabti et al., 2023d). Certain conditions need to be satisfied for the successful execution of this external validation, including(Tabti et al., 2023a):
Q2 > 0.5, R2 > 0.6, (R2 – R20)/R2 < 1, 0.85 ≤ K ≤ 1.15 (Golbraikh-Tropsha criteria);
r2 m < 0.2, r2 m > 0.5 (Roy's metrics).
On another side, The evaluation of the robustness of a QSAR model is based on carrying out a Y randomization test(Khan et al., 2019). In this test, a new model is generated by randomly shuffling the vector of the dependent variable. This procedure is repeated several times. The resulting QSAR model is only considered valid if the new QSPR models generated by randomization have low R2 and Q2 values.
2.4 The applicability domain (AD)
To choose an appropriate QSAR model for new compounds, it is essential to delineate its applicability domain of application AD((Tropsha et al., 2003). Model predictions should only be considered reliable for compounds included in this AD. Two simple approaches to define this scope are range extrapolation, based on the calculation of Euclidean distances and leverage (hi) for each chemical compound. Model predictions should only be considered reliable for compounds included in this scope. Among the simple approaches to define this field of application is the calculation of Euclidean distances and leverage (hi) for each chemical compound according to the following formula: The vector xi represents the k model parameters of the compound in question, while the matrix X is an n × k matrix containing the model parameters for each of the n training compounds. A leverage value exceeding 3(k + 1)/n is considered significant. This indicates that the model prediction, which can potentially compromise its reliability.
2.5 Limitations of the models developed
The models have notable limitations that require full recognition for informed interpretation of their results. First, these models are confronted with small data sets. Furthermore, the compounds examined only show moderate activity, which could potentially influence predictions in favor of this type of molecules. Another constraint lies in the absence of double-blind (nested) cross-validation, which could lead to overestimation of model performance(Baumann and Baumann, 2014). Additionally, using simple cross-validation, particularly Leave-One-Out (LOO), carries a risk of overfitting the training data, thereby jeopardizing the models' ability to generalize reliably(Chtita et al., 2021). To overcome these limitations, the combination of HQSAR, CoMFA and CoMSIA models presents significant advantages in terms of molecular modeling. This global approach exploits the complementarity of the information provided by each model, thus improving the reliability of the predictions. Additionally, it strengthens cross-validation, increasing confidence in the results. This synergy facilitates the precise identification of molecular descriptors relevant for drug design and improves the consideration of chemical diversity, thereby broadening the activity prediction capacity.
2.6 Molecular docking studies and re-docking validation
A molecular docking analysis using the program Autodock Tools vina 1.5.7 was carried out to evaluate the interaction and mode of binding between our studied compounds and the enzyme Topo IIα(Hajji et al., 2021). The 3D X-ray crystal structure of human DNA topoisomerase II α (PDB ID: 1ZXM, resolution = 1.87 Å) was downloaded from the Databank (https://www.rcsb.org). 1ZXM structure is a good target in the ATP catalytic pocket of topoisomerase IIα (Oyedele et al., 2020). The protein structure was prepared by the removal of 280 water molecules and the co-crystallized ligand (phosphoaminophosphonic acidadenylate ester (ANP)). Then the calculated Gasteiger charges and the polar hydrogen atoms were added and the non-polar hydrogens were merged using AutoDock Tools(Tabti et al., 2022c). The protein ligand interactions were framed in a grid defined over 2,0 Å in all three directions using the AutoGrid algorithm(Guo et al., 2005). In addition, the size of the grid space has been taken as the default of 0.375 Å while the central grid box is approximately (35.286 Å, −5.030 Å and 38.362 Å). The choice of best conformation was according to their good affinity towards the protein(Tabti et al., 2023c).
Contact Atlas (http://pca.mbgroup.bio/) as indicated Fig. 3 identifies the amino acids that form strong contacts, the amino acids found (first shell) are Glu-87, Asn-91, Ala-92, Asn-95, Arg-98, Asn-120, Ile-125, Ile-141, Phe-142, Ser-148, Ser-149, Asn-150, Gly-161, Arg-162, Asn-163, Gly-164, Tyr-165, Gly-166, Ala-167, Lys-168 Lys-215 Gln-376 and Lys-378 largely contributed to the affinity towards the selected protein. This vital information allows us to assess the contact patterns of protein ligands.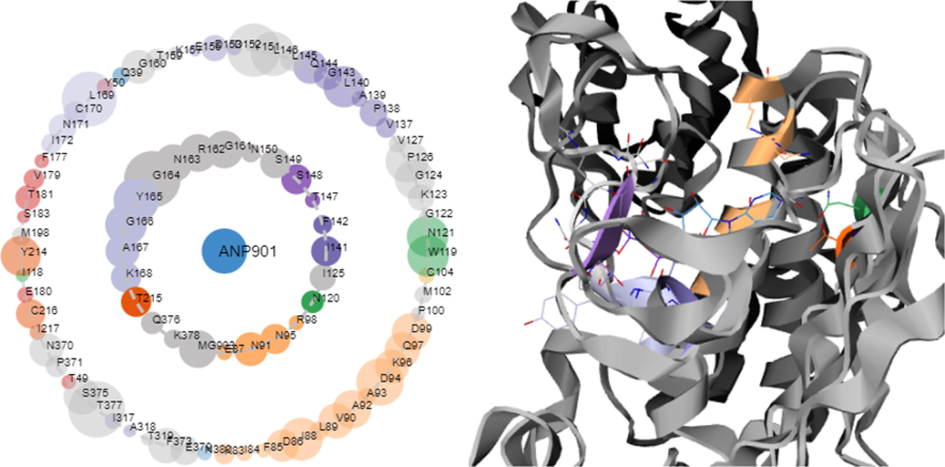
The human DNA topoisomerase IIα (PDB 1ZXM) co-crystal structure asteroid plots, The inner shell residues were those that had direct contact with the ligand molecule, whereas the outer shell residues were those that had indirect interactions with the ligand. The number of contacts residues formed with the ligand was represented by the size of the circular nodes.
2.7 Dynamic molecular analysis and post dynamic binding free energy analysis
The GROMACS 2019 software package with the Charmm force field was used to run a 100 ns MD simulation to validate the stability of the best complex molecular docking results under physiological conditions(Tabti et al., 2022d). The molecular topology file and force field parameters for the ligand were generated with the CHARMM general force field (CGenFF). The system of docked complexes were immersed in a cubic box of TIP3 water molecules with a margin distance of 10 Å. System neutralization was achieved by adding Na + counterions. The entire system was taken through 50,000 energy minimization steps using the steepest descent integrator to release the internal strain energies of the entire system. Then, NVT and NPT balancing were performed for 0.1 ns at 300 K and 1 ns at 1 bar pressure, respectively. System temperature and pressure were controlled by the Berendsen thermostat and the Parrinello/Rahman barostat respectively(Berendsen et al., 1984) (Parrinello and Rahman, 1981). The balanced system was used to perform 100 ns MD simulations at 300 K and 1 bar pressure. All bond lengths were constrained using the LINCS algorithm (Hess, 2008). The Particle mesh Ewald (PME) method was used to handle long-range Coulomb interactions(Essmann et al., 1995). The estimation of MM-PBSA binding free energies was performed by the g_mmpbsa tool on all MD simulation trajectories (Issar et al., 2015; Kumari et al., 2014). The contribution of each residue to the total binding free energy was also estimated using the MMPBSA.py tool(Miller III et al., 2012).
2.7.1 Exploring biomolecular mechanisms via free energy landscapes and reaction coordinates
Free energy landscapes serve as a valuable tool in the interpretation and analysis of biomolecular processes, including molecular folding, aggregation, and recognition. To compute a molecule's free energy landscape, you can apply the following formula:
2.8 Pharmacokinetics and Toxicity studies
The study of ADME pharmacokinetics (absorption, distribution, metabolism, excretion) and toxicity is a key factor in the development of drugs(Van De Waterbeemd and Gifford, 2003). Early evaluation of ADME and Toxicity can significantly improve drug success rate, save drug development time costs, reduce drug side effect and toxicity, and further guide rational clinical use drugs(Nel, 1987). In this part of research, SwissADME and pkCSM online servers were used to predict the ADME and Toxicity parameters, drug-likeness and difficulty of synthesis of new compounds designed by the best established model, in order to confirm their possibility of become a drug candidate (Daina et al., 2017; Pires et al., 2015).
2.9 Computational reactivity details
Three different approaches were utilized to investigate the regioselectivity of 1,3DC between Mansonone's azide and 3,3,3-Trifluoroprop-1-yne (Fig. 17). These methods included the Domingo approach, the Gazquez and Mendez approach based on the HSAB principle, and activation energy calculations(Domingo et al., 2013; Mendez and Gazquez, 1994). By employing these approaches, we were able to predict the favored stereoisomer with success. The computations were conducted by the DFT method at the B3LYP/6-31G* level of theory with Gaussian G09 (Becke, 1988; Lee et al., 1988). Additionally, frequency calculations were performed to validate the stationary points and ensure that minima and transition states have zero and one imaginary frequency (Nacereddine et al., 2010). The global reactivity indices such as electronic chemical potential μ, chemical hardness η, global electrophilicity ω, and global nucleophilicity N were estimated using equations suggested by Parr (Parr et al., 1999; Parr and Yang, 1989) and Domingo (Chamorro et al., 2013; Domingo et al., 2013). Specifically, the one-electron energies of the frontier molecular orbitals were employed to evaluate the electronic chemical potentials and chemical hardnesses of the reactants examined in this study.
After determining the values of μ and η, ω was calculated using the following formula:
Nucleophilicity index N has been recently introduced on the basis of the HOMO energies(Domingo and Pérez, 2013):
Because of its low HOMO energy, tetracyanoethylene (TCE) is frequently used as a reference molecule in a wide range of molecules (Jaramillo et al., 2008; Kohn and Sham, 1965).
The chemical softness S was introduced as the inverse of the chemical hardness (Domingo et al., 2002):
In case an amount equivalent to one electron is transferred, the nucleophile becomes a radical cation, while the electrophile becomes a radical anion. Interestingly, analysis of the atomic spin density (ASD) at the radical cation and the radical anion gives a picture of the distribution of the electron density in the electrophile and the nucleophile when they approach each other along the reaction progress.
Based on these observations, in 2014, Domingo proposed the Parr functions P(r) (Chamorro et al., 2013; Domingo et al., 2013), which are given by the following equations:
for electrophilic attack.
for nucleophilic attacks.
Where ρsrc (r) is the ASD at the r atom of the radical cation of a considered molecule and ρsra (r) is the ASD at the r atom of the radical anion. Each ASD gathered at different atoms of the radical cation and the radical anion of a molecule provides the local nucleophilic Pk- and electrophilic Pk+ parr functions of the neutral molecule.
With these electrophilic and nucleophilic Parr functions at hand, we can redefine the local electrophilicity ωk, and the local nucleophilicity Nk indices as follows:
The meaning of electron flow in the reaction can be estimated by calculating the dual descriptors γ1 and γ2. The closer the y value gets to zero, the greater the preference for the interaction. The equations to calculate γ1 and γ2 are as follows:
3 Results and analysis
3.1 CoMFA and CoMFA statistical analysis
The relationship between steric and electrostatic fields and the biological activity of the data set was established using the CoMFA method. The statistical results of the CoMFA model are shown in Table 2. The CoMFA model had a Q2 cross-validation of 0.702 for five Optimal Components. PLS analysis gave the conventional R2 coefficient of determination value of 0.988, and an SEE standard error estimate value of 0.063. The steric field contributed in the CoMFA model was 67.6 % while the electrostatic field was 32.4 %.
Models
Non-validation
Leave-one-out
Field contribution (%)
R2
SEE
F
Q2
NOC
Ster
Elec
Hyd
H-bond D
H-bond A
CoMFA
0.988
0.063
143.043
0.702
5
67.6
32.4
H
0.968
0.106
49.890
0.595
6
–
–
–
–
–
SE
0.979
0.085
77.794
0.804
5
54.2
0.458
–
–
–
SH
0.972
0.099
57.749
0.596
6
32.4
–
67.6
–
–
SA
0.949
0.132
31.233
0.797
6
58.6
–
–
–
41.4
EH
0.983
0.077
94.922
0.743
6
–
29.3
70.7
–
HA
0.966
0.109
47.258
0.785
5
–
69.7
–
30.3
SEH
0.981
0.080
88.247
0.725
5
30.4
23.9
45.6
–
SEA
0.979
0.086
75.893
0.820
5
50.0
25.2
–
24.7
SHA
0.967
0.107
48.898
0.749
5
29.5
46.9
–
23.6
EHA
0.985
0.073
106.654
0.797
6
–
19.6
59.7
–
20.7
SEHA
0.982
0.079
91.870
0.778
6
28.9
17.5
36.0
176
Bold line indicates best significant optimized model.
For the CoMSIA modeling study, the possible models with different possible combinations of fields based on the five different field descriptors were analyzed.
The most reliable models, which met the criterion of (Q2 > 0.5), along with their respective parameters and contribution fractions of different fields, are summarized in Table 2. The CoMSIA/SEA model exhibited the highest Q2 value of 0.82, utilizing five optimal components. It also achieved a higher R2 value of 0.979 and a lower SEE value of 0.086. The contribution of the electrostatic, steric, and acceptor H-bond fields in the CoMSIA model were 50 %, 25.2 %, and 24.7 %, respectively. Additionally, the CoMFA model demonstrated significant static results with a dominant steric field contribution of 67.6 %.
These results strongly support the crucial role of steric fields in the activity of triazole derivatives linked to mansonone E. Overall, the constructed models yielded outcomes within an appropriate range, affirming the robustness and reliability of the 3D-QSAR models.
3.1.1 The domain of applicability
The domain of applicability is defined as the chemical space encompassing the compounds in the model's training set. In this study, the analysis of the area of applicability is based on the “Leverage” method, which is based on the variation of the standardized residuals of the dependent variable in relation to the leverage effect. All observations have standardized residuals in the interval [-2; 2]. It is notable that Fig. 4 does not include any outliers, since the “Leverages” obtained remain below the threshold of 0.52 for the CoMFA model and below the threshold of 0.51 for the CoMSIA model. However, in the case of the CoMFA model, compound 22 exceeds the limit of 2 in terms of standardized residues. Overall, both models tested indicate the absence of outliers.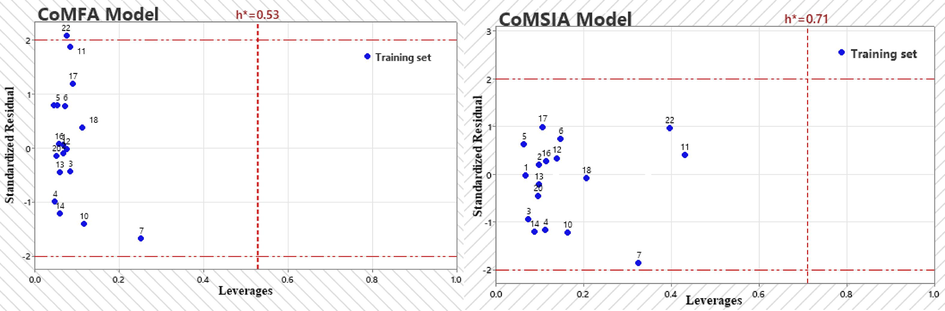
The Williams plots of the model CoMFA and CoMSIA.
3.2 HQSAR statistical results
To generate HQSAR models, the different combinations of fragment distinctions such as atomic number (A), bond type (B), atomic connection (C), hydrogen bond donor–acceptor (DA), hydrogen (H) and chirality (Ch) with a fragment size of 4 to 7 atoms were carried out, then a size change was carried out from 1 to 4 atoms up to 12 to 15 atoms the results obtained are listed in Fig. 5.The top 24 statistically, the best model was model M32 which suggests that parameters such as bond type (B) and hydrogen bond donor–acceptor (DA) were important for generating a model.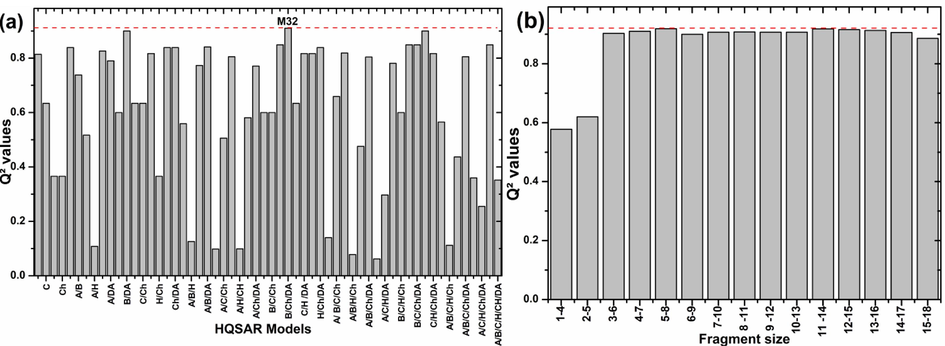
Statistical parameters comparison (a) for the different HQSAR model distinctions and (b) for different size fragment of best Model (M32).
For further model refinement (M32), the selected model fragment size was explored varying in size from 1 to 4 atoms up to 12–15 atoms. A significant difference was marked in the statistical parameters of the models, as shown in Fig. 5(B). The best model was with a fragment size of 5 atom minimum to 8 atom maximum where Q2 and R2 were found to be 0.919 and 0.962, respectively, with five componentes optimales and the hologram length was 97. These results verify the impact of fragment size on the robustness of the model.
3.3 QSAR models validation
The validation of the model was continued by carrying out a randomization test Y. We carried out ten random mixtures of the independent vector Y, leading to low values of R2 and Q2. This observation suggests that the results obtained from the origin model are not influenced by structural dependence or random correlation in the dataset. According to Table 3, the average values of R2 were 0.0965, 0.1453 and 0.0649, while those of Q2 were 0.0666, 0.0687 and 0.0329 for the ten randomized models CoMFA, CoMSIA and HQSAR, respectively. CRp2 should be greater 0.5(Ojha and Roy, 2011).
Iteration
CoMFA
CoMSIA
HQSAR
R2
Q2
R2
Q2
R2
Q2
Origen model
0.988
0.702
0.979
0.82
0.962
0.919
Random model 1
0.2374
0.0083
0.2056
0.0158
0.0167
0.0363
Random model 2
0.127
0.0001
0.3696
0.3098
0.0158
0.0385
Random model 3
0.0651
0.0039
0.0399
0.0268
0.227
0.0393
Random model 4
0.0012
0.0368
0.0219
0.111
0.2673
0.0688
Random model 5
0.0276
0.0678
0.2222
0.0022
0.0309
0.0302
Random model 6
0.0045
0.0407
0.2036
0.0053
0.0006
0.0195
Random model 7
0.2719
0.0045
0.0045
0.0016
0.0029
0.0259
Random model 8
0.0306
0.0895
0.0493
0.0497
0.0327
0.0035
Random model 9
0.027
0.0764
0.2469
0.0354
0.0193
0.0007
Random model 10
0.1722
0.3379
0.0896
0.1293
0.0364
0.0661
Average randomized Rr2
0.0965
0.0666
0.1453
0.0687
0.0649
0.0329
0.9391
0.8108
0.9161
0.7814
0.8678
0.8737
The predictive reliability of the established models was assessed by an external validation protocol using the reserved test set. The statistical results of the external validation according to the Tropsha and Globraikh criteria and the Roy metrics have been collected in Table 4.
Models
Tropsha and Golbraikh’s criteria
Roy’s criteria
R02
R'02
R2test
k
k’
R'm2
Rm2
ΔRm2
ΔR02
CoMFA
0.915
0.998
0.895
0.988
−0.023
1.006
−0.115
0.607
0.766
0.687
−0.159
−0.083
CoMSIA
0.903
0.955
0.765
1.021
−0.181
0.974
−0.248
0.431
0.481
0.456
−0.049
−0.052
HQSAR
0.994
0.982
0.970
1.008
−0.025
0.991
−0.012
0.865
0.818
0.841
0.047
0.013
Criterion
>0.5
>0.5
>0.5
0.85 < k
< 1.15< 0.1
0.85 < ḱ
< 1.15< 0.1
>0.5
>0.5
>0.2
< 0.2
< 0.2
The R2test values obtained by the CoMFA, CoMSIA and HQSAR models were 0.895, 0.765 and 0.970 respectively. The optimal models generated for the test set gave values of R2m, R'2m, ̅R2m, ΔR2m and ΔR20 of 0.766, 0.607, 0.687, −0.159 and −0.083 (CoMFA); of 0.481, 0.431, 0.456, −0.049 and −0.052 (CoMSIA), 0.818, 0.865, 0.841 and 0.047 and 0.013, (HQSAR) for antiproliferative activity, respectively. It can be emphasized that the values of R'm2, Rm2, and ̅R2m, do not satisfy the criterion greater than 0.5 for the CoMSIA model, while all of them are respected by the CoMFA and HQSAR models. Furthermore, the values of the R2o and R'2o parameters were 0.915 and 0.998; 0.903 and 0.955, and 0.994 and 0.982 for the CoMFA, CoMSIA and HQSAR models, respectively. These parameters are close to 1 for the three generated models. The R2o and R'2o parameters were used to calculate the relations (R2/R2o)/R2 and (R2/R'2o)/R2, the values were obtained from −0.023 and −0.115, −0.181 and −0.248, and −0.025 and −0.012 for the CoMFA, CoMSIA, HQSAR models, respectively.
Generally, we can confirm the credible advantage of the CoMFA and HQSAR model for the external validation phase, while the CoMSIA model showed weaknesses in some external validation static parameters. These results showed that the QSAR models are considered predictive.
The correlation and the residual between the calculated and experimental pIC50 activity values for the CoMFA, CoMSIA and HQSAR models are presented in Fig. 6, respectively.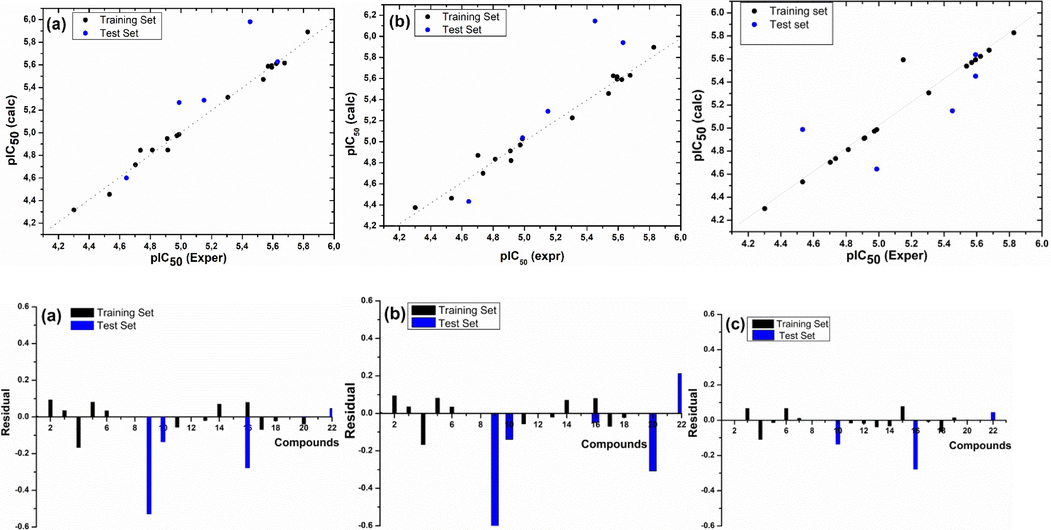
Plot of correlation and residual of experimental pIC50 values vs those calculated by (a) HQSAR, (b) CoMFA, and (c) CoMSIA models.
3.4 Visualization contour carts CoMFA and CoMSIA
In this part, the information derived by the CoMFA and CoMSIA models have been visualized in the form of contour maps using the StDev*Coefficient field type. The most active compound N17 was used as reference structure as shown in Fig. 7 and Fig. 8.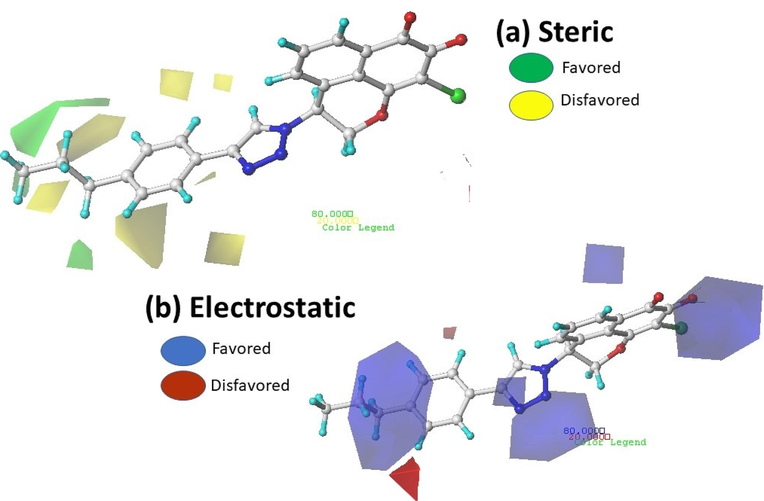
Contour map of CoMFA analysis (a) Steric, (b) electrostatic with a grid spacing of 2.0 Å in combination with compound N17.
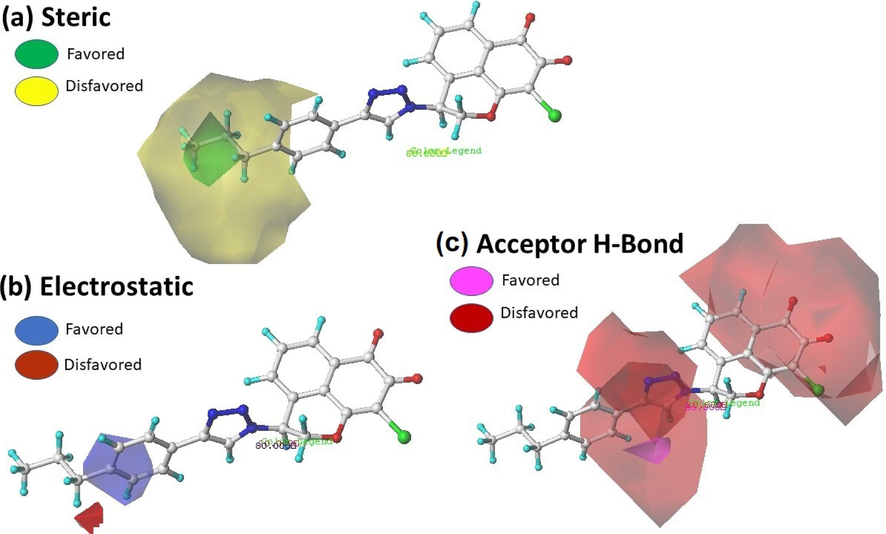
Contour map of CoMSIA analysis Steric, electrostatic and hydrophobic with a grid spacing of 2.0 Å in combination with compound N17.
Contribution levels for Advantaged and disadvantaged regions default to 80 % and 20 %, respectively. In the CoMFA steric contour map, the favorable steric field is represented by green (80 % contribution) and yellow (20 % contribution) represents the unfavorable steric field, as shown in Fig. 7a, areas of yellow color surrounding the phenyl ring of compound N17 proves to be sterically unfavorable. Two areas of green color near the propane ring of the phenyl ring suggest that the addition of bulky groups could improve the activity. We can notice that the absence of yellow and green cards near the mansonone group shows that this group has no steric impact on the biological activity studied. In the electrostatic contour map, the favorable electron-donating group is denoted by blue (80 % contribution) and red represents the favorable electron-withdrawing groups for the activity (20 % contribution). As shown in Fig. 7b, Five blue areas covers around oxygen atom of mansonone, bromine atom, core nitrogen atom of triazole and near propene group bonded to triazole, these areas show that donor groups electrons increase activity. However there is a two red colored areas near the ortho and para position of the phenyl ring which indicates the presence of an electron-withdrawing group at this position could enhance activity.
Contour maps for the CoMSIA model, as shown in Fig. 8a-8c, represent how steric, electrostatic, and hydrogen bond acceptor interactions affect the inhibitory activity of the compounds under study. Among these interactions, the steric interaction has the major contribution to the activity (50 %). The CoMSIA steric contour map (is shown in Fig. 8a) a single green area around the phenyl ring and another green near propane which reflects the addition of larger and smaller groups in the position of phenyl and propane, respectively, are of interest. The CoMSIA electrostatic contour map (Fig. 8b) is less extensive than the corresponding CoMFA one where it shows single electron poor in this area. A small red area near the propane group substituting the triazole nucleus shows the importance of adding electron-rich groups in this region. In the hydrogen bond acceptor contour map (Fig. 8c), a large red contour around the naphthoquinone rings, and two other red p in the vicinity of triazole nucleus indicating that the insertion of hydrogen bond acceptor group in this area could increase activity. A small magenta outline covering the ortho position of the phenyl ring shows negative impact of hydrogen bond acceptor group on biological activity.
3.5 Hologram QSAR atomic contribution plot interpretation
The HQSAR model contribution map shows the degree of contribution of each atom, the more active N17 and less active N10 compounds were selected as reference structures (Fig. 9). The HQSAR hologram helps us to better understand and identify the impact of each atom fragment on the inhibitory activity of antiproliferative. As shown in Fig. 9, the common backbone appears in cyan color, and the effect of each atom on biological activity was indicated by a color. The green or yellow color on the contribution map reflects positive impacts, while the orange and red presets represent negative influences. Fragments of atoms colored white indicate intermediate contributions in biological activity.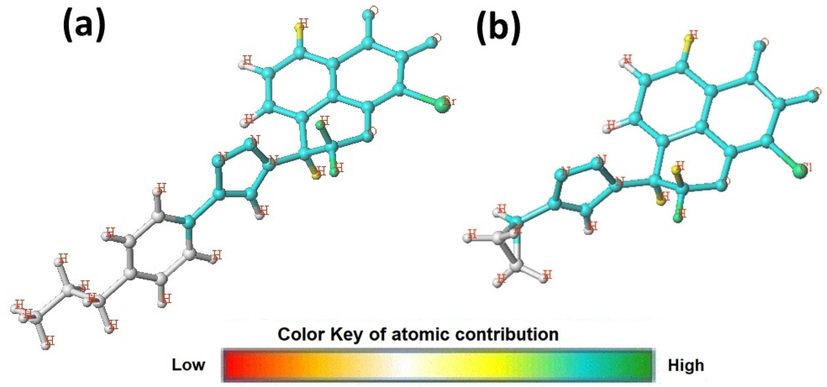
Hologram quantitative structure activity relationship model contribution map of the most compound N17 and the less compound N10.
It can be seen in Fig. 9 Both structures contain a mansonone E linked to triazole moiety as a common core. In addition, some of the hydrogen atoms on the naphthoquinones cycle and the pyranic cycle appear yellow and green, which have a significant contribution to enhance inhibitor activity. Moreover, the bromine atom appears in green, which confirms the important role of this atom in improving the activity, this result confirms the results obtained by Hong and his collaborators. The atoms of the studied compounds do not appear in red indicating that there is no negative contribution. In addition, the atoms and the substituent appear in white to indicate a neutral contribution in the substituent R1.
3.6 Designed molecular
Analysis of the contour map of the 3D QSAR models and the HQSAR hologram contribution map has derived interesting information on the structural features that affect and govern the antiproliferative activity of triazole mansonone E derivative. The results obtained from the QSAR study carried out have been schematized in Fig. 10.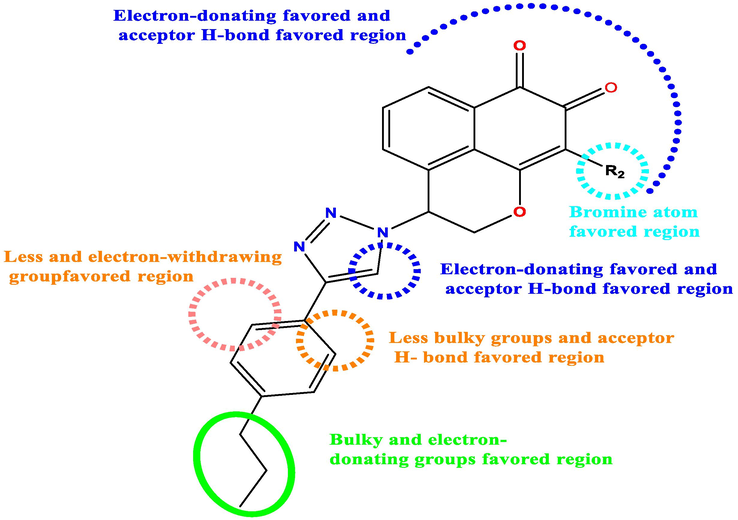
Summary of structure–activity relationship derived from QSAR study.
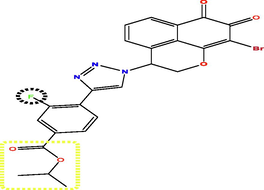
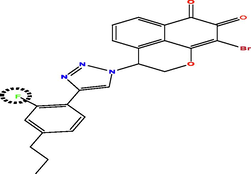
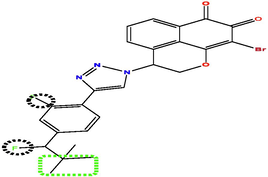
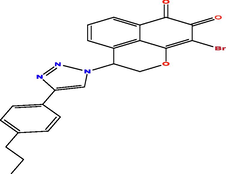
Investing the information generated by the models, and according to the results of external validation, the CoMFA model was selected to design seven new compounds taking into account compound N17 as a reference. Predicted pIC50 values were calculated using three models CoMFA, CoMSIA and HQSAR (Table 5). The predicted activity of all designed molecules was high (pIC50 > 5.624) and found to be quite similar based on CoMFA and CoMFA/ESA models and slightly different from CoMSIA model. For this, it was taken as an optimal model to predict the pIC50 activity of the new molecules, for example the activity predicted by CoMSIA for the T1 molecule is pIC50 = 8.837 were found to higher than the activity predicted by CoMSIA of compound N17 the highest active compounds from the database pIC50 = 8.103.
Compds
Structure
Activity predicted pIC50
Synthetic accessibility
Bioavailability Score
CoMSIA
CoMFA
HQSAR
T1
4.570
6.631
4.326
3.81
0.85
T2
6.871
6.271
5.624
4.60
0.56
T3
6.436
6.179
6.465
4.65
0.85
T4
6.463
6.172
6.621
4.66
0.85
T5
6.348
6.006
6.198
4.45
0.56
T6
8.103
5.998
8.980
0.85
T7
6.667
5.972
7.398
4.88
0.85
N17
5.794
5.907
6.581
4.40
0.85
3.7 In silico pharmacokinetic ADME, and toxicity results
The results of the ADME parameters and the toxicity profile of the candidate compounds and the N17 molecule are summarized in Tables 6 and 7 respectively. The estimated Caco/2 permeability value was very high for all the compounds tested (greater than 0.64), the intestinal absorption was greater than 90 %, indicating the good absorption of these compounds(Tabti et al., 2023b). The human VDss was low (less than 0.71 log (L/kg)(Hosen et al., 2023). At the level of penetration, the compounds screened revealed low penetration of BBB and CNS. In addition, these compounds examined, proved to be no-cytochrome P450 (CYP/2D6) inhibitors and P450 (CYP3D4) inhibitors when they may be a CYP3A4 substrate and not a CYP/2D6 substrate estimated total clearance results showed acceptable results.
Compounds
Water solubility
Caco2 permeability
Intestinal absorption (human)
Skin Permeability
P/glycoprotein I /II inhibitor
VDss (human)
BBB permeability
CNS permeability
CYP2D6 substrate
CYP3A4 substrate
CYP2D6 inhibitior
CYP3A4 inhibitior
Total Clearance
Numeric (log mol/L)
Numeric (log Papp in 10/6 cm/s)
Numeric (% Absorbed)
Numeric (log Kp)
Categorical (Yes/No)
Numeric (log L/kg)
Numeric (log BB)
Numeric (log PS)
Categorical (Yes/No)
Categorical (Yes/No)
Categorical (Yes/No)
Categorical (Yes/No)
Numeric (log ml/min/kg)
T1
−4.655
1.445
94.725
−2.792
No-No
−0.556
−1.131
−2.358
No
Yes
No
No
0.001
T2
−5.261
1.055
100
−2.736
No-Yes
−0.677
−1.366
−3.052
No
Yes
No
Yes
−0.239
T3
−4.95
1.253
97.024
−2.735
Yes-Yes
−0.548
−0.996
−2.986
No
Yes
No
Yes
−0.254
T4
−4.788
1.287
95.515
−2.735
No-Yes
−0.736
−1.399
3.113
No
Yes
No
Yes
−0.375
T5
−5.177
1.394
96.657
−2.736
No-Yes
−0.386
−1.186
−3.11
No
Yes
No
Yes
−0.027
T6
−4.974
1.384
95.389
−2.735
Yes-Yes
−0.196
−0.976
−3.072
No
Yes
No
Yes
−0.102
T7
−5.313
1.497
93.351
−2.735
Yes-Yes
−0.262
−1.139
−2.927
No
Yes
No
Yes
−0.143
N17
−4.857
1.377
95.158
−2.734
Yes-Yes
−0.089
−0.761
−2.151
No
Yes
No
Yes
0.039
Compounds
Test AMES
Max. tolerated dose (human)
hERG I /II inhibitor
Oral Rat Acute Toxicity (LD50)
Oral Rat Chronic Toxicity (LOAEL)
Skin Sensitisation
Categorical (Yes/No)
Numeric (log mg/kg/day)
Categorical (Yes/No)
Numeric (mol/kg)
Numeric (log mg/kg-bw/day)
Categorical (Yes/No)
T1
No
0.11
No/No
2.614
1.21
No
T2
No
0.474
No/Yes
2.354
0.942
No
T3
Yes
2.35
No/Yes
2.35
0.638
No
T4
No
0.639
No/Yes
2.367
0.393
No
T5
No
0.601
No/Yes
2.349
1.073
No
T6
No
0.68
No/Yes
2.291
1.151
No
T7
No
0.547
No/Yes
2.429
0.872
No
N17
No
0.7
No/Yes
2.239
1.3
No
The boiled Egg plot between TPSA and Log P to predict cerebral penetration and gastrointestinal absorption of selected molecules is shown in Fig. 11. It can be seen from the plot that compound N17 exhibits the BBB but it was located in the GI absorption region. All newly designed molecules exerted a high HIA. Prediction of substrates (PGP) and non/substrates (PGP/) of the permeability glycoprotein (PGP) were also estimated by the boiled egg model.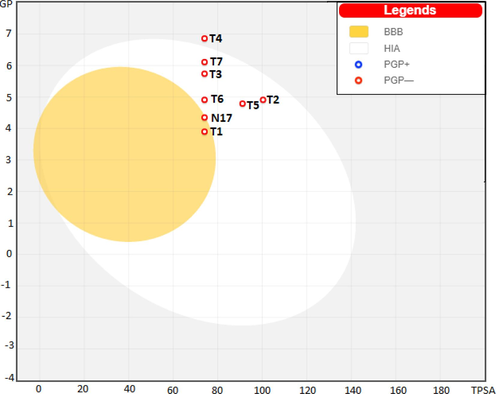
Boilled /Egg plot for all designed compounds (BBB – Blood/brain barrier; PG+// – P/glycoprotein; HIA – human intestinal absorption).
At the level of the estimation of the toxicity profile, the results obtained are collected in Table 7. The Ames test revealed that all the candidates could be considered as non/mutagenic. The maximum tolerated doses of these designed compounds were lower than those of Compound 17 (0.7 log mg/kg/day). All candidates showed oral LD50 values in rats of between 2.614 and 2.291, which are higher than that of compound N17 (2.239). For the chronic LOAEL model in rats, the compounds tested showed LOAEL values between 1.21 mg/kg-bw/day and 0.393 mg/kg-bw/day. All candidates were evaluated as non-skin sensitization.
3.8 Docking results
In order to gain structural insight on the binding mechanism of all newly predicted compounds into the protein binding site, molecular docking analyzes were performed using autodock tools software. The crystal structure of the ATPase domain of human DNA topoisomerase IIα (PDB:1ZXM) was chosen. In addition we also docked Compound N17 and Doxorubicin, to compare our results. Table 8 summarizes all the results obtained. Generally the analysis of the docking results of the newly designed molecules revealed very high docking scores between −9.6 and −10.6 kcal/mol in interval), which shows the good positioning of these compounds in the active receptor site. The best engineered molecule showed −10.3 kcal/mol higher affinity than Compound N17 (-9.6 kcal/mol) and Doxorubicin (-10.1 kcal/mol).
Compounds
Affinity Kcal/mol
Hydrogen Bond interactions
Electrostatique interactions
Hydrophobic interactions
H-Bond Conventional
H-bond non classic
T1
−10.3
Thr-165, Asn-163
Gln-376, Gly-166
Gly-164, Arg-162
Ser-148, Asn-150Asn-91, Asp-94
T2
−9.6
Gly-166 Lys-168, Ala-167
Gly-161 Ser-149 Arg-98
Arg-98
Phe-142, Ile-141 Ile-125, Pro-126 Val-137
T3
−10.9
Ile-141, Lys-168
Ala-167, Ser-149Gly-161
Asp-94
T4
−10.1
Arg-162, Asn-150
Lys-168, Tyr-165
Gly-166, Tyr 186Ser-149
–
–
T5
−9.9
Lys-168, Ala-167
Ser-149Gly-161
–
–
T6
−9.9
Lys-168 Ala-167
Ser-149Gly-161 Ser-149 Asp-94
–
–
T7
−9.5
Gly-166 Lys-168
Ala-167 Ser-149Gly-161 Asp-94
Asn91-Ser149–
–
ANP
−11.2
Asn-91, Asn-120
Ser-148, Ser-149
Asn-150, Arg-162
Asn-163, Gly-164
Tyr-165, Gly-166
Ala-167, Gln-376Asn-95, Ala-92
Ile-141, Gly-161Ile-125
–
N17
−9.6
Asp-94, Asn-150
Lys-168,–
Phe-1, Arg-98,
Ile-141, Phe-142
Thr-159–
Doxorubicin
−10.1
Asn-91 Asn-95
Arg-98 Thr-215Ser-149
Gly-161Pro-126 Val-137
Ile-217 Phe-142
Ile-141–
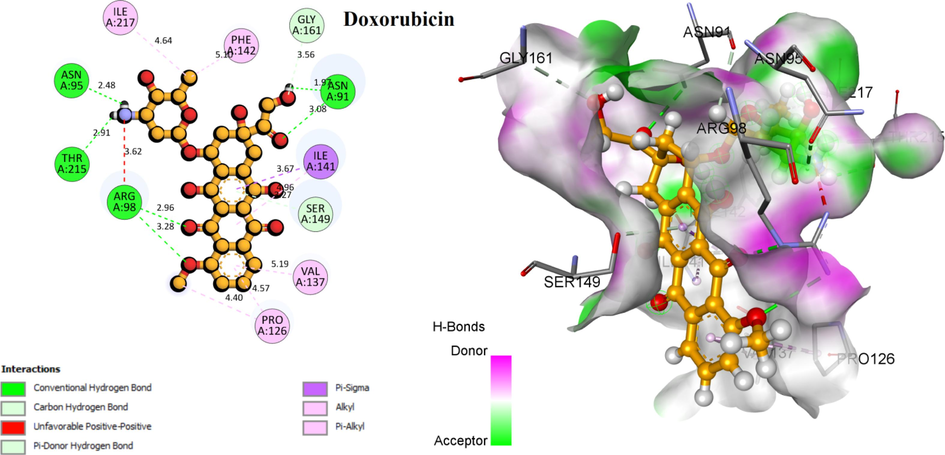
The results obtained show that the residues Asn91, Ser-148, Asn-150, Arg-162, Ile-125, Ser-149, Gly-164 and Lys-168 are the most frequently interacting with the topoisomerase II residues of compound T1 and ANP. The 3D visualization of the interactions of the molecules T1, 17 and Doxorubicin has been displayed in Fig. 12. Compound T1 forms a higher number of conventional hydrogen bonds (eight bonds) with the following residues Thr-165, Asn-163, Gln-376, Gly-166, Gly-164, Arg-162, Ser-148, and Asn-150, and two non-classical hydrogen bonds with Asn-91, Asp-94, while the hydrophics interaction are absent. The highest compound in the data set created three conventional hydrogen bonds Asp-94, Asn-150 and Lys-168. more hydrophobic interactions are formed with Phe-1, Arg-98, Ile-141, Phe-142, and Thr-159. Concerning the control compound Doxorubicin produced four hydrogen lisions with Asn-91, Asn-95, Arg-98, and Thr-215.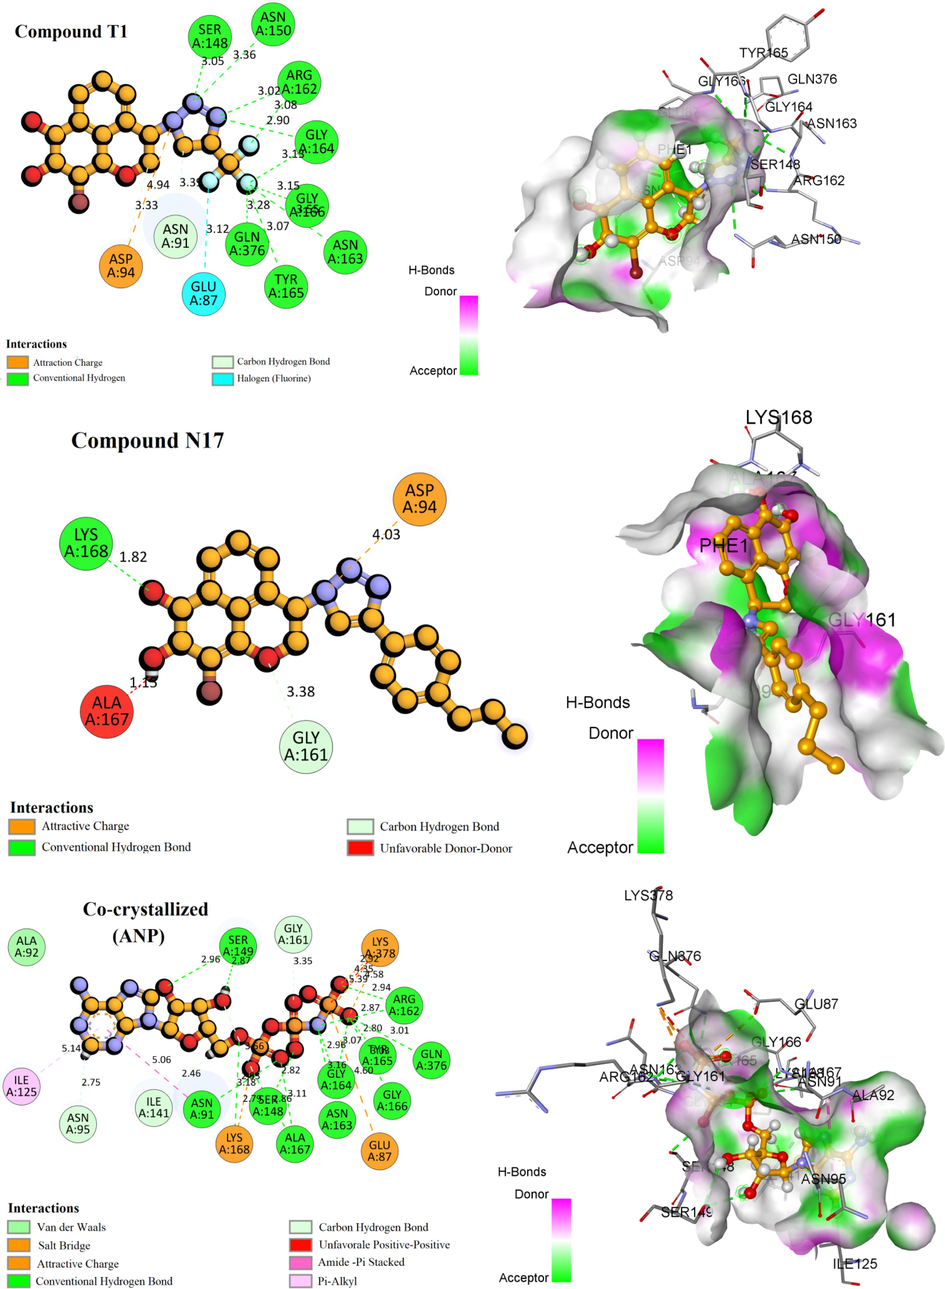
3D visualization of the main interactions between the active site of Human DNA topoisomerase II α (PDB ID: 1ZXM) with the compounds T1, N17, ANP, and Doxorubicin.
3D visualization of the main interactions between the active site of Human DNA topoisomerase II α (PDB ID: 1ZXM) with the compounds T1, N17, ANP, and Doxorubicin.
To validate the docking method to use, were docked the ligand ANP in its active site and by calculating the RMSD parameter, the results obtained were displayed on the structure of Fig. 13 showing a low RMSD value of 1.09 Å, this which indicates The results indicate the reliability of the molecular docking used to predict binding affinity for ligands.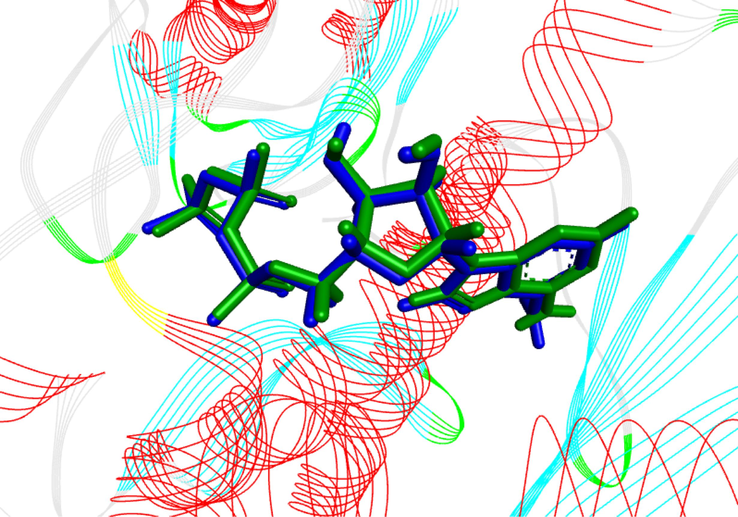
3D visualization of docking validation by the redocking method of the co-crystallized ligand in the topoisomerase IIα receptor (PDB: 1ZXM).
3.9 MD simulation results
In order to further analyze the atomic behavior of molecular interactions dynamically contributing to their stable complexed conformation and to further explore the binding mode of the complexes resulting from molecular docking. The docking results of the complex bound to compound T1, 17 and doxorubicin was simulated along a 100 ns trajectory. Judgment of the stability of the screened complexes was made based on parameters including Root-Mean-Square Deviation (RMSD), the root mean square fluctuation (RMSF).
The backbone RMSD plot of three simulated systems versus time has been shown in Fig. 14 (A) the RMSD value of protein bound to compound 17 and doxorubicin showed an almost similar evolution where a gradual increase in the range of 0 ns-18 ns, then stabilization at a relatively constant level for the remaining time around 2.1 Å, these indicating that the conformation of the complexes relative to compound N17 and Doxorubicin were stable throughout the MD simulation trajectory. Concerning the complex linked to compound 17, after 3 ns the RSMD values increased in the first 3 ns, then showed fluctuations in a range between 1.5 Å and 2.5 Å, indicating that the system had reached a stable state. But it should be noted that in the last 15 ns the value of RMSD increases sharply and stabilizes around 2.9 Å. These results showed more stability of the newly designed compound T1 compared to the most active compound N17 of the data set.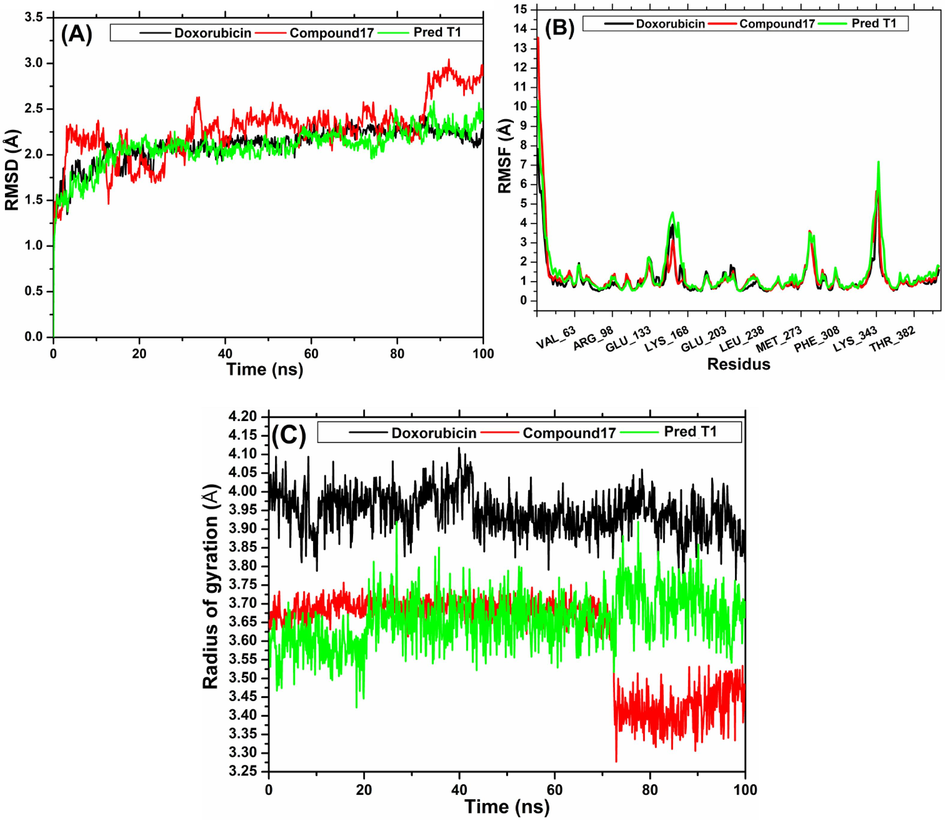
(A) RMSD plot. (B) RMSF plot of the complexes screened during 100 ns MD simulation and (C) Radius of gyration plot of the complexes screened during 100 ns MD simulation.
The average residue position fluctuation is calculated by root mean square fluctuation values (RMSF) to assess the flexibility of protein chain residues during of the simulation MD. The RMSF plot of protein bound to the screened ligands is shown in Fig. 14(B). It can also be observed that the evolution of RMSD for the three systems was almost similar and also showed the same behavior.
Generally, three ranges of residues were recorded with a fluctuation greater than 3 Å, are from Tyr-151 to Glu-155, from Glu-281 to Glu-283 and from Lys-342 to Asn-345, while the rest of the protein backbone residues have weak and insignificant fluctuations.
The radius of gyration (Rg) is a parameter that expresses the compactness and shape of the complex protein structure, and is therefore an indicator of the stability of the ligand. As shown in Fig. 14(C), the protein ligated with the compound designed by our model showed almost stable Rg values around 3.65 Å during the last 80 ns of simulation. We can observe that the control compound, doxorubicin, also showed stability throughout the simulation but at a value of around 3.9 Å. On the other hand, the Rg of the protein bound to compound 17 initially stabilized around 3.65 Å, but progressively decreased after 75 ns and stabilized around 3.4 Å.
3.10 PCA and FEL analysis
The statistical technique known as Principal Component Analysis (PCA) serves to simplify intricate datasets by reducing their dimensionality. It has utility in investigating changes in protein conformation and identifying significant motions in molecular dynamics simulations. Meanwhile, Free Energy Landscape (FEL) analysis provides a valuable approach for delving into the thermodynamics and kinetics of protein–ligand interactions. This analysis yields insights into the binding process and can even predict the affinity of a ligand for a protein.
The outcomes of energy landscape analysis, as revealed in Figs. 15 and 16, unveil a diverse array of characteristics. Specifically, the presence of two energy wells of varying sizes in the first compound (T1), as illustrated in Fig. 15, might signify conformational stability and reduced flexibility. Likewise, the existence of a solitary energy well in the second compound (N17) (Fig. 15 (b)) suggests a more stable and less flexible conformation. Finally, in Fig. 16, two medium-sized energy basins are evident. In light of the FEL and PCA analyses, complex studies may exhibit increased stability and reduced flexibility. In particular, the T1 complex, characterized by either fewer energy wells or a larger energy well, may be indicative of a more stable and less flexible conformation.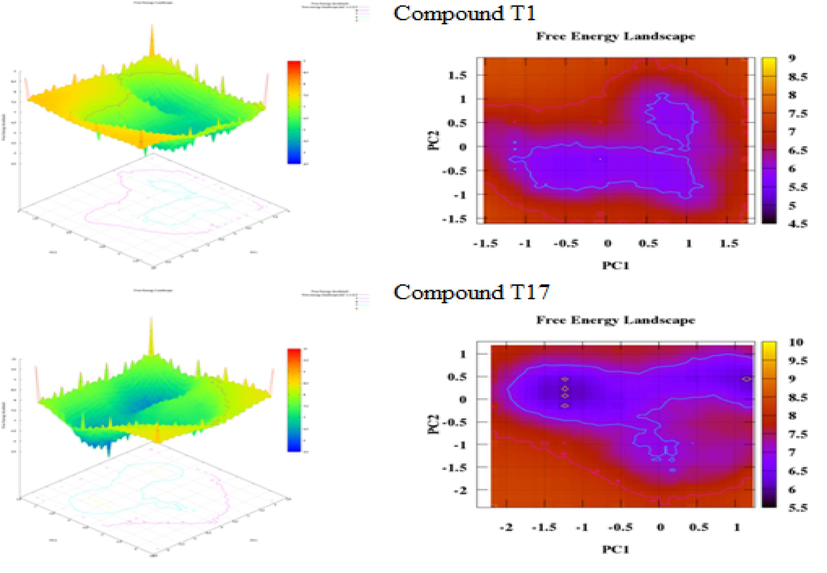
Plots pca and fel for (a) compound t1 and (b) compound 17.
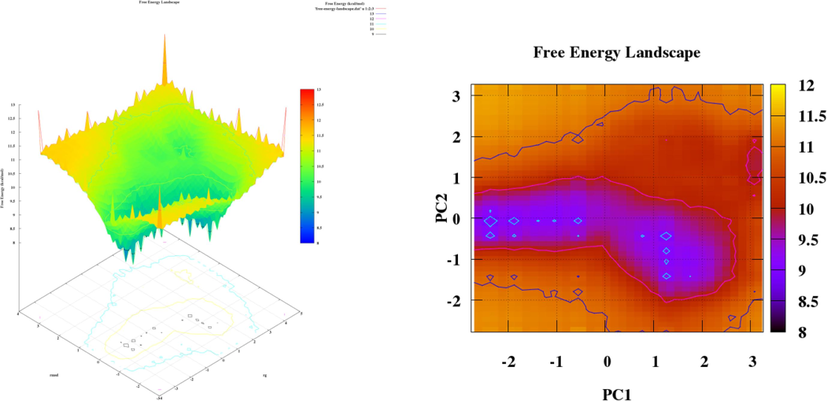
Plots pca and fel for doxorubicin.
3.11 Free binding energy
The free energy of binding is a dominant factor in estimating the activity of drug candidates. As much as, the lower the value of Gbind, the more stable the complex. The validation of the binding affinity of the compounds T1, 17 and doxorubicin with the protein binding site was carried out by calculating the free energy of binding by the MM-GBSA method. The results obtained have been gathered in Table 9 for the beginning (0 ns) and the end of simulation (100 ns).
Compd
MMGBSA (kcal/mol)
ΔGBind
ΔGCoulomb
ΔGCovalent
ΔGLipo
ΔGSolv GB
ΔGvdW
ΔG H bond
ΔGBind packing
T1
0 ns
−63.0195
−20.0272
1.0908
−13.3384
18.3577
−43.6515
−1.7396
−3.7113
100 ns
−75.2439
−16.4533
2.5316
−13.3658
3.6685
−44.0335
−1.2848
−6.3064
N17
0 ns
−87.6201
−61.1897
7.6212
−15.4463
27.3669
−40.7776
−2.2060
−2.9887
100 ns
−65.1043
−13.2410
3.8035
−11.1820
2.3772
−40.6816
−2.8300
−3.3504
Doxorubicin
0 ns
−62.7450
−31.1663
5.1522
−19.8420
41.6952
−54.2688
−4.2487
−0.0666
100 ns
−85.7266
−50.0833
−3.6927
−24.6319
50.1949
−52.2962
−2.1753
−3.0420
The binding free energy of the compounds Pred01, 17, Doxorubicin were at the beginning of the simulation −63.0195 kJ/mol, −87.6201 kJ/mol, and −62.7450 kJ/mol, and at the end of the simulation trajectory −75.2439, −65.1043, and −85.7266. It is interesting to note that the free energy and decreases during the simulation for the compound T1 and Doxorubicin. Which reflects the stability of interactions has been improved in a dynamic environment. Van der Van der Waals energy (EvdW) and Energy of lipophilicity (E lipo) and Couloubian energy (ΔGCoulomb) contributed much more to the binding free energy than the other energies, indicating that the hydrophobic interaction and electrostatic interaction Coulomb type played a key role in the complex system. Although the interaction of Hydrogen bond energy (ΔG H-bond) and packing energy (ΔGBind packing) were relatively less important. However, the positive values of the polar solvation energy (ΔGSolvGB), indicating that it was not conducive to ΔGbind, the reason was that an excessive binding pocket could cause exposure of the ligand to the solvent.
3.12 Reactivity cycloaddition 1,3 of compound T1
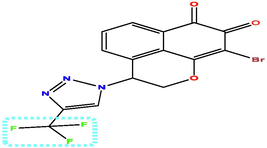
This section focuses on the examination and evaluation of the mechanism behind the 1,3-dipolar cycloaddition reaction of T1, a newly designed compound from mansonone azide and 3,3,3-trifluoroprop-1-yne (illustrated in Fig. 17). For the study of the reaction, two of the regioselective attacks were considered between the reactants and their theoretical parameters were calculated using density functional theory (DFT) calculations performed at the B3LYP/6-31G (d, p) theoretical level.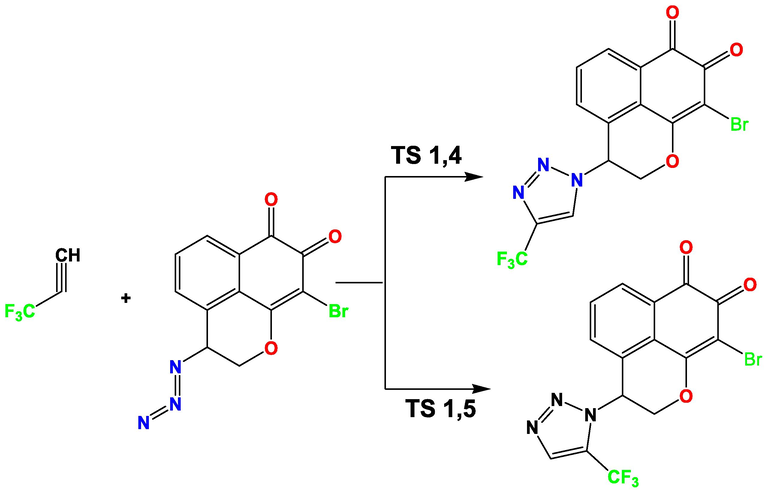
Cycloaddition 1.3-dipolar reaction between 3,3,3-Trifluoroprop-1-yne and Mansonone azide.
3.12.1 Analysis of global reactivity properties
The results relating to static global properties: The chemical potential, the overall hardness, the electrophilicity index and the nucleophilicity index are reported in Table 10. (ΔE(I) = HOMOD – LUMODp ΔE(II) = HOMODp – LUMOD) EHOMO (TCE) = -9.368 eV calculated at the same level of theory.
Reactants
Global reactivity
Dipole Mansonone azide
Dipolarophile 3,3,3-Trifluoroprop-1-yne
Global properties(eV)
Homo (eV)
−6.874396926
−9.089942973
Lumo (eV)
−3.76768
−0.80029
µ (eV)
−5.32103846
−4.94511401
ƞ
3.106716926
8.289657917
ω (eV)
4.556812062
1.474979599
N (eV)
2.49360307
0.27805703
S (eV)
0.321883205
0.12063224
ΔNmax (a.u.)
1.712752912
0.596540179
ΔE (I) (eV)
−6.074111871
ΔE (II) (eV)
−5.322262973
Transferability indices
T ω
24.5
75.5
TN
10
90
Table 10 shows that deviation ( ) corresponding to the combination is weaker than that corresponding to the combination . Therefore, these are reactions with inverse electronic demand.
The electronic chemical potential of dipolarophile (-4.94511401) is greater than that of dipole (-5.32103846) implying a small difference of order Δμ = 0.29 (ev). Furthermore, the dipole electrophilic index is higher than that of dipolarophiles. This means that in this cycloaddition reaction the dipole can be classified as strong electrophiles and the dipolarophile will behave as nucleophiles (electron donors).
The nucleophilic index of the dipole fragment (ND = 2.4936 ev) is quite higher than that of the dipolarophile fragment (NDp = 0.2780 ev). Interestingly, these results show that the electrophilic and nucleophilic characters of the molecule are concentrated in the dipole fragment dipole (The transferability index of dipole show 75.5 % of the electrophilic character and 90 % of the nucleophilic character). So the electron transfer (from the dipole to the dipolarophile or from the dipolarophile to the dipole) is not trivial. Therefore, the reaction is not polar.
It should be observed that γ1 = 4.8348 is greater than γ2 = 3.9686, the difference Δγ is not significant, which shows that the reaction studied is a nonpolar reaction and that it is characterized by a very low charge transfer. This low flow of electrons takes place from the Mansonone Triazole to the Alkyne trichlorine carbon. In addition, it should be noted that the dual indices for the reaction do not provide information for the estimation of the charge transfer in the transition state; we then proceed to the calculation of another local reactivity index.
3.12.2 Analysis of local reactivity properties
To estimate the preferred isomer, a two-center process approach proposed by Domingo in 2002 was conducted. This approach suggests that the formation of the first bond is due to the interaction between the most electrophilic site (largest value of ωk) and the most nucleophilic site (largest value of Nk). Thus, the prediction of the first bond formed is sufficient to predict the favored isomer formed.
The Fukui functions, Parr functions, local electrophilicity and local nucleophilicity of the Dipole and dipolarophile fragments are summarized in Table 11.
Reactant
Parameters
Dipole
Dipolarophile
N3
N1
C1
C2
Electronic population
qk(N + 1)
−0.1754
−0.0412
−0.0729
0.0457
qk(N-1)
−0.1698
0.0103
0.3469
0.3662
qk(N)
−0.3437
−0.0344
−0.147
−0.1315
Fukui indices
f+k
0.1683
−0.0068
0.0741
0.1771
f-k
−0.1739
−0.0448
−0.4938
−0.4977
Perr functions
P+
−0.0059
0.003
0.5875
0.4137
P-
0.0542
−0.0022
0.0089
0.0214
Local indices
S+k
0.02030235
−0.000820297
0.023851479
0.057005358
S-k
−0.020977888
−0.005404309
−0.158945486
−0.160200827
ωk
0.248239755
−0.010029889
0.33766071
0.807013653
Nk
−0.048349735
−0.012455826
−1.231331788
−1.241056766
The indices of the local electrophilicities ωk and of the nucleophilicities Nk make it possible to describe the most favorable bicentric interaction along an asynchronous bond formation process, for the reaction. The favorable interaction of two polar sites takes place between C2 (the most electrophilic site, ωk = 0.807013653) and N1 (the most nucleophilic site Nk = -0.012455826). This means that isomer 1 is favorable.
3.12.3 Theoretical elucidation of the regioselectivity of the reaction by
In order to highlight the preferential mode of cyclization (isomer 1 or isomer 2) and consequently the major product of the cycloaddition reaction of mansonone triazole methyl trichloride, we located the transition states and calculated the activation barriers for the two possible reaction paths.
The transition states TS1 and TS2, corresponding to the two regioisomers Isomer 1,4 and Isomer 1,5 respectively, have been located at the computational level B3LYP/6-31G*(d,p). The two transition states were confirmed by the presence of one and only one eigenvalue negative in the matrix of force constants, i.e. there is a single imaginary frequency in the Hessian matrix and it corresponds to the mode of vibration corresponding to the formation of the two new bonds. The calculations yielded, as expected, analogous energy barriers for regiochemistry 1,4 and 1,5 (Fig. 18), resulting in 17.3842 and 15.9698 kcal mol-1, respectively. This energetic deference explains that isomer 1 is the favorable isomer for formation. The optimized transition state structures are shown in Fig. 18. Additionally, an analysis of the geometries at the TS is given in Table 12 and Fig. 19.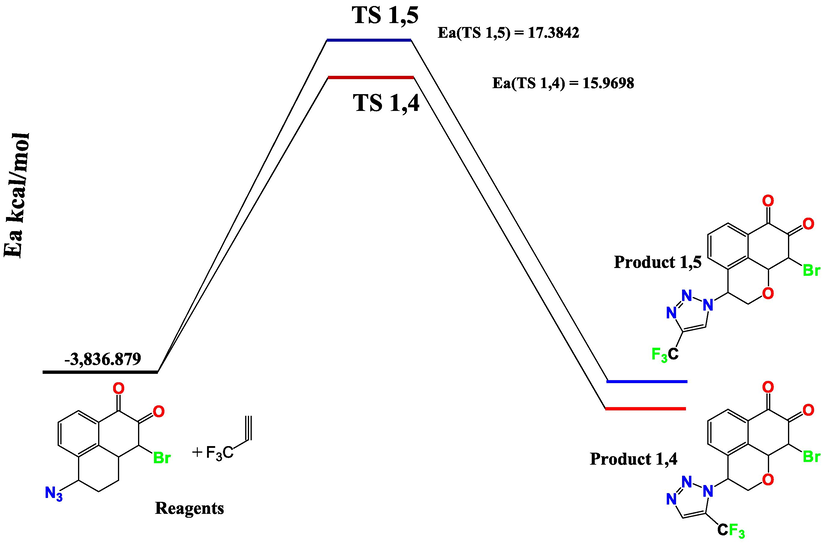
The activation energy barriers for cycloaddition of a mansonone azide with 3,3,3-Trifluoroprop-1-yn.
Optimized Parameters
TS 1,4
TS 1,5
Distance bond
Value(Angstroms)
Distance bond
Value(Angstroms)
R(16,17)
1.262
R(1,2)
1.234
R(16,26)
2.7504
R(1,3)
1.4674
R(16,27)
2.2106
R(1,23)
2.2012
R(17,18)
1.1654
R(1,24)
2.6266
R(17,26)
2.5855
R(1,25)
2.7329
R(17,27)
2.6404
R(2,7)
1.0692
R(18,26)
2.1815
R(2,23)
2.7526
R(18,27)
2.7779
R(2,24)
2.5831
R(26,27)
1.235
R(2,25)
2.1418
Angles
Value(Degrees)
R(20,23)
1.4639
A(13,16,17)
119.1223
R(23,24)
1.2595
A(13,16,27)
131.6954
R(24,25)
1.1698
A(17,16,32)
119.8582
Angles
Value(Degrees)
A(26,16,32)
50.8633
A(2,1,3)
157.5263
A(16,17,18)
140.3347
A(1,2,7)
160.0067
A(18,26,28)
100.9443
A(20,23,24)
121.2944
A(27,26,28)
153.631
A(23,24,25)
139.0246
A(16,27,18)
53.0167
A(17,27,32)
123.1696
A(18,27,32)
147.8052
A(26,27,32)
162.9151
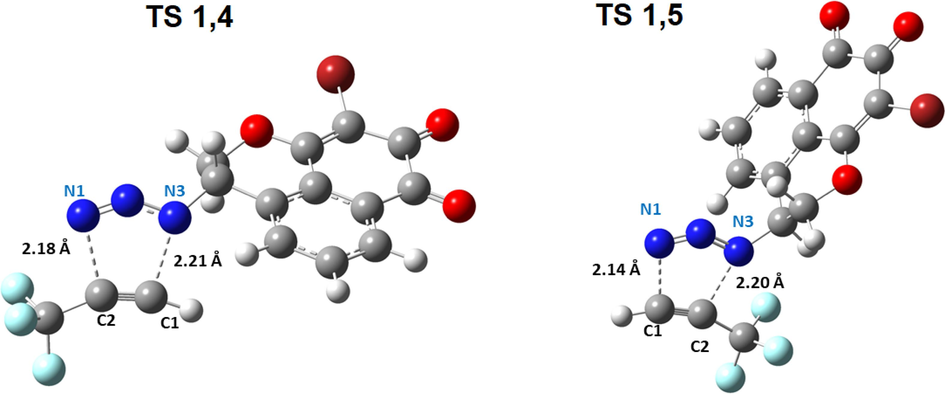
Structures of transition states TS1,4 and TS1,5 of cyclization, the distances are given in Å.
The 1,3-dipolar cycloaddition of 3,3,3-Trifluoroprop-1-yne was investigated using DFT at the B3LYP/6-31G*(d,p) level. The energy barriers for the coupling of mansonone triazole and 3,3,3-Trifluoroprop-1-yne have been calculated. As shown in Table 13, the activation barriers for the reaction lead to both the 1,4 and 1,5 regioisomers of 1,2,3-triazole, which are very close, respectively with a preferred regioisomer 1,4.
Reactants
Isomer 1,4
Isomer 1,5
E Dipole (ua)
−3422.4892
−3422.4892
E Dipolarophile (ua)
−414.3898
−414.3898
Product
−3836.93044
−3836.879558
E(TS) ua
−3836.8534
−3836.8513
Energy activation Kcal/mol
15.9698
17.3842
Frequency (cm-1)
−392.18
−387.12
Δd
0.3
0.6
For TS1 and TS2, the binding orders are quite different (2.18 Å −2.21 Å) and (2.14 Å −2.20 Å). This means that the two processes are asynchronous (formation of a bond is advanced compared to the second). However, the process passing through TS1,4 is slightly more asynchronous (Δd = 0.3) than that passing through TS1,5 (Δd = 0.6). Moreover, the very low energy difference between cycloaddition isomer 1,4 and isomer 1,5 shows that these two regioisomers are isoenergetic.
4 Conclusion
In this research paper, QSAR molecular docking and MD simulation were used to develop novel mansonone E derivatives linked to triazole as an anticancer agent. The CoMFA, CoMSIA, and HQSAR models were generated using a PLS model. All these established models proved to have excellent statistical values (R2 = 0.988, Q2 = 0.702 SEE = 0.063 for CoMFA), (R2 = 0.979, Q2 = 0.820, SEE = 0.086 for CoMSIA) and (R2 = 0.962, Q2 = 0.919 SEE = 0.159 for CoMFA), indicating that the models were statistically reliable. Some external validation criteria were used showing the good predictability of the CoMFA and HQSAR model, while the CoMSIA did not verify all the criteria. Based on the results obtained, seven candidates were designed with very interesting activities using CoMSIA. In addition, pharmacokinetic parameters were assessed by drug-likeness and ADMET parameter estimation. The exploration of the interactions of the binding site and the energy between the designed ligands and the protein (1ZXM) was carried out by molecular docking. The results of the docking study indicated that the engineered compounds showing significant affinity in the receptor binding pocket as the most potent inhibitor of data set (N17), and forming more interesting interactions than doxorubicin. The docking results were confirmed by MD simulation also showed that the better-designed compound is characterized by stable behavior in the receptor binding pocket. The cycloadition 1.3 reaction for the synthesis of compound T01 has been described by analyzing the HOMO/LUMO gaps, the chemical potentials and the global electrophilicity, using the DFT method at the theoretical level B3LYP/6-31G*. It showed an IED character of the reaction, the regeoselectivity of T1 (isomer 1,4) was also explained by indices of Parr functions. Calculations of energy barriers for the cycloaddition reaction gave as expected 15.9698 and 17.3842 kcal/mol for the 1,4 and 1,5 regioisomer approaches, respectively, (the 1,5 regioisomer is preferred), which confirms the results of the local reactivity index.
CRediT authorship contribution statement
Kamal Tabti: Data curation, Writing – original draft. Abdelouahid Sbai: Validation, Visualization, Software, Supervision, Project administration. Hamid Maghat: Investigation, Supervision. Tahar Lakhlifi: . Mohammed Bouachrine: Conceptualization, Methodology.
Declaration of Competing Interest
The authors declare that they have no known competing financial interests or personal relationships that could have appeared to influence the work reported in this paper.
References
- Computational approaches to discover a Kaempferol derivative extracted from Senna alexandrina as Escherichia coli enzyme (MurF) inhibitor by molecular docking, molecular dynamics simulation, and ADME-Tox. Struct. Chem. 2022:1-15.
- [CrossRef] [Google Scholar]
- Design, synthesis and biological evaluation of novel coumarin-based benzamides as potent histone deacetylase inhibitors and anticancer agents. Eur. J. Med. Chem.. 2017;132:42-62.
- [CrossRef] [Google Scholar]
- Adeniran, O.Y., Ayorinde, O., Boboye, S.O., 2021. Virtual high-throughput screening (VHTS), three-dimensional quantitative structure-activity and relationship (3D-QSAR) and molecular docking studies of novel phyto-inhibtors of topoisomerase II alpha. GSC biol. pharm. sci. 15, 072–082. 10.30574/gscbps.2021.15.2.0099.
- QSAR and docking studies on xanthone derivatives for anticancer activity targeting DNA topoisomerase IIα. Drug Des. Devel. Ther. 2014:183-195.
- [CrossRef] [Google Scholar]
- First report on the structural exploration and prediction of new BPTES analogs as glutaminase inhibitors. J. Mol. Struct.. 2017;1143:49-64.
- [CrossRef] [Google Scholar]
- Reliable estimation of prediction errors for QSAR models under model uncertainty using double cross-validation. J. Cheminform.. 2014;6:1-19.
- [CrossRef] [Google Scholar]
- Density-functional exchange-energy approximation with correct asymptotic behavior. Phys. Rev. A. 1988;38:3098.
- [CrossRef] [Google Scholar]
- Molecular dynamics with coupling to an external bath. J. Chem. Phys.. 1984;81:3684-3690.
- [Google Scholar]
- On the nature of Parr functions to predict the most reactive sites along organic polar reactions. Chem. Phys. Lett.. 2013;582:141-143.
- [CrossRef] [Google Scholar]
- Osteoblast–osteoclast interactions. Connect. Tissue Res.. 2018;59:99-107.
- [CrossRef] [Google Scholar]
- QSAR study of unsymmetrical aromatic disulfides as potent avian SARS-CoV main protease inhibitors using quantum chemical descriptors and statistical methods. Chemom. Intell. Lab. Syst.. 2021;210:104266
- [CrossRef] [Google Scholar]
- SwissADME: a free web tool to evaluate pharmacokinetics, drug-likeness and medicinal chemistry friendliness of small molecules. Sci. Rep.. 2017;7:1-13.
- [CrossRef] [Google Scholar]
- Synthetic DNA-targeted chemotherapeutic agents and related tumor-activated prodrugs. Burger’s Med. Chem. Drug Discovery 2003:83-150.
- [CrossRef] [Google Scholar]
- Quantitative characterization of the local electrophilicity of organic molecules. Understanding the regioselectivity on Diels− Alder reactions. Chem. A Eur. J.. 2002;106:6871-6875.
- [CrossRef] [Google Scholar]
- Global and local reactivity indices for electrophilic/nucleophilic free radicals. Org. Biomol. Chem.. 2013;11:4350-4358.
- [CrossRef] [Google Scholar]
- Understanding the local reactivity in polar organic reactions through electrophilic and nucleophilic Parr functions. RSC Adv.. 2013;3:1486-1494.
- [CrossRef] [Google Scholar]
- Driscoll, J.S., Hazard Jr, G.F., Wood Jr, H.B., Goldin, A., 1974. Structure-antitumor activity relationships among quinone derivatives. Cancer chemotherapy rep. Part 2 4, 1–362.
- In silico design of new pyrimidine-2, 4-dione derivatives as promising inhibitors for HIV Reverse Transcriptase-associated RNase H using 2D-QSAR modeling and (ADME/Tox) properties. Moroc. J. Chem.. 2023;11(11–2):300-317.
- [CrossRef] [Google Scholar]
- 3D-QSAR study, docking molecular and simulation dynamic on series of benzimidazole derivatives as anti-cancer agents. J. Indian Chem. Soc.. 2022;99:100582
- [CrossRef] [Google Scholar]
- High-throughput virtual screening approach of natural compounds as target inhibitors of plasmepsin-II. J. Biomol. Struct. Dyn.. 2022;1–11
- [CrossRef] [Google Scholar]
- A smooth particle mesh Ewald method. J. Chem. Phys.. 1995;103:8577-8593.
- [CrossRef] [Google Scholar]
- Combined pharmacophore-guided 3D-QSAR, molecular docking and molecular dynamics studies for evodiamine analogs as DNA topoisomerase I inhibitors. J. Taiwan Inst. Chem. Eng.. 2017;78:81-95.
- [CrossRef] [Google Scholar]
- DNA topoisomerase I—targeted chemotherapy of human colon cancer in xenografts. Science. 1989;246:1046-1048.
- [CrossRef] [Google Scholar]
- Exploration of a binding mode of indole amide analogues as potent histone deacetylase inhibitors and 3D-QSAR analyses. Bioorg. Med. Chem.. 2005;13:5424-5434.
- [CrossRef] [Google Scholar]
- In silico investigation on the beneficial effects of medicinal plants on diabetes and obesity: Molecular docking, molecular dynamic simulations, and ADMET studies. Biointerface Res. Appl. Chem.. 2021;11:6933-6949.
- [CrossRef] [Google Scholar]
- Characterization of a Chinese hamster ovary cell line with acquired resistance to the bisdioxopiperazine dexrazoxane (ICRF-187) catalytic inhibitor of topoisomerase II. Biochem. Pharmacol.. 1997;53:1843-1853.
- [CrossRef] [Google Scholar]
- P-LINCS: A parallel linear constraint solver for molecular simulation. J. Chem. Theory Comput.. 2008;4:116-122.
- [CrossRef] [Google Scholar]
- Human DNA topoisomerase II: evaluation of enzyme activity in normal and neoplastic tissues. Biochemistry. 1990;29:2127-2134.
- [CrossRef] [Google Scholar]
- In silico and POM analysis for potential antimicrobial agents of thymidine analogs by using molecular docking, molecular dynamics and ADMET profiling. Nucleos. Nucleot. Nucl.. 2023;1–42
- [CrossRef] [Google Scholar]
- Design, synthesis and biological evaluation of novel mansonone E derivatives prepared via CuAAC click chemistry as topoisomerase II inhibitors. Eur. J. Med. Chem.. 2013;68:58-71.
- [CrossRef] [Google Scholar]
- Assessment of molecular binding of Hoechst 33258 analogues into DNA using docking and MM/GBSA approach. J. Comput. Sci.. 2015;10:166-177.
- [CrossRef] [Google Scholar]
- A further exploration of a nucleophilicity index based on the gas-phase ionization potentials. J. Mol. Struct.: THEOCHEM. 2008;865:68-72.
- [CrossRef] [Google Scholar]
- An insight into pyruvate dehydrogenase kinase (PDHK) inhibition through pharmacophore modeling and QSAR studies. J. Comput. Sci.. 2014;5:558-567.
- [CrossRef] [Google Scholar]
- A computational QSAR, molecular docking and in vitro cytotoxicity study of novel thiouracil-based drugs with anticancer activity against human-DNA topoisomerase II. Int. J. Mol. Sci.. 2022;23:11799.
- [CrossRef] [Google Scholar]
- Dibenzepinones, dibenzoxepines and benzosuberones based p38α MAP kinase inhibitors: Their pharmacophore modelling, 3D-QSAR and docking studies. Comput. Biol. Med.. 2019;110:175-185.
- [CrossRef] [Google Scholar]
- Function of DNA topoisomerases as replication swivels in Saccharomyces cerevisiae. J. Mol. Biol.. 1989;208:257-267.
- [CrossRef] [Google Scholar]
- Conceptual Density Functional Theory. J. Phys. Rev.. 1965;140:1133-1138.
- [CrossRef] [Google Scholar]
- Potent antitumor activity of synthetic 1, 2-naphthoquinones and 1, 4-naphthoquinones. Bioorg. Med. Chem.. 2003;11:3179-3191.
- [CrossRef] [Google Scholar]
- Kumari, R., Kumar, R., Consortium, O.S.D.D., Lynn, A., 2014. g_mmpbsa□ A GROMACS tool for high-throughput MM-PBSA calculations. J. Chem. Inf. Model. 54, 1951–1962. 10.1021/ci500020m.
- Substituted heterocycles as anti-tumor agents. Google Patents; 1999.
- Development of the Colle-Salvetti correlation-energy formula into a functional of the electron density. Phys. Rev. B. 1988;37:785.
- [CrossRef] [Google Scholar]
- Inhibition of thioredoxin reductase by mansonone F analogues: Implications for anticancer activity. Chem. Biol. Interact.. 2009;177:48-57.
- [CrossRef] [Google Scholar]
- CoMFA and CoMSIA 3D-QSAR studies on quionolone caroxylic acid derivatives inhibitors of HIV-1 integrase. Eur. J. Med. Chem.. 2010;45:3413-3419.
- [CrossRef] [Google Scholar]
- Chemical reactivity of enolate ions: the local hard and soft acids and bases principle viewpoint. J. Am. Chem. Soc.. 1994;116:9298-9301.
- [CrossRef] [Google Scholar]
- MMPBSA. py: an efficient program for end-state free energy calculations. J. Chem. Theory Comput.. 2012;8:3314-3321.
- [CrossRef] [Google Scholar]
- A theoretical investigation of the regio-and stereoselectivities of the 1, 3-dipolar cycloaddition of C-diethoxyphosphoryl-N-methylnitrone with substituted alkenes. Tetrahedron Lett.. 2010;51:2617-2621.
- [CrossRef] [Google Scholar]
- Nel, J.G., 1987. 24, 2649 (1991); M. Lindmartk nd KB. Wagner. Macromolecules 20, 2949.
- Comparative QSARs for antimalarial endochins: importance of descriptor-thinning and noise reduction prior to feature selection. Chemom. Intell. Lab. Syst.. 2011;109:146-161.
- [CrossRef] [Google Scholar]
- OUABANE, M., TABTI, K., HAJJI, H., ELBOUHI, M., KHALDAN, A., ELKAMEL, K., Abdelouahid, S., AJANA, M.A., SEKKATE, C., BOUACHRINE, M., 2023. Structure-odor relationship in pyrazines and derivatives: a physicochemical study using 3D-QSPR, HQSPR, Monte Carlo, Molecular Docking, ADME-Tox and Molecular Dynamics. Arab. J. Chem. 105207. 10.1016/j.arabjc.2023.105207.
- Synthesis, biological evaluation and virtual screening of some acridone derivatives as potential anticancer agents. Bioorg. Med. Chem.. 2020;28:115426
- [CrossRef] [Google Scholar]
- 3D QSAR studies on protein tyrosine phosphatase 1B inhibitors: comparison of the quality and predictivity among 3D QSAR models obtained from different conformer-based alignments. J. Chem. Inf. Model.. 2006;46:2579-2590.
- [CrossRef] [Google Scholar]
- Parr, R.G., Szentpály, L. v, Liu, S., 1999. Electrophilicity index. J. Am. Chem. Soc. 121, 1922–1924.
- Theory of atoms and molecules. New York: Oxford University Press; 1989.
- Polymorphic transitions in single crystals: A new molecular dynamics method. J. Appl. Phys.. 1981;52:7182-7190.
- [CrossRef] [Google Scholar]
- pkCSM: predicting small-molecule pharmacokinetic and toxicity properties using graph-based signatures. J. Med. Chem.. 2015;58:4066-4072.
- [CrossRef] [Google Scholar]
- DNA topoisomerase I inhibitors: chemistry, biology, and interfacial inhibition. Chem. Rev.. 2009;109:2894-2902.
- [CrossRef] [Google Scholar]
- Quinacrine has anticancer activity in breast cancer cells through inhibition of topoisomerase activity. Int. J. Cancer. 2012;130:1660-1670.
- [CrossRef] [Google Scholar]
- DNA transport by a type II DNA topoisomerase: evidence in favor of a two-gate mechanism. Cell. 1994;77:609-616.
- [CrossRef] [Google Scholar]
- Syntheses and anti-MRSA activities of the C3 analogs of mansonone F, a potent anti-bacterial sesquiterpenoid: insights into its structural requirements for anti-MRSA activity. Bioorg. Med. Chem. Lett.. 2004;14:4519-4523.
- [CrossRef] [Google Scholar]
- Synthesis, characterization and antiproliferative activity of 1, 2-naphthoquinone and its derivatives. Appl. Biochem. Biotechnol.. 2012;167:1430-1445.
- [CrossRef] [Google Scholar]
- The structure–activity relationships of mansonone F, a potent anti-MRSA sesquiterpenoid quinone: SAR studies on the C6 and C9 analogs. Bioorg. Med. Chem. Lett.. 2006;16:142-145.
- [CrossRef] [Google Scholar]
- QSAR studies of new compounds based on thiazole derivatives as PIN1 inhibitors via statistical methods. RHAZES: Green Appl. Chem.. 2020;9:70-91.
- [CrossRef] [Google Scholar]
- Computational investigation of pyrrolidin derivatives as novel GPX4/MDM2–p53 inhibitors using 2D/3D-QSAR, ADME/toxicity, molecular docking, molecular dynamics simulations, and MM-GBSA free energy. Struct. Chem.. 2022;33:1019-1039.
- [CrossRef] [Google Scholar]
- HQSAR, CoMFA, CoMSIA docking studies and simulation MD on quinazolines/quinolines derivatives for DENV virus inhibitory activity. Chem. Afr.. 2022;5:1937-1958.
- [CrossRef] [Google Scholar]
- Molecular modelling of antiproliferative inhibitors based on SMILES descriptors using Monte-Carlo method, docking, MD simulations and ADME/Tox studies. Mol. Simul.. 2022;1–17
- [CrossRef] [Google Scholar]
- In silico design of novel PIN1 inhibitors by combined of 3D-QSAR, molecular docking, molecular dynamic simulation and ADMET studies. J. Mol. Struct.. 2022;1253:132291
- [CrossRef] [Google Scholar]
- Design and development of novel spiro-oxindoles as potent antiproliferative agents using quantitative structure activity based Monte Carlo method, docking molecular, molecular dynamics, free energy calculations, and pharmacokinetics/toxicity studies. J. Mol. Struct.. 2023;1284:135404
- [CrossRef] [Google Scholar]
- Profiling the structural determinants of pyrrolidine derivative as gelatinases (MMP-2 and MMP-9) inhibitors using in silico approaches. Comput. Biol. Chem.. 2023;104:107855
- [CrossRef] [Google Scholar]
- Tabti, K., Hajji, H., Sbai, A., Maghat, H., Bouachrine, M., Lakhlifi, T., 2023c. Identification of a potential thiazole inhibitor against biofilms by 3D QSAR, molecular docking, DFT analysis, MM-PBSA binding energy calculations, and molecular dynamics simulation. Phys. Chem. Res. 11, 369–389. 10.22036/PCR.2022.335657.2068.
- Computational exploration of the structural requirements of triazole derivatives as colchicine binding site inhibitors. ChemistrySelect. 2023;8:e202301707.
- [Google Scholar]
- The importance of being earnest: validation is the absolute essential for successful application and interpretation of QSPR models. QSAR Comb. Sci.. 2003;22:69-77.
- [Google Scholar]
- ADMET in silico modelling: towards prediction paradise? Nat. Rev. Drug Discov.. 2003;2:192-204.
- [CrossRef] [Google Scholar]
- Source contributions to ambient aerosol calculated by discriminat partial least squares regression (PLS) J. Chemom.. 1988;2:281-296.
- [CrossRef] [Google Scholar]
- Cellular roles of DNA topoisomerases: a molecular perspective. Nat. Rev. Mol. Cell Biol.. 2002;3:430-440.
- [CrossRef] [Google Scholar]
- Cytotoxic effects of mansonone E and F isolated from Ulmus pumila. Biol. Pharm. Bull.. 2004;27:1025-1030.
- [CrossRef] [Google Scholar]
- Synthesis and evaluation of mansonone F derivatives as topoisomerase inhibitors. Eur. J. Med. Chem.. 2011;46:3339-3347.
- [CrossRef] [Google Scholar]
- Comparative QSAR studies using HQSAR, CoMFA, and CoMSIA methods on cyclic sulfone hydroxyethylamines as BACE1 inhibitors. Comput. Biol. Chem.. 2017;67:38-47.
- [CrossRef] [Google Scholar]
Appendix A
Supplementary material
Supplementary data to this article can be found online at https://doi.org/10.1016/j.arabjc.2023.105376.
Appendix A
Supplementary material
The following are the Supplementary data to this article:Supplementary data 1
Supplementary data 1


