Discovering common pathogenetic processes between polycystic ovary syndrome and uterine corpus endometrial carcinoma by bioinformatics and experimental approach
⁎Corresponding authors. taohu986@aliyun.com (Tao Hu), dhh@xzhmu.edu.cn (Huanhuan Ding)
-
Received: ,
Accepted: ,
This article was originally published by Elsevier and was migrated to Scientific Scholar after the change of Publisher.
Abstract
The incidence of uterine corpus endometrial carcinoma (UCEC) is higher in individuals with polycystic ovary syndrome (PCOS) than in the general population. Nonetheless, the etiological mechanisms underlying this association remain unclear. This study aimed to delineate a shared gene signature, elucidate the pathophysiological mechanisms, and identify prospective therapeutic agents through an amalgamation of bioinformatics and in vitro studies. We identified 89 differentially expressed genes (DEGs) common to PCOS and UCEC, primarily involved in hormone signaling and immune responses. Applying the CytoHubba algorithm, we identified CCND1, CDH1, MMP9, PPP1CA, TLR2, PKM, and RPS6KA1 as key hub genes. Their expression was corroborated using a validation cohort, cellular assays, and the Human Protein Atlas (HPA) database. Notably, these hub genes demonstrated a significant positive correlation with testosterone levels in primary granulosa cells from PCOS patients. Moreover, they hold promise as diagnostic indicators of PCOS and UCEC. Immune microenvironment analysis revealed positive associations of MMP9 and TLR2 with various immune cell types and checkpoints and a spectrum of chemokines and their receptors. MAZ emerged as the pivotal transcription factor governing the expression of these hub genes in both PCOS and UCEC. Consequently, our research elucidates the common pathogenic pathways and genetic markers shared by PCOS and UCEC, providing a foundation for future therapeutic strategies and drug discovery.
Keywords
Polycystic ovary syndrome
Uterine corpus endometrial carcinoma
Bioinformatics
Gene signatures
Immune microenvironment
- PCOS
-
polycystic ovarian syndrome
- UCEC
-
Uterine Corpus Endometrial Carcinoma
- GO
-
gene ontology
- KEGG
-
Kyoto encyclopedia of genes and genomes
- PPI
-
protein–protein interactions
- DEGs
-
differentially expressed genes
- ROC
-
receiver operating characteristic curve
- TF
-
transcription factor
- DHT
-
dihydrotestosterone
Abbreviations
1 Introduction
Polycystic ovary syndrome (PCOS) is a highly heterogeneous disorder affecting approximately 8 %-13 % of women of reproductive age (Tay et al., 2023). Characterized by a spectrum of reproductive, metabolic, and endocrine dysfunctions, including oligoovulation, infertility, hyperandrogenemia, obesity, hyperinsulinemia, type 2 diabetes mellitus, and cardiovascular disease, it remains a complex condition with no identified systematic cause to date (Dapas and Dunaif, 2022, Ibanez and de Zegher, 2023). The widely accepted Rotterdam criteria of 2003 currently serve as the standard for diagnosing PCOS, acknowledging its intricate pathophysiology and the lack of precise diagnostic parameters (Joham et al., 2022).
Recent research has linked PCOS to a heightened risk of malignancies such as endometrial, ovarian, renal, and pancreatic cancers (Yin et al., 2019). Notably, uterine corpus endometrial carcinoma (UCEC), the preeminent malignancy of the female reproductive tract and primarily of the endometrial epithelium, has seen an uptick in incidence, trending towards younger populations (Shafiee et al., 2014, Lin et al., 2022). As estimations predict a substantial increase in UCEC cases by 2030, prioritizing early detection and prevention is vital.
Studies have shown that PCOS is a significant risk factor for UCEC (Barry et al., 2014). Women with PCOS are three times more likely to develop UCEC compared to their counterparts (Yin et al., 2019). PCOS-associated obesity and anovulation can lead to elevated estrogen levels and progesterone resistance, fostering endometrial hyperplasia and increasing the risk of UCEC (Miao et al., 2022). Despite the vital link between PCOS and UCEC, the exact mechanisms contributing to this susceptibility remain elusive. Understanding shared genetic markers could illuminate the pathogenesis and inform the development of targeted therapeutics for those afflicted by both conditions.
This study used bioinformatics and clinical sample analyses to dissect the molecular interplay between PCOS and UCEC. We aimed to deduce the gene signatures and elucidate their contribution to disease comorbidity, which may pave the way for more efficacious treatment options. This approach has substantial clinical implications, potentially revolutionizing early diagnosis and management strategies for women with both PCOS and UCEC.
2 Materials and methods
2.1 Dataset acquisition
Data for the training sets (GSE34526 & GSE67678) and the validation sets (GSE137684, GSE84958, GSE48301, & GSE36389) were retrieved from the Gene Expression Omnibus (GEO) database. We used The Cancer Genome Atlas (TCGA) database and primary granulosa cells from PCOS patients to validate hub genes. The data specifications are presented in Table 1.
| Data source | Sample information | Dataset feature |
|---|---|---|
| GSE34526 | 3 normals and 7 PCOS patients | Training set |
| GSE67678 | 5 normals and 7 UCEC patients | Training set |
| GSE137684 | 4 normals and 8 PCOS patients | Validation |
| GSE84958 | 23 normals and 30 PCOS patients | Validation |
| Clinical samples | 20 normals and 20 PCOS patients | Validation |
| GSE48301 | 15 control endometrium and 14 PCOS endometrium | Validation |
| GSE36389 | 6 normals and 9 UCEC patients | Validation |
| TCGA | 34 normals and 553 UCEC patients | Validation |
2.2 Differential expression and enrichment analysis
The datasets obtained from GEO were normalized. Gene fold changes (FC) were computed, and differentially expressed genes (DEGs) were identified using the “edgeR” R package with criteria set at p < 0.05 and |logFC|>1.0. Shared DEGs were determined through the “VennDiagram” R package. Heat maps and volcano plots were created using a web-based platform (https://www.bioinformatics.com.cn).
Gene ontology (GO) and Kyoto Encyclopedia of Genes and Genomes (KEGG) enrichment analyses were performed using R, and enrichment terms were selected at adjusted p < 0.05. GO analysis covered biological process (BP), cellular component (CC), and molecular function (MF), whereas KEGG analysis focused on signaling pathways.
2.3 Protein-Protein interactions (PPI) network construction
We constructed a PPI network for the identified common genes using the STRING online database (Szklarczyk et al., 2019) (http://string-db.org) and visualized it with Cytoscape software (Shannon et al., 2003) (version 3.9.1). We deemed interactions with a score greater than 0.4 as significant. The “CytoHubba” Cytoscape plugin facilitated the screening of hub genes.
2.4 Hub gene expression analysis
The expression levels of hub genes in datasets GSE34526 and GSE63678 were evaluated for PCOS and UCEC, respectively, using GraphPad Prism. Validation of hub gene expression in PCOS utilized granulosa cells, whereas, in UCEC, mRNA expression was confirmed using the TCGA database. Protein expression of the seven hub genes was corroborated by immunohistochemical analysis using the Human Protein Atlas (HPA) online database.
The expression analysis was performed as previously described (Wang et al., 2018). RNA was isolated using the TRIzol method, reverse transcription was conducted using cDNA synthesis kits, and quantitative PCR (qPCR) was performed using GAPDH as the internal control. Primer sequences are documented in Table S1.
2.5 Immune correlation analysis
This study utilized TISIDB, a comprehensive repository for tumor-immune system interactions, to elucidate the associations between hub genes and immune constituents, such as immune cells, checkpoints, and chemokines, in UCEC. TISIDB archives immunity-related data for 988 genes and facilitates analyses of gene-immune functional correlations, including lymphocytes, immunoregulatory molecules, and chemokines, across 30 different cancers (Ru et al., 2019).
2.6 Receiver operating characteristic (ROC) curve analysis
ROC curves were generated using the “pROC” package in R, and area under the curve (AUC) values were computed to evaluate the diagnostic potential of each hub gene (Robin et al., 2011).
2.7 Regulatory network construction
NetworkAnalyst was employed to construct a network mapping interactions between hub genes and transcription factors (TFs), microRNAs (miRNAs), drugs, and chemical compounds (Xia et al., 2015). This includes hub gene-miRNA and TF-DEG interactions, utilizing databases such as TarBase, miRTarBase, and JASPAR (Fornes et al., 2020). The Drug Gene Interaction Database (DGIdb) (http://www.dgidb.org) also provided predictions for drugs interacting with hub genes.
2.8 PCOS patient sample collection
The process of collecting granulosa cells has been previously described (Zhang et al., 2022). Briefly, follicular fluid was centrifuged at 250 × g for 10 min, after which the cell layer pellet was aspirated and transferred to a new centrifuge tube. The cells were then rinsed with PBS, resuspended, and centrifuged to collect cellular precipitate.
2.9 Cell culture and treatment
i. Human Granulosa-Like Tumor Cell Line (KGN) culture
KGN was cultured and treated according to a previously published work by our team (Liu et al., 2023). Briefly, cells were seeded into 12-well plates containing a culture medium supplemented with 10 % hormone-deprived fetal bovine serum. The culture plates were divided into DMSO and DHT (CAS No: 521–18-6, Aladdin, China) groups, with three replicate wells per group. After overnight incubation, the cells were exposed to a culture medium containing DMSO and 10 μM DHT. After 24 h, the supernatant was aspirated, and the cells were lysed with TRIzol for RNA extraction.
ii. siRNA transfection
The siRNA was synthesized by GenePharma (Suzhou, China) and transfected according to the manufacturer's instructions. Briefly, KGN and Ishikawa cells were seeded into 12-well plates, and siRNA of NC and MAZ was transfected using Lipofectamine 3000 Reagent (Invitrogen, USA). After 24 h, cells were collected for RNA extraction.
2.10 Statistical analysis
Differences between the control and patient groups were assessed using a two-tailed t-test with GraphPad Prism 8.0.1 software, and the results are expressed as mean ± standard error of the mean (SEM). Pearson's correlation analysis was employed for correlation analysis, with the significance of the statistics indicated by p-values. *p < 0.05, **p < 0.01, ***p < 0.001, **** p < 0.0001.
3 Results
3.1 Identification of differentially expressed genes (DEGs)
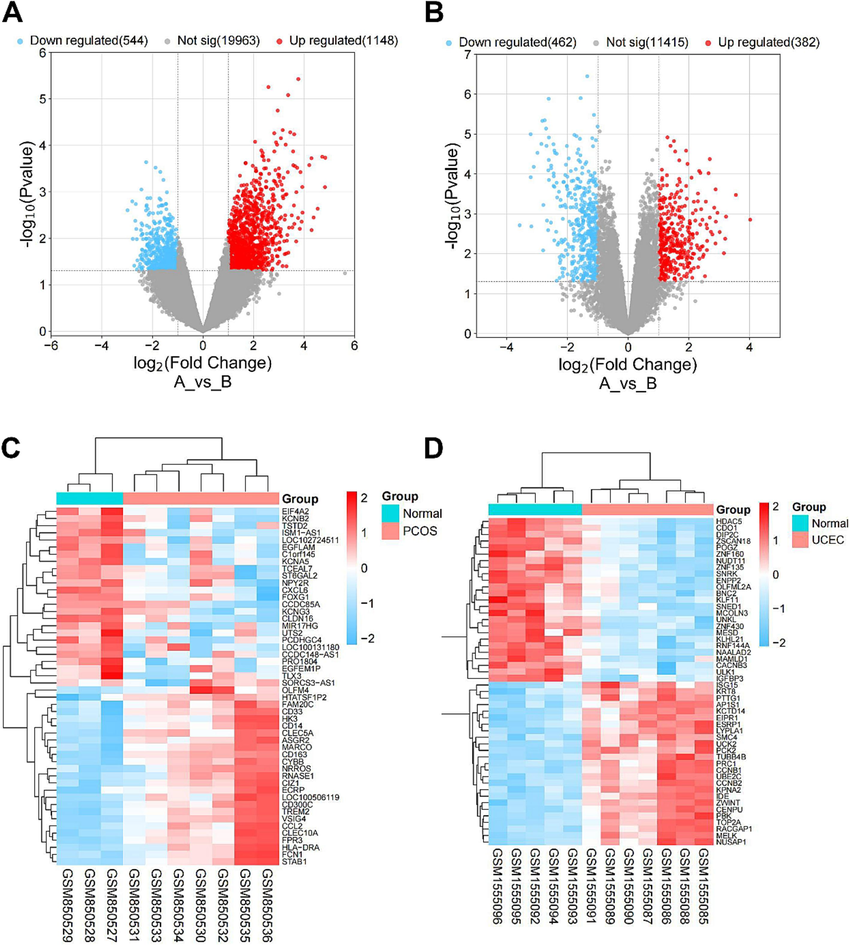
We obtained the PCOS dataset GSE34526 and UCEC dataset GSE63678 from the Gene Expression Omnibus (GEO) database to examine the DEGs of PCOS and UCEC derived from granulosa cells and endometrial tissues, respectively. DEGs were screened with a threshold of p < 0.05 and a |log2 FC |>1.0, and their expression patterns were illustrated using volcano plots (Fig. 1A & 1B) and heatmaps (Fig. 1A & 1D). The former depicts the number of DEGs, whereas the latter displays the top 50 DEGs.
-
Differential expression genes (DEGs) identification A & B. Volcano plot showed the DEGs of PCOS in GSE34526 (A) and UCEC in GSE63678 (B). C & D. Heatmap showed the top 50 DEGs of PCOS in GSE34526 (C) and DEGs of UCEC in GSE63678 (D).
3.2 Screening for common DEGs and pathway enrichment
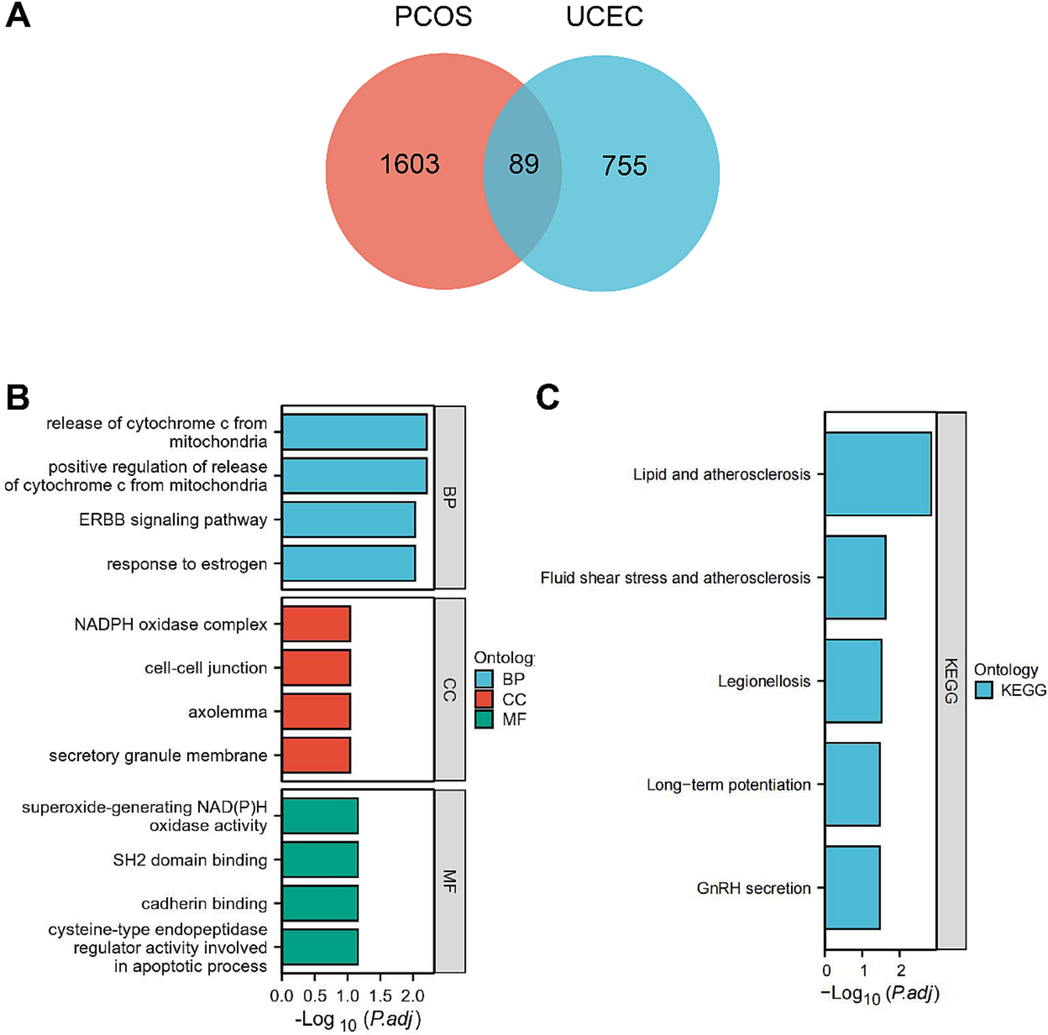
We identified 89 common DEGs between the GSE34526 and GSE63678 datasets (Fig. 2A). GO and KEGG pathway enrichment analyses revealed their biological functions, which included the release of cytochrome c from the mitochondria, ERBB signaling, and estrogen response (Fig. 2B). Furthermore, their cellular components are linked to the NADPH oxidase complex and cell junction, and their molecular functions involve SH2 domain binding and cadherin binding. KEGG analysis indicated that these DEGs were implicated in pathways related to lipid metabolism, adenosclerosis, legionellosis, and gonadotropin-releasing hormone (GnRH) secretion (Fig. 2C).
-
Function analysis of the overlapping DEGs A. Venn diagram displayed the overlapping genes of PCOS and UCEC B & C. GO and KEGG enrichment analysis of overlapping DEGs. GO analysis showing the biological, cell component, and molecular function enrichment results (B). KEGG analysis showing the signaling pathway enrichment results (C). An adjusted p < 0.05 was identified as significantly changed. Abbreviations: GO, Gene Ontology; BP, biological process; CC, cellular component; MF, molecular function; KEGG, Kyoto Encyclopedia of Genes and Genomes.
3.3 Construction of the DEGs and hub gene interaction network
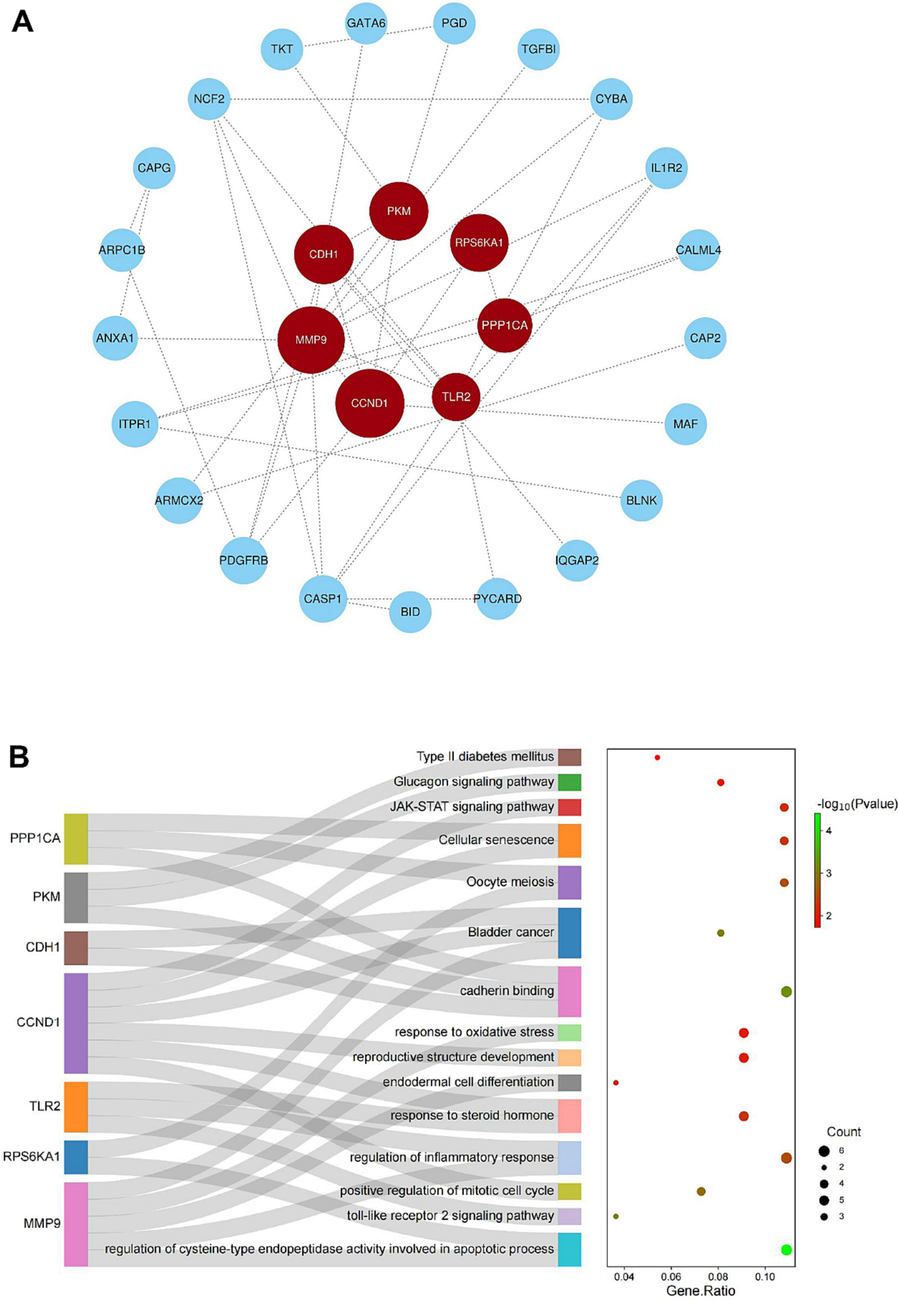
We used the STRING database and Cytoscape software to construct a Protein-Protein Interaction (PPI) network of overlapping DEGs (Fig. 3A). Employing the CytoNCA algorithm in Cytoscape, we identified seven hub genes: CCND1, CDH1, PKM, MMP9, RPS6KA1, PPP1CA, and TLR2.
-
DEGs and hub gene interaction network A. The PPI network was constructed with the STRING online tool and visualized with Cytoscape. B. Functional enrichment analysis of hub genes.
GO and KEGG pathway analyses of these hub genes revealed their roles in various biological functions and pathways, including oocyte meiosis, oxidative stress, reproductive structure development, steroid hormone response, inflammatory regulation, JAK-STAT signaling, cellular senescence, and apoptosis (Fig. 3B).
3.4 Analysis and Validation of hub gene expression
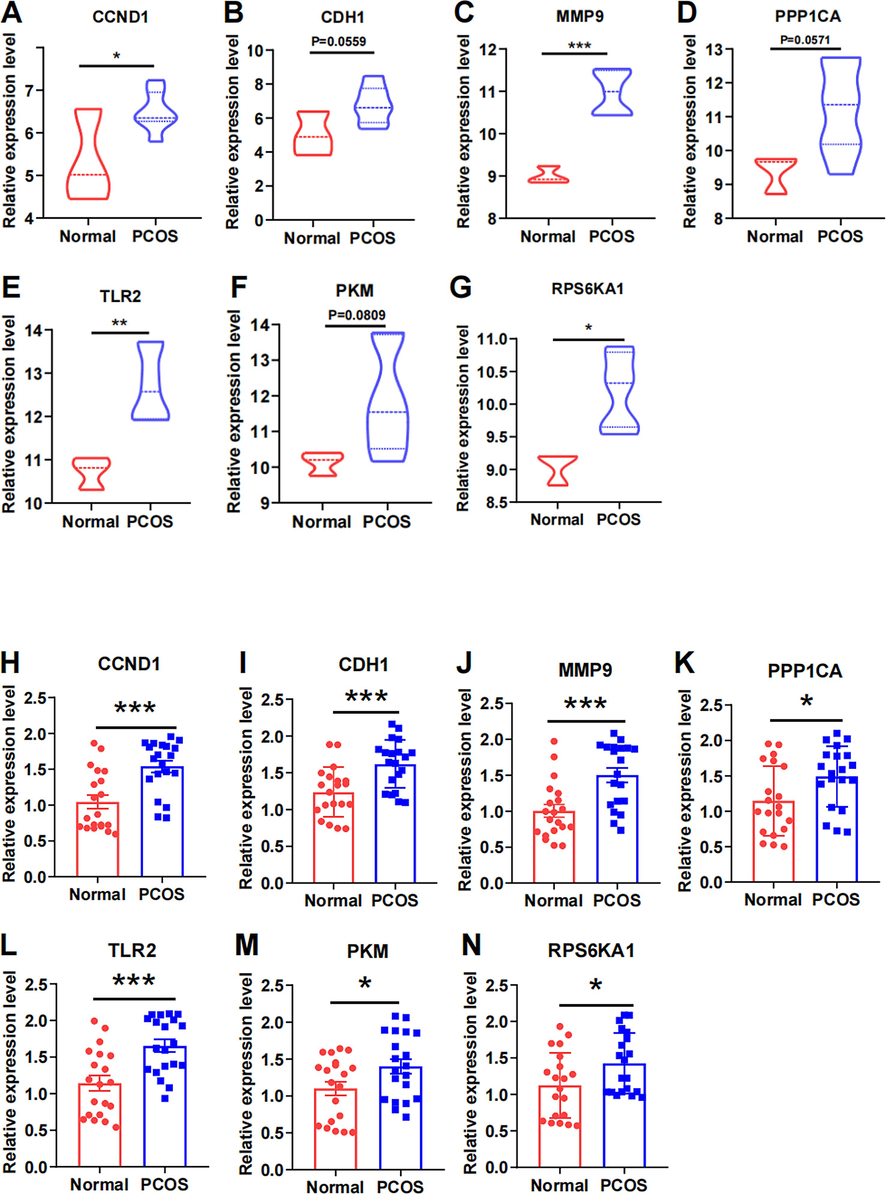
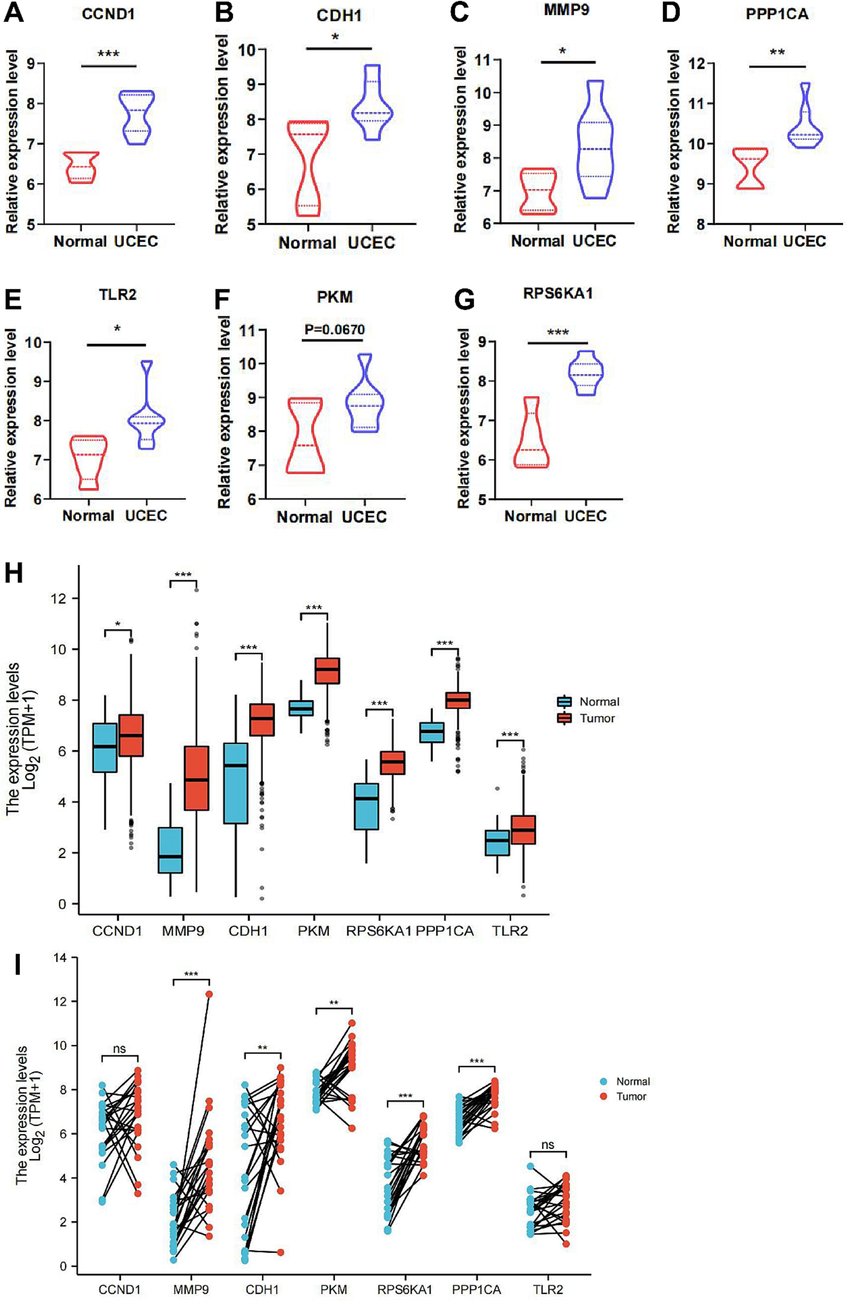
To determine the expression of hub genes in PCOS and UCEC samples, we evaluated their expression in both training and validation samples. The expression of the seven hub genes in the PCOS dataset GSE34526 was significantly higher in PCOS granulosa cells than in controls (Fig. 4A-4G). Consistent results were observed in the clinical samples (Fig. 4H-4 N) and validation datasets (Supplementary Fig. 1, Fig. S1). In UCEC, the expression of hub genes was analyzed in the GSE63678 dataset (Fig. 5A-5G) and validated with the TCGA database (Fig. 5H and 5I) and GSE36389 (Fig. S2), all showing significantly higher expression in UCEC than in the controls. Immunohistochemical analyses of the hub genes in the HPA database further confirmed significantly higher protein expression in the UCEC samples (Fig. 6). Moreover, most hub genes displayed elevated expression in endometrial samples from PCOS patients (Fig. S3), consistent with bioinformatics analysis.
-
Expression levels of hub genes in the PCOS database and clinical samplesA-G. Expression levels of hub genes in PCOS database GSE34526 H-N. Expression levels of hub genes in PCOS patients and normal individuals' granulosa cells *p < 0.05, **p < 0.01, ***p < 0.001, **** p < 0.0001.
-
Expression levels of hub genes in GSE63678 and TCGA database A-G. Expression levels of hub genes in the UCEC dataset of GSE63678 H-N. Expression levels of hub genes in the TCGA database *p < 0.05, **p < 0.01, ***p < 0.001, **** p < 0.0001.
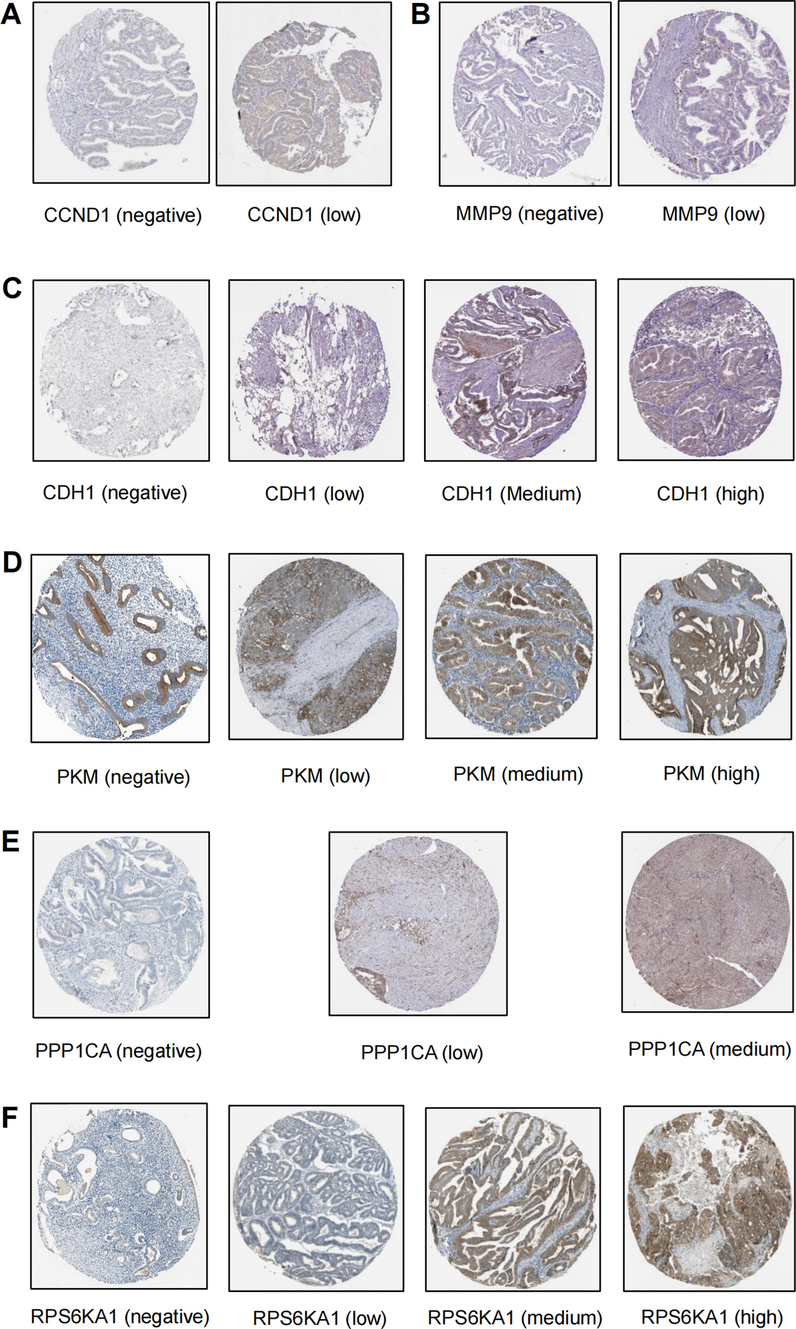
- Immunohistochemistry in the HPA database showed protein expression of the hub genes in normal tissues and UCEC.
3.5 Correlation between hub genes and androgen
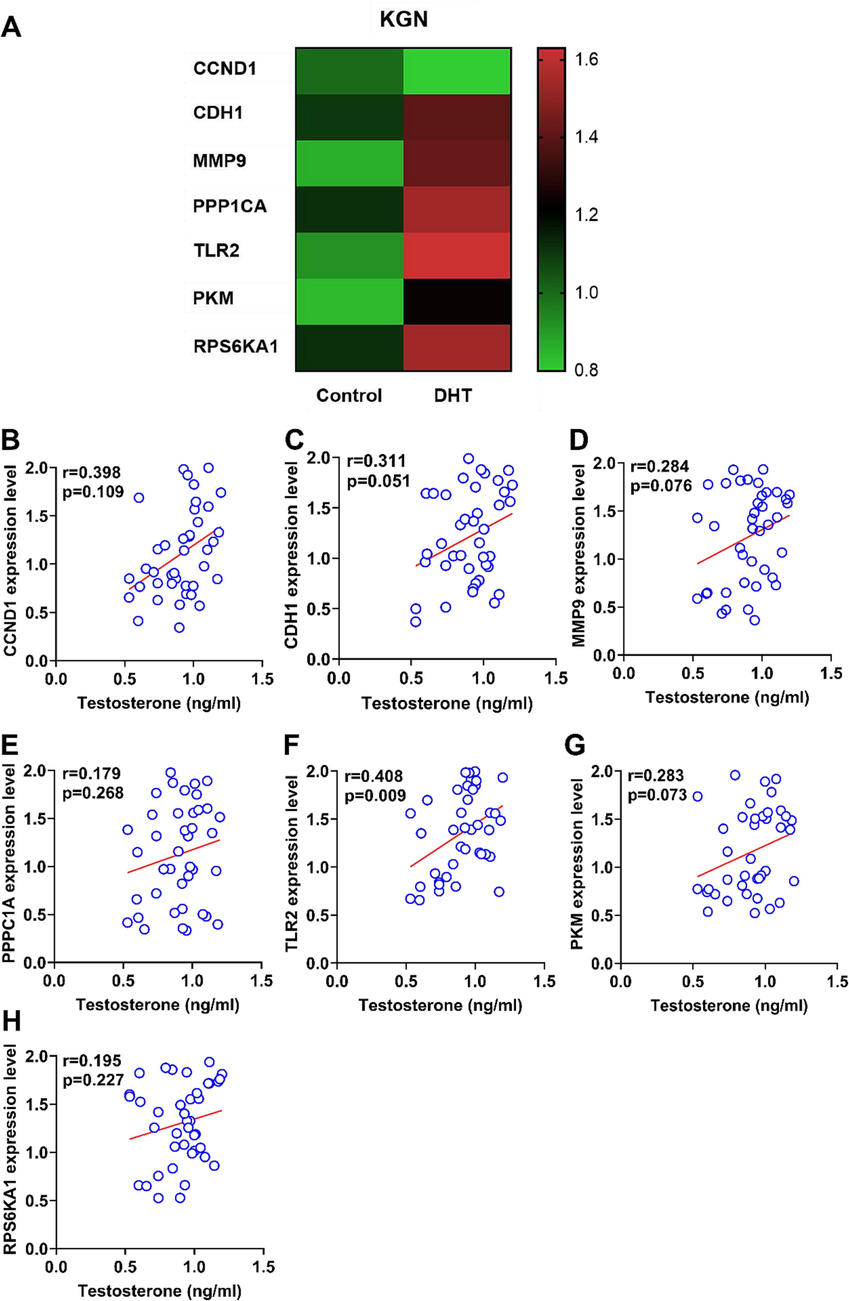
To explore the relationship between hub genes and androgen, we treated KGN cells with DHT in vitro to assess the expression levels of the hub genes. As shown in Fig. 7, the gene expression heat map indicated that most hub genes were significantly upregulated by DHT treatment. Additionally, correlation analyses between serum testosterone levels and hub gene expression in granulosa cells of PCOS patients showed a positive correlation, especially for TLR2 (Fig. 7).
-
Correlation analysis between hub genes and androgens A. A heat map exhibited the expression levels of hub genes with DHT treatment on KGN cells. B-H. Correlation analysis between the expression levels of hub genes and testosterone levels in PCOS patients *p < 0.05, **p < 0.01, ***p < 0.001, **** p < 0.0001.
3.6 Immune microenvironment analysis of hub genes
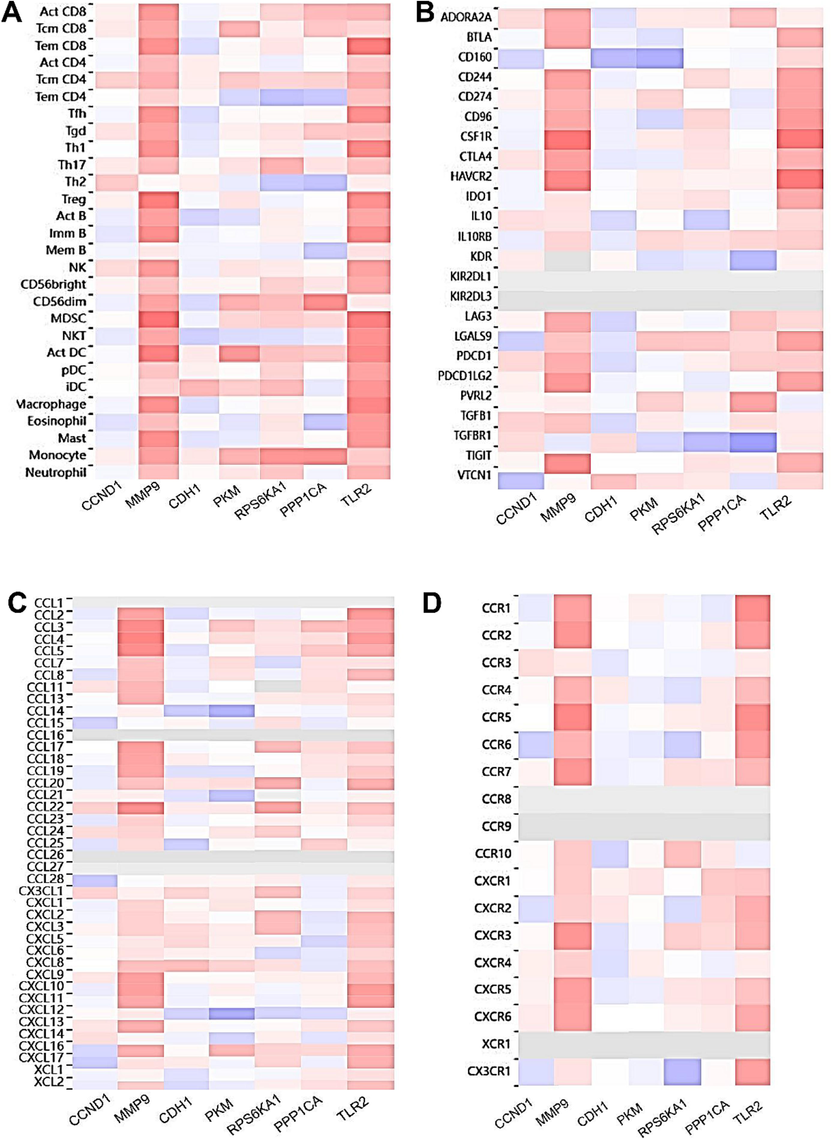
We examined the correlation between immune cell infiltration (Fig. 8A), immune checkpoints (Fig. 8B), chemokines (Fig. 8C), and receptors (Fig. 8D) with the hub genes CCND1, CDH1, PKM, MMP9, RPS6KA1, PPP1CA, and TLR2 using the TISIDB online tool. Strong correlations were observed, particularly for MMP9 and TLR2, associated with multiple immune cells, immune checkpoints, and chemokines and receptors. Other hub genes such as PKM, RPS6KA1, and PPP1CA also exhibited some degree of association with the immune microenvironment.
-
Immune microenvironment analysis A. Correlation between hub gene expression and 28 immune cells B. Correlation between hub gene expression and 24 immune checkpoints C. Correlation between hub gene expression and chemokines D. Correlation between hub gene expression and chemokine receptors.
3.7 Subtype and clinical features analysis
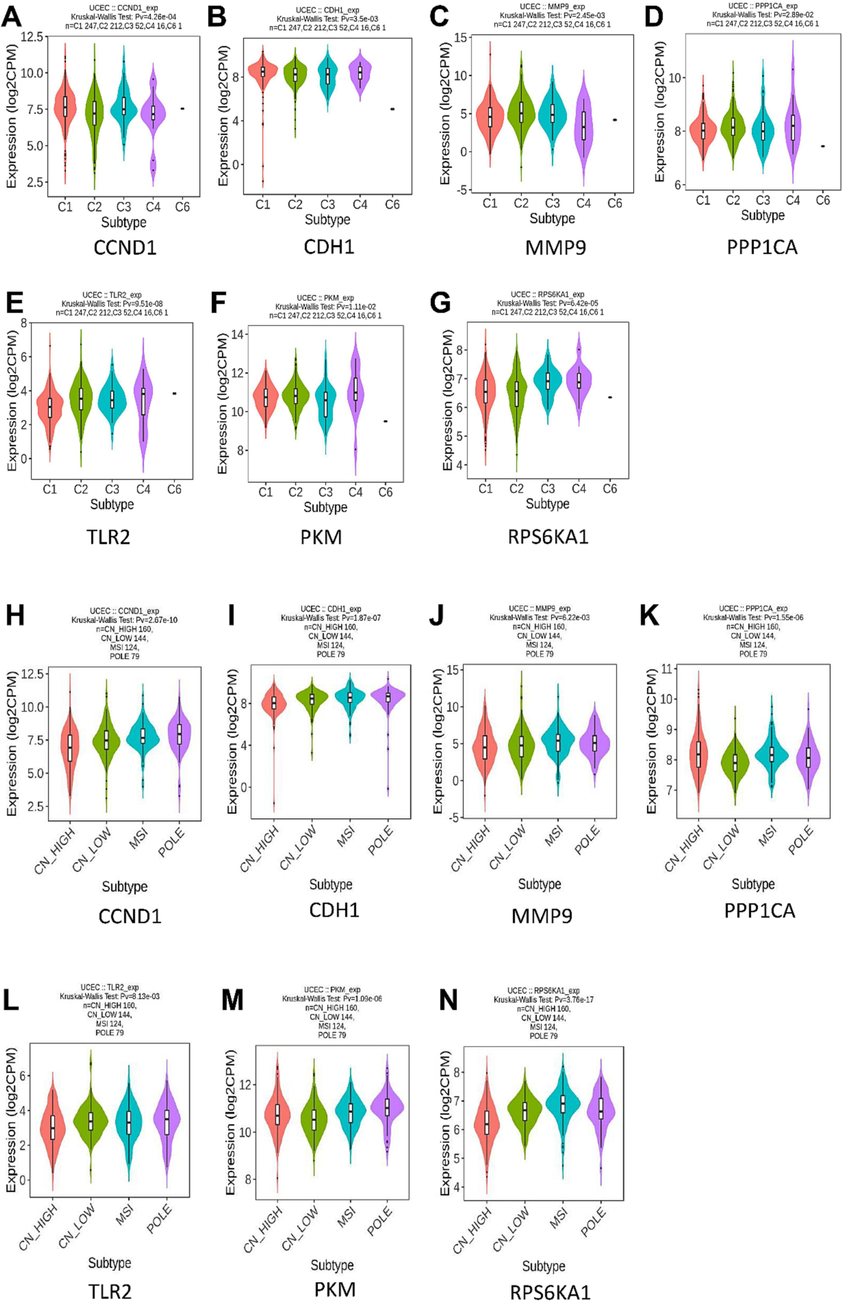
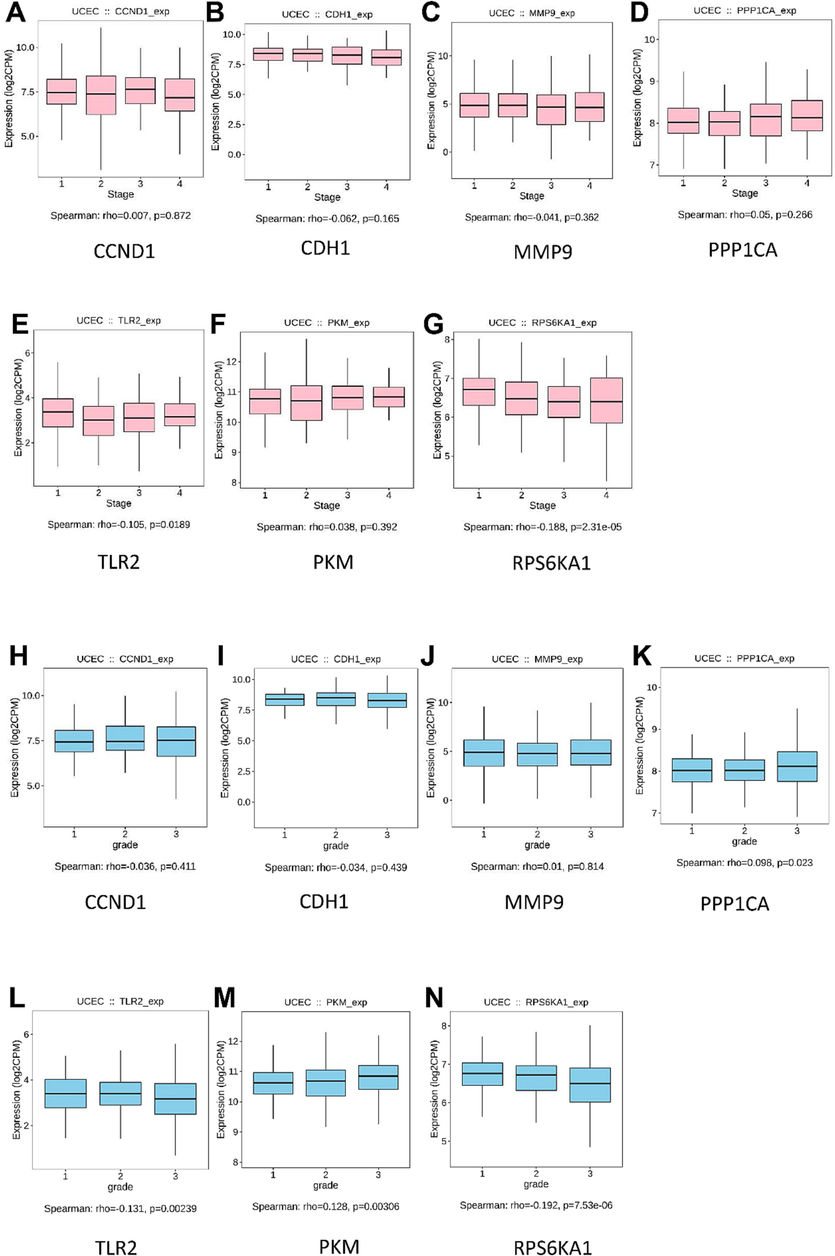
We analyzed the subtypes (Fig. 9) and clinical features (Fig. 10) of the hub genes in UCEC. The immune subtypes included C1 (wound healing), C2 (IFN-gamma dominant), C3 (inflammatory), C4 (lymphocyte depleted), C5 (immunologically quiet), and C6 (TGF-β dominant). The molecular subtypes included low copy number abnormalities (CN-L), high copy number abnormalities (CN-H), microsatellite instability (MSI), and POLE mutant (POLE). TLR2, PKM, and RPS6KA1 were highly expressed in immune subtype C6 and molecular subtype POLE (Fig. 9). At the same time, PPP1CA was highly expressed in advanced pathological stages of UCEC, such as Stage 4 and Grade 4 (Fig. 10D & 10 K).
-
Expression levels of hub genes in immune subtypes and molecular subtypes. A-G. Expression levels of hub genes in immune subtypes H-N. Expression levels of hub genes in molecular subtypes.
-
Expression levels of hub genes in different pathological Stages and Grades of UCEC A-G. Expression levels of hub genes in different pathological Stages of UCEC H-N. Expression levels of hub genes in different pathological Grades of UCEC.
3.8 Receiver operating characteristic (ROC) curve analysis
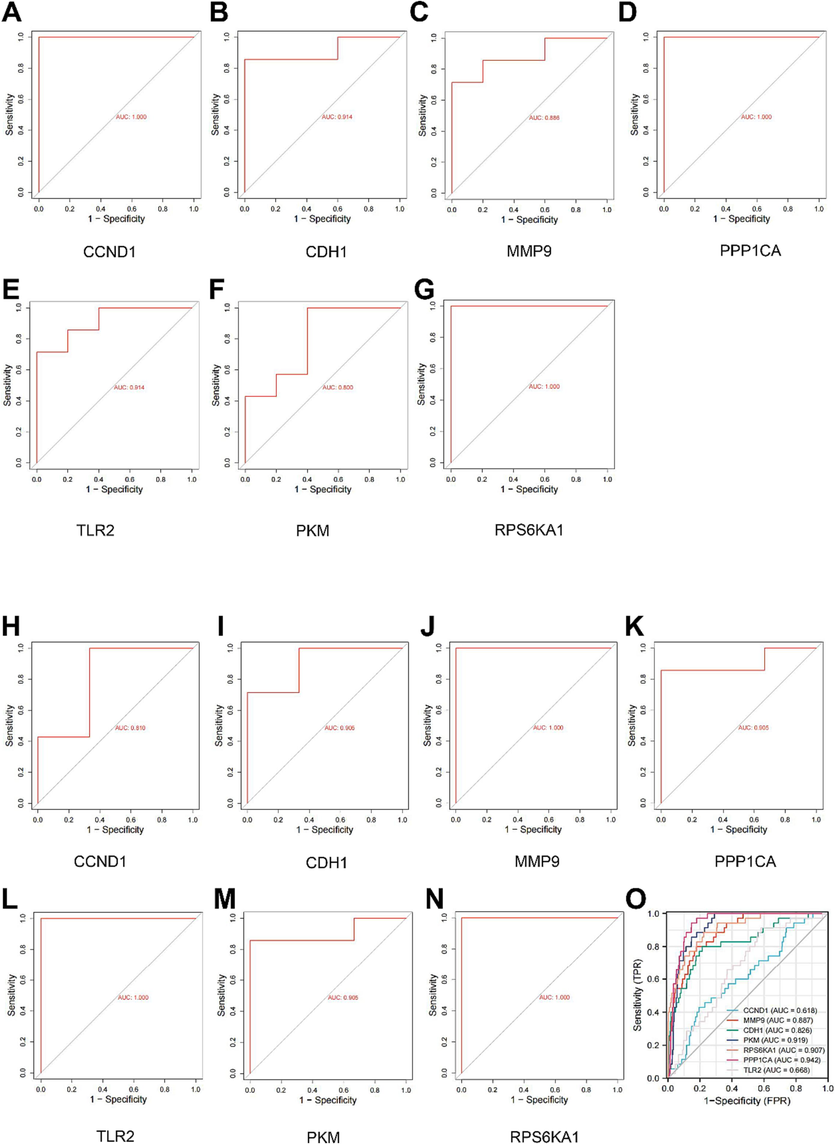
To evaluate the diagnostic utility of the 7 hub genes in PCOS and UCEC, we employed ROC curve analysis on the GSE34526 and GSE63678 datasets. The genes CCND1, CDH1, PKM, MMP9, RPS6KA1, PPP1CA, and TLR2 demonstrated promising diagnostic values, as indicated by the ROC curves (Fig. 11A-11 N). Using the TCGA database, we also confirmed the significant diagnostic efficacy of these genes in UCEC (Fig. 11O).
-
Receiver operator characteristic curve (ROC) diagnostic curve of hub genes A-G. ROC diagnostic curve of hub genes in PCOS dataset GSE34526 H-N. ROC diagnostic curve of hub genes in UCEC dataset GSE63678 O. ROC diagnostic curve of hub genes in TCGA database.
3.9 Interaction analysis of hub genes with transcription factor (TF), miRNAs, and drugs
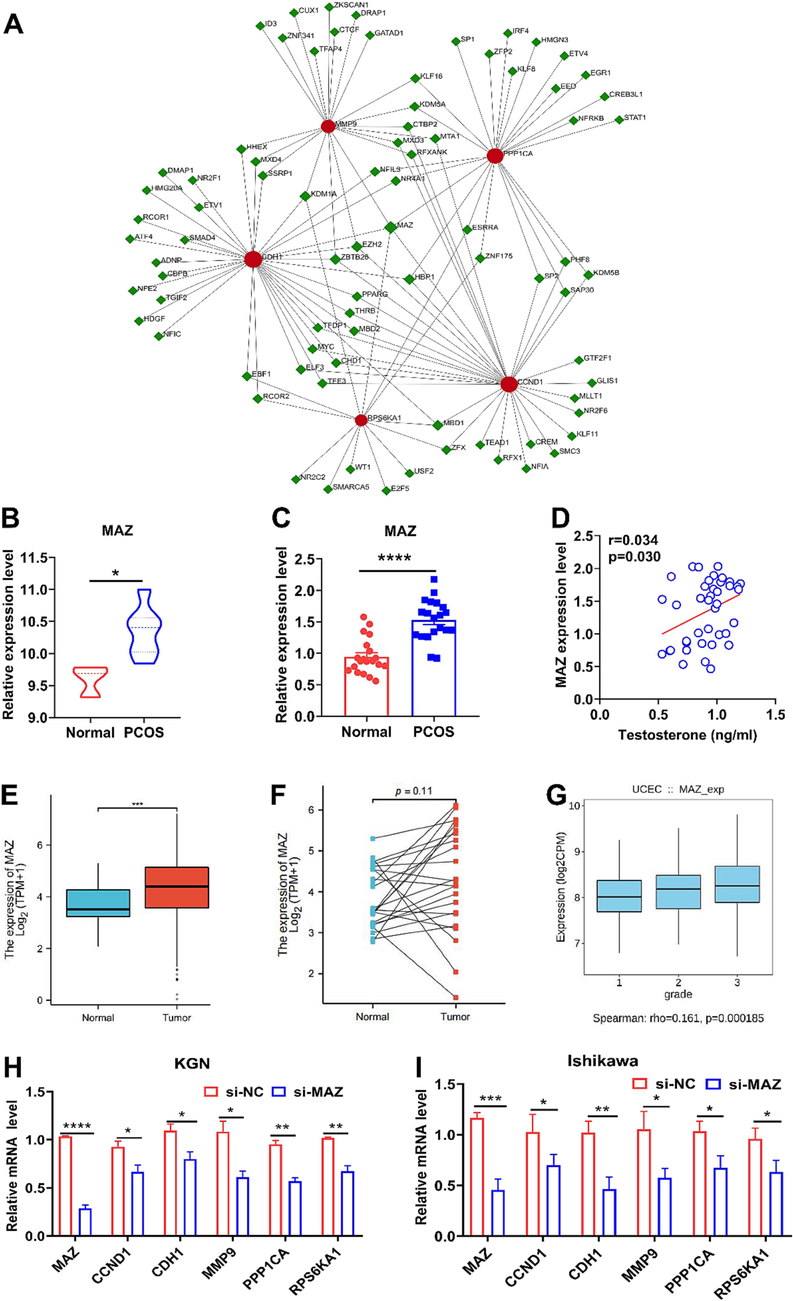
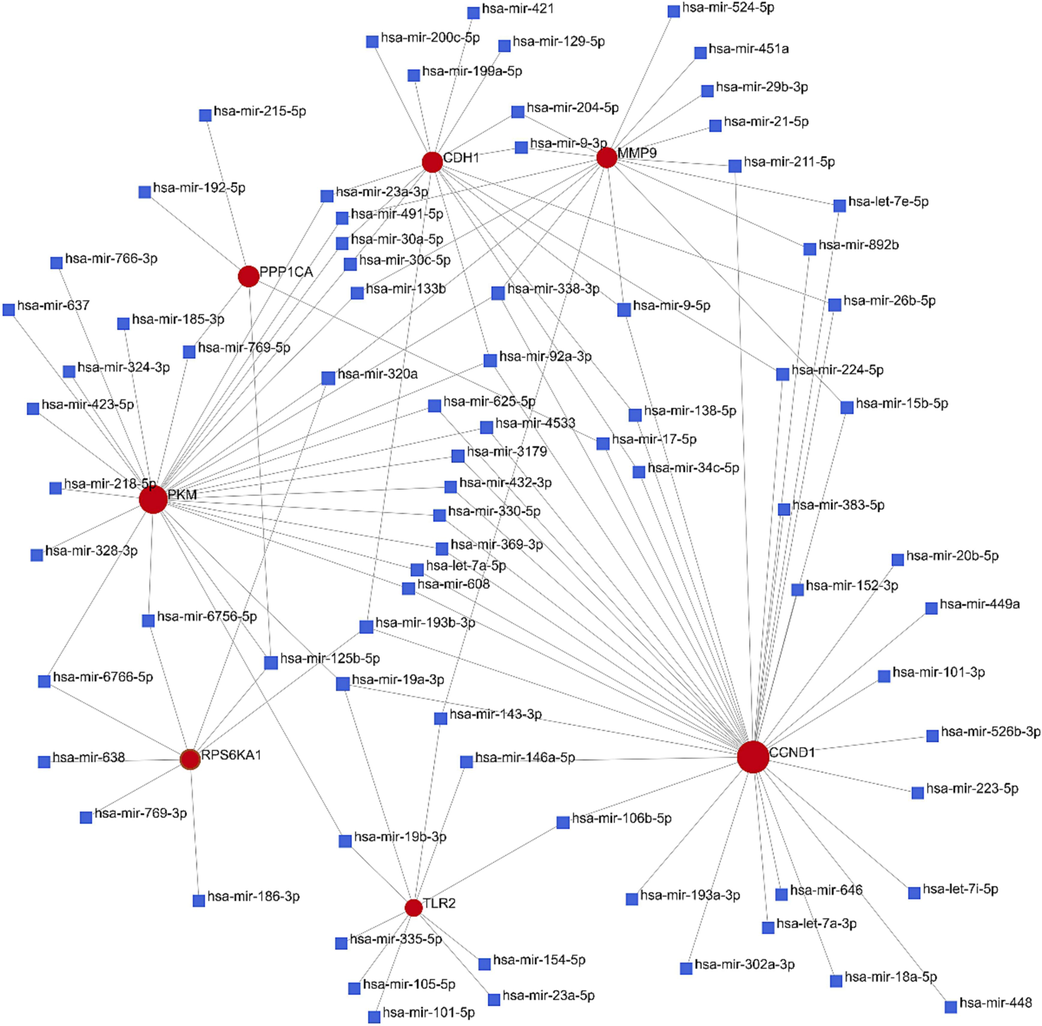
Using the JASPER database, we mapped the interaction network between the identified hub genes and TFs (Fig. 12A). Five hub genes shared a common TF: MAZ. Subsequent evaluation of MAZ expression in primary granulosa cells of PCOS (Fig. 12B and 12C) and UCEC patients (Fig. 12E-12G) revealed substantial overexpression compared to controls. Notably, MAZ expression was positively and significantly correlated with testosterone levels in PCOS (Fig. 12D). Knockdown experiments of MAZ in KGN (Fig. 12H) and Ishikawa cell lines (Fig. 12I) indicated a substantial reduction in the expression of hub genes CCND1, CDH, MMP9, PPP1CA, and RPS6KA1, suggesting that MAZ plays a pivotal role in regulating these genes. This suggests that MAZ might be a key transcription factor of the hub genes. In addition, we constructed hub gene-miRNA interaction profiles using the TarBase and miRTarBase databases (Fig. 13) and examined hub gene-drug interactions via the Drug Gene Interaction Database (DGIdb) (Table 2).
-
Hub gene-transcription factors (TFs) interaction network and experiment validation A. Hub gene-TFs interaction network analysis. The red circle and green square represented the hub genes and the TFs, respectively. A node's size was determined by its degree. B. Expression levels of the transcription factor MAZ in PCOS dataset GSE34626 C. Expression levels of the transcription factor MAZ in granulosa cells from control and PCOS patients (n = 20/each group). D. Correlation analysis between MAZ expression and testosterone levels in PCOS clinical samples (n = 40). E. Expression levels of MAZ in unpaired controls and UCEC patients. F. Expression levels of MAZ in paired controls and UCEC patients. G. Expression levels of MAZ in different pathological Grades of UCEC. H. The expression of core genes CCND1, CDH1, MMP9, PPP1CA, and RPS6KA1 was detected by knocking down MAZ in KGN cells. I. The expression of core genes CCND1, CDH1, MMP9, PPP1CA, and RPS6KA1 was detected by knockdown of MAZ in Ishikawa cells. *p < 0.05, **p < 0.01, ***p < 0.001, **** p < 0.0001. (For interpretation of the references to colour in this figure legend, the reader is referred to the web version of this article.)
-
Hub gene-microRNA interaction network analysis Hub genes were depicted as red circles, while miRNAs were represented as blue squares. (For interpretation of the references to colour in this figure legend, the reader is referred to the web version of this article.)
| Gene | ID | Drug | Drug Type | Structure |
|---|---|---|---|---|
| CCND1 | DB01169 | Arsenic trioxide | Small Molecule |

|
| TLR2 | DB00045 | Lyme disease vaccine (recombinant OspA) | Biotech |


|
| DB05475 | Golotimod | Small Molecule | ||
| DB03963 | S-(Dimethylarsenic) Cysteine | Small Molecule | ||
| PPP1CA | DB02506 | 2,6,8-Trimethyl-3-Amino-9-Benzyl-9-Methoxynonanoic Acid | Small Molecule |

|
| RPS6KA1 | DB04751 | Purvalanol A | Small Molecule |

|
4 Discussion
PCOS is characterized by clinical features such as obesity, insulin resistance, unopposed endometrial estrogen stimulation, diabetes mellitus, and progesterone resistance, which have been implicated as risk factors for UCEC (Chen et al., 2021). Nonetheless, the exact molecular mechanisms predisposing PCOS patients to UCEC remain to be fully elucidated. This study conducted a bioinformatic analysis of gene microarray databases from PCOS granulosa cells and UCEC tissue, identifying seven signature genes (CCND1, CDH1, MMP9, PPP1CA, TLR2, PKM, and RPS6KA1) with potential diagnostic relevance for these comorbid conditions.
Enrichment analyses (GO, KEGG, GSEA) suggested that PCOS and UCEC pathogenesis are predominantly associated with hormonal imbalance and inflammatory response. Hyperandrogenemia (HA)—a hallmark of PCOS—involves increased levels of testosterone, free testosterone, and adrenal androgens such as dehydroepiandrosterone (DHEA) and its sulfate (DHEA-S). Compelling evidence linked androgens with endometrial hyperplasia, oncogenesis, and infertility (Wu et al., 2023). Several investigations have probed the association between androgen levels and endometrial cancer risk, identifying DHEA-S and androstenedione as potential risk factors (Michels et al., 2019). Elevated testosterone levels before menopause correlated with a higher incidence of UCEC post-menopause (Clendenen et al., 2016). Recent Mendelian randomization studies implicated free testosterone in the progression of both endometrioid and non-endometrioid endometrial tumors, illustrating the long-term effects of androgen exposure related to UCEC (Ruth et al., 2020, Mullee et al., 2021). Mechanistically, androgens facilitated UCEC pathogenesis via androgen receptor interaction with FOXA1, which activated the Notch signaling pathway, encouraging endometrial hyperplasia (Qiu et al., 2014). Metastatic UCEC lesions exhibited elevated AR/ERα ratios and gene expression profiles that favored cell cycle progression, resulting in aggressive tumor growth and decreased patient survival (Tangen et al., 2016). Testosterone, converted to estradiol by aromatase, supplies estrogen to endometrial tumors (Kahn et al., 2019). The hormones also promoted fat synthesis, with adipose tissue subsequently becoming an additional source of estrogen and other steroid hormones, further promoting the development of endometrial cancer (Carbone et al., 2019).
Moreover, adipose tissue, influenced by hormonal stimuli, is a secondary estrogen source exacerbating endometrial carcinogenesis (Danforth et al., 2010, O'Mara et al., 2018). High BMI was also linked with increased systemic androgen levels, further elevating UCEC risk, particularly in PCOS patients who commonly exhibited obesity and a raised BMI (Yin et al., 2019). Thus, obesity and high androgen levels in PCOS patients may be key risk factors for susceptibility to UCEC.
Inflammation was a key contributor to the development of PCOS (Rudnicka et al., 2021). Chronic low-grade inflammation in PCOS could lead to insulin resistance (IR), obesity, and hyperandrogenemia, which in turn results in ovulation disorders. PCOS patients often show elevated inflammatory factor levels in the serum, particularly those with IR, suggesting that IR may exacerbate the inflammatory response in PCOS. Elevated levels of inflammatory factors led to increased production of reactive oxygen species (ROS), which promoted nitric oxide production in pancreatic β-cells and accelerated β-cell apoptosis. Furthermore, elevated ROS levels hindered insulin signaling and insulin-mediated glucose transport (Barrea et al., 2018). Hyperinsulinemia in PCOS reduces the synthesis of sex hormone-binding globulin (SHBG) and raises the level of free testosterone in the blood (Goodarzi et al., 2011). Notably, testosterone activated the inflammatory signaling pathway molecule NF-κB and promoted the polarization of macrophages to the M1 type, producing pro-inflammatory factors (Su et al., 2016). These findings suggest that chronic inflammation and HA in PCOS patients may mutually cause and reinforce each other. Moreover, approximately 30 %-60 % of patients with PCOS suffer from obesity, which leads to the secretion of various adipokines by adipose tissue, such as adiponectin, TNF-α, and MCP-1, activating the NF-kB system and promoting inflammatory responses. This affected glucolipid metabolism and promoted the development of IR (Xu et al., 2022).
The development and progression of UCEC were also closely linked to inflammation (Borghi et al., 2018). Patients with UCEC had higher levels of various inflammatory factors in their serum than normal subjects (Wang et al., 2023a, 2023b). Various inflammatory mediators in the tumor microenvironment were conducive to tumor proliferation, migration, and angiogenesis, as well as inhibiting apoptosis of tumor cells through inflammatory signaling pathways. Additionally, UCEC exhibited various inflammatory features, contributing to the proliferation and metastasis of UCEC (Romanos-Nanclares et al., 2023). Therefore, inhibiting inflammatory pathways may be a potential intervention for the treatment of UCEC.
Immune cell infiltration was critically important for the development of UCEC (Lopez-Janeiro et al., 2022). Studies have revealed a significant increase in macrophage, T lymphocyte, and B lymphocyte infiltration in UCEC tissues compared to normal tissues (Zhou et al., 2021). Specifically, macrophage infiltration has been linked to UCEC prognosis and angiogenesis (Espinosa et al., 2010). T cells, B cells, and NK cells could be activated by stimulating inflammatory factors in the tumor microenvironment, exerting anti-tumor effects (Liu et al., 2021). Factors such as VEGF, NF-κB, and COX-2 were activated following immune dysfunction, contributing to the development of tumor angiogenesis, immunosuppression, and drug tolerance.
In the immune cell infiltration analysis, we found a significant positive correlation between TLR2, MMP9, and several immune cells, particularly with myeloid-derived suppressor cells (MDSCs). MDSCs, derived from common myeloid progenitor cells, can inhibit the normal functions of immune cells and induce Treg expansion, promoting their negative regulatory role in immunity (Gupta et al., 2021). They can also inhibit T cell proliferation and induce immune cells to remain unresponsive or tolerant, consequently impacting precancerous cells' clearance or tumor cells (Talmadge and Gabrilovich, 2013). The study revealed a significant positive correlation between TLR2 and MMP9 and MDSCs and Treg cells, indicating their potential influence on immune response and tolerance in UCEC and their role in promoting UCEC by regulating these cells. TLR2 activation on MDSCs has been shown to upregulate the expression of indoleamine 2,3-dioxygenase (IDO), a key enzyme involved in immune tolerance and suppression, which emphasizes the impact of TLR2 signaling on the immunosuppressive functions of MDSCs (Kaminski et al., 2023).
Additionally, TLR2-deficient mice exhibit reduced accumulation and immunosuppressive activity of MDSCs in models of chronic inflammation and cancer, underscoring the critical role of TLR2 in regulating MDSC function (Li et al., 2015). Similarly, MMP9 could affect the recruitment and immunosuppressive functions of MDSCs in the tumor microenvironment (Wu et al., 2016, Shao et al., 2017). These findings provided robust evidence supporting the notion that TLR2 and MMP9 signaling influences the suppressive activities of MDSCs, thus warranting further investigation into its potential as a therapeutic target for immunomodulation. Besides, elevated levels of MDSCs have been observed in the peripheral blood and ovarian tissue of PCOS patients, suggesting their potential role in the immunosuppressive milieu associated with PCOS (Zhu et al., 2021). Further investigations into the roles of TLR2 and MMP9 and their effects on MDSCs in PCOS are necessary to develop targeted immunotherapeutic strategies for this prevalent endocrine disorder.
The Chemokine ligand (CCL) and Chemokine receptor (CCR) play a pivotal role in the pathophysiology of PCOS and UCEC. In PCOS, dysregulation of CCR and CCL signaling has been associated with the aberrant recruitment and activation of immune cells within the ovarian microenvironment, contributing to chronic low-grade inflammation and disturbances in follicular development characteristic of the disorder (Demi et al., 2019). In UCEC, the dysregulation of CCR and CCL signaling has been implicated in tumor invasion, metastasis, and angiogenesis, underscoring their significance in the progression of endometrial cancer (Xue et al., 2023). The present study demonstrated a strong correlation between TLR2 and several chemokines, particularly CCL2 and CCL4. Overexpression of TLR2 was associated with elevated levels of pro-inflammatory cytokines, such as TNF-α and IL-6, which induced insulin resistance, a common feature of PCOS. The intricate interaction between TLR2 and chemokines is a complex regulatory mechanism that can enhance inflammatory signaling and the recruitment of cells to sites of inflammation or tumors. For instance, TLR2 activation upregulated CCL2 production and promoted macrophage infiltration (Wang et al., 2019). This process may contribute to a protumorigenic environment in UCEC and exacerbate ovarian dysfunction in PCOS. The role of TLR2 in these conditions is part of a broader inflammatory response involving chemokines and their receptors. Future research should strive to discern the precise mechanisms by which TLR2 influences chemokine signaling pathways in PCOS and UCEC.
With MCODE and Cytohubba's seven algorithms, we screened seven hub genes: PKM, RPS6KA1, PPP1CA, TLR2, CCND1, MMP9, and CDH1. Pyruvate kinase M (PKM) is a key rate-limiting enzyme that regulates the cellular glycolytic pathway. The PKM1 isoform is predominantly expressed in tissues with high energy demands, such as skeletal muscle and brain tissue, while PKM2 is expressed in embryonic tissues, proliferating cells, and cancer cells (Zhang et al., 2019). PKM2 exists in both an active tetrameric form and a less active dimeric form, and the interconversion between these forms regulates the balance between oxidative phosphorylation and glycolysis, thereby preventing cellular dysregulation. In oxygen-sufficient cancer cells, the low activity of PKM2 expression led to an elevation in glycolytic intermediates, promoting the synthesis of macromolecules, which supported tumor growth and invasion (Zahra et al., 2020). In UCEC, PKM2 functioned as a transcriptional coactivator of ERα and was involved in estradiol-induced proliferation, shifting glucose metabolism toward aerobic glycolysis (Salama et al., 2014).
Additionally, PKM2 expression in ovarian tissues of PCOS rats was restored after treatment with Diane-35 plus metformin. It was highly expressed in both mRNA and protein in UCEC, making it a potentially effective diagnostic marker. These findings suggested that PKM2 plays a crucial role in follicular energy metabolism through glycolysis, with further investigation needed to elucidate the exact mechanism.
RPS6KA1 encoded a member of the RSK (ribosomal S6 kinase) family of serine/threonine kinases associated with cell growth and differentiation (Weidenauer et al., 2023). A cohort study demonstrated high expression of RPS6KA1 in the follicular fluid of obese PCOS patients, suggesting a potential association with impaired follicular development and oocyte maturation in this population (Chehin et al., 2020). Furthermore, RPS6KA1 was significantly associated with an increased risk of breast cancer and smoking-induced lung adenocarcinoma (Chen et al., 2020, Shareefi et al., 2020). While few studies have been conducted on RPS6KA1 in UCEC, our study found a high expression of RPS6KA1 in UCEC, suggesting its potential involvement in the pathogenic process. However, its function requires further exploration.
We identified five hub genes, MMP9, CDH1, CCND1, RPS6KA1, and PPP1CA, that shared a common transcription factor, MAZ, known as MYC-associated zinc finger protein. MAZ exhibited DNA-binding transcription factor activity, RNA polymerase II-specific, and RNA polymerase II cis-regulatory region sequence-specific DNA-binding activity. MAZ was considered one of the hub genes upregulated in UCEC (Yang et al., 2020). Our analysis revealed that MAZ was upregulated in UCEC, and it was found to interact with CDH1 to potentially promote acute pancreatitis, indicating a potential role in inflammatory responses in PCOS and UCEC (Zhong et al., 2022). MAZ was also upregulated in most tumors, including ACC, BLCA, KIRP, LIHC, PRAD, SKCM, and UCEC, and was associated with a high-risk prognosis (Wang et al., 2023a, 2023b). Furthermore, MAZ expression was positively correlated with immune checkpoint genes and immune-related signaling pathways (Wang et al., 2023a, 2023b). Our study also indicated a significant correlation between the expression of the five hub genes, especially MMP9 and TLR2, with immune cells, suggesting MAZ's potential involvement in regulating the immune microenvironment and impacting the development of PCOS and UCEC. Developing inhibitors of MAZ might be an effective approach to cure the comorbidity.
Our analysis identified hub gene-shared miRNAs, including has-miR-193b-3p and has-miR-9-5p, which may be associated with the development of PCOS and UCEC. Multiple linear regression analysis showed that miR-193b could be an independent indicator to assess insulin resistance in PCOS patients (Jiang et al., 2016). The combination of miR-193b and BMI had a potential diagnostic value for PCOS. Another study showed that miR-193b was a common DEG in endometrial and ovarian cancers (Ke et al., 2022). In the present study, miR-193b could target CDH1, CCND1, and RPS6KA1, suggesting that miR-193b might affect the comorbidity of PCOS and UCEC by targeting the three genes.
Additionally, miR-9 could be a prognostic factor for UCEC according to histological type and grade, tumor size, lymph node involvement, and survival (Bloomfield et al., 2022). MiR-9 also targeted VDR to affect proliferation and apoptosis of ovarian granulosa cells and could be a potential target to improve PCOS ovarian dysfunction (Kong et al., 2019). Here, we identified that miR-96 and miR-27a may target CCND1. Our previous study showed that miR-27a promoted apoptosis of granulosa cells by targeting SMAD5, while miR-96 targeted FOXO1 to regulate estradiol synthesis and granulosa cell proliferation. miR-27a-3p and miR-96 could be potential diagnostic markers for PCOS (Wang et al., 2018, Liu et al., 2023). This suggested a possible role in regulating the cell cycle. Our findings established a hub gene-miRNA network that provided new insights into the pathogenesis of PCOS and UCEC.
Notably, our study shed new light on certain aspects of the shared pathogenesis of PCOS and UCEC and suggested potential regulatory molecules and drug targets. However, future validation of these findings will require recruiting patients with PCOS and UCEC. Furthermore, additional in vivo and in vitro studies are necessary to confirm the hypothesized mechanisms and identify pharmacological targets for developing potential therapeutic drugs for comorbidity.
5 Conclusion
This study investigated the shared pathogenic processes between PCOS and UCEC using an integrated bioinformatics approach and experiments. We identified 7 common hub genes, CCND1, CDH1, MMP9, PPP1CA, TLR2, PKM, and RPS6KA1, which exhibited superior diagnostic performance for PCOS and UCEC. Analysis of the immune microenvironment revealed positive correlations between MMP9 and TLR2 with immune cells and checkpoints, suggesting a potential inflammatory link between PCOS and susceptibility to UCEC. Furthermore, we discovered the key transcription factor MAZ as a regulator of hub gene expression in PCOS and UCEC. This study provides innovative insights for further mechanistic research and drug discovery for this comorbidity.
6 Fundings
This research was supported financially by the Natural Science Research of the Jiangsu Higher Education Institutions of China (Grant no. KY13022201), the Outstanding Talent Research Funding of Xuzhou Medical University (Grant no. RC20552029), the National Natural Science Foundation of China (Grant no. 81971347), and the National Natural Science Foundation of China (Grant no. 82101307), the Natural Science Foundation of Jiangsu Province (Grant No. BK20210904) and the Jiangsu Province Shuangchuang Doctoral Award (Grant No. JSSCBS20211249).
Ethical approval
The clinical samples were from the previous collection and described in a previous publication (Zhang et al., 2022). The research followed the Declaration of Helsinki principles and was approved by the local Human Investigation Ethics Committee (license numbers APK.002.9.2020 and APK.002.38.2021). Written informed consent was obtained from all patients before inclusion.
Data availability
All data are derived from publicly available sources, and all links to the data are provided in the materials and methods.
Author contributions
All authors contributed to the study's conception and design. Mingming Wang and Huanhuan Ding performed data analysis, qPCR testing, and manuscript writing. Kangyang Diao and Lefan Dai performed material preparation and data collection. Richard Mprah and Tao Hu performed manuscript revising. All authors commented on previous versions and approved the final manuscript.
Acknowledgments
We thank the depositors of the GSE34526, GSE63678, GSE137684, GSE84958, GSE48301, GSE36389, and TCGA datasets for their contribution.
Declaration of competing interest
The authors declare that they have no known competing financial interests or personal relationships that could have appeared to influence the work reported in this paper.
References
- Source and amount of carbohydrate in the diet and inflammation in women with polycystic ovary syndrome. Nutr. Res. Rev.. 2018;31:291-301.
- [CrossRef] [Google Scholar]
- Risk of endometrial, ovarian and breast cancer in women with polycystic ovary syndrome: a systematic review and meta-analysis. Hum. Reprod. Update. 2014;20:748-758.
- [CrossRef] [Google Scholar]
- Clinical Value and Molecular Function of Circulating MicroRNAs in Endometrial Cancer Regulation: A Systematic Review. Cells.. 2022;11
- [CrossRef] [Google Scholar]
- Biomolecular basis related to inflammation in the pathogenesis of endometrial cancer. Eur. Rev. Med. Pharmacol. Sci.. 2018;22:6294-6299.
- [CrossRef] [Google Scholar]
- Synergistic Effects of Hyperandrogenemia and Obesogenic Western-style Diet on Transcription and DNA Methylation in Visceral Adipose Tissue of Nonhuman Primates. Sci. Rep.. 2019;9:19232.
- [CrossRef] [Google Scholar]
- The insulin signaling pathway is dysregulated in cumulus cells from obese, infertile women with polycystic ovarian syndrome with an absence of clinical insulin resistance. Ther. Adv. Reprod. Health.. 2020;14:2633494120906866
- [CrossRef] [Google Scholar]
- From tobacco smoking to cancer mutational signature: a mediation analysis strategy to explore the role of epigenetic changes. BMC Cancer. 2020;20:880.
- [CrossRef] [Google Scholar]
- The Genetic Association of Polycystic Ovary Syndrome and the Risk of Endometrial Cancer: A Mendelian Randomization Study. Front Endocrinol (lausanne).. 2021;12:756137
- [CrossRef] [Google Scholar]
- Premenopausal Circulating Androgens and Risk of Endometrial Cancer: results of a Prospective Study. Horm Cancer.. 2016;7:178-187.
- [CrossRef] [Google Scholar]
- The association of plasma androgen levels with breast, ovarian and endometrial cancer risk factors among postmenopausal women. Int. J. Cancer. 2010;126:199-207.
- [CrossRef] [Google Scholar]
- Deconstructing a Syndrome: Genomic Insights Into PCOS Causal Mechanisms and Classification. Endocr. Rev.. 2022;43:927-965.
- [CrossRef] [Google Scholar]
- Fractalkine: an inflammatory chemokine elevated in subjects with polycystic ovary syndrome. Endocrine. 2019;65:175-183.
- [CrossRef] [Google Scholar]
- Myometrial invasion and lymph node metastasis in endometrioid carcinomas: tumor-associated macrophages, microvessel density, and HIF1A have a crucial role. Am. J. Surg. Pathol.. 2010;34:1708-1714.
- [CrossRef] [Google Scholar]
- JASPAR 2020: update of the open-access database of transcription factor binding profiles. Nucleic Acids Res.. 2020;48:D87-D92.
- [CrossRef] [Google Scholar]
- Polycystic ovary syndrome: etiology, pathogenesis and diagnosis. Nat. Rev. Endocrinol.. 2011;7:219-231.
- [CrossRef] [Google Scholar]
- Atovaquone Suppresses Triple-Negative Breast Tumor Growth by Reducing Immune-Suppressive Cells. Int. J. Mol. Sci.. 2021;22
- [CrossRef] [Google Scholar]
- Adolescent PCOS: a postpubertal central obesity syndrome. Trends Mol. Med.. 2023;29:354-363.
- [CrossRef] [Google Scholar]
- Identification of several circulating microRNAs from a genome-wide circulating microRNA expression profile as potential biomarkers for impaired glucose metabolism in polycystic ovarian syndrome. Endocrine. 2016;53:280-290.
- [CrossRef] [Google Scholar]
- Polycystic Ovary Syndrome. Lancet Diabetes Endocrinol.. 2022;10:668-680.
- [CrossRef]
- Altered adipose tissue and adipocyte function in the pathogenesis of metabolic syndrome. J. Clin. Invest.. 2019;129:3990-4000.
- [CrossRef] [Google Scholar]
- The immunosuppressive activity of myeloid-derived suppressor cells in murine Paracoccidioidomycosis relies on Indoleamine 2,3-dioxygenase activity and Dectin-1 and TLRs signaling. Sci. Rep.. 2023;13:12391.
- [CrossRef] [Google Scholar]
- Identification of core genes shared by endometrial cancer and ovarian cancer using an integrated approach. Cell. Mol. Biol. (Noisy-le-grand). 2022;68:140-145.
- [CrossRef] [Google Scholar]
- MicroRNA-9 affects isolated ovarian granulosa cells proliferation and apoptosis via targeting vitamin D receptor. Mol. Cell. Endocrinol.. 2019;486:18-24.
- [CrossRef] [Google Scholar]
- TLR2 limits development of hepatocellular carcinoma by reducing IL18-mediated immunosuppression. Cancer Res.. 2015;75:986-995.
- [CrossRef] [Google Scholar]
- Mechanism investigation and experiment validation of capsaicin on uterine corpus endometrial carcinoma. Front. Pharmacol.. 2022;13:953874
- [CrossRef] [Google Scholar]
- The landscape and prognostic value of immune characteristics in uterine corpus endometrial cancer. Biosci. Rep.. 2021;41
- [CrossRef] [Google Scholar]
- The molecular mechanism of miR-96-5p in the pathogenesis and treatment of polycystic ovary syndrome. Transl. Res.. 2023;256:1-13.
- [CrossRef] [Google Scholar]
- The association between the tumor immune microenvironments and clinical outcome in low-grade, early-stage endometrial cancer patients. J. Pathol.. 2022;258:426-436.
- [CrossRef] [Google Scholar]
- Identification of the shared gene signatures and pathways between polycystic ovary syndrome and endometrial cancer: An omics data based combined approach. PLoS One. 2022;17:e0271380.
- [Google Scholar]
- Postmenopausal Androgen Metabolism and Endometrial Cancer Risk in the Women's Health Initiative Observational Study. JNCI Cancer Spectr.. 2019;3:pkz029.
- [CrossRef] [Google Scholar]
- Testosterone, sex hormone-binding globulin, insulin-like growth factor-1 and endometrial cancer risk: observational and Mendelian randomization analyses. Br. J. Cancer. 2021;125:1308-1317.
- [CrossRef] [Google Scholar]
- Identification of nine new susceptibility loci for endometrial cancer. Nat. Commun.. 2018;9:3166.
- [CrossRef] [Google Scholar]
- FOXA1 promotes tumor cell proliferation through AR involving the Notch pathway in endometrial cancer. BMC Cancer. 2014;14:78.
- [CrossRef] [Google Scholar]
- pROC: an open-source package for R and S+ to analyze and compare ROC curves. BMC Bioinf.. 2011;12:77.
- [CrossRef] [Google Scholar]
- Inflammatory and insulinemic dietary patterns and risk of endometrial cancer among US women. J. Natl Cancer Inst.. 2023;115:311-321.
- [CrossRef] [Google Scholar]
- TISIDB: an integrated repository portal for tumor-immune system interactions. Bioinformatics. 2019;35:4200-4202.
- [CrossRef] [Google Scholar]
- Chronic Low Grade Inflammation in Pathogenesis of PCOS. Int. J. Mol. Sci.. 2021;22
- [CrossRef] [Google Scholar]
- Using human genetics to understand the disease impacts of testosterone in men and women. Nat. Med.. 2020;26:252-258.
- [CrossRef] [Google Scholar]
- Estradiol-17beta upregulates pyruvate kinase M2 expression to coactivate estrogen receptor-alpha and to integrate metabolic reprogramming with the mitogenic response in endometrial cells. J. Clin. Endocrinol. Metab.. 2014;99:3790-3799.
- [CrossRef] [Google Scholar]
- Preventing endometrial cancer risk in polycystic ovarian syndrome (PCOS) women: could metformin help? Gynecol. Oncol.. 2014;132:248-253.
- [CrossRef] [Google Scholar]
- Cytoscape: a software environment for integrated models of biomolecular interaction networks. Genome Res.. 2003;13:2498-2504.
- [CrossRef] [Google Scholar]
- MMP-9-cleaved osteopontin isoform mediates tumor immune escape by inducing expansion of myeloid-derived suppressor cells. Biochem. Biophys. Res. Commun.. 2017;493:1478-1484.
- [CrossRef] [Google Scholar]
- Pathway-Affecting Single Nucleotide Polymorphisms (SNPs) in RPS6KA1 and MBIP Genes are Associated with Breast Cancer Risk. Asian Pac. J. Cancer Prev.. 2020;21:2163-2168.
- [CrossRef] [Google Scholar]
- Effects and mechanism of testosterone on the production of inflammatory cytokines and glucose uptake in co-culture of RAW264.7 macrophage and 3T3-L1 adipocytes. Zhonghua Yi Xue Za Zhi. 2016;96:2665-2670.
- [CrossRef] [Google Scholar]
- STRING v11: protein-protein association networks with increased coverage, supporting functional discovery in genome-wide experimental datasets. Nucleic Acids Res.. 2019;47:D607-D613.
- [CrossRef] [Google Scholar]
- History of myeloid-derived suppressor cells. Nat. Rev. Cancer. 2013;13:739-752.
- [CrossRef] [Google Scholar]
- Androgen receptor as potential therapeutic target in metastatic endometrial cancer. Oncotarget. 2016;7:49289-49298.
- [CrossRef] [Google Scholar]
- Polycystic ovary syndrome (PCOS): international collaboration to translate evidence and guide future research. J. Endocrinol.. 2023;257
- [CrossRef] [Google Scholar]
- Functional Characterization of MicroRNA-27a-3p Expression in Human Polycystic Ovary Syndrome. Endocrinology. 2018;159:297-309.
- [CrossRef] [Google Scholar]
- A novel predictive model based on inflammatory response-related genes for predicting endometrial cancer prognosis and its experimental validation. Aging (Albany NY). 2023;15:4844-4860.
- [CrossRef] [Google Scholar]
- Comprehensive analysis of the tumor-promoting effect and immune infiltration correlation MAZ from pan-cancer to hepatocellular carcinoma. Int. Immunopharmacol.. 2023;115:109660
- [CrossRef] [Google Scholar]
- TLR2 Promotes Monocyte/Macrophage Recruitment Into the Liver and Microabscess Formation to Limit the Spread of Listeria Monocytogenes. Front. Immunol.. 2019;10:1388.
- [CrossRef] [Google Scholar]
- The ribosomal protein S6 kinase alpha-1 (RPS6KA1) induces resistance to venetoclax/azacitidine in acute myeloid leukemia. Leukemia. 2023;37:1611-1625.
- [CrossRef] [Google Scholar]
- Silymarin suppressed lung cancer growth in mice via inhibiting myeloid-derived suppressor cells. Biomed. Pharmacother.. 2016;81:460-467.
- [CrossRef] [Google Scholar]
- Androgens in endometrial carcinoma: the killer or helper? J. Endocrinol. Invest.. 2023;46:457-464.
- [CrossRef] [Google Scholar]
- NetworkAnalyst for statistical, visual and network-based meta-analysis of gene expression data. Nat. Protoc.. 2015;10:823-844.
- [CrossRef] [Google Scholar]
- Targeting adipokines in polycystic ovary syndrome and related metabolic disorders: from experimental insights to clinical studies. Pharmacol. Ther.. 2022;240:108284
- [CrossRef] [Google Scholar]
- CXCL9 correlates with antitumor immunity and is predictive of a favorable prognosis in uterine corpus endometrial carcinoma. Front. Oncol.. 2023;13:1077780.
- [CrossRef] [Google Scholar]
- Identification and Validation of MSX1 as a Key Candidate for Progestin Resistance in Endometrial Cancer. Onco Targets Ther.. 2020;13:11669-11688.
- [CrossRef] [Google Scholar]
- Association Between Polycystic Ovary Syndrome and Cancer Risk. JAMA Oncol.. 2019;5:106-107.
- [CrossRef] [Google Scholar]
- Pyruvate Kinase M2 and Cancer: The Role of PKM2 in Promoting Tumorigenesis. Front. Oncol.. 2020;10:159.
- [CrossRef] [Google Scholar]
- Role and mechanism of miR-335-5p in the pathogenesis and treatment of polycystic ovary syndrome. Transl. Res. 2022
- [CrossRef] [Google Scholar]
- Bioinformatics Analysis of Differentially Expressed Genes and Related Pathways in Acute Pancreatitis. Pancreas. 2022;51:821-829.
- [CrossRef] [Google Scholar]
- CD45RO(-)CD8(+) T cell-derived exosomes restrict estrogen-driven endometrial cancer development via the ERbeta/miR-765/PLP2/Notch axis. Theranostics.. 2021;11:5330-5345.
- [CrossRef] [Google Scholar]
- Involvement of impaired CD8(+) mucosal-associated invariant T cells and myeloid-derived suppressor cells in polycystic ovary syndrome. Reprod. Biol. Endocrinol.. 2021;19:175.
- [CrossRef] [Google Scholar]
Appendix A
Supplementary data
Supplementary data to this article can be found online at https://doi.org/10.1016/j.arabjc.2023.105548.
Appendix A
Supplementary data
The following are the Supplementary data to this article:
Supplementary data 1
Supplementary data 1The following are the Supplementary data to this article:


