

Translate this page into:
Eco friendly synthesis of fluorescent carbon dots for the sensitive detection of ferric ions and cell imaging
⁎Corresponding authors at: Hebei Key Laboratory of Wetland Ecology and Conservation, Hengshui 053000, China (J. Deng). dengjk1989@163.com (Jiankang Deng), zhang.fuyuan@hotmail.com (Fuyuan Zhang)
-
Received: ,
Accepted: ,
This article was originally published by Elsevier and was migrated to Scientific Scholar after the change of Publisher.
Abstract
This study established a ferric ion (Fe3+) detection method as a result of the fluorescence quenching effect of Fe3+ on carbon dots (CDs). Specifically, we proposed, a green microwave synthesis route towards fluorescent CDs that requires only the brewer’s spent grain as starting materials. Transmission electron microscopy, X-ray diffraction, Fourier-transform infrared spectra and X-ray photoelectron spectroscopy were performed to investigate the CDs characteristic: morphology, size distribution, functional groups, and composition, respectively. The experimental results, which were run under optimal experimental conditions, indicated that the fluorescence intensity and concentration of Fe3+ were within the desired linear range (0.3–7 μM). The detection limit of this assay towards Fe3+ was 95 nM. The proposed method showed significant selectivity with respect to interfering ions. We evaluated the potential application of this method with tap water, lake water and fetal bovine serum as real samples. Additionally, the CDs could be served as superior bioimaging probes in Hela cells as a result of their excellent optical stability and good biocompatibility. In a word, the present study provides a new idea for CDs derived from the waste of agricultural products for detecting food or environmental contaminants and cell imaging.
Keywords
Microwave
Brewer’s spent grain
Ferric ion
Carbon dots
Detection

1 Introduction
Carbon dots (CDs), a new type of fluorescent nanomaterial, generally have particle sizes of less than 10 nm, which makes them versatile in use and attractive for scientific research. CDs have many unique characteristics including excellent optical stability, good biocompatibility, unique and tunable photoluminescence properties, and chemical inertness. CDs have since been recognized for their significant potential in bioimaging, fluorescent sensors, drug delivery, fluorescent ink, solar cell, and catalysis applications due to their unique characteristics (Lin et al., 2021, Luo et al., 2020, Molaei, 2019).
In general, CDs production follows either “top-down” or “bottom-up” synthesis from small molecules, synthetic polymers, and natural materials. “Bottom-up” synthesis generates CDs from small molecules such as citric acid by the application of microwave, hydrothermal, thermal decomposition, and electrochemical synthetic routes (Sun et al., 2020, Kandra & Bajpai, 2020). However, many researchers recently shifted their focus to the “top-down” method by breaking down natural materials to synthesize CDs due to their less toxicity and moderate reaction conditions. Various natural precursors have been explored for CDs synthesis, such as green tea leaf, shallot, wheat straw, Punica granatum fruit, and cranberry beans (Hu et al., 2020, Sakaew et al., 2020, Liu et al., 2021, Kasibabu et al., 2015, Zulfajri et al., 2019). However, challenges still exist in finding new natural sources and eco-friendly synthetic methods.
The biomass waste which has advantages of low-cost, renewable in materials are often discarded in food industry and daily life. Further use of biomass waste is urgently needed to create more meaningful value. Biomass waste has gradually been regarded as an attractive carbon source for carbon quantum dots synthesis (Das, Bandyopadhyay & Pramanik, 2018, Chandra et al., 2019). Wang et al. prepared fluorescent CDs from orange peel, ginkgo biloba leaves, paulownia leaves and magnolia flower and applied CDs in metal detection (Wang et al., 2020). Generally, complex synthesis conditions are required. Accordingly, recent studies are more inclined to find eco-friendly synthetic methods.
Microwave-assisted synthesis has been recognized as a facile, cost-effective, and efficient approach, making it a potential solution to this problem. The synthesis time of the microwave methods was shorter than conventional hydrothermal method(Chen et al., 2018, Liu et al., 2021). Therefore, microwave-assisted synthesis is currently being employed in CDs synthesis given that carbon materials interact forcefully with microwave radiation for enhanced heating rates and localized heating (Singh et al., 2019). Brewer’s spent grain (BSG) which in the process gets separated from malt, rice and starch, considered as the main waste of the beer brewing process. In general, BSG encompasses approximately 85% of the total beer brewing by-products. It is often added to fodder in animal husbandry (Lynch et al., 2016). The present study aims to investigate the alternative uses for BSG as carbon nanomaterials to maximize the full capacity of its by-products.
By virtue of CDs’ excellent photoluminescence properties and low cytotoxicity, prior research has thoroughly examined in food and environmental analyses and bioimaging (Molaei, 2019). Many previous studies have developed CDs-based fluorescence sensors with the goal of being able to sense metal ions (Kaewprom et al., 2020). For example, the ferric ion (Fe3+) is abundant in natural environments, food, and biological systems. In addition, the human body absorbs Fe3+ from water, fruits, and vegetables. Moderate intake of Fe3+ plays an important role in human health (Abdolmohammad-Zadeh & Zamani-Kalajahi, 2019). As a result, the Chinese National Standard GB/T 5749–2006 (drinking water quality standards) has set a Fe3+ maximum concentration of 0.3 mg/L in drinking water. Thus, the sensitive, selective, and quick determination of Fe3+ is of great importance in the food industries and environment. Many detection methods have been developed for Fe3+ concentration determination, such as spectrophotometry (Sui et al., 2014, Ma et al., 2019, Zhou et al., 2019), atomic absorption spectrometry (AAS) (Gurnani et al., 2003) and inductively coupled plasma mass spectrometry (ICP-MS) (Wu & Boyle, 1998). However, there are few limitations in these assays, including a long processing time, complex operations, and expensive apparatus requirements. The fluorescence method is advantageous as it allows trace substance detection given its high speed, precise sensitivity, and easy operation.
Based on this information, we first proposed a green, one-step microwave synthesis for fluorescent CDs, to which the microwave-assisted method was employed for carbon dot preparation using only brewery mash as original materials and water as the impregnant. Transmission electron microscopy (TEM), X-ray diffraction (XRD), Fourier-transform infrared spectra (FTIR) and X-ray photoelectron spectroscopy (XPS) were then performed to explore their morphology, functional groups, and composition, respectively. The potential application of the developed biosensing system was then investigated using tap water, lake water and fetal bovine serum, which served as the real samples. Lastly, the cell imaging test was administered by confocal laser scanning microscope. The present study proffers a new strategy for CDs derived from the waste of agricultural products for detecting food or environmental contaminants and cell imaging.
2 Materials and methods
2.1 Materials
All reagents for this experiment were purchased from their respective suppliers: Sinopharm Chemical Reagent Co., Ltd. (Shanghai, China): ferric chloride hexahydrate (FeCl3·6H2O), copper sulfate pentahydrate (CuSO4·5H2O), cobalt sulfate heptahydrate (CoSO4·7H2O), chromium chloride hexahydrate (CrCl3·6H2O), calcium chloride (CaCl2), cadmium chloride (CdCl2), manganese sulfate (MnSO4), ferrous sulfate (FeSO4), tin dichloride dehydrate (SnCl2·2H2O), lead acetate trihydrate (PbAc2·3H2O), zinc acetate dehydrate (ZnAc2·2H2O), sodium chloride (NaCl), potassium chloride (KCl), nickel chloride hexahydrate (NiCl2·6H2O), magnesium sulfate heptahydrate (MgSO4·7H2O), and ethylenediamine tetraacetic acid disodium salt (Na2EDTA); from Aladdin Chemical Reagent Co., Ltd. (Beijing, China): silver nitrate (AgNO3) and mercury standard solution (1000 μg/mL Hg in 1 M HNO3); from Biological Industries(Beit Haemek, Israel): fetal bovine serum (FBS). All the listed reagents were utilized without any additional purification. All experimental water was purified using a GT-30L ultra-pure water system (Shanghai, China).
2.2 Preparation of BSG
The BSG used in this study was acquired from the beer experimental production line situated at Hengshui University. The craft beer was composed of 33 kg of barley malt, 6 kg of burnt malt, and 3 kg of dark malt. All malts were provided by Jiuyuan Fermentation Co., Ltd., (Shangdong, China). The beer-making process included following steps: saccharification, filtration, boiling, whirlpool precipitation, fermentation, and cold storage. Furthermore, BSG was separated after the filtration step. The obtained BSG was then ground into a fine powder in 4 min with the IKA A11 basic analysis mill (Staufen, Germany) and stored at −20 °C until use.
2.3 Synthesis of CDs
The CDs were synthesized by the microwave method using BSG as the precursor. Briefly, 1 g of BSG and 10 mL distilled water were mixed in a 15 mL centrifuge tube and were vigorously agitated on a VORTEX-5 (Kylin-Bell Corporation, Haimen, China) for approximately 1 min. The mixture was then sonicated for 30 min at 50 °C, after which it was transferred into 55 mL PFA reaction vessels. A MARS 5 express 40 position microwave digestion system (CEM Corporation, Matthews, NC, USA) was employed for microwave-assisted preparation, which underwent heating to 180 °C for 15 min and maintained for 10 min. Subsequently, the reaction vessels were cooled to room temperature prior to opening, after which the samples were centrifuged at 10,000 rpm for 20 min at 25 °C. The resulting solution was dialyzed (MWCO, 2000 Da) with water for 24 h and lyophilized using a laboratory freeze-drier (FD-1, Beijing Bioking Technology, China). The result yellow powder was then stored at 4 °C until further use.
2.4 Characterization of CDs
High-resolution TEM (HRTEM) was accomplished on a Jeol-2100F electron microscope (JEOL, Japan) to characterize the morphology and size of CDs at an accelerating voltage of 200 kV. An X-5 UV–visible spectrophotometer (Yuanxi, China) was also employed to collect the UV–visible absorption data. Similarly, XPS was performed on an EscaLab 250Xi X-ray photoelectron spectrometer (Thermo Fisher Scientific, USA). XRD (Bruker AXS D8, Germany) was employed to investigate the structural characteristics of CDs. FTIR spectrometry was executed over a scanning range of 400–4000 cm−1 under a transmission mode, during which potassium bromide disks were used as holders in a Nicolet 380 FTIR spectrophotometer (Thermo Fisher Scientific, USA). A Hitachi F-4500 fluorescence spectrophotometer (Tokyo, Japan) was employed to measure the CDs fluorescence spectra.
The CDs fluorescence quantum yield values were obtained based on a comparison of the integrated fluorescence intensities of the CDs to that of the reference standard (quinine sulfate dissolved in 0.1 M H2SO4, quantum yield = 0.54) (Iqbal et al., 2016). The absorption of samples was kept below 0.1. The relative fluorescence yield was assessed using the following equation: where x and std stand for CDs and quinine sulfate, respectively, is the quantum yield, F is the fluorescence intensity, A represents the absorbance, n refers to the refractive indices of the solvents.
The time-correlated single photon counting technique (FLS 980, Edinburgh Instruments Ltd., United Kingdom) to determine the fluorescence lifetimes, wherein the average CDs lifetimes were collected (405 nm excitation/488 nm emission).
2.5 Optimization of detection conditions
To ensure the assay performed according to the standard procedure, critical factors such as pH and quenching time were investigated to optimize the detection conditions. The suitable pH of the reaction system was obtained from the range 4.5-9.0. Nonetheless, we studied the influence of time (0 to 30 min) to the reaction performance.
2.6 Detection of Fe3+
Varying Fe3+ concentrations were mixed with 30 μg/mL CDs in a 10 mM Tris-HNO3 buffer (pH 7.5) to make a final volume of 200 μL. Hereafter, the mixture fluorescence spectra was then recorded after 20 min, wherein the spectra was scanned from 365 to 600 nm (10 nm slit width) under excitation at 340 nm (10 nm slit width).
2.7 Detection of Fe3+ in real samples
Lake water from the Hengshui Lake National Nature Reserve, tap water and FBS were selected to test the validity of the assay for the exploration of ferric ions in the real samples. The initial Fe3+ contents in above samples were measured via Agilent 7800 ICP-MS (Agilent Technologies, USA) following a procedure set by the National Standard of China, GB5009.268–2016. The FBS samples was centrifuged using Millipore Amicon Ultra centrifugal filter unit (3 kDa MWCO) at 5 000 × g for 10 min. After that the FBS was diluted 50 folds with ultrapure water. Different amount of Fe3+ were added into the lake water, tap water and the treated FBS samples. Detection procedures were carried out according to the above mentioned optimum condition (Section 2.5 and 2.6).
2.8 Cytotoxicity assay and cell imaging
The MTT assay were conducted to evaluated in vitro cytotoxicity of CDs on Hela cells. Typically, HeLa cells (iCell Bioscience Inc, Shanghai, China) with a density of 4 × 10³ cells were added to each well and the well plates were cultured in 5% CO2 at 37 °C in Eagle’s minimum essential medium (MEM) complemented with 10% FBS in 96-well cell culture plate. CDs with different concentrations (0, 0.01, 0.02, 0.05, 0.1, 0.2, 0.3, 0.4, 0.5 mg/mL) were added to each well and cultured for 24 h. After removing the medium and washing cells with PBS for three times, 100 μL fresh medium containing 0.5 mg/mL MTT were added into the plates and incubated for another 4 h. After discarding the supernatant, and 100 μL dimethyl sulfoxide (DMSO) was poured into each well. The optical density (OD) values were recorded by TECAN SPARK 10 M microplate reader (Zurich, Switzerland) at 570 nm after light shaking for 10 min. Each experiments were performed in triplicate. The relative viability was calculated on the basis of the following equation:
where ODT and ODC is the optical density with and without CDs, respectively; ODB is the optical density of the wells of culture medium without cells.
For the cell imaging test, 4 × 10⁴ cells were cultured in a special laser confocal dish for 24 h. Then, the CDs solution (0.5 mg/mL) was added into each well. After 12 h incubation, the cells were rinsed with MEM for three times. The confocal fluorescence images under bright field and 405 nm excitation were acquired by Olympus FV1000 confocal laser scanning microscope (Tokyo, Japan).
3 Results and discussion
3.1 Characterization of CDs
This study synthesized CDs using a cost-effective and environmentally friendly microwave-assisted method based on BSG. The detailed characterization of the CDs were performed via UV–vis absorption spectroscopy, fluorescence spectroscopy, TEM, XRD, FTIR, and XPS.
The CDs UV-vis absorption spectra presented a peak 280 nm, which was the result of the π–π* transition of the aromatic C-C bonds. Additionally, a shoulder peak at approximately 325 nm (black line in Fig. 1A) may be accredited to the n-π* transitions of the carbonyl/hydroxyl moieties on the CDs surface (Rodríguez-Padrón et al., 2018).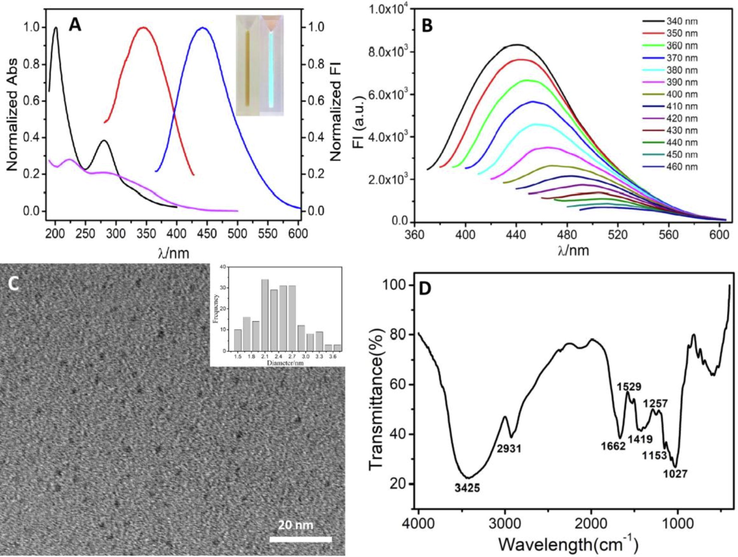
(A) Typical absorption and fluorescence spectra of CDs, black line: absorption spectra of CDs, pink line: absorption spectra of Fe3+, red line and blue line represent excitation and emission spectra of CDs, respectively. Inset: CDs under sunlight (left) and ultraviolet light (right, 365 nm); (B) Typical fluorescence spectra of CDs at different excitation wavelength (between 340 and 460 nm at 10 nm intervals); (C) HRTEM image of CDs and the size distribution (inset) and (D) FTIR spectra of CDs.
The CDs fluorescence spectra characterized the optical properties, from which the results exhibited optimal excitation wavelength at 340 nm (Fig. 1A, red line) and emission wavelength at 442 nm (Fig. 1A, blue line), respectively. The CDs solution presented a bright blue fluorescence under ultraviolet irradiation (365 nm) (inset of Fig. 1A). Similarly, Fig. 1B presents the CDs fluorescence spectra at various excitation wavelengths, wherein excitation-dependent CDs fluorescence emission were observed. A slight shift in the fluorescence emission peak to longer wavelengths (from 442 nm to 510 nm) was observed as the excitation wavelength increased from 340 nm to 460 nm. In addition, a negative correlation was observed between the fluorescence emission intensity and excitation wavelength, which is commonly observed CDs behavior and has been previously related to CDs size-dependent excitations as well as the CDs surface states and band gaps (Zulfajri et al., 2019, Zhu et al., 2013). The as-synthesized CDs quantum yield was characterized to be 25.8% as the reference, which is higher than previously reported CDs from natural product (Chen et al., 2018, Liu et al., 2015, Meng et al., 2019, Zhu et al., 2013). As shown in Fig. S1, the FL emission intensity at 442 nm did not exhibit significant change under ultraviolet irradiation (120 μW/cm2) for 30 min, indicating that the CDs possessed good photostability. We examined the effects of storage time on the fluorescence stability of CDs (Fig. S2). After storage for six months, the maximum fluorescence intensity of CDs was reduced only by 16.4%. The peak position of CDs are slightly red-shift. Taken together, the results suggest that the CDs exhibit good stability, which is beneficial for preservation and fluorescent sensing.
As characterized by TEM (Fig. 1C), the synthesized CDs had a uniform distribution of particle size and monodispersed distribution. The particle size distribution (inset image of Fig. 1C) was measured by Nano Measurer 1.2 software from 280 particles. According to the TEM results, the CDs exhibited an average particle size of 2.39 ± 0.49 nm. However, the HRTEM image showed that no obvious lattice fringes were observed due to the low diffraction contrast, indicating that the CDs were in the amorphous state. The XRD data (Fig. S3) further confirms poorly crystallized carbon framework and the amorphous nature of the CDs. Similar results have been reported for CDs from natural sources (Liu et al., 2015). The major constituents of BSG are hemicellulose, cellulose, protein and lignin. Protein can be hydrolyzed into amino acids to some extent based on the experiment in our work. Indeed, proteins and amino acids have successfully been used in CDs along with the microwave synthetic methods (Wang et al., 2016, Jiang et al.,2012). Hence, it could conceivably be hypothesized that protein, amino acid and some smaller molecules in BSG contribute more the fabrication of CDs.
The FTIR spectra presented the CDs surface functional groups (Fig. 1D), to which peaks at 3425 cm−1 and 1257 cm−1 were observed and were ascribed to the stretching vibration of O-H (Zhang et al., 2010, Lu et al., 2015). Similarly, the peaks at 2931 cm−1 and 1027 cm−1 were designated to the asymmetric stretching and symmetric vibrations of the C-H bonds (Zor et al., 2015), whereas the band at approximately 1662 cm−1 was defined the vibrational absorption band of the C = O bond (Hu et al., 2017, Zheng et al., 2017). H-O-H bending and C = C stretching vibrations were observed based on the peaks observed at 1529 cm−1 and 1419 cm−1, respectively. Lastly, the peak 1153 cm−1 defined the C-N and asymmetric stretching vibrations of C-NH-C (Lu et al., 2015). The FTIR results validated the CDs embedding of the carboxyl, hydroxyl and amino groups. The presence of hydrophilic groups, specifically O-H and C=O, on the CDs guaranteed the CDs hydrophilicity and stability in the aqueous system.
The CDs’ composition was characterized using XPS. The CDs exhibited three distinct peaks at 285.08 eV, 533.08 eV, and 400.08 eV according to the survey spectrum in Fig. 2A, which define the C1s, O1s and N1s binding energies, respectively (Lv et al., 2017). The CDs contents of these three elements were determined to be 60.5% (C), 35.96% (O), and 3.28% (N). In addition, the high-resolution C1s, O1s, and N1s spectra were de-convoluted and fitted, to which the high-resolution C1s spectrum was de-convoluted into four peaks at 284.8 eV, 286.27 eV, and 287.9 eV. These peaks defined the C-C, C-O, and C=O bonds, respectively (Fig. 2B) (Ma et al., 2019, Ma et al., 2016). The high-resolution N1s spectra were fitted against the C-N bonds (400.02 eV) and N-O bonds (402.14 eV) (Fig. 2C) (Lv et al., 2017, Ma et al., 2016). The two main high-resolution O1s spectra components defined the C=O and C-O groups at 531.65 and 532.81 eV (Fig. 2D) (Edison et al., 2016, Zhang et al., 2019). The XPS experimental results were consistent with those obtained by FTIR.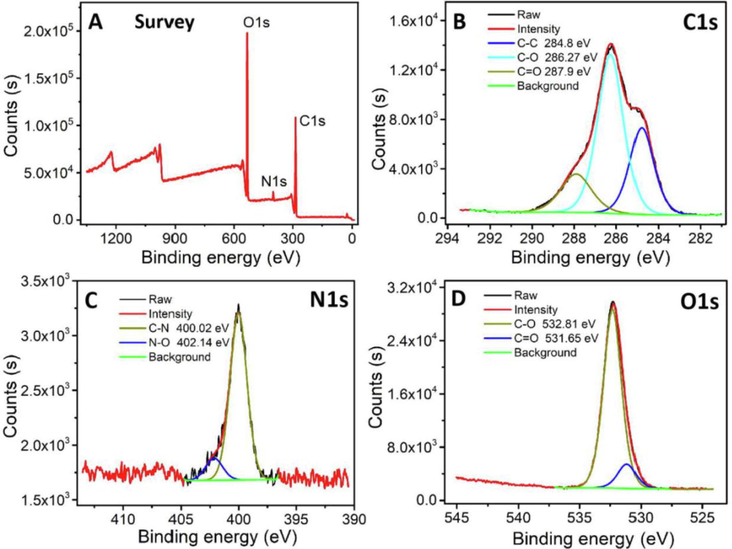
(A) XPS, (B) C1s, (C) N1s, and (D) O1s spectra of CDs.
3.2 Mechanism of the assay
Working principle of the assay is depicted in Scheme 1. CDs without any modification as fluorophore were mixed with the ferric ions. As shown in Fig S4, under UV light (365 nm), the bright blue CDs was quenched by addition of Fe3+.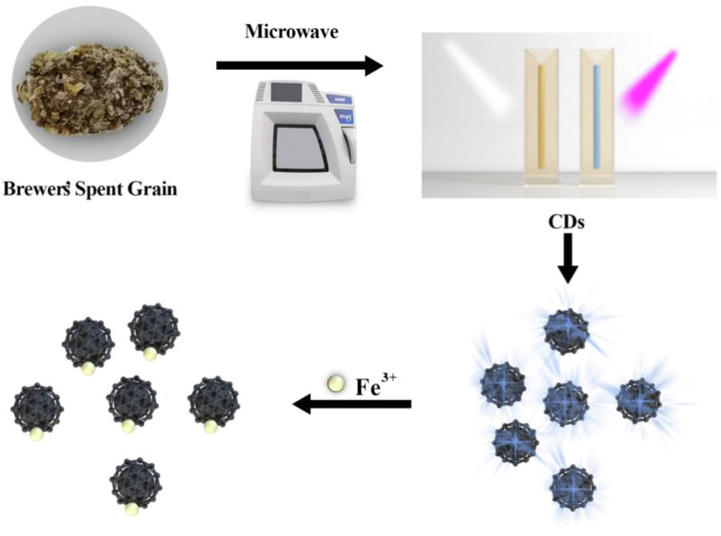
Detection of ferric ions by label-free fluorescence turn-off assay.
In general, quenching mechanisms can be categorized into inner filter effect (IFE), static quenching or dynamic quenching. As illustrated in Fig. 1A, the absorptionability of Fe3+ at 344 nm and 442 nm (Fig. 1A purple line) were very weak, suggesting that Fe3+ could neither absorb the excitation light nor emission light of CDs efficiently. Hence, we can infer that IFE was not the dominant contribution to the fluorescence quenching in CDs-Fe3+ system. In order to elaborate the quenching mechanism, the quenching data were analyzed using Stern-Volmer equation(Eq (1) for dynamic quenching, Eq (2) for static quenching).
The fluorescence decay lifetime of CDs and the Fe3+ introduction into the CDs were investigated to define the Fe3+-induced CDs fluorescence quenching mechanism. The fluorescence attenuation curve fit well with the double exponential formula (Fig. S6). The CDs exhibited a average fluorescence lifetime of 4.31 ns. The addition of Fe3+ to the CDs solution resulted in an average CDs fluorescence lifetime of 4.54 ns. No significant change was observed in the CDs fluorescence attenuation curve and fluorescence lifetime both in the absence and presence of Fe3+. In addition, Fig. S7 presents the UV–vis absorption spectra of the CDs, Fe3+, CDs-Fe3+ system and sum absorption of CDs with Fe3+. CDs and CDs-Fe3+ system absorbance peaks were observed at 280 nm and 208 nm, respectively. The CDs-Fe3+ UV–vis spectrum presented a significant absorption increase as compared to the CDs spectra. Meanwhile, the absorption intensity of CDs-Fe3+ system showed a small decrease compared with that of the sum absorption between CDs and Fe3+(Huang et al., 2015). This result suggests that the CDs and Fe3+ induced formation of ground-state complexes(Huang et al., 2015, Zu et al., 2017, Wang et al., 2016). EDTA as a strong metal ion chelator was added into the CDs-Fe3+ system. Upon addition of EDTA, the fluorescence intensity of the CDs-Fe3+ system can be efficiently recovered (Fig. S8), implying that the interaction of Fe3+ with EDTA was significantly stronger than CDs. These results indicated that the quenching process in our study is static quenching, which are in accord with recent studies (Wang et al., 2014).
3.3 Optimization of detection conditions
To ensure the assay performed excellently, critical factors such as pH and reaction time were investigated for optimizing the detection conditions. As seen from Fig. S9, the fluorescence intensity declined sharply within 1 min, and then reached a plateau after 20 min. Considering this reason, 20 min was chosen as the optimal reaction time for detecting Fe3+. Furthermore, we observed that the fluorescence intensity of CDs was not influenced by different pH buffer solutions ranging from pH 4.5 to 9.0 (Fig. S10).
3.4 Sensitivity and selectivity of the assay
A significant negative correlation was observed between the fluorescence peak centered at 442 nm and the Fe3+ concentrations (Fig. 3). In addition, the relative fluorescence intensity and Fe3+ concentrations (0.3–7 μM range) exhibited a significant linear correlation (R2 = 0.991). The data fit a linear regression equation as Y=-0.02189X+0.96832, wherein Y defines the relative CDs fluorescence intensity (442 nm) and X is the ferric ion concentration (μM). A detection limit of 95 nM was determined based on the standard deviation of the triplicate background signals of twenty independent experimental results. In addition, the presented results exhibited a higher sensitivity than previous methods based on CDs from natural sources as shown in Table S1.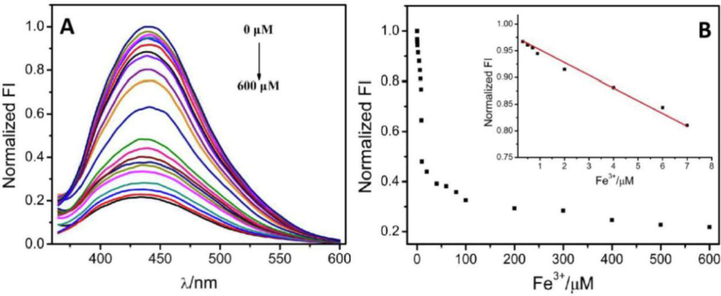
(A) The fluorescence spectra of CDs with Fe3+ at different concentrations: 0, 0.3, 0.5, 0.7, 0.9, 2, 4, 6, 7, 8, 9, 10, 20, 40, 60, 80, 100, 200, 300, 400, 500 and 600 μM, respectively. (B) The relationship between the fluorescence intensity and the concentration of Fe3+. The linear range is from 0.3 to 7 μM.
Following this the selectivity of the fluorescence assay was surveyed by screening the fluorescence responses toward common metal ions, including Ag+, Cu2+, Co2+, Cr3+, Cd2+, Hg2+, Mn2+, Fe2+, Sn2+, Pb2+, Zn2+, Ca2+, Mg2+, Na+, K+, and Ni2+ (Fig. 4). In addition, the fluorescence intensity did not exhibite any significant change following the addition of any other common metal ions. However, fluorescence intensity was significantly reduced following the addition of Fe3+. As can be seen from Fig. S11, when adding the co-existing metal ions (10 mM) and Fe3+ (1 mM) simultaneously, the fluorescence intensity of CDs was significantly quenched. The co-existing metal ions revealed no significant effect on the fluorescence quenching efficiency (<7%). These results validated the highly selective response of the fluorescence assay towards Fe3+, wherein a visible color change under visible ultraviolet light indicated Fe3+ detection (Fig. S4). The desired sensitivity and selectivity of this assay was attributed to the stronger affinity of surface groups of CDs toward Fe3+.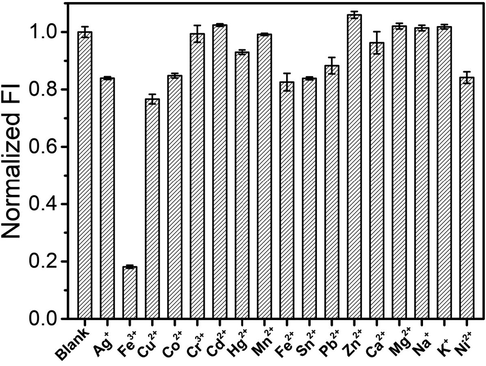
Selectivity tests of this assay (1 mM each, from left to right: blank, Ag+, Fe3+, Cu2+, Co2+, Cr3+, Cd2+, Hg2+, Mn2+, Fe2+, Sn2+, Pb2+, Zn2+, Ca2+, Mg2+, Na+, K+, Ni2+).
3.5 Real sample analysis
A recovery test was performed to investigate practicality of the presented ferric ion detection method, wherein different ferric ion concentrations were added to tap water and lake water and FBS. The recoveries were characterized based on the standard addition method. ICP-MS was performed to measure the original Fe3+ content in lake water, tap water and FBS. The spiked samples recovery ranged from 87% to 138% (Table 1), suggesting the stability and the potential applicability of the proposed strategy for ionic forms of iron analysis of real samples.
Samples
Fe3+ (μM)
Recovery(%)
Spiked
Found mean ± SD
Tap water
1
5
4.46 ± 0.21
89.24 ± 4.25
2
50
44.00 ± 0.75
88.00 ± 1.51
3
100
95 ± 0.45
95 ± 0.45
Lake water
1
5
4.40 ± 0.21
88.00 ± 4.20
2
50
48.45 ± 1.01
96.90 ± 2.02
3
100
94.85 ± 1.23
94.85 ± 1.23
FBS
1
5
4.35 ± 0.46
87.00 ± 9.20
2
50
53 ± 2.38
106 ± 4.76
3
100
138 ± 6.91
138 ± 6.91
3.6 Cytotoxicity and cell imaging
To investigate the viability of CDs in cell imaging, it is recommended that the CDs possesses not only light stability but also low cytotoxicity. So that we implemented in vitro cytotoxicity test of CDs based on MTT assays. The cells viability without CDs were regarded as a reference. From Fig. S12, the cell viability remained greater than 78% even when treated with 0.5 mg/mL CDs. Hence, it demonstrated that CDs possess good biocompatibility and low cytotoxicity and provided an advantage for cell imaging and other potential biological applications.
Futhurmore, the cell imaging was implemented by confocal laser scanning microscope. As shown in the bright-field images (Fig. 5), the morphology of Hela cells have not been affected after the addition of CDs (0.5 mg/mL) which indicated that the CDs had no obvious adverse effect. The confocal picture of HeLa cells under 405 nm laser excitation exhibits bright blue fluorescence, revealing the CDs could internalize into the cells and spread throughout the cytoplasm. The results implied that CDs derived from the waste of agricultural products exhibited low-toxicity and good biocompatibility to cells, as well as the cell imaging capability.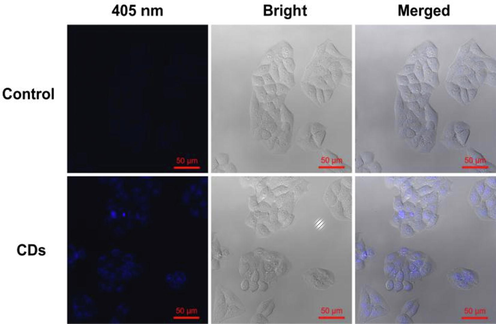
Confocal fluorescence images of HeLa cells incubated in the culture medium without (control) and with CDs (0.5 mg/mL) for 12 h under 405 nm laser excitation.
4 Conclusions
Overall, fluorescent CDs were prepared from brewer’s spent grain using a microwave hydrothermal protocol. The generated CDs presented excellent fluorescent properties and potential as label-free probes for Fe3+ detection. Fe3+ significantly quenched the CDs fluorescence through the static quenching mechanism. The FL intensity and Fe3+ concentration were observed excellent linear relationship in the range of 0.3–7 μM under the optimal conditions. The assay exhibited an LOD of 95 nM towards the ferric ions. Moreover, the presented method was successfully applied for practical Fe3+ determination in tap water, lake water and FBS. Owing to good biocompatibility and low cytotoxicity, CDs can operate as a potential candidates for cell imaging label. Consequently, the research not only presents a novel synthesis method for CDs based on agricultural waste product, but also hews a new pathway for ferric ions detection and cell imaging.
Acknowledgements
This work was supported by the Natural Science Foundation of Hebei Province (No.2019111044), Science and Technology Research Program of Higher Education of Hebei Province (No.QN2019302), Research Foundation for Talented Scholars of Hengshui University (No.2018GC14) and Scientific Research Foundation for Returned Scholars of Hebei Province (No. C20190185).
Declaration of Competing Interest
The authors declare that they have no known competing financial interests or personal relationships that could have appeared to influence the work reported in this paper.
References
- A turn-on/off fluorescent sensor based on nano-structured Mg-Al layered double hydroxide intercalated with salicylic acid for monitoring of ferric ion in human serum samples. Anal. Chim. Acta. 2019;1061:152-160.
- [CrossRef] [Google Scholar]
- Mustard seeds derived fluorescent carbon quantum dots and their peroxidase-like activity for colorimetric detection of H2O2 and ascorbic acid in a real sample. Anal. Chim. Acta. 2019;1054:145-156.
- [CrossRef] [Google Scholar]
- Synthesis of graphene quantum dots from natural polymer starch for cell imaging. Green Chem.. 2018;20:4438-4442.
- [CrossRef] [Google Scholar]
- Carbon quantum dots from natural resource: A review. Mater. Today Chem.. 2018;8:96-109.
- [CrossRef] [Google Scholar]
- Turn-off fluorescence sensor for the detection of ferric ion in water using green synthesized N-doped carbon dots and its bio-imaging. J. Photochem. Photobiol.. 2016;158:235-242.
- [CrossRef] [Google Scholar]
- Cellulose functionalized with 8-hydroxyquinoline: new method of synthesis and applications as a solid phase extractant in the determination of metal ions by flame atomic absorption spectrometry. Anal. Chim. Acta. 2003;485:221-232.
- [CrossRef] [Google Scholar]
- Controlling speciation of nitrogen in nitrogen-doped carbon dots by ferric ion catalysis for enhancing fluorescence. Carbon. 2017;111:133-141.
- [CrossRef] [Google Scholar]
- The N, S co-doped carbon dots with excellent luminescent properties from green tea leaf residue and its sensing of gefitinib. Microchem. J.. 2020;154:104588
- [CrossRef] [Google Scholar]
- A carbon dots based fluorescent probe for selective and sensitive detection of hemoglobin. Sens. Actuat. B-Chem.. 2015;221:1215-1222.
- [CrossRef] [Google Scholar]
- Carbon dots prepared by solid state method via citric acid and 1,10-phenanthroline for selective and sensing detection of Fe2+ and Fe3+. Sens. Actuat. B-Chem.. 2016;237:408-415.
- [CrossRef] [Google Scholar]
- Amino acids as the source for producing carbon nanodots: microwave assisted one-step synthesis, intrinsic photoluminescence property and intense chemiluminescence enhancement. Chem. Commun.. 2012;48(77):9634-9636.
- [Google Scholar]
- Simultaneous determination of Hg(II) and Cu(II) in water samples using fluorescence quenching sensor of N-doped and N, K co-doped graphene quantum dots. Arab. J. Chem.. 2020;13:3714-3723.
- [CrossRef] [Google Scholar]
- Synthesis, mechanical properties of fluorescent carbon dots loaded nanocomposites chitosan film for wound healing and drug delivery. Arab. J. Chem.. 2020;13:4882-4894.
- [CrossRef] [Google Scholar]
- One-step synthesis of fluorescent carbon dots for imaging bacterial and fungal cells. Anal. Methods. 2015;7:2373-2378.
- [CrossRef] [Google Scholar]
- Carbon dots based on natural resources: Synthesis and applications in sensors. Microchem. J.. 2021;160:105604
- [CrossRef] [Google Scholar]
- A facile microwave-hydrothermal approach towards highly photoluminescent carbon dots from goose feathers. RSC Adv.. 2015;5:4428-4433.
- [CrossRef] [Google Scholar]
- Facile synthesis of carbon dots from wheat straw for colorimetric and fluorescent detection of fluoride and cellular imaging. Spectrochim. Acta Part A Mol. Biomol. Spectrosc.. 2021;246:118964
- [CrossRef] [Google Scholar]
- Hydroxyl-rich C-dots synthesized by a one-pot method and their application in the preparation of noble metal nanoparticles. Chem. Commun.. 2015;51:7164-7167.
- [CrossRef] [Google Scholar]
- High-quality water-soluble luminescent carbon dots for multicolor patterning, sensors, and bioimaging. RSC Adv.. 2015;5:16972-16979.
- [CrossRef] [Google Scholar]
- Carbon dots derived fluorescent nanosensors as versatile tools for food quality and safety assessment: A review. Trends Food Sci. Tech.. 2020;95:149-161.
- [CrossRef] [Google Scholar]
- Self-assembly of nitrogen-doped carbon dots anchored on bacterial cellulose and their application in iron ion detection. Carbohyd. Polym.. 2017;172:93-101.
- [CrossRef] [Google Scholar]
- Brewers' spent grain: a review with an emphasis on food and health. J. I. Brewing. 2016;122:553-568.
- [CrossRef] [Google Scholar]
- Facile synthesis of fluorescent carbon dots from Prunus cerasifera fruits for fluorescent ink, Fe3+ ion detection and cell imaging. Spectrochim. Acta Part A Mol. Biomol. Spectrosc.. 2019;213:281-287.
- [CrossRef] [Google Scholar]
- A general sensing strategy for detection of Fe3+ by using amino acid-modified graphene quantum dots as fluorescent probe. Appl. Surf. Sci.. 2016;389:995-1002.
- [CrossRef] [Google Scholar]
- Biomass-derived carbon dots and their applications. Energy & Environ. Anal.. 2019;2:172-192.
- [CrossRef] [Google Scholar]
- A review on nanostructured carbon quantum dots and their applications in biotechnology, sensors, and chemiluminescence. Talanta. 2019;196:456-478.
- [CrossRef] [Google Scholar]
- Catalyzed microwave-assisted preparation of carbon quantum dots from lignocellulosic residues. ACS Sustain. Chem. Eng.. 2018;6:7200-7205.
- [CrossRef] [Google Scholar]
- Green and facile synthesis of water-soluble carbon dots from ethanolic shallot extract for chromium ion sensing in milk, fruit juices, and wastewater samples. RSC Adv.. 2020;10:20638-20645.
- [CrossRef] [Google Scholar]
- Progress in microwave-assisted synthesis of quantum dots (graphene/carbon/semiconducting) for bioapplications: a review. Mater. Today Chem.. 2019;12:282-314.
- [CrossRef] [Google Scholar]
- Novel BODIPY-based fluorescence turn-on sensor for Fe3+ and its bioimaging application in living cells. ACS Appl. Mater. Inter.. 2014;6:18408-18412.
- [CrossRef] [Google Scholar]
- Colorimetric and fluorimetric dual mode detection of Fe2+ in aqueous solution based on a carbon dots/phenanthroline system. Arab. J. Chem.. 2020;13:5075-5083.
- [CrossRef] [Google Scholar]
- Graphene quantum dots as a fluorescent sensing platform for highly efficient detection of copper(II) ions. Sens. Actuat. B-Chem.. 2014;190:516-522.
- [CrossRef] [Google Scholar]
- Fluorescent carbon dots from milk by microwave cooking. RSC Adv.. 2016;6(47):41516-41521.
- [Google Scholar]
- Fluorescence quenchometric method for determination of ferric ion using boron-doped carbon dots. Microchim. Acta. 2016;183:273-279.
- [CrossRef] [Google Scholar]
- Wang, C., Shi, H., Yang, M., Yan, Y., Liu, E., Ji, Z., & Fan, J. 2020. Facile synthesis of novel carbon quantum dots from biomass waste for highly sensitive detection of iron ions. Mater Res Bull. 124: 110730.https://doi.org/10.1016/j.materresbull.2019.110730.
- Determination of iron in seawater by high-resolution isotope dilution inductively coupled plasma mass spectrometry after Mg(OH)2 coprecipitation. Anal. Chim. Acta. 1998;367:183-191.
- [CrossRef] [Google Scholar]
- A novel one-step approach to synthesize fluorescent carbon nanoparticles. Eur. J. Inorg. Chem.. 2010;2010:4411-4414.
- [CrossRef] [Google Scholar]
- Fish-scale-derived carbon dots as efficient fluorescent nanoprobes for detection of ferric ions. RSC Adv.. 2019;9:940-949.
- [CrossRef] [Google Scholar]
- Pollen derived blue fluorescent carbon dots for bioimaging and monitoring of nitrogen, phosphorus and potassium uptake in Brassica parachinensis L. RSC Adv.. 2017;7:33459-33465.
- [CrossRef] [Google Scholar]
- Nitrogen-doped carbon dots with high quantum yield for colorimetric and fluorometric detection of ferric ions and in a fluorescent ink. Microchim. Acta. 2019;186
- [CrossRef] [Google Scholar]
- Plant leaf-derived fluorescent carbon dots for sensing, patterning and coding. J. Mater. Chem. C. 2013;1:4925-4932.
- [CrossRef] [Google Scholar]
- Highly photoluminescent carbon dots for multicolor patterning, sensors, and bioimaging. Angew. Chem. Int. Ed.. 2013;52:3953-3957.
- [CrossRef] [Google Scholar]
- Graphene quantum dots-based photoluminescent sensor: a multifunctional composite for pesticide detection. ACS Appl. Mater. Inter.. 2015;7:20272-20279.
- [CrossRef] [Google Scholar]
- The quenching of the fluorescence of carbon dots: a review on mechanisms and applications. Microchim. Acta. 2017;184:1899-1914.
- [CrossRef] [Google Scholar]
- Cranberry beans derived carbon dots as a potential fluorescence sensor for selective detection of Fe3+ ions in aqueous solution. ACS Omega. 2019;4:15382-15392.
- [CrossRef] [Google Scholar]
Appendix A
Supplementary data
Supplementary data to this article can be found online at https://doi.org/10.1016/j.arabjc.2021.103195.
Appendix A
Supplementary data
The following are the Supplementary data to this article:


