

Translate this page into:
Effect of processing on the release of phenolic compounds and antioxidant activity during in vitro digestion of hulless barley
⁎Corresponding authors. 154541462@qq.com (Chen Xia), 1046652698@qq.com (Jian Chen)
-
Received: ,
Accepted: ,
This article was originally published by Elsevier and was migrated to Scientific Scholar after the change of Publisher.
Abstract
Effect of processing and in vitro digestion on the release of phenolic compounds in hulless barley were investigated. Chrysoeriol-7-O-glucouronide was significantly detected in three hulless barley products. Roasting resulted in higher phenolic compounds and antioxidant activities than steaming. The in vitro digestion process releases much more bound phenolic compounds.
Abstract
Hulless barley contains phenolic compounds and possesses various antioxidant activities. To clarify the effects of thermal processing and in vitro digestion on the release of phenolic compounds in hulless barley, we studied the phenolic components and antioxidant activities of hulless barley after steaming, roasting processes, and in vitro digestions. Both total phenolic content (TPC) and total flavonoid content (TFC) in raw hulless barley (HB, 4.14 mg/g DW and 1.53 mg/g DW, respectively) were higher than that of steamed hulless barley (SHB) and roasted hulless barley (RHB). In vitro digestion significantly released more ferulic acid from its bound form, but hydrolyzed some amount of flavonoid (luteolin). Chrysoeriol-7-O-glucouronide was significantly detected (412.13 µg/g DW in HB, 382.19 µg/g DW in SHB, and 396.91 µg/g DW in RHB) in all three hulless barley. The total released content of phenolic compounds obtained from each phase after digestion reached to 46% and 45% for SHB and RHB, which was higher than that in the HB (41%). The antioxidant assay (via DPPH and ABTS free radical scavenging assays) indicated that the capacity of HB was obviously higher than that of SHB and RHB in undigested group. For digested group, the ABTS+ assay order was following, undigested > oral > small intestine > gastric > large intestine. The DPPH assay results indicated the antioxidant capacity as the order of undigested > oral > gastric > large intestine. Correlation analysis showed that ferulic acid, chrysoeriol-7-O-glucouronide, luteolin, chrysoeriol, and luteolin-7-O-glucouronide contributed to the antioxidant activities. Hierarchical cluster analysis (HCA) grouped samples accordingly. Roasting process could be considered as a better daily thermal treatment for hulless barley than steaming in terms of phenolic compounds and their antioxidant activities.
Keywords
Hulless barley
Processing
In vitro digestion
Phenolic compounds
Antioxidant activities

1 Introduction
Hulless barley is widely cultivated in western alpine-cold regions in China, such as Tibet, Sichuan, Qinghai, and other areas in the Qinghai-Tibet Plateau, at elevations of 1400–4700 m (Liu et al., 2013). It is an important food ingredient of people and feed of animals living in these areas. Over the past decade, the functional ingredients of hulless barley have attracted extensive attention due to the high levels of protein and vitamins, low fat content, and abundance of phenolic compounds, including ferulic acid, flavonols, and flavones (Shen et al., 2016; Siebenhandl et al., 2007; Zhu et al., 2015). The phenolic compounds in hulless barley are well known for preventing cardiovascular disease, improving immunity, and protecting against cancer, and flavonoids in particular can reduce blood lipids and blood sugar, and also possess antiviral activity (Liu, 2007; Lahouar et al., 2014). In addition, hulless barley also exhibits strong antioxidant activity due to its high levels of phenolic compounds, and higher antioxidant activity has consistently been associated with protection against chronic diseases and oxidative stress (Borneo and Leon, 2012; Zhao and Moghadasian, 2008). These findings have resulted in the phenolic compounds and antioxidant activity of hulless barley being intensively studied in recent years.
Thermal processing caused a number of physical and chemical changes in cereal, such as starch gelatinization, protein denaturation, components interactions and browning reactions, which would result in improving organoleptic properties, increasing nutrient availability, and inactivation of heat labile toxic compounds and enzyme inhibitors (Ragaee et al., 2014). However, some researchers hold that thermal processing also had some negative effects on the polyphenols, such as antioxidant ingredient release, destruction, or the creation of redox active metabolites (Oboh et al., 2010; Sharma and Gujral, 2011). Ti et al. (2015) considered that antioxidant compounds were very sensitive to heat, with heat leading to the inactivation of endogenous enzymes and consequent oxidation of phenolics. Thus, determining how traditional processing methods affect phenolic compounds and their antioxidant activity in hulless barley is particularly important. Unfortunately, information on this is lacking.
Phenolic compounds also were influenced during the digestion process and can be released under the action of enzymes. Stanisavljević et al. (2015) found that some flavonoid compounds were released during in vitro digestion. Qin et al. (2018) determined that phenolic compounds were mostly released in the gastric and small-intestine digestion stages. It is important to note that phenolic compounds content in the gastrointestinal tract is relatively higher rather than in the body tissues, and evidence of anti-oxidative effects and modulation the gastrointestinal enzyme activity (Nagar et al., 2020). Although the digestion processes were a crucial factor affecting the biological activity of phenolic compounds in the body, there was insufficient data, especially in huless barley. Besides, the manner in which in vitro processing and digestion affect polyphenols in hulless barley remains to be studied.
Thus, in this study, the phenolic compounds content and antioxidant activity of hulless barley processed via different traditional processing methods (steaming and roasting) were researched during simulated in vitro static gastrointestinal digestion. The in vitro digestion phases included the oral, stomach, small intestine, and large intestine, which were used to preliminarily explore the nutritional contribution of hulless barley to the human body and provide a theoretical basis for the comprehensive utilization of the processing of by-products of hulless barley.
2 Materials and methods
2.1 Materials
The variety of hulless barley used was ‘Longzi’, which is black in color. This barley variety was obtained from Tibet Chunguang Food Co. Ltd. (Xizang, China) in October 2018, following which it was milled and passed through a 40-mesh sieve and denoted as raw hulless barley (HB). For the steamed hulless barley (SHB), 100 g of hulless barley was placed on a tray in a steam cooker (Midea Group) covered with a lid and in boiling water for 20 min at atmospheric pressure of 100 ˚ C, following that it was freeze dried, ground, and passed through a 40-mesh sieve. For the roasted hulless barley (RHB), the hulless barley (100 g) was roasted in a pan placed on an induction cooker (Midea Group) at a constant power (1200 W) without oil for 15 min until the hulless barley burst rate reached more than 85%, following that it was cooled to ambient temperature, freeze dried, ground, and passed through a 40-mesh sieve.
2.2 Chemicals and reagents
α-Amylase (≥400000 U/g) was purchased from Beijing Solarbio Science & Technology Co. Ltd. (Beijing, China); pepsin (≥3000 U/mg white powder, from porcine gastric mucosa) was purchased from German BioFroxx (Einhausen, Germany); pancreatin (≥3500 U/mg, from porcine pancreas) was purchased from the Xiya Reagent Research Center (Shangdong, China); cholic acid sodium salt (98%, from a pig) was purchased from Cool Chemical Science and Technology Co. Ltd. (Beijing, China); and Viscozyme L (100 FBG/g) was purchased from Danish Novozymes (Copenhagen, Denmark). Ferulic acid, luteolin, gallic acid, catechin, luteolin-7-O-glucouronide, and chrysoeriol-7-O-glucouronide were all purchased from Beijing Solarbio Science & Technology Co. Ltd. (Beijing, China). Chrysoeriol used in this research was isolated and identified by our laboratory (Supplementary Fig. 1). Analytical-grade formic acid, AlCl3, NaNO2, Folin–Ciocalteu phenol reagent, CaCl3, hydrochloric acid (HCl), methanol, and Trolox were obtained from Chengdu Kelong Chemical Reagent Works (Chengdu, China). 1,1-Diphenyl-2-picrylhydrazyl (DPPH•, >99.7%), 2,2'-azino-bis(3-ethylbenzothiazoline-6-sulfonic acid) diammonium salt (ABTS•+, >99.7%), and chromatographic-grade methanol and acetonitrile were purchased from American Sigma (St. Louis, MO, USA).
2.3 Sample extraction
1.0 g HB, SHB and RHB powder was homogenized with 8 mL 85% methanol (containing 1% formic acid), respectively, and then extracted for 30 min at 40 °C, assisted by ultrasound from an ultrasonic instrument (Kunshan Ultrasonic instrument co. LTD, China). The mixture was centrifuged (SIGMA centrifuge, Germany) at 3743 g for 15 min. The supernatants were collected and the residue was extracted twice, the extraction was combined and then fixed to 25 mL. It was collected and stored at 4 °C. Each sample was prepared in triplicate.
2.4 Simulated in vitro digestion
The in vitro simulated digestion procedure (Supplementary Fig. 2) was carried out according to the description of Qin et al. (2018), with a slight modification. Briefly, 2 g of HB, SHB, or RHB was suspended in 20 mL distilled water (adjusted to pH = 6.5), to which 1 mL of α-amylase solution (75 U/mL solution in 1 mM CaCl2) was added. The mixture was incubated in a water bath at 37 °C and shaked for 10 min and then centrifuged at 6654 g for 10 min to obtain the supernatant for the oral digestion stage. The residue was resuspended in 20 mL distilled water and adjusted to pH = 2 with 6 mol/L HCL before the addition of 105.6 mg pepsin. The mixture was incubated in a water bath at 37 °C for 2 h with shaking and then centrifuged at 6654g for 10 min to obtain the supernatant for the gastric digestion stage. Next, 18 mL distilled water was added to the residue, and 2 mol/L NaHCO3 was used to adjust the pH to 7.4, following which 1 mL of pancreatin (10 mg/mL, dissolved in 1 mol/L NaHCO3) and 1 mL cholic acid sodium salt (65 mg/mL, dissolved in 1 mol/L NaHCO3) were added into the suspension. The mixture was incubated in a water bath at 37 °C for 2 h and then centrifuged at 6654 g for 10 min, and the supernatant was obtained for the small intestine digestion stage. For the large intestine digestion, the residue was resuspended in 20 mL distilled water and adjusted to pH = 4.0 with 6 mol/L HCl, and then 80 µL Viscozyme L was added and the mixture placed in water bath for 16 h before centrifugation. The mixture was centrifuged at 6654g for 10 min, and the supernatant was removed for later use. All of the supernatants mentioned above were stored at −20 °C until analysis. The release percentage (%) was defined as the amount of phenolic compounds obtained from each digested phase relative to the total phenolic compounds obtained from undigested group.
2.5 Determination of total phenolic content
The total phenolic content (TPC) was determined using a previous method, with minor modifications (Wang et al., 2018). The digestion system or extraction system (20 μL) containing Folin–Ciocalteu reagent (20 μL) was allowed to stand for 5 min, following that 5% Na2CO3 (160 μL) was added and mixed evenly and reacted for 60 min, avoiding the light at room temperature. The absorbance of the mixture was determined at 765 nm. A standard curve was drawn with the mass concentration of gallic acid solution (μg/mL) as the abscissa (x) and the absorbance value as the ordinate (y). The linear regression equation of gallic acid is y = 0.0043x + 0.0654 (R2 = 0.9995), with a linear range of 0.00–208.00 μg/mL.
2.6 Determination of total flavonoid content
The total flavonoid content (TFC) was determined using the method of Wang et al. (2018), with a minor modification. The digestion system or extraction system (20 μL) containing 15 μL 5% (m/v) NaNO2 was mixed evenly and reacted for 6 min at room temperature. Immediately, 15 μL 10% AlCl3·6H2O was added and reacted for 5 min, following which 100 μL 1 mol/L NaOH was added before measurement at 510 nm. The standard curve was drawn with catechin concentration (μg/mL) as the abscissa (x) and absorbance value as the ordinate (y). The linear regression equation of catechins is y = 0.001x + 0.003 (R2 = 0.996), with a linear range of 3.125–200.000 μg/mL.
2.7 Determination of antioxidant activity
2.7.1 ABTS•+ radical-scavenging capacity assay
The scavenging activity of the ABTS•+ radical cation (ABTS•+) was determined according to the method of Loizzo et al. (2016), with a slight modification. Briefly, 20 μL of digestion solutions from the above steps in Section 2.4 and 20 μL of distilled water were added to 160 μL of the freshly prepared ABTS•+ solution and mixed immediately. The reaction mixture was kept at room temperature in darkness for 6 min, and the absorbance at 734 nm was subsequently recorded. The mass concentration of Trolox was used as the abscissa (x) and the absorbance value as the ordinate (y) to produce the standard curve, and the regression equation was obtained: y = 0.0138x − 0.0068 (R2 = 0.9991) with a linear range of 0.90–57.38 µg/mL. Results were expressed as μg Trolox equivalent (TE)/g dry weight (DW) sample.
2.7.2 DPPH• radical scavenging activity
The DPPH• radical scavenging activity was determined according to the method of Loizzo et al. (2016), with a slight modification. 10 μL of digestion solutions from the above steps in Section 2.4, diluted to the appropriate ratio, was added to 100 μL of the prepared 0.2 M DPPH• solution (dissolved in methanol). The mixture was then kept in the dark for 30 min at room temperature. The absorbance was subsequently measured at 517 nm. The standard curve was made using the mass concentration of Trolox as the x-coordinate (x) and the absorption value as the y-coordinate (y), and the regression equation was obtained: y = 0.9472x − 2.95 (R2 = 0.999) with a linear range of 14.15–107.46 μg/mL. Results were expressed as μg Trolox equivalent (TE)/g dry weight (DW) sample.
2.8 Determination of characteristic phenolic compounds
The characteristic phenolic compounds were determined according to the method of Deng et al. (2021), with a slight modification. The characteristic phenolic compounds in each digestion stage or extraction system were measured using a high-performance liquid chromatography (HPLC) instrument (Agilent LC1290 series, equipped with a diode array detector (DAD), Agilent Technologies, USA). A Waters BEH C18 column (100 mm × 2.1 mm, 1.7 μm particle size, Waters Technologies, USA) was used. 3 mL of digestion solution was freeze-dried and dissolved in 1 mL methanol, and then sample was analyzed after filtration with a 0.22 μm microporous filter membrane. The mobile phase consisted of 0.1% formic acid in water (solvent A) and acetonitrile (solvent B). The gradient program was set at 0–2 min (5–10% B), 2–10 min (10–20% B), 10–15 min (20–40% B), 15–17 min (40–70% B), 17–18 min (70–95% B), and 18–20 min (95% B) using a flow rate of 0.3 mL/min. The column temperature was 30 °C, the injection volume was 1 μL, and the detection wavelengths were 320 nm and 350 nm. The linearity was assessed by analyzing five different concentrations of the standard solutions of the four compounds in triplicate. Their concentration ranges were shown in Supplementary Table 1.
2.9 Statistical analysis
All tests were performed in triplicate unless otherwise specified. The data were evaluated by analysis of variance (ANOVA), and a comparison of means was carried out using Duncan's test. Differences were considered to be significant at P < 0.05. Statistical computation and analyses were conducted using SPSS software (version 17.0, SPSS Inc., Chicago, IL, USA).
3 Results and discussion
3.1 Effects of processing and in vitro digestion on TPC and TFC
The changes in TPC after processing and in vitro digestion were indicated in Fig. 1. HB was rich in phenolic compounds (4.14 mg/g DW), which is consistent with an earlier report (Zhu et al., 2015). For undigested group, TPC of traditional processing treatment was decreased by 27% and 10% for steaming and roasting, respectively. Compared to HB (4.14 mg/g DW), SHB (3.01 mg/g DW) exhibited significantly lower content of TPC, this may be due to that some phenolic compounds in materials were leached into the water or decomposed by high temperature (Sengül et al., 2014). Researches indicated that the leaching of phenolic compounds in the boiling water can occur during cooking, decreasing free phenolic acids content (Acosta-Estrada et al., 2015; Martini et al., 2017). Interestingly, RHB was comparable to HB in TPC (P > 0.05), that maybe because high molecular weight phenolic compounds were broken into lower molecular weight oligomers under low water content and high temperature conditions, further led to polymerization in roasting process (Wang et al., 2014; Chen et al., 2020).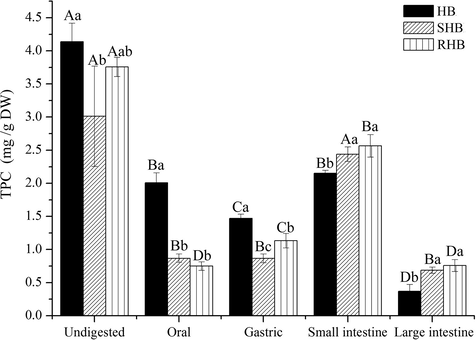
The total phenolic content (TPC) of hulless barley after simulated in vitro digestion. HB, raw hulless barley; SHB, steamed hulless barley; RHB, roasted hulless barley. a–cData bearing different lowercase letters in the same digesttion stage group are significantly different (P < 0.05). A–DData bearing different capital letters in the same sample groups are significantly different (P < 0.05).
For the digestion process, a significant release of phenolic compounds in HB, SHB, and RHB was detected during simulated in vitro digestion. The total released TPC obtained in each digestion phases were 6.00 mg/g DW for HB, 5.20 mg/g DW for RHB, and 4.84 mg/g DW for SHB. Compared to undigested group, in vitro digestion contributed to the release of TPC, which were increased by 1.45-fold in HB, 1.39-fold in RHB, and 1.61-fold in SHB. Combined with the TPC of undigested group and total released content obtained from each phase, it suggested that roasting may be a better processing method than steaming.
Considering the short digestion time, HB (2.00 mg/g DW) was still evidently higher than SHB (0.87 mg/g DW) and RHB (0.75 mg/g DW) during the oral phase. For HB, SHB, and RHB, it was found that only 33.50%, 17.85%, and 14.40% of TPC were released, respectively. However, other studies found that more than 65% of total phenolics in Chinese hawthorn and quinoa were released during simulated oral phase (Zheng et al., 2018; Pellegrini et al., 2017). The differences in the released amounts of these phenolics may be due to their biological activities and properties (Qin et al., 2018). The released content of HB, SHB and RHB in the gastric stage was slightly lower than that in the oral stage. However, many studies have found that the highest released content of phenolic compounds is mainly achieved in the gastric phase, as pepsin can aid in the release of some phenolic compounds that bind to carbohydrates in the low pH environment (Bouayed et al., 2011; Gumienna et al., 2011). Besides, other researchers have also found that certain phenolic substances may be lost in the stomach (Tenore et al., 2015). The released content of TPC in small intestine for the three HB, SHB, and RHB were 2.15, 2.44, 2.56 mg/g DW, respectively, which accounted for 35.86%, 50.21%, and 49.28% of total phenolic compounds in four digestion stages. However, the cumulative amounts (oral and gastric stages) of released TPC in HB, SHB and RHB accounted for 58.10%, 35.66%, and 36.16%, respectively. It was obvious that small intestine released the highest amounts of TPC except HB. This may be due to the processing changed the bioactive compositions and properties (Sengül et al., 2014). During large intestine phase, there was still a little release of phenolic compounds in three ones (HB, SHB and RHB), in which 6.13%, 14.13%, and 14.56% of TPC were released, respectively.
The variation tendency of TFC differed slightly from TPC (Fig. 2). For undigested group, both steaming and roasting influenced TFC, as observed for TPC. However, a small number of flavonoids was released after digestion in the following order: oral > gastric > small intestine > large intestine. After oral digestion, the released content of TFC in HB, SHB, and RHB was 0.23 mg/g DW, 0.34 mg/g DW, and 0.27 mg/g DW, respectively. Only 15%, 30%, and 29% of the total flavonoids were released for HB, SHB, and RHB in oral phase. After gastric digestion, 11%, 25% and 26% of the total flavonoids were released for HB, SHB, and RHB. After small intestine digestion, 8%, 12% and 16% of the total flavonoids were released for HB, SHB, and RHB. After large intestine digestion, release percentage was 3%, 3% and 6% for HB, SHB, and RHB. Above all, the total release percentage of flavonoids obtained from each digestion phases were 74.14% for SHB and 78.22% for RHB, being much higher than that of HB (37.25%), which suggested that the flavonoids were more likely to be released after steaming and roasting, and that thermal process may help to release bound flavonoids (Ti et al., 2015).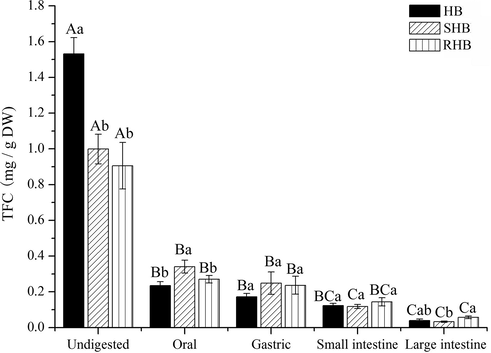
The total flavonoid content (TFC) of hulless barley after simulated in vitro digestion. HB, raw hulless barley; SHB, steamed hulless barley; RHB, roasted hulless barley, a–bData bearing different lowercase letters in the same digesttion stage groups are significantly different (P < 0.05). A–CData bearing different capital letters in the same sample groups are significantly different (P < 0.05).
3.2 Effects of processing and in vitro digestion on characteristic phenolic compounds
To investigate the changes in monomeric phenolic compounds in HB, SHB, and RHB, five characteristic compounds were tested (Table 1 and Supplementary Fig. 3), including ferulic acid, luteolin-7-O-glucouronide, chrysoeriol-7-O-glucouronide, luteolin, and chrysoeriol. Many studies have indicated that ferulic acid and p-coumaric acid were main phenolic compounds in hulless barley (Shen et al., 2016; Zhu et al., 2015). However, in our study, we determined far more chrysoeriol and chrysoeriol-7-O-glucouronide in hulless barley. It may be due to the different variety of hulless barley. For the undigested group, HB possessed significantly higher (P < 0.05) contents of ferulic acid, luteolin-7-O-glucouronide, chrysoeriol-7-O-glucouronide, and luteolin. Some researches had indicated that thermal treatment might damage cell walls, causing a greater release of antioxidant components compared with raw hulless barley material (Harakotr et al., 2014). Notably, the content of luteolin and chrysoeriol increased by 1.88 ug/g dw and 2.22 ug/g dw after roasting. In addition, results also reflect that the thermal stabilities of ferulic acid, chrysoeriol-7-O-glucouronide, and luteolin-7-O-glucouronide were lower than that of luteolin and chrysoeriol in this research. A similar phenomenon was also observed in the study by Hithamani and Srinivasan (2014). a–cData bearing different lowercase letters in the same group (undigested, oral, gastric, small intestine, and large intestine) and different sample (raw hulless barley, steamed hulless barley and roasted hulless barley) are significantly different (P < 0.05); A–DData bearing different capital letters in the different group (undigested, oral, gastric, small intestine, and large intestine) and same sample (raw hulless barley, steamed hulless barley and roasted hulless barley) are significantly different (P < 0.05). – Not detected.
Stage
Ferulic acid
Luteolin-7-O-glucouronide
Chrysoeriol-7-O-glucouronide
Luteolin
Chrysoeriol
Undigested group
HB
9.22 ± 0.04Aa
69.30 ± 0.47Aa
412.13 ± 0.97Aa
18.29 ± 0.16Ab
41.17 ± 0.10Ab
SHB
7.11 ± 0.01Ac
61.76 ± 0.69Ab
382.19 ± 0.38Ac
18.61 ± 0.44b
41.93 ± 0.24Ab
RHB
7.96 ± 0.06Ab
62.20 ± 0.50Ab
396.91 ± 0.46Ab
20.17 ± 0.14a
43.39 ± 0.84Aa
Oral
HB
8.33 ± 0.66Aa
7.72 ± 1.08Bc
69.05 ± 9.40Bb
7.20 ± 0.35B
28.03 ± 1.81Ba
SHB
3.46 ± 0.26Bb
18.11 ± 1.66Ba
122.35 ± 9.75Ba
–
2.34 ± 0.27BCb
RHB
3.68 ± 0.33Bb
13.39 ± 1.35Bb
123.27 ± 12.51Ba
–
3.86 ± 0.35Bb
Gastric
HB
–
3.65 ± 0.27Ca
29.26 ± 2.75Da
2.30 ± 0.16C
2.54 ± 0.45Da
SHB
–
3.99 ± 0.43Ca
30.20 ± 2.95Da
–
1.16 ± 0.17Db
RHB
–
4.27 ± 0.64Ca
31.80 ± 3.54Ca
–
1.53 ± 0.25Cb
Small intestine
HB
–
4.71 ± 0.66Ca
46.84 ± 5.84Ca
2.04 ± 0.05C
5.96 ± 0.99Ca
SHB
–
4.15 ± 0.59Ca
46.51 ± 6.73Ca
–
3.01 ± 0.57Bb
RHB
–
4.39 ± 0.88Ca
42.36 ± 6.78Ca
–
2.91 ± 0.39Bb
Large intestine
HB
2.90 ± 0.24Ba
–
–
2.03 ± 0.19C
3.29 ± 0.84Da
SHB
2.04 ± 0.05Ca
–
–
–
2.11 ± 0.24Ca
RHB
3.09 ± 0.66Ba
–
–
–
3.59 ± 0.58Ba
For digested group, ferulic acid was only observed in the oral and large intestine digestion stages, and the total released content reached to 90%, 49%, and 46% for HB, SHB, and RHB. Study indicated that ferulic acids mainly combine with lignin, cellulose, arabinoxylan and polysaccharides, and polysaccharide can be hydrolyzed during large intestine phase and oral phase (Li et al., 2019b). In addition, our study was the first to determine the presence of chrysoeriol-7-O-glucouronide in hulless barley (Deng et al., 2021). The content of chrysoeriol-7-O-glucouronide was higher than traditional phenolic acids (ferulic acid) and flavonoids (luteolin). Both chrysoeriol-7-O-glucouronide and luteolin-7-O-glucouronide in SHB and RHB were more likely to be released during oral stage compared with HB, being 18.11 µg/g dw and 122.35 µg/g dw for SHB, and 13.37 µg/g dw and 123.27 µg/g dw for RHB. According to Table 1, the contents of chrysoeriol-7-O-glucouronide and luteolin-7-O-glucouronide were in the following order: oral > small intestine ≥ gastric, and they were not detected in the large intestine. This might be related to the low solubility of flavonoid glycosides under the acidic condition of pH = 4 (Sokolová et al., 2012). The total release percentage of chrysoeriol-7-O-glucouronide and luteolin-7-O-glucouronide obtained from four digestion phases were 35% and 23% for HB, 50% and 42% for SHB, and 49% and 35% for RHB. This indicated that prosessed hulless barley may promote the release of chrysoeriol-7-O-glucouronide and luteolin-7-O-glucouronide during in vitro digestion.
Luteolin was only found in HB at four digestion phases, and the highest quantity was detected at the oral digestion phase (7.20 µg/g dw), with a small and non-significant amount continuing to be released in the other stages (P > 0.05), indicating its complete transformation or decomposition in the thermal processings. Chrysoeriol was detected during all digestion phases for HB, SHB, and RHB, and the highest content was detected at the oral stage. The total released amounts of chrysoeriol obtained from four digesttion phase were 97%, 21%, and 27% of the methanolic extract for HB, SHB, and RHB.
As mentioned above, it should be emphasized that some phenolic compounds may be decomposed or converted into other chemical compounds, leading to a decrease or an increase in some specific compounds (Zheng et al., 2018). In general, although thermal treatment reduced the contents of phenolic compounds (Fig. 1), interestingly, bound phenolic compounds contribute a greater proportion of TPC in cereal, suggesting that cereals may deliver a high level of phenolics to the colon, thus exerting health benefits (Das and Singh, 2015). The total released content of the five phenolic compounds obtained from four digestion phase was 41%, 47%, and 45% of the methanol extraction for HB, SHB, and RHB, which indicated that in vitro digestion could contribute to the release of some phenolic compounds.
3.3 Effects of processing and in vitro digestion on antioxidant activity
The antioxidant activities of hulless barley were determined by ABTS•+ and DPPH• assays. As seen from Fig. 3A, the ABTS•+ antioxidant capacity of HB (1438.05 ug TE/g DW) was obviously higher than that of SHB (935.24 ug TE/g DW) and RHB (945.57 ug TE/g DW) for undigested group. Thermal processings caused the active substances to decompose or react with other chemicals, thus reducing the antioxidant capacity (Chen et al., 2020). For digested group, the order of antioxidant capacity was undigested > oral > small intestine > gastric > large intestine. This is contrary to some in vitro digestion studies that have detected the highest antioxidant capacity in the stomach and small intestine (Qin et al., 2018). It is possible that more free phenols were dissolved immediately and released, and more bound phenols (such as ferulic acid) were also released by amylase during oral digestion (Lindeboom et al., 2005). Similar result was also reported in which Papillo et al. (2014) pointed out that study found total antioxidant capacity of five plant foods was higher after enzyme treatments, and Zheng et al. (2018) indicated that simulated digestion system may promote the release of antioxidant components to possess higher antioxidant activity. As ABTS•+ antioxidant capacity is related to TPC, Pearson’s correlation coefficients (R) of 0.934 (P < 0.01), 0.758 (P < 0.05), and 0.816 (P < 0.05) were obtained for HB, SHB, and RHB, respectively. This indicated strong correlations between total phenolics and total antioxidant activity.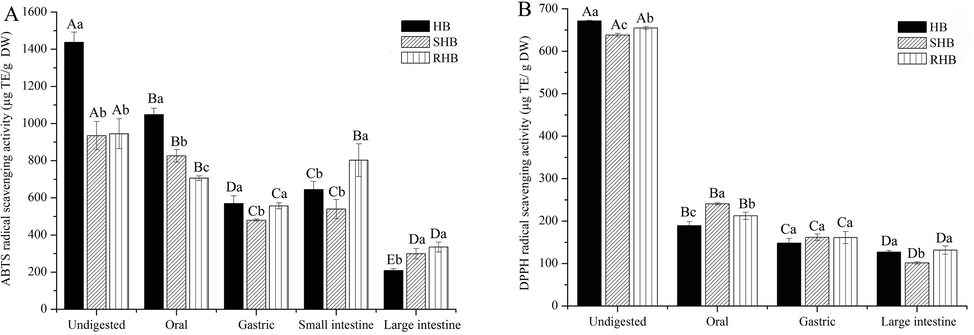
The antioxidant activity of the soluble fractions obtained from three hulless barley after in vitro digestion. HB, raw hulless barley; SHB, steamed hulless barley; RHB, roasted hulless barley. a–cData bearing different lowercase letters in the same digestion stage groups are significantly different (P < 0.05). A–EData bearing different capital letters in the same sample groups are significantly different (P < 0.05).
The trend of DPPH• test results were largely consistent with that of the ABTS•+ assay in terms of digestion stage, the order of antioxidant capacity was undigested > oral > gastric > large intestine (Fig. 3B). In terms of processing, DPPH• antioxidant activity of HB, SHB and RHB in same digestion stage had no obvious difference (Fig. 3B) compared to ABTS•+. This is possibly ascribed to the fact that ABTS•+ and DPPH• methods are based on different mechanisms and ABTS•+ radical is its high reactivity, and thus more likely to react with a broader range of antioxidants (Mareček et al., 2017). The value of DPPH• antioxidant activity cannot be determined in the small intestine solution, which may be due to the effect of cholate (Olszow, 2019). For undigested group, it is evident that HB had higher DPPH• antioxidant activity than that of SHB and RHB, whereas RHB had higher antioxidant activity than SHB in only DPPH• antioxidant activity, in which it may be that high temperature had different effects on the antioxidant activity of hulless barley. Digested hulless barley had lower antioxidant activities than undigested group, which is consistent with the report of Rodríguez-Roque et al. (2013). Phenolic compounds contribute to antioxidant activity, but few studies have examined the antioxidant activity in hulless barley after steaming, roasting, and in vitro digestion. The results of this study indicated that thermal processing could reduce the antioxidant activities, whereas roasting resulted in higher antioxidant activities than that of steaming did. The antioxidant components of hulless barley were mainly released during oral and small intestine digestion stages, but this was only observed for ABTS•+ assay. Finally, digested hulless barley had lower antioxidant activity than that of undigested group.
3.4 Correlation analysis
A Pearson’s correlation coefficient analysis was applied to elucidate the correlation coefficients between phenolic contents and antioxidant activities of HB, SHB, and RHB after processing and in vitro digestion. The results of the correlation analyses were shown in Table 2. Ferulic acid (ABTS: R = 0.709, P < 0.01; DPPH: R = 0.767; P < 0.01), chrysoeriol-7-O-glucouronide (ABTS: R = 0.780, P < 0.01; DPPH: R = 0.994; P < 0.01), luteolin (ABTS: R = 0.715, P < 0.01; DPPH: R = 0.957; P < 0.01), chrysoeriol (ABTS: R = 0.768, P < 0.01; DPPH: R = 0.917; P < 0.01), and luteolin-7-O-glucouronide (ABTS: R = 0.766, P < 0.01; DPPH: R = 0.998; P < 0.01) showed significantly higher positive correlations with the ABTS•+ values and DPPH• values, suggesting that these compounds may be key substances for ABTS•+ and DPPH• radical scavenging activity. Additionally, higher positive correlations (R = 0.775, P < 0.01) were also observed between the DPPH• and ABTS•+ values, indicating that they exhibited strong consistency. The combination of the two assays indicated that ferulic acid, chrysoeriol-7-O-glucouronide, luteolin, chrysoeriol, and luteolin-7-O-glucouronide had the greatest influence on the antioxidant activity of HB, SHB, and RHB or their digested products. The significant and highly linear correlation between TPC (ABTS: R = 0.797, P < 0.01; DPPH: R = 0.934; P < 0.01), TFC (ABTS: R = 0.817, P < 0.01; DPPH: R = 0.955, P < 0.01), and antioxidant activity suggested the higher TPC and TFC, the stronger antioxidant activity. This was in accordance with the result of Section 3.3 and also observed by Li et al. (2019a) and Chen et al. (2019). Additionally, TPC, TFC, and the five phenolic compounds were also significantly positively correlated (P < 0.01). These observations showed that in vitro digested hulless barley had higher contents of phenolic compounds and higher antioxidant activity, indicating that phenolic compounds were mainly responsible for the antioxidant activity of hulless barley.
Phenolic compounds
TPC
TFC
Ferulic acid
Chrysoeriol-7-O- glucouronide
Luteolin
Chrysoeriol
Luteolin-7-O-glucouronide
ABTS•+
DPPH•
TPC
1
TFC
0.785**
1
Ferulic acid
0.543*
0.749**
1
Chrysoeriol-7-O-glucouronide
0.799**
0.954**
0.778**
1
Luteolin
0.814**
0.896**
0.825**
0.940**
1
Chrysoeriol
0.809**
0.866**
0.886**
0.910**
0.980**
1
Luteolin-7-O-glucouronide
0.795**
0.966**
0.777**
0.997**
0.946**
0.910**
1
ABTS•+
0.797**
0.817**
0.709**
0.780**
0.715**
0.768**
0.766**
1
DPPH•
0.934**
0.955**
0.767**
0.994**
0.957**
0.917**
0.998**
0.775**
1
3.5 Hierarchical cluster analysis (HCA)
In order to get more insight of the data in hulless barley following processing and in vitro digestion, HCA was used to analyze and construct a hierarchy of clusters for digested hulless barley. In HCA, clusters and sub-clusters were visualized in dendrograms, shown in Fig. 4. When TPC and TFC were used as the clustering variables, 15 samples were categorized into two groups. Among them, 12 hulless barley samples were grouped into cluster I, which were principally from the digested hulless barley. Digested hulless barley will release more bound phenolic compounds under the influence of enzymes. Thus, similar bioactive compositions and properties among the varied thermal treatment hulless barley samples may have contributed to their clustering in group I. Using the same squared Euclidean distance, group I was further divided into subgroup Ia and Ib. The contribution of the digestion process to distinguishing the samples was also assessed from the HCA results. Thus, the digestion phase of hulless barley may be an important factor contributing to its bioactive compositions and properties based on TPC and TFC analysis. Furthermore, three hulless barley samples grouped closely into cluster II, which were from the undigested hulless barley. Using the same squared Euclidean distance, group II was further divided into subgroup IIa (SHB and RHB) and IIb (HB), which can be attributed to the decrease in both TPC and TFC under heat treatment. These results also implied that thermal processing and in vitro digestion may play an important role in TPC and TFC in hulless barley.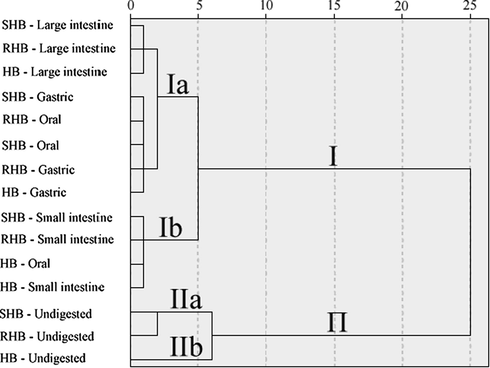
HCA of the hulless barley after simulated in vitro digestion. HB, raw hulless barley powder; SHB, steamed hulless barley powder; RHB, roasted hulless barley powder.
4 Conclusion
Hulless barley contained more phenolic compounds, including ferulic acid, luteolin-7-O-glucouronide and luteolin, while we also found the significant presence of chrysoeriol-7-O-glucouronide in hulless barley. Thermal processing of hulless barley significantly affected TPC, TFC, as well as some phenolic compounds (such as ferulic acid, chrysoeriol-7-O-glucouronide, and luteolin-7-O-glucouronide), specially increased the contents of luteolin and chrysoeriol. However, in comparison to steaming, roasting process resulted in the higher TPC and TFC in undigested group, and total released content obtained from each phase in digested group. Rosting processing was beneficial for the conservation of phenolic compounds and antioxidant activity. The digestion process releases much more bound phenolic compounds , but may also resulted decompositions of some phenolic compounds under strong acidic or alkalic conditions. In summary, roasting process could be considered as a better daily thermal treatment for hulless barley than steaming in terms of phenolic compounds and their antioxidant activities.
Acknowledgements
This work was supported by Cooperation project between people's Government of Ganzi Tibetan Autonomous Prefecture and Sichuan Academy of Agricultural Sciences (2021), China; The Fund of Sichuan Science and Technology Program (Grant number 2019YFN0178), China.
Declaration of Competing Interest
The authors declare that they have no known competing financial interests or personal relationships that could have appeared to influence the work reported in this paper.
References
Appendix A
Supplementary material
Supplementary data to this article can be found online at https://doi.org/10.1016/j.arabjc.2021.103447.
Appendix A
Supplementary material
The following are the Supplementary data to this article:


