

Translate this page into:
Inhibition of gut bacterial β-glucuronidase by chemical components from black tea: Inhibition interactions and molecular mechanism
⁎Corresponding authors at: Dalian Key Laboratory of Metabolic Target Characterization and Traditional Chinese Medicine Intervention, College of Integrative Medicine, College of Pharmacy, Dalian Medical University, Dalian, China (X.Lv, J.Hou, X.-C. Ma). lvxia@dlnu.edu.cn (Xia Lv), houjie@dlmedu.edu.cn (Jie Hou), maxc1978@163.com (Xiao-Chi Ma)
-
Received: ,
Accepted: ,
This article was originally published by Elsevier and was migrated to Scientific Scholar after the change of Publisher.
Abstract
Gut bacterial β-glucuronidase is regarded as an important molecular target for several therapeutic applications. Inhibitors of β-glucuronidase can effectively alleviate the drug-induced gastrointestinal tract toxicity. In this study, the ethanol extracts of black tea was found to display significant inhibitory activities against Escherichia coli β-glucuronidase (EcGUS), and seven polyphenols including catechins and theaflavins were identified as the key components responsible for the strong inhibitory potency of black tea towards EcGUS. Among these seven identified naturally occurring inhibitors, (−)-catechin gallate (CG), theaflavin-3-monogallate (TF-3-G), theaflavin-3′-monogallate (TF-3′-G) and theaflavin-3,3′-digallate (TFDG) were more potent inhibitors of EcGUS compared with (−)-epicatechin gallate (ECG), (−)-gallocatechin gallate (GCG), and (−)-epigallocatechin gallate (EGCG). Furthermore, molecular docking and molecular dynamics simulation results further indicated that TFDG could bind in the cavity of EcGUS and interacted with key residues Ser360, Glu413 and Ile560 of EcGUS through hydrogen bonds. Taken together, these data offer important information for efficient development of black tea and its catechins and theaflavins constituents for treating drug-induced enteropathy.
Keywords
β-glucuronidase
Catechins
Theaflavins
Inhibitory kinetics
Molecular simulation

1 Introduction
β-Glucuronidases (EC 3.2.1.31, GUS) are classified into glycosyl hydrolase (GH) family 1, 2, 30, 79, 154 and GH-A clan, which have an abundant distribution in mammalian tissues, body fluids, and gut microbiota (Hassan et al., 2013; Naz et al., 2013). Gut bacteria GUS is involved in β-D-glucuronides deconjugation of both xenobiotic and endogenic compounds in the gastrointestinal tract, which has been implicated certain drug-induced toxicity in gastrointestinal tract, such as irinotecan (CPT-11) as anticancer agent (Pellock & Redinbo, 2017; Ribeiro et al., 2016; Zhang et al., 2020). CPT-11, a prodrug used for the treatment of a range of solid tumors, is activated through hydrolysis to produce an active metabolite SN-38 to not only target the tumor cells but also cause the toxicity effect. SN-38 in vivo is further metabolized through uridine-disphosphate glucuronosyltransferases (UGTs) mediated glucuronidation, forming an inactive glucuronide metabolite SN-38G. In the opposite way, gut bacterial GUS participate in the reverse detoxification process that transform SN-38G back to its active as well as toxic form SN-38 through deglucuronidation reaction, triggering the gastrointestinal tract (GI) toxicity, especially late-onset diarrhea (Bailly, 2019; Chamseddine et al., 2019; Tobin et al., 2006). It is thus readily conceivable that the decreased activity of gut microbial GUS could ameliorate CPT-11-induced diarrhea, one of the most common adverse effects of CPT-11.
Recent studies have demonstrated that inhibition of gut microbial GUS could markedly alleviate the drug-induced GI tract toxicity (Bhatt et al., 2020; Cheng et al., 2019; Wallace et al., 2015; Wallace et al., 2010). In this scenario, more and more synthetic scaffolds serving as GUS inhibitors have been reported, considering their proven and encouraging potentials (Awolade et al., 2020; Roberts et al., 2013; Taha et al., 2019; Taha et al., 2018; Taha et al., 2020; Zhou et al., 2020). Among the previous reported synthetic GUS inhibitors, a successful example is a pyrazolo [4,3-c] quinolone derivative, evaluated to be an efficient inhibitor towards GUS and ideal application in reducing chemical-induced intestinal toxicity without altering the anti-tumor activity of CPT-11 (Cheng et al., 2017). In addition to the synthetic scaffolds, natural source especially food plants and herbal medicines are promising sources for discovering the potential GUS inhibitors (Karak et al., 2019; Wei et al., 2018). Recent studies showed that some natural occurring flavonoids displayed strong inhibitory effects on GUS with IC50 values less than 1.0 μM (Sun et al., 2020; Weng et al., 2017). Although a vast number of molecules whether synthesized or identified to target GUS with ideal inhibitory effects, only few of them could be subsequently used in clinic due to their poor pharmacokinetic profile (Awolade et al., 2020). Hence, much wider range of GUS inhibitor development is surely needed and urgent especially from natural sources, such as food plants and herbal medicines for the improvement of the clinical efficacy of the co-prescribed therapeutic agents.
Tea is the most widely consumed functional beverages in the world (Sotgia et al., 2018). The beneficial effects of it on human health, such as antioxidant, anticancer, anti-inflammation, and metabolic regulation have also attracted considerable attention worldwide (Hinojosa-Nogueira et al., 2021; Wang et al., 2020a; Wang et al., 2020b; Xu et al., 2020). Among the most frequently consumed teas, black tea is more popular than green tea and oolong tea, and black tea accounts for about 78% of the global tea consumption (Li et al., 2013; Sang et al., 2011). Black tea differs from other tea such as green, white and oolong tea not only in their fermentation degree, but also in their chemical components (Jin et al., 2020; Yang et al., 2021). Black tea also contains high amount of theaflavins in addition to catechins, and theaflavins constitute 0.3–1.5% of the dry weight of black tea leave (Tao et al., 2016; Zhao et al., 2020; Zhu et al., 2021). Interaction of tea chemicals and gut microbiota is mutual (Danneskiold-Samsoe et al., 2019; Makarewicz et al., 2021). Notably, the gut microbiota make an important contribution to the metabolism of tea phytochemicals, indirectly, tea and its metabolites can also tune the abundance and composition of the gut microbiota (Clarke et al., 2019; Koppel et al., 2017; Liu et al., 2020). However, whether black tea could alter the enzyme catalytic activity of gut microbiota has not been fully investigated. In our preliminary experiment, among 42 medicinal and edible plants, the ethanol extract of black tea displayed the strongest inhibitory effect on Escherichia coli β-glucuronidase (EcGUS), which elicited our interests in exploring the naturally occurring EcGUS inhibitors from this edible herbal.
In this study, catechins and theaflavins constituents of black tea were identified as a new class of naturally occurring inhibitors of EcGUS, inhibition effects and molecular mechanism of each identified EcGUS inhibitor in black tea were systemically characterized. More specifically, (−)-catechin gallate (CG), (−)-epicatechin gallate (ECG), (−)-gallocatechin gallate (GCG), (−)-epigallocatechin gallate (EGCG), theaflavin-3-monogallate (TF-3-G), theaflavin-3′-monogallate (TF-3′-G) and theaflavin-3,3′-digallate (TFDG) in black tea were identified to display evident inhibitory effects towards EcGUS activity. Among these seven naturally occurring inhibitors, CG, TF-3-G, TF-3′-G, and TFDG were found to be strong inhibitors of EcGUS with the inhibition kinetic parameters (Ki) values lower than 1.00 μM, while ECG, GCG, and EGCG displayed moderate inhibitory effects against EcGUS with the Ki values ranging from 2.21 to 14.06 μM. Furthermore, computational results suggested that TFDG could interact with key residues Ser360, Glu413 and Ile560 of EcGUS through hydrogen bonds. These findings would be helpful for the discovery and development of more effective catechins and theaflavins type inhibitors against EcGUS with better safety.
2 Material and methods
2.1 Chemicals and reagents
DDAO and DDAOG were chemically synthesized in our lab as previously reported (Feng et al., 2018). SN-38 was obtained from Dalian Meilun Biotech Co., Ltd (Dalian, China). SN-38G was purchased from Toronto Research Chemicals (Toronto, Canada). GUS (Escherichia coli) was obtained from Sigma-Aldrich (St. Louis, MO, USA). Mentha haplocalyx Briq (1), Cannabis sativa L. (2), Myristica fragrans Houtt. (3), Ziziphus jujuba Mill. var. spinosa (Bunge) Hu ex H.F.Chou (4), Sterculia Lychnophora Hance (5), Morus alba L. (6), Poria cocos (Schw.)Wolf (7), Houttuynia cordata Thunb. (8), Coix lacryma-jobi L (9), Gardenia jasminoides J.Ellis (10), Portulaca oleracea L. (11), Imperata cylindrical (L.) Raeusch (12), Hordeum vulgare L. (13), Nelumbo nucifera Gaertn. (14), Glycyrrhiza uralensis Fisch (15), Cirsium setosum (Willd.) MB. (16), Sesamum indicum L. (17), Citrus medica L. (18), Ginkgo biloba L. (19), Foeniculum vulgare Mill. (20), Keemun black tea (21), Angelica dahurica var. dahurica (22), Cassia obtusifolia L. (23), Perilla frutescens (L.) Britton. (24), Euryale ferox Salisb. (25), Allium macrostemon Bunge (26), Lonicera japonica Thunb. (27), Citrus medica L. (28), Chrysanthemum morifolium Ramat. (29), Crataegus pinnatifida Bunge (30), Taraxacum mongolicum Hand.-Mazz. (31), Raphanus sativus L. (32), Prunus mume (Siebold) Siebold & Zucc. (33), Phragmites communis Trin. (34), Prunus japonica Thunb. (35), Dioscorea oppositifolia L. (36), Dolichos lablab L. (37), Polygonatum odoratum (Mill.) Druce (38), Alpinia oxyphylla Miq. (39), Platycodon grandiflorum (Jacq.) A.DC (40), Polygonatum kingianum Collett & Hemsl. (41), and Pogostemon cablin (Blanco) Benth. (42) were purchased from Beijing Tongren Tang (Bejing, China). All other reagents were of analytical or HPLC grade.
2.2 Preparation of ethanol extracts of plants
The 42 commonly used dried plant materials (200 g) were crushed, grounded into powder, and transferred to 95% ethanol (50 mL), followed by ultrasonication extraction for three times in total 90 min. The supernatant of each extract was combined and concentrated in a rotary evaporator (EYELA, N-1300, Tokyo, Japan) yielding a total of 8–10 g of dry crude extract. Subsequently, the concentrated extracts (5 mg) were suspended in DMSO (250 μL) and the insoluble contents were removed by centrifugation for 5 min at 2000 g using eppendorf centrifuge 5804R (Hamburg, Germany). Then, the liquid supernatant was transferred to a 1.5 mL polyethylene tube (NEST Biotechnology) as stock solution (20 mg/mL) before EcGUS inhibition screening experiment using the high-throughput screening method.
2.3 Bioactivity-guided isolation of target compounds from black tea
Chemical fingerprinting and fraction collection procedures were the same as the previous publication (Tian et al., 2021), performed on a Waters Prominence UPLC system, equipped with a Waters sample manager FTN-R, a Waters quaternary solvent manager-R, and a Waters 2998 PDA Detector. Chromatograph column used was an Acquity UPLC HSS T3 C18 (2.1 × 100 mm, 1.8 µm). Mobile phase consisted of water/0.2% formic acid (A) and acetonitrile (B), and the effluent was monitored at 280 nm with LC-UV detection. After the establishment of the analytical method, the fractions were directly collected into the 96 well plates (Jet Biofil, Guangzhou) according to their retention time. After rotary evaporation, all the dried fractions were weighted and used for the assays of EcGUS inhibition. Fractions with potent inhibitory effects on EcGUS were further isolated and purified by the semi-preparative HPLC. Finally, the structures of purified compounds were identified by the spectral data (HRMS and NMR).
2.4 Inhibition assays using DDAOG hydrolyzation
DDAOG was used as a selective fluorescent probe substrate for detecting EcGUS activity. DDAOG was incubated with EcGUS (0.2 U/mL) in the presence or absence of different concentrations of molecules isolated from the procedures described above at 37 °C for 30 min. The negative controls (DMSO only) were also carried out under the same conditions. EcGUS activity was determined according to the previously published methods (Feng et al., 2018). In brief, supernatants were collected and 200 μL aliquots were loaded directly into the 96-well plate. Fluorescence was recorded using a Synergy H1 Hybrid Multi-Mode Microplate Reader (BioTek, USA), under the excitation wavelength of 600 nm and the emission wavelength of 660 nm. DDAO standard curve was used to quantify the concentration of DDAO in the reaction system.
2.5 Inhibition assays based on SN-38G hydrolyzation
To determine whether the inhibitory effects caused by the identified constituents on EcGUS were substrate dependent, we examined the inhibitory effects of these constituents on EcGUS activity using SN-38G as probe substrate (a classical drug substrate for EcGUS). Inhibition effects of the tea polyphenols on SN-38G hydrolyzation mediated by EcGUS were preliminary screened. A typical incubation mixture (total volume 0.2 mL) consisted of PBS buffer (pH 6.5, 100 mM), SN-38G (1 μM for inhibition screening; 0.25–2.0 μM for inhibition constant determination), and EcGUS (0.5 U/mL) in the presence or absence of different concentrations of tea polyphenols (0.2–40 μM). Each reaction was started by addition of 10 μL SN-38G, and then terminated by addition of an equal volume of ice acetonitrile after 30 min incubation. The protein was removed by centrifugation at 20,000 g for 20 min. The supernatant was analyzed by LC-MS.
2.6 Molecular docking
The 3D crystal structure of EcGUS (PDB code: 3K4D) was downloaded from Protein Data Bank (http://www.rcsb.org/structure/3K4D, code: 3K4D) (Wallace et al., 2010). PyMOL 2.4 was used to add non-polar hydrogen and remove water molecules. The cavity of EcGUS was set based on the site of the intrinsic ligand in 3D crystal structure of EcGUS, and the interactions of CG, ECG, GCG, EGCG, TF-3-G, TF-3′-G, and TFDG with EcGUS were analyzed by AutoDock 4.2 with default parameters.
2.7 Molecular dynamic simulation
The best pose of TFDG with EcGUS was used for molecular dynamics (MD) simulation by GROMACS 2018.6 package for further understanding of inhibitor-enzyme interaction mechanism. EcGUS and TFDG were prepared separately according to coordinate of the docked complex. The protein topology was defined based on the amber99sb force field (Hornak et al., 2006). The partial charge of TFDG was assigned according to AM1-BCC charges using antechamber module of AmberTool. The topology parameters were then generated by antechamber and ACPYPE programs. The topology of enzyme-inhibitor complex was assembled combining that of EcGUS and TFDG. A rectangular box with TIP3P water model was added around the complex with solvation thickness at least 1.2 nm. Na ions were added to ensure the neutrality. The production run was performed following a proper minimization to fully relax the prepared system. A total 20 ns molecular dynamic trajectory was sampled at isothermal–isobaric condition at 300 K. All the simulations were executed under periodic boundary conditions (PBC). The enzyme-inhibitor interaction at atomic-level was retrieved from the MD trajectory with analytic tools integrated in GROMACS.
2.8 Inhibition of EcGUS in living bacteria and fluorescence imaging
Escherichia coli DH5alpha BRL was cultured in nutrient broth (NB) at 37 °C. After the bacterial cells were grown to give an OD of 0.6–0.8, the bacterial cells were preincubated with CG, TF-3-G, TF-3′-G, and TFDG (10 μM, 20 μM, and 50 μM) for 2 h, and DDAOG (10 μM) was added to the incubation system for another 2 h. The final concentration of DMSO in the culture dishes was 0.45% (vol/vol). Fluorescence images of living bacteria after incubation with CG, TF-3-G, TF-3′-G, TFDG, and DDAOG were recorded in 96-well plates by an Amersham typhoon fluorescent image analyzer (GE Healthcare Bio-Sciences AB) (λex = 630 nm, λem = 655–685 nm).
2.9 Data analysis
IC50 values (half maximal inhibitory concentration) and Ki values (inhibition constant) were calculated by the nonlinear regression analysis of Graphpad Prism 7.0 (San Diego, CA, USA). The inhibition kinetic types including competitive inhibition (Eq. (1)), noncompetitive inhibition (Eq. (2)), or mixed inhibition (Eq. (3)) were determined according to the following equations. (He et al., 2020; Tian et al., 2018)
3 Results and discussion
3.1 Inhibition screening of medicinal and edible plants against EcGUS
The inhibitory effects of ethanol crude extracts of 42 medicinal and edible plants on gut bacterial GUS were firstly evaluated by using DDAOG as a specific fluorescent probe for EcGUS. As shown in Fig. 1a, upon addition of 100 μg/mL ethanol extracts, DDAOG hydrolysis by EcGUS was strongly inhibited (0–20% residual activity) by 5 edible plants including Nelumbinis Folium (B7), Glycyrrhiza uralensis Fisch (C1), Foeniculi Fructus (C6), black tea (C7) and Euryales Semen (D4), and the residual activities of EcGUS were 11.6%, 10.9%, 9.7%, 4.0% and 19.6%, respectively. Among all the edible plants investigated, the ethanol extract of black tea displayed the strongest inhibition towards EcGUS. As shown in Fig. 1b, the ethanol extract of black tea could inhibit EcGUS-mediated DDAOG hydrolysis in a dose-dependent manner with an IC50 value as low as 4.60 μg/mL, which was much lower than that of silymarin (794.62 μg/mL), a well-known inhibitor of EcGUS (Karak et al., 2017). These results strongly demonstrated that the ethanol extract of black tea could significantly inhibit EcGUS activity, and this edible plant might contain naturally occurring potent EcGUS inhibitors.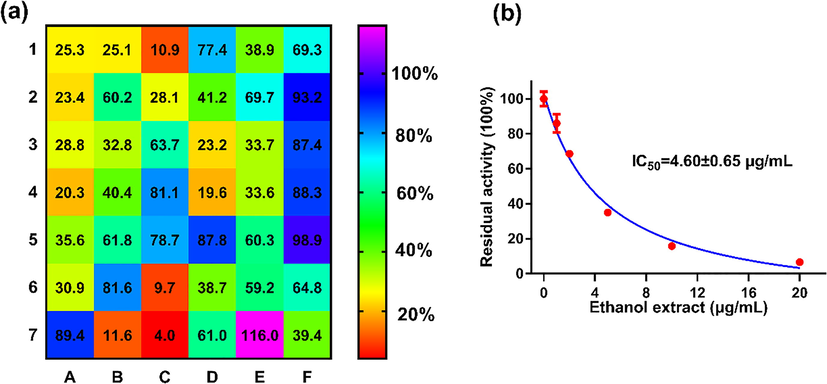
Inhibitory effects of the ethanol extracts of 42 common edible plants (a) and black tea ethanol extract (b) on EcGUS-mediated DDAOG hydrolysis. Each grid represented an edible plant, and the color of each grid represented the inhibitory activity of each edible plant. A1-A7, 1–7; B1-B7, 8–14; C1-C7, 15–21; D1-D7, 22–28; E1-E7, 29–35; F1-F7, 36–42.
3.2 Identification of the major EcGUS inhibitors in black tea
To identify the naturally occurring potent inhibitors in black tea, the ethanol extract of black tea was separated and fractioned using a simple LC-UV fingerprinting method. 45 eluted LC fractions were collected and dried for the evaluation of their inhibitory effects against EcGUS based on the high-throughput screening activity. Upon addition of each fraction, eleven major fractions (Fr. 17, 19, 24, 25, 26, 27, 28 and 30, 31, 32, 35) significantly inhibited EcGUS, while other fractions performed moderate or negligible inhibitory effects (Fig. 2). Combination the LC-UV fingerprinting with the EcGUS inhibition profile, seven bioactive components (structures are shown in Fig. 3) were isolated from the ethanol extract of black tea, and identified as CG, ECG, GCG, EGCG, TF-3-G, TF-3′-G, and TFDG, respectively, according to their NMR data (Fig. S1-S14).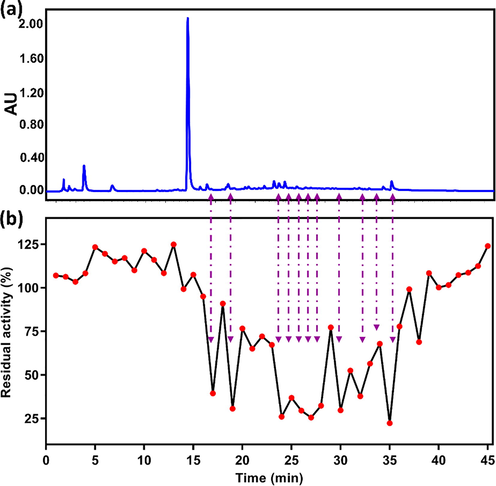
(a) UPLC-UV fingerprint of black tea extract monitored at 280 nm, and (b) the corresponding EcGUS inhibition profile of UPLC fractions collected at 60 s intervals.
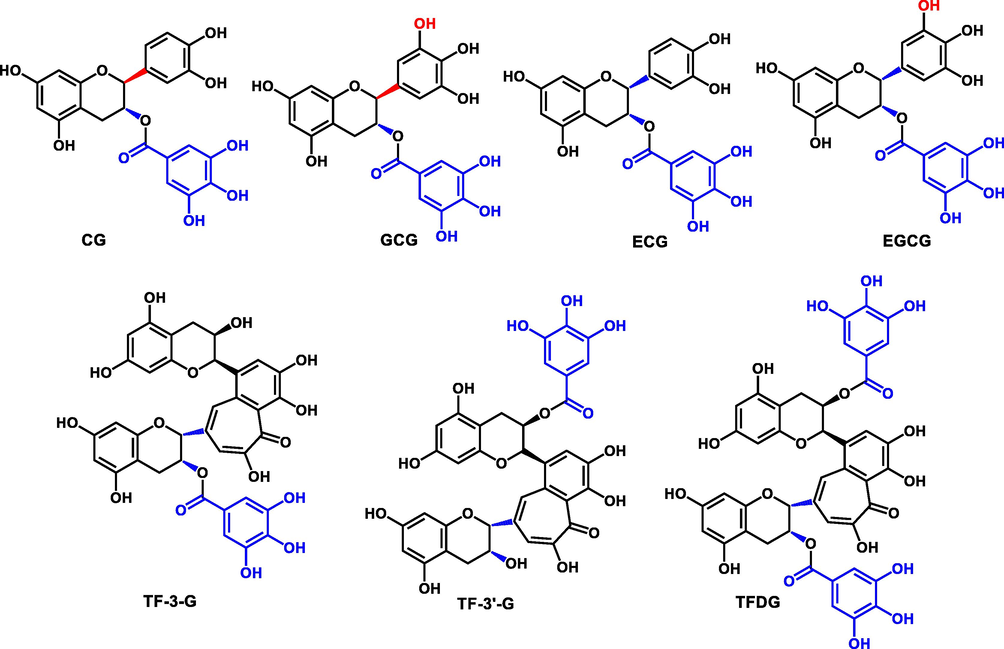
Chemical structures of CG, ECG, GCG, EGCG, TF-3-G, TF-3′-G, and TFDG.
3.3 Inhibitory effects of the seven identified constituents from black tea against EcGUS
In order to further validate and explore the inhibitory effects of the seven isolated constituents against EcGUS, two selective probe substrates for EcGUS, DDAOG, a specific fluorescent probe substrate reported previously, and SN-38G, a classical drug substrate for EcGUS, were used in parallel for charactering the inhibition behaviors. Three concentrations (1, 10, and 100 μM) gradients were used in the preliminarily screening experiments. As shown in Fig. 4, all the seven major natural occurring compounds in black tea displayed evident inhibitory effects against EcGUS. Upon addition of 10 µM CG, ECG, GCG, EGCG, TF-3-G, TF-3′-G, and TFDG, the residual activities of EcGUS-mediated deglucuronidation of DDAOG were reduced to be 16.0%, 37.2%, 41.4%, 58.6%, 5.8%, 5.6%, and 1.2% of the negative control, respectively. At 10 µM CG, ECG, GCG, EGCG, TF-3-G, TF-3′-G, and TFDG, the remaining activities of EcGUS-mediated deglucuronidation of SN-38G were measured to be 9.1%, 28.2%, 22.7%, 56.0%, 4.9%, 2.8%, and 4.4% of negative control, respectively.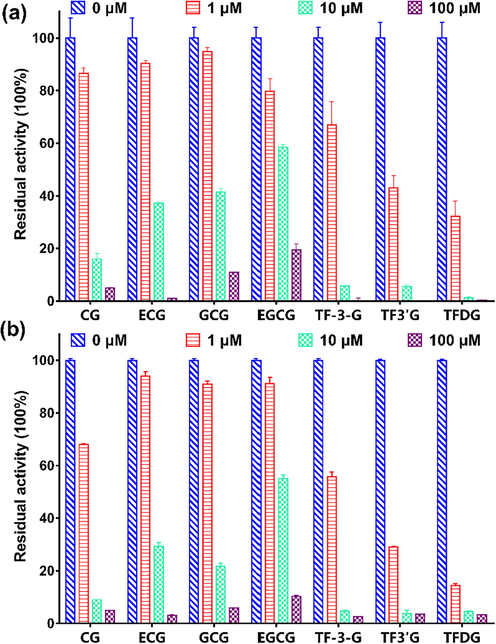
Inhibitory effects of CG, ECG, GCG, EGCG, TF-3-G, TF-3′-G, and TFDG against EcGUS-mediated DDAOG (a) and SN-38G hydrolysis (b).
To further investigate the inhibitory potentials of these polyphenol black tea constituents, their dose-dependent inhibition curves against EcGUS were depicted. As shown in Fig. 5, CG, ECG, GCG, EGCG, TF-3-G, TF-3′-G, and TFDG could inhibit the deglucuronidation of DDAOG by EcGUS in a dose dependent manner. The IC50 values of CG, ECG, GCG, EGCG, TF-3-G, TF-3′-G, and TFDG against EcGUS-mediated deglucuronidation of DDAOG were evaluated as 1.48, 6.94, 6.84, 14.86, 1.92, 1.03 and 1.41 μM, respectively (Table 1). Meanwhile, the dose-dependent inhibition curves of these constituents against EcGUS-mediated deglucuronidation of SN-38G were depicted in Fig. S15, with the IC50 values measured to be 0.77, 3.82, 2.64, 14.06, 1.39, 0.95 and 0.47 μM, respectively (Table 1). These results demonstrated that these seven inhibitors display evident concentration-dependent inhibitory behaviors against EcGUS mediated deconjugation reactions, and the IC50 values of CG, ECG, GCG, EGCG, TF-3-G, TF-3′-G, and TFDG against DDAOG hydrolyzation agree well with the IC50 values of these constituents against SN-38G hydrolyzation. It is worth noting that these compounds are the major polyphenol constituents in black tea and all these compounds display either strong or moderate inhibitory effects against EcGUS. These results indicate that these constituents may block out SN-38G hydrolyzation, and could subsequently reduce exposure of SN-38 in gastrointestinal tract after administration of black tea.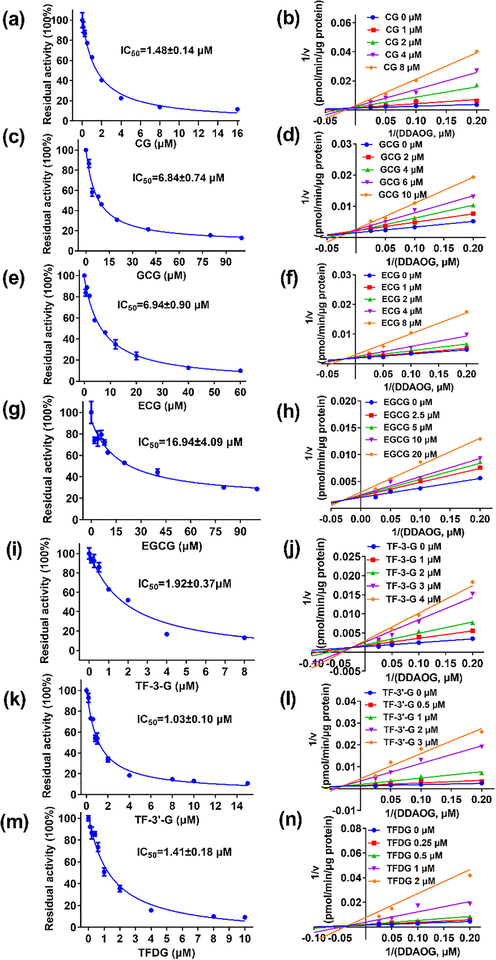
Inhibitory effects of the seven identified constitutes in black tea against DDAOG hydrolysis in EcGUS. Left: the concentration-dependent inhibition curves of CG (a), GCG (c), ECG (e), EGCG (g), TF-3-G (i), TF-3′-G (k), and TFDG (m). Right: the representative Lineweaver-Burk plots of CG (b), GCG (d), ECG (f), EGCG (h), TF-3-G (j), TF-3′-G (l), and TFDG (n).
Compound
Substrate
IC50 (μM)
Ki (μM)
Inhibition type
CG
DDAOG
1.48
0.59
Mixed
SN-38G
1.64
0.77
Competitive
ECG
DDAOG
6.94
2.21
Mixed
SN-38G
6.52
3.82
Competitive
GCG
DDAOG
6.84
2.42
Mixed
SN-38G
4.02
2.64
Competitive
EGCG
DDAOG
14.86
11.92
Mixed
SN-38G
16.52
10.71
Competitive
TF-3-G
DDAOG
1.92
0.87
Mixed
SN-38G
2.35
1.39
Competitive
TF-3′-G
DDAOG
1.03
0.31
Mixed
SN-38G
0.77
0.59
Competitive
TFDG
DDAOG
1.41
0.19
Mixed
SN-38G
0.48
0.47
Competitive
3.4 Inhibition kinetics of the seven identified constituents against EcGUS
To further characterize the inhibition behaviors and define the Ki values of these identified constituents towards EcGUS, inhibition kinetics experiment were carried out. As shown in Fig. 5, the Lineweaver-Burk plots demonstrated that CG, ECG, GCG, EGCG, TF-3-G, TF-3′-G, and TFDG followed the mixed inhibition behavior against EcGUS-mediated DDAOG hydrolysis, the Ki values for these molecules were determined as 0.59, 2.21, 2.42, 11.92, 0.87, 0.19, and 0.31 μM, respectively. Further kinetic analysis results showed that the inhibition types of CG, ECG, GCG, EGCG, TF-3-G, TF-3′-G, and TFDG belong to competitive form in EcGUS-mediated SN-38G hydrolysis inhibition (Fig. S15). The Ki values for these molecules, in this scenario were calculated to be 0.77, 3.82, 2.64, 14.06, 1.39, 0.47, and 0.95 μM, respectively, agreed well with the Ki values measured from DDAOG hydrolyzation inhibition.
Notably, these seven identified compounds displayed different inhibition types against EcGUS-mediated DDAOG (mixed inhibition) and SN-38G (competitive inhibition) hydrolysis. In addition, there was less than 2.5-fold difference in the Ki values of these natural inhibitors (except TFDG) against EcGUS-mediated DDAOG and SN-38G hydrolyses. The substrate dependent inhibition of these natural constituents could be partially attributed to the large differences in their structures and different interactions with EcGUS. From the view of chemical structure, SN-38G was a camptothecin derivative with a large structure possessing two carboxyl group and a free hydroxyl group, while DDAOG was a simple compound with a DDAO skeleton. In terms of interactions, DDAOG and SN-38G might bind with different regions of EcGUS, and the binding site of these seven inhibitors was likely to be partially overlapped with the binding site of DDAOG in EcGUS but these seven polyphenolic compounds might occupy the same binding site of EcGUS with SN-38G. Such results further demonstrated that these seven natural compounds displayed inhibitory effects on EcGUS even if two different probe substrates were used. Moreover, CG, TF-3-G, TF-3-G, and TFDG are more potent inhibitors towards EcGUS compared with ECG, GCG, and EGCG.
3.5 Structure-activity relationships of tea polyphenols against EcGUS
CG, ECG, GCG, EGCG, TF-3-G, TF-3′-G, and TFDG have the same parent nucleus flavanols but demonstrated varied inhibitory potency against EcGUS. All these polyphenols possessed a galloyl ester substituted on hydroxyl group at the 3 or 3′ position of C ring (Fig. 3), suggesting that the galloyl esters substitutions at the flavanol moiety may be essential for the potent inhibition towards EcGUS. Furthermore, TFDG with two galloyl esters-substituted on hydroxyl group of C ring displayed stronger inhibitory effects than the compounds with only one galloyl ester-substituted on hydroxyl group at the same position. Furthermore, TF-3′-G with one galloyl ester attached to 3′-position of C ring showed better inhibitory effects on EcGUS than TF-3-G with one galloyl ester attached to 3 position of C ring. The results suggested that the inhibitory effects of theaflavins on EcGUS may depend on the position and the number of galloyl esters substitution in their structure. Moreover, comparing the difference in structure and inhibitory activity of CG, ECG, GCG, and EGCG, it could be easily found that non-epicatechins were more beneficial than their epimers that are epicatechins for EcGUS inhibition, such as CG (Ki = 0.59 μM) VS ECG (Ki = 2.21 μM), GCG (Ki = 2.42 μM) VS EGCG (Ki = 11.92 μM). Interestingly, two hydroxyl groups at C-3′ and 4′ of B ring is more beneficial than three hydroxyl groups at the C-3′, 4′, and 5′ of B ring (pyrogallol) for EcGUS inhibition, such as CG (Ki = 0.59 μM) VS GCG (Ki = 2.42 μM), ECG (Ki = 2.21 μM) VS EGCG (Ki = 11.92 μM). Nevertheless, further studies are still needed to be investigated about the essential of galloyl esters substitutions at the flavanol moiety for the potent inhibition towards EcGUS.
3.6 Molecular docking study
Docking is a technology for the investigation of the interaction of small molecules with target proteins, and it is widely used in the flied of drug design. In order to reveal the potential interaction of tea polyphenols with GUS, we performed molecular docking study. CG, GCG, ECG, EGCG, TF-3-G, TF-3′-G, and TFDG displayed significantly inhibitory effects towards EcGUS in the EcGUS-mediated DDAOG hydrolysis with IC50 and Ki values ranging from 0.19 to 16.52 μM. The similar results were also observed in the EcGUS-mediated SN-38G hydrolysis (Table 1). As described in Fig. 5 and Fig. S15, they were all assigned as competitive or mixed competitive inhibitors, therefore, their interactions with EcGUS were analyzed based on the competitive-type strategy by AutoDock software in order to reveal the potential mechanism of CG, GCG, ECG, EGCG, TF-3-G, TF-3′-G, and TFDG with EcGUS. The aforementioned compounds could bond in the cavity of GUS and occupy this active pocket to prevent the EcGUS-mediated hydrolysis of DDAOG and SN-38G. As shown in Fig. S16A-G, CG, GCG, ECG, EGCG, TF-3-G, TF-3′-G, and TFDG could interact with EcGUS via the interaction forms of hydrogen bond, van der Waals, alkyl, π-π stacked and T-shaped, π-alkyl, and π-δ. More specifically, CG could form four hydrogen bonds with amino acid residues Glu413, Arg417, Met447, and Tyr472. GCG and ECG interacted with Glu413, Met447, and Tyr472 via hydrogen bonds, meanwhile GCG and ECG interacted with Ser360, and Ile363, respectively. EGCG and TFDG interacted with Glu413 and Met447 via hydrogen bonds. Except for the abovementioned compounds, TF-3-G could form three hydrogen bonds with Leu361, Met447, and Tyr469, and TF-3′-G interacted with Leu359, Asn369, and Arg417 via hydrogen bonds. These results help to explain the inhibition mechanisms of these molecules against EcGUS.
3.7 Molecular dynamics simulation
Among the investigated compounds, TFDG is a representative polyphenol derivative with two galloyl groups and exhibited the most potent inhibitory effect against EcGUS. Therefore, MD simulation was used for the investigation of the dynamical interaction of TFDG with EcGUS. In 20 ns of MD simulation, TFDG and EcGUS could form a stable complex with the potential energy of model system stabilized around − 1.38 × 10⁶ kJ/mol (Fig. 6A). Root mean square deviation (RMSD) is a crucial parameter to evaluate the stability of the simulated complex, and result of RMSD for GUS-TFDG was described in Fig. 6B. During 20 ns of MD simulation, RMSD remained under 2 Å indicating a stable simulation run of the tested system. Root mean square fluctuation (RMSF) for GUS residues was also acquired to figure out regions exhibiting higher flexibility (Fig. 6C). From the hydrogen bond analysis, it is worth noting that TFDG could form 1–6 hydrogen bonds, and interact with thirteen residues as Ser360, Gly362, Il363, Phe365, Glu366, Ala367, Glu413, Arg417, Met447, Trp471, Tyr472, Ser475, and Ile560 located in EcGUS during the simulation run. We further monitor the distances of these residues with TFDG. Results for this part are shown in Fig. 6D-G. From the time profiles of distances for the abforementioned residues with TFDG, an obvious variation was emerged at timestamp of 16 ns in the simulation. The distances of residue-TFDG pair for Gly362, Il363, Phe365, Glu366, Ala367, Arg417, Met447, Trp471, Tyr472, and Ser475 were measured from 4.5 Å to 14.5 Å, indicating that hydrogen bond interactions between these residues and TFDG were unreliable. On the other hand, Ser360, Glu413 and Ile560 kept close contact with TFDG as the measured distances converged under 3.5 Å in the whole simulation process, and their interaction with TFDG in the form of hydrogen bond are thus stable and reliable. After 20 ns MD run, the final frame of simulation has proved that TFDG still bonded in the GUS cavity, and interacted with Ser360, Glu413, and Ile560 through hydrogen bonds (Fig. 6H). These results clarify the role of residues Ser360, Glu413, and Ile560 in the inhibition of TFDG against EcGUS and suggest that TFDG could be considered as a potential agent for the development of EcGUS inhibitors.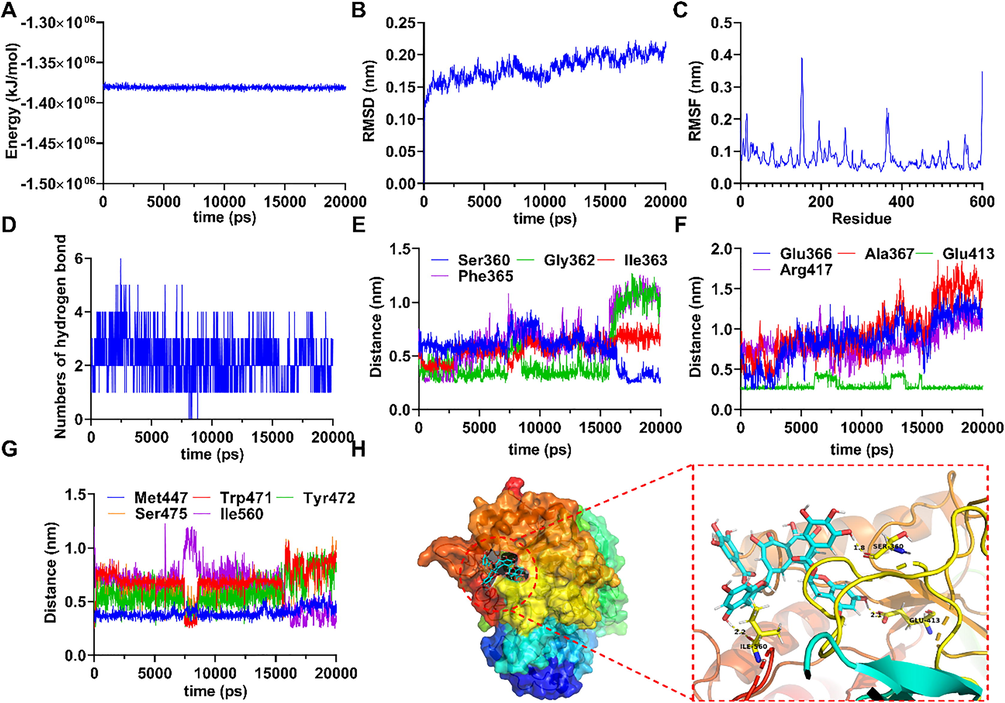
(A) The potential energy of TFDG with EcGUS in 20 ns of MD simulation. (B) RMSD of TFDG with EcGUS in 20 ns of MD simulation. (C) RMSF of TFDG with EcGUS in 20 ns of MD simulation. (D) The numbers of hydrogen bond in 20 ns of MD simulation. (E) The distances of TFDG with Ser360, Gly362, Ile363, and Phe365 of EcGUS. (F) The distances of TFDG with Glu366, Ala367, Glu413, and Arg417 of GUS. (G) The distances of TFDG with Met447, Trp471, Tyr472, Ser475, and Ile560 of EcGUS. (H) 3D structure of the complex of TFDG bounded EcGUS and their interaction form in the final frame of 20 ns MD simulation.
3.8 Inhibitory effects of the major EcGUS inhibitors isolated from black tea on endogenous EcGUS activity in living bacteria
To further evaluate the inhibition ability of the major EcGUS inhibitors in black tea on EcGUS in living bacteria, fluorescence imaging of living bacteria in the presence of each inhibitor was also performed. Escherichia coli DH5alpha BRL was selected in this experiment due to the high expression of GUS, and it is present in the human gastrointestinal tract. The fluorescence images of living bacteria after incubation with CG, TF-3-G, TF-3′-G, TFDG and DDAOG were recorded in 96-well plates by an Amersham typhoon fluorescent image analyzer. As shown in Fig. 7, there was an intense fluorescence emission after incubation with DDAOG (10 μM) at 37 °C for 2 h. In contrast, the fluorescence intensity reduction was observed in the presence of each tested compound at different concentrations, indicating that the endogenous GUS in Escherichia coli DH5alpha BRL were subject to inhibition by these natural components in black tea. Furthermore, increasing each inhibitor concentration led to a dose-dependent reduction of fluorescence intensity at 660 nm.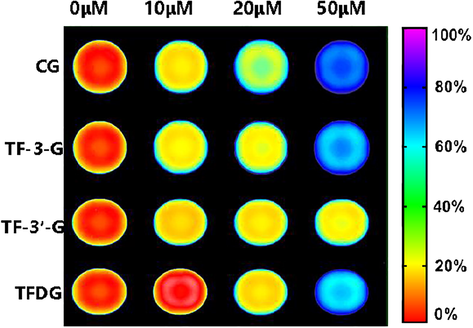
Inhibitory effects of CG, TF-3-G, TF-3′-G and TFDG on endogenous GUS activity in living bacteria Escherichia coli DH5alpha BRL. The bacterial cells were pre-incubated with each inhibitor (10, 20, and 50 μM) for 2 h, and DDAOG (10 μM) was added to the incubation system for another 2 h.
4 Conclusions
In summary, our results demonstrated that the ethanol extracts of black tea and its seven major catechins and theaflavins components exhibited significant inhibitory effects toward EcGUS. Based on the comparison of chemical fingerprint and EcGUS inhibition profile for all LC fractions, seven constituents from black tea were isolated and identified as CG, GCG, ECG, EGCG, TF-3-G, TF-3′-G and TFDG. Inhibition kinetic analysis demonstrated that these components displayed moderate to strong inhibitory effects on EcGUS. CG, TF-3-G, TF-3′-G, and TFDG were found to be more potent inhibitors of EcGUS compared with GCG, ECG and EGCG. Molecular docking studies and molecular dynamics simulation elucidated the potential structural determinants for their potent inhibitory effects toward EcGUS. In addition, structure-inhibitory activity relationship study revealed the important contribution of galloyl ester-substituted on hydroxyl group at 3 position of C ring to bacterial EcGUS inhibition. These findings provide important information for the discovery and development of more effective polyphenol-based inhibitors for EcGUS with safety consideration. The promising future for the applications of black tea and its major components in alleviating the gastrointestinal toxicity of SN-38 would also be reasonably expected.
Acknowledgements
This work was supported by the by the National Natural Science Foundation of China (No 82174064, 82160739), National Key R&D Program of China (2018YFC1705900), Dalian Science and Technology Leading Talents Project (2019RD15), Distinguished professor of Liaoning Province (XLYC2002008), Open Fund of Key Laboratory of Biotechnology and Bioresources Utilization, Ministry of Education, the Innovative Entrepreneurship Program of High-level Talents in Dalian (2016RQ025 & 2017RQ121), and Dalian Young Star of Science and Technology Project (2020RQ068).
Declaration of Competing Interest
The authors declare that they have no known competing financial interests or personal relationships that could have appeared to influence the work reported in this paper.
References
Appendix A
Supplementary material
Supplementary data to this article can be found online at https://doi.org/10.1016/j.arabjc.2021.103457.
Appendix A
Supplementary material
The following are the Supplementary data to this article:


