

Translate this page into:
KPNA2 promotes osteosarcoma growth and metastasis in a c-Myc-dependent manner via the hedgehog /GLI1 signaling pathway
⁎Corresponding author. liuruiping216@yahoo.com (Ruiping Liu)
-
Received: ,
Accepted: ,
This article was originally published by Elsevier and was migrated to Scientific Scholar after the change of Publisher.
Peer review under responsibility of King Saud University.
Abstract
Despite recent advances, the poor outcomes in osteosarcoma suggest that novel therapeutic targets are needed. Karyopherin alpha 2 (KPNA2) has been identified as a novel oncogene in many cancers. However, the function of KPNA2 in osteosarcoma and its relative mechanisms remain unclear. Herein, we reported that KPNA2 was highly expressed in osteosarcoma, which contributed to poor survival of patients. Knockdown of KPNA2 significantly suppressed osteosarcoma growth and metastasis in vitro and in vivo. Hedgehog/GLI1 was identified as the key effector pathway of KPNA2 in the study. Mechanistically, KPNA2 acts as a nuclear–cytoplasmic shuttle vehicle to transport c-Myc into the nucleus, where c-Myc binds to the promoter of GLI1 to trigger its expression. Besides, c-Myc can also transcriptionally regulate the expression of KPNA2, thus providing a positive feedback effect to amplify the pro-cancer signal further. In summary, our study revealed that KPNA2 promoted the growth and metastasis of osteosarcoma in a c-Myc-dependent manner via the hedgehog/GLI1 signaling pathway. Targeting KPNA2/c-Myc/GLI1 signal axis might provide a potential therapeutic target for the treatment of osteosarcoma.
Keywords
Osteosarcoma
KPNA2
c-Myc
GLI1
Tumor growth and metastasis

- KPNA2
-
Karyopherin alpha 2
- GEO
-
Gene expression omnibus
- NTS
-
Nuclear transport system
- NPC
-
Nuclear pore complex
- NTRs
-
Nuclear transport receptors
- NLSs
-
Nuclear localization signals, NESs, Nuclear export signals
- RANBP1
-
RNA binding protein
- siRNA
-
Small interfering RNA
- shRNA
-
Short hairpin RNA shRNA
- PI
-
Propidium iodide
- DAPI
-
4′, 6′-diamidina-2-phenylindole
- IHC
-
Immunohistochemistry, Co-IP, Co-immunoprecipitation
- ChIP
-
Chromatin immunoprecipitation
- RT-qPCR
-
Real- time quantitative PCR
- FITC
-
Fluorescein Isothiocyanate
- TUNEL
-
Terminal deoxynucleotidyl transferase mediated dUTP Nick End Labeling
- DEGs
-
Differentially expressed genes
Abbreviations
1 Introduction
Osteosarcoma is the most common primary malignant bone neoplasm, characterized by early recurrence and lung metastasis. It mainly occurs in children and adolescents, with a second peak after 50 years old (Kansara et al. 2014; Whelan and Davis 2018). The worldwide incidence of osteosarcoma is 1 to 4 per million persons per year (Ottaviani and Jaffe 2009). To date, the standard treatment for osteosarcoma includes extensive surgical resection and neoadjuvant chemoradiotherapy (Gaspar et al. 2021; Shiri et al. 2022). Although these therapy methods have drastically improved the overall 5-year survival rate of osteosarcoma, for relapse or metastasis patients, the 5-year overall survival rate is still less than 25 percent owing to the lack of effective targeted therapy (Meyers et al. 2011; Zhao et al. 2020). Therefore, it is imperative for us to elucidate and understand the molecular mechanism of osteosarcoma tumorigenesis and metastasis, to provide effective diagnosis and target therapy for osteosarcoma.
The nuclear transport system (NTS) consists of the nuclear pore complex (NPC) and nuclear transport receptors (NTRs); its main function is to exchange the substances needed for cellular activities between the nucleus and cytoplasm (Beck and Hurt 2017; Cautain et al. 2015). NTRs regulate cargo proteins shuttling through the NPC by recognizing their nuclear localization signals (NLSs) or nuclear export signals (NESs) (Baade and Kehlenbach 2019). Proteins with molecular weight less than 40 kDa can be transported through the NPC by passive diffusion, while larger proteins depend on active transport by NTRs (Beck et al. 2017). Therefore, NTRs play a vital role in the activity of signaling pathways regulated by macromolecules. Recently, studies have shown that NTRs are abnormally expressed in many cancers, and are closely related to tumorigenesis (Çağatay and Chook 2018). A study by Yang et al. showed that TNPO1 acted as an oncogene in gynecologic cancer, and that downregulation of TNPO1 could inhibit tumor growth (Yang et al. 2021). Yang et al. found that inhibition of KPNA4 attenuated prostate cancer metastasis (Yang et al. 2017). Thus, targeted regulation of NTRs expression may be an effective tumor therapeutic strategy. However, the regulatory mechanism of NTRs in carcinogenesis remains poorly understood, especially in osteosarcoma. To unveil the function of NTRs in osteosarcoma, we compared NRT-related genes in the osteosarcoma microarray dataset GSE87624. The result showed that only KPNA2 and RNA binding protein (RANBP1) were significantly upregulated in osteosarcoma. Subsequently, further analysis using the GSE21257 dataset demonstrated that KPNA2, but not RANBP1, was an independent prognostic factor for osteosarcoma.
KPNA2 (also known as importin α1) is one member of the importin α protein family, which weighs about 58 kDa and consists of 529 amino acids (Beck et al. 2017; Goldfarb et al. 2004). It is made up of an N-terminal hydrophilic domain (binding with importin β), a central hydrophobic region (binding the NLS of cargo proteins) and a short acidic C-terminus (still lacking reported function) (Chook and Blobel 2001; Harreman et al. 2003). Recent studies have shown that KPNA2 may function as an oncogene in cancers, including hepatocellular carcinoma, gallbladder cancer, etc. (Christiansen and Dyrskjøt 2013). In addition, a recent pathological study found that KPNA2 was frequently expressed in osteosarcoma, which is consistent with our bioinformatics analysis (Jiang et al. 2020). However, its biological function and molecular regulatory mechanism in osteosarcoma tumorigenesis and metastasis remain unclear.
In this study, we showed that KPNA2 contributed to osteosarcoma growth and metastasis by activating the hedgehog/GLI1 pathway. Further investigation of the molecular mechanism revealed that KPNA2 promotes GLI1 expression by carrying the oncogenic protein c-Myc into the nucleus. Interestingly, we also found that c-Myc can bind to the KPNA2 promoter to promote its transcription, thus forming a positive feedback effect to further amplify the pro-cancer signal. These results revealed a novel link between the hedgehog/GLI1 pathway and KPNA2-mediated growth and metastasis of osteosarcoma cells, which suggests that KPNA2 might be used as a potential therapeutic target for osteosarcoma.
2 Materials and methods
2.1 Cell culture
We obtained four human osteosarcoma cell lines (U2OS, 143B, HOS and MG63) and a human osteoblast cell line (hFOB1.19) from the Cell Bank of the Chinese Academy of Sciences (Shanghai, China). The U2OS cell line was cultured in McCoy’s 5A with 10% fetal calf serum at 37℃ and 5% CO2. The 143B, HOS and MG63 cell lines were cultured in MEM with 10% fetal calf serum at 37℃ and 5% CO2. The cell line hFOB1.19 was cultured in DMEM/F12 (1:1) with 10% fetal calf serum at 34℃ and 5% CO2.
2.2 The siRNA, shRNA and plasmid constructions
Small interfering RNA (siRNA) of KPNA2 (siKPNA2-1, siKPNA2-2, siKPNA2-3) and GLI1 (siGLI1-1, siGLI1-2, siGLI1-3) were synthesized by GenePharma (Shanghai, China), and siRNA of MYC (siMYC-1, siMYC-2, siMYC-3) was synthesized by RiboBio (Guangzhou, China). There siRNA fragments were designed and synthesized for each gene. All siRNA primers are listed in Additional file 2: Table S1. The overexpressed plasmid of KPNA2 (oeKPNA2) was synthesized by Genecopy (Guangzhou, China). Detail of the overexpressed plasmid are listed in Additional file 2: Table S2. The overexpressed plasmid and siRNA were transfected into osteosarcoma cells by jetPRIME (Polyplus Transfection, NY, USA). For the short hairpin RNA (shRNA), osteosarcoma cells were transfected with lentiviruses expressing shNC and shKPNA2 (shKPNA2-1, shKPNA2-2), which were constructed and packed by OBiO Technology (Shanghai, China). The detailed information is listed in Additional file 2: Table S3. Following this, puromycin was used to screen the infected cells.
2.3 CCK-8, colony formation and Edu assays
A CCK-8 kit was purchased from Vazyme (Nanjing, China). Target cells were planted into 96-well plates at a density of 2.5 × 10³ cells in 100 µL complete culture medium. After 24 h, 48 h, 72 h and 96 h, the absorbance was measured at 450 nm with a microplate reader (BioTek, Vermont, USA). The incubation time of the CCK-8 reagent was 2 h.
For colony formation, 1 × 10³ target cells (shNC, shKPNA2-1 or shKPNA2-2) were seeded into 6-well plates. Two weeks later, cells were fixed with 4% neutral paraformaldehyde and stained by 0.1% crystal violet. Photographs were taken and the colonies counted.
We performed the Edu assay using the Yefour 594 Edu Imaging Kit (Shanghai, China), following the reagent instructions. Briefly, 2 × 10⁴ target cells were seeded into 24-well plates. After 48 h, Edu working solution was added to each well and incubated for 2 h. Subsequently, the cells were fixed with 4% neutral paraformaldehyde and permeabilized with 0.3% Triton X-100. Thereafter, 300 µL Click reaction solution was added to each well and incubated in the dark for 30 min. Finally, the cells were stained by Hoechst 33,342 solution with a final concentration 5 µg/mL for 30 min. Photographs were taken with a fluorescence inverted microscope (Olympus, Tokyo, Japan).
2.4 Flow cytometry assay for cell cycle and apoptosis
For study of the cell cycle, a reagent kit was purchased from Share-bio (Shanghai, China). The experiment was performed according to the manufacturer’s instructions. Briefly, target cells were plated into 6-well plates, cultured for 48 h, and fixed with 75% ethanol overnight at −20℃. The cells were then incubated with propidium iodide (PI) staining solution for 30 min at room temperature. The red fluorescence was detected by flow cytometry (BD FACSAria Ⅱ, USA). The experimental results were analyzed using modfitLT 5 software.
The Annexin V-FITC/PI Apoptosis Kit (Vazyme, Nanjing, China) was used to evaluate cell apoptosis. Briefly, target cells were seeded into 6-well plates, cultured for 48 h, and stained with Fluorescein Isothiocyanate (FITC) and PI. The fluorescence intensity was detected by flow cytometry. The experimental results were analyzed using FlowJo™ 10 software.
2.5 Transwell and wound healing assays
A Transwell chamber (8 µm, Corning, NY, USA) was used to detect cell migration and invasion ability. For migration, 0.5 mL serum-free medium with 2 × 10⁴ suspended cells were added to the upper chamber, and 0.7 mL complete medium with 10% FBS was added to the lower chamber. After 24 h, the remaining cells in the upper layer were scraped off, fixed with 4% neutral paraformaldehyde, stained by 0.1% crystal violet and photograhed using inverted microscope. For invasion, a layer of diluted Matrigel (BD, California, USA) was coated on the membrane of the upper chamber in advance. The subsequent experimental steps were the same as for the migration experiment.
A wound healing assay was conducted to test cell migration ability. Briefly, the back of a 6-well plate was marked in advance, and then scratched with a 200 μL gun head. The cells were photographed with an inverted microscope at 0 h and 24 h.
2.6 Real- time quantitative PCR (RT-qPCR) assay
RT-qPCR related kits, including TRIzol, Reverse Transcription Kit and SYBR green qPCR mix Kit, were purchased from Share-bio (Shanghai, China). We performed this experiment following the reagent instructions. Briefly, the total RNA of the cells was extracted using TRIzol. After measuring the concentration, cDNA was synthesized using a Reverse Transcription Kit. RT-qPCR was conducted in a RT fluorescence qPCR instrument (ABI, CA, USA) with a SYBR green qPCR mix Kit. The results were presented using 2-ΔΔCt. All the primers were synthesized by Sangon Biotech (Shanghai, China) as shown in Additional file 2: Table S4.
2.7 Western blot analysis
Total protein was extracted using a RIPA Kit. The Nuclear and Cytoplasmic Protein Extraction Kit was used to obtain nuclear and cytoplasmic proteins. We added protein extraction reagents, a protease and phosphatase inhibitor cocktail, during extraction of the proteins. Protein concentration was determined by a BCA Protein Kit. We used 10%–15% sodium dodecylsulphate-polyacrylamide gels for protein electrophoresis and polyvinylidene fluoride (PVDF) membrane for protein transfer in a wet manner. Following this, the PVDF membrane containing protein was blocked in 5% nonfat milk at room temperature for 1 h. After blocking, the membrane was incubated with primary antibodies (4℃ overnight) and secondary antibodies (room temperature for 2 h). Finally, the protein was imaged using the hypersensitive ECL chemiluminescence reagent. The above reagents and kits were purchased from Beyotime (Shanghai, China). The antibody information is listed in Additional file 2: Table S5.
2.8 Immunohistochemistry (IHC)
Paraffin-embedded human osteosarcoma tissue microarray was obtained from Taibosi Biotechnology Co., Ltd. (BON501, Xi’an, China). There were 50 samples in this study, containing 41 samples of osteosarcoma tissues and nine samples of normal tissues. This study was approved by the Ethics Committee of The Affiliated Changzhou No.2 People’s Hospital of Nanjing Medical University performed in strict accordance with the Declaration of Helsinki. All participants or their relatives signed informed consent documentation. Paraffin slides were deparaffinized, hydrated, incubated in 3% H2O2 and antigen repaired. After blocking, the slides were incubated with primary antibodies at 4℃ overnight. Then, the slides were counterstained with hematoxylin and dehydrated with ethanol. The IHC staining score was classified into four grades (ranging from 0 to 6) (Xiang et al. 2019) and evaluated by two independent pathologists.
2.9 Immunofluorescence
For the cell immunofluorescence experiment, target cells were seeded on 24-well plates with coverslips at density of 1 × 10⁴ per well. After 24 h incubation, the wells were fixed with 4% neutral paraformaldehyde, permeabilized with 0.1% Triton X-100 and blocked by 5% BSA. After blocking, the cells were incubated with primary antibodies at 4℃ overnight and secondary antibodies at room temperature for 2 h. Following this, the cells were incubated with 4′, 6′-diamidina-2-phenylindole (DAPI). Finally, the results were visualized using a fluorescence inverted microscope.
For the tissue immunofluorescence experiment, tissue microarray (same tissue chip used in IHC) was dewaxed, hydrated and antigen repaired. Subsequently, the slides were permeabilized with 0.2% Triton X-100 for 45 min. The remaining experimental steps were similar to those for cellular immunofluorescence.
2.10 Animal studies
U2OS and 143B cells were stably transfected with a Lentiviral vector of shKPNA2 (shKPNA2-1) or shNC. Female athymic BALB/C nude mice (about 5-weeks-old and 20 g) were randomly divided into four groups with five mice per group. For the subcutaneous xenograft model, 1.5 × 10⁶ target cells suspended in 200 μL PBS were injected subcutaneously into the of junction of the dorsolateral area and hindlimb. The growth of tumors was measured via the formula V = (W2 × L)/2 (W: width, L: length). For the lung metastasis model, target cells suspended in PBS were injected into the lateral tail vein. Four weeks later, all mice were euthanized using an overdose of the anesthetic agent. Subcutaneous tumors and lung metastases were removed, the basic index measured, and embedded for histopathological analysis. All the animal experiments were carried out in strict accordance with the guidelines of animal ethics approved by the Animal Ethics Committee of Nanjing Medical University.
2.11 Terminal deoxynucleotidyl transferase (TdT) mediated dUTP Nick End Labeling (TUNEL) assay
For the tissue apoptosis experiment, the TUNEL BrightRed Apoptosis Detection Kit was purchased from Vazyme (Nanjing, China). The experiment was performed according to the instructions. Briefly, paraffin slides were deparaffinized, hydrated, and permeabilized with proteinase K. The samples were balanced with Equilibration Buffer at room temperature for 20 min. After blocking, the samples were incubated with the TdT buffer and DAPI. The results were visualized using a fluorescence inverted microscope.
2.12 RNA high throughput sequencing analysis
U2OS cells were treated with siKPNA2 (siKPNA2-1) and siNC (in triplicate for each group). Total RNA was extracted using TRIzol (Share-bio, Shanghai, China). Subsequently, we sent the samples to LC-Bio Technology Co., Ltd (Hangzhou, China) for mRNA library construction and RNA sequencing. The filtered CleanData was mapped to the human genome (ftp://ftp.ensembl.org/pub/release-101/fasta/homo_sapiens/dna/). And Initial assembly and Fragments Per Kilobase Million (FPKM) quantification of genes were processed using Hisat2, StringTie and Ballgown. Subsequently, R packages “edgeR”, “GSVA”, “pheatmap”, etc. were used for data analysis.
2.13 Co-immunoprecipitation (Co-IP) assay
For Co-IP, the reagent kit was purchased from Bersin Bio™ (Guangzhou, China), and the procedure was conducted following the instructions. First, proteins were extracted from 2 × 10⁷ target cells using cell lysis buffer with protease inhibitors. Second, we divided the protein sample into three groups (Input group, IgG group and IP group) and incubated the IP group and IgG group with target antibody and IgG, respectively. Third, protein A/G-MagBeads were used to combine with antibodies. Fourth, prey and bait proteins were eluted from Protein A/G-MagBeads. Finally, western blot analysis was performed to visualize the result.
2.14 Chromatin immunoprecipitation (ChIP) assay
We performed this experiment according to the instruction manual, using the ChIP kit (Bersin Bio™, Guangzhou, China). Briefly, 2 × 10⁷ cells were crosslinked with formaldehyde, with a final concentration of 1%. The crosslinked cells were lysed with lysis buffer to prepare nuclei. Following this, the cells were disrupted by ultrasound to make DNA fragments of 300 bp–1,000 bp. The samples were divided into IP, IgG and Input groups. The corresponding ChIP level antibodies were added to the IP group and IgG group. Subsequently, Protein A/G-beads were added to the IP and IgG groups and incubated on a mixer at room temperature for 30 min. We used magnetic beads for elution and crosslinked the complex to obtain coprecipitated DNA. Finally, the co-precipitated DNA was analyzed by ChIP-PCR and ChIP-qPCR. Primer sequences of the promotors are listed in Additional file 2: Table S6.
2.15 Statistical analysis
Student’s t-test or Wilcoxon test was performed to analyze the differences between two groups. One/Two-way ANOVA was used to compare the differences among multiple groups. The chi square test was used for count data. Overall survival rates were analyzed by the Kaplan-Meier method. A receiver operating characteristic (ROC) curve was adopted to test the specificity and sensitivity of KPNA2. Multivariate Cox regression analysis was used to test the independent prognostic factors for osteosarcoma. All the data were presented as mean ± standard deviation (SD), and analyzed using GraphPad Prism 9.0, SPSS 23.0 and R (version 4.0.4) tools. Three independent experiments were performed, and P < 0.05 was considered as statistically significant. The symbol * means P < 0.05, ** means P < 0.01, *** means P < 0.001, and **** means P < 0.0001.
3 Results
3.1 KPNA2 was overexpressed in osteosarcoma and correlated with poor prognosis
The dataset GSE87624 for osteosarcoma was used to compare the expression of 29 NTR genes in osteosarcoma, which revealed that only KPNA2 and RANBP1 were significantly upregulated in osteosarcoma (Additional file 1: Fig. S1A, log (FC) > 1 and P-value < 0.05). Dataset GSE21257 contained relatively complete clinical data on the patients, and was used for subsequent analysis. Although both KPNA2 and RANBP1 were correlated with osteosarcoma prognosis (Fig. 1A and Additional file 1: Fig. S1B), only KPNA2 could serve as a robust independent prognostic factor for osteosarcoma (Fig. 1B, HR = 1.435, 95% CI 1.041–1.98, P = 0.027). The, ROC curve showed that the AUCs of time dependency for KPNA2 were 0.622, 0.749, and 0.729 at 1 year, 3 years, and 5 years, respectively (Fig. 1C), which indicated that KPNA2 had relatively high predictive sensitivity and specificity. Consequently, we used KPNA2 and clinical parameters to established a prognostic nomogram model via stepwise Cox regression for predicting 1-year, 3-year, and 5-year survival of individuals with osteosarcoma (Additional file 1: Fig. S1C). A calibration plot was used to confirm that the Nomogram exhibited high performance in predicting the survival of individuals with osteosarcoma (Additional file 1: Fig. S1D). Therefore, KPNA2 could serve as an effective indicator for predicting the survival of patients with osteosarcoma.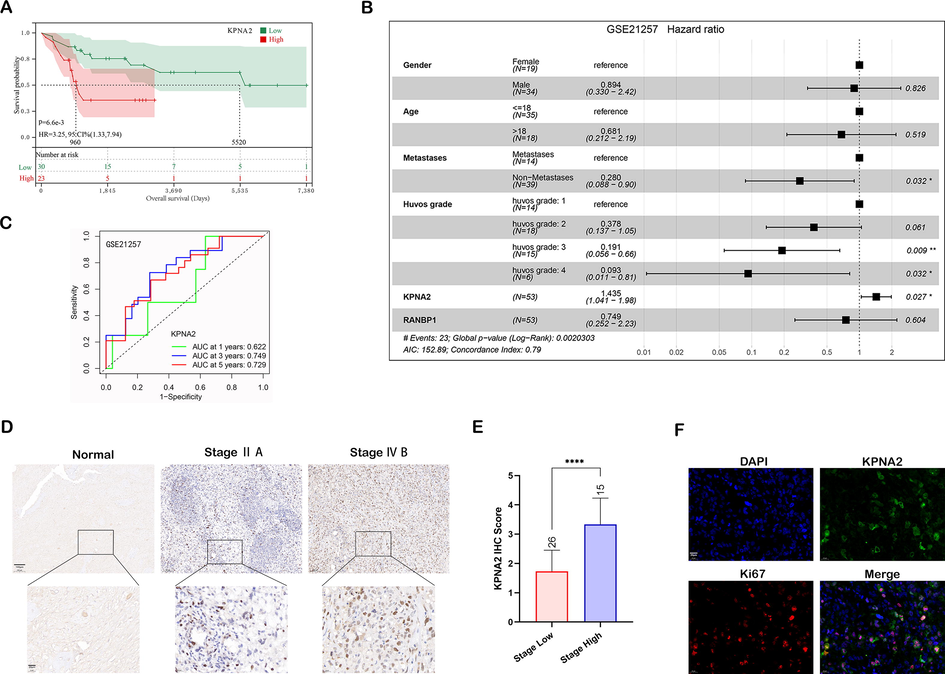
KPNA2 was overexpressed in osteosarcoma and correlated with poor prognosis. A The correlation between KPNA2 expression and osteosarcoma prognosis by Kaplan-Meier survival analysis. B Multivariate Cox regression analysis for clinical features, KPNA2 and RANBP1 in the GSE21257 dataset. C ROC curve for KPNA2 at 1, 3 and 5 years using the GSE21257 dataset. D Representative image of KPNA2 IHC staining in osteosarcoma TMA. Scale bar: 100 μm, upper; 20 μm, lower. E IHC staining score of KPNA2 expression compared between patients with high stage (stage ≥ ⅡB, n = 15) and low stage (stage < ⅡB, n = 26) osteosarcoma. F Osteosarcoma tissue immunofluorescence staining of Ki67 and KPNA2. Scale bar: 20 μm.
Moreover, IHC of osteosarcoma and adjacent normal tissues showed that KPNA2 was significantly upregulated in osteosarcoma, especially in high stage osteosarcoma samples (Fig. 1D and E). Immunofluorescent staining of Ki67 and KPNA2 further showed that the proliferative tumor cells tended to express greater amounts of KPNA2 (Fig. 1F), which illustrated that KPNA2 was positively correlated with tumor proliferation. Collectively, the abovementioned data indicated that KPNA2 may not only serve as an independent prognostic factor for osteosarcoma but may be used as an effective indicator for predicting the survival of patients with osteosarcoma.
3.2 KPNA2 promoted osteosarcoma growth in vitro and in vivo
Western blot analysis showed that KPNA2 was highly expressed in osteosarcoma cell lines, especially in U2OS and 143B cells, in contrast to hFOB1.19 (Additional file 1: Fig. S2A and B). To unveil the function of KPNA2 in osteosarcoma, knockdown of KPNA2 was conducted by siKPNA2, and validated by RT-qPCR (Additional file 1: Fig. S2C) and western blot (Additional file 1: Fig. S2D and E). To make the results more objective, two siRNA fragments (siKPNA2, siKPNA2-2) were used for the following experiments. KPNA2 knockdown significantly suppressed the proliferation of U2OS and 143B cells by CCK8 assay (Fig. 2A and B), Edu assay (Additional file 1: Fig. S2F and G) and colony formation assay (Fig. 2C and D). Cell cycle analysis revealed that the percentage of cells in the G2/M phase was significantly increased and that in the G0/G1 phase was reduced after KPNA2 knockdown, suggesting that some cells were blocked at the G2/M phase (Fig. 2E and F). Moreover, KPNA2 knockdown in U2OS and 143B cells could induce cell apoptosis, as validated by Annexin Ⅴ-FITC/PI analysis (Fig. 2G and H). In addition, RT-qPCR (Fig. 2I) and western blotting (Fig. 2J and K) further demonstrated the oncogenic properties of KPNA2 in osteosarcoma cells at the molecular level.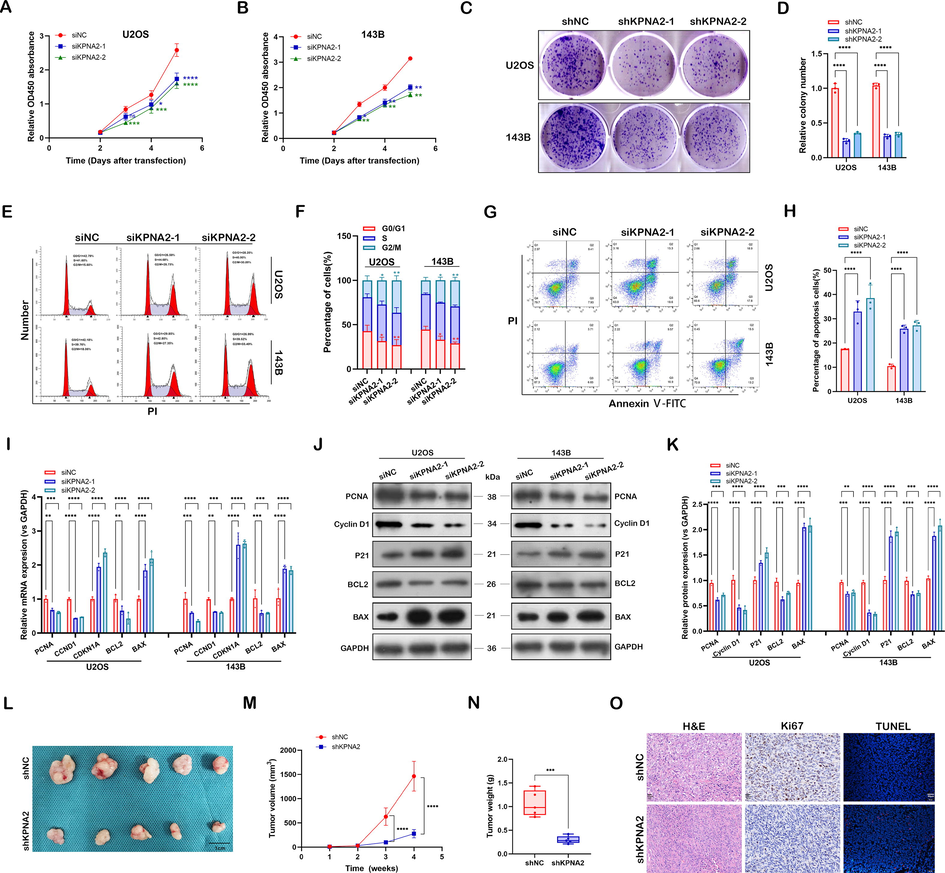
KPNA2 promoted osteosarcoma growth in vitro and in vivo. A and B Effect of KPNA2 knockdown (siKPNA2-1, siKPNA2-2) on proliferation in U2OS and 143B cells by CCK8 assay. C and D U2OS and 143B cells transfected with shNC or shKPNA2 were subjected to colony formation assay. E and F Effect of KPNA2 knockdown on cell cycle in U2OS and 143B cells by flow cytometry. G and H Cell apoptosis was measured in U2OS and 143B cells transfected with siNC or siKPNA2 by flow cytometry. I–K Proliferation, cell cycle and apoptosis-related genes were detected in U2OS and 143B cells using RT-qPCR and immunoblotting. L Image of subcutaneous tumors formed by transplanted U2OS cells transfected with shKPNA2 or shNC into nude mice. Scale bar: 1 cm. M Tumor growth curves of the two groups were measured and plotted. N Subcutaneous tumors were obtained and statistically analyzed at the fourth week. O H&E (Scale bar: 20 μm), Ki-67(Scale bar: 20 μm) and TUNEL (Scale bar: 50 μm) were used to stain the subcutaneous xenograft tumors from shNC and shKPNA2 groups.
Furthermore, to evaluate the effect of KPNA2 on tumor growth in vivo, a subcutaneous xenograft mouse model was constructed by transplantation of U2OS cells with shKPNA2 or shNC into nude mice. Compared with the shNC group, the shKPNA2 group exhibited significantly delayed tumor growth and decreased tumor burden (Fig. 2L–N). The IHC and TUNEL assays further verified that shKPNA2 weakened the growth of osteosarcoma in vivo (Fig. 2O). Together, these results revealed that KPNA2 promoted osteosarcoma growth by increasing cancer cell proliferation, abrogating cell arrest at G2/M phase and enhancing cells’ resistance to apoptosis.
3.3 KPNA2 promoted osteosarcoma metastasis in vitro and in vivo
We also evaluated the effect of KPNA2 on osteosarcoma metastasis. Based on the Transwell assay, KPNA2 knockdown significantly inhibited the invasion (Fig. 3A and B) and migration (Fig. 3C and D) abilities of U2OS and 143B cells. In a wound healing assay, siKPNA2 of U2OS (Fig. 3E and F) and 143B (Fig. 3G and H) cells presented delayed wound healing closure compared with siNC. We further demonstrated that KPNA2 could enhance osteosarcoma cell metastasis at the molecular level by RT-qPCR (Fig. 3I) and western blotting (Fig. 3J and K). Thus, KPNA2 promoted osteosarcoma metastasis in vitro.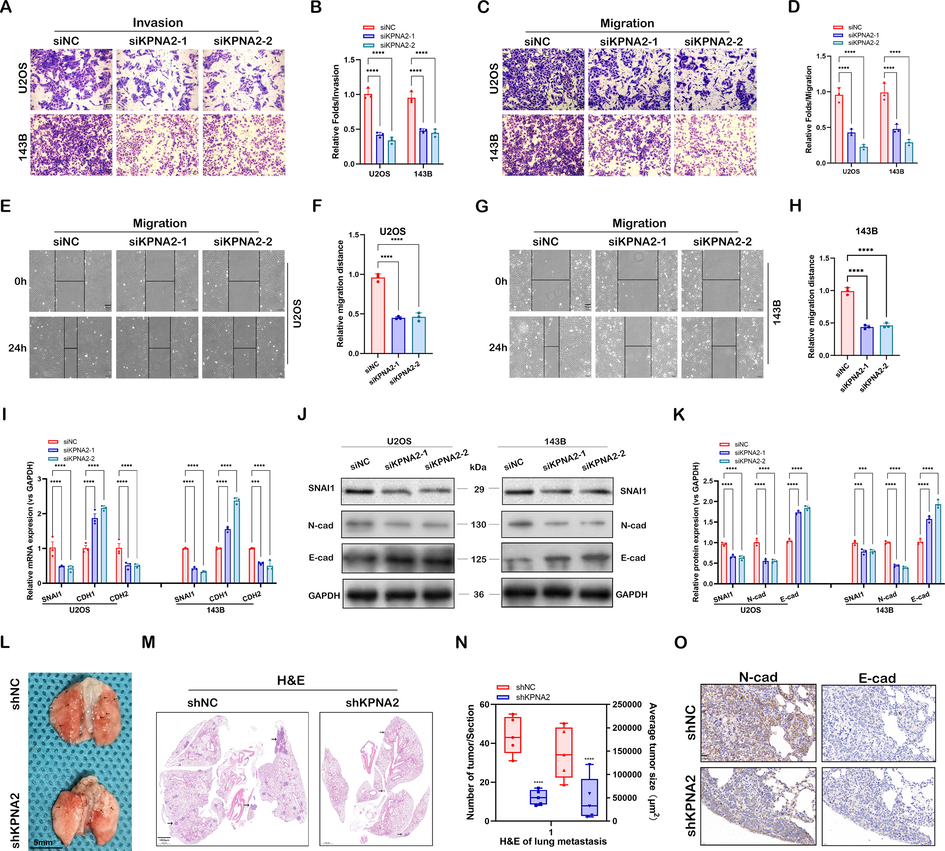
KPNA2 promoted osteosarcoma metastasis in vitro and in vivo. A–D Transwell invasion and migration assays for U2OS and 143B cells with or without KPNA2 knockdown (siNC, siKPNA2-1, siKPNA2-2) at 24 h. Scale bar: 50 μm. E–H U2OS and 143B cells transfected with siNC or siKPNA2 were detected by wound healing migration assay at 0 h and 24 h. Scale bar: 50 μm. I–K Metastasis-related genes were detected in U2OS and 143B cells using RT-qPCR and immunoblotting. L Typical image of lung metastases formed by injecting U2OS cells transfected with shKPNA2 or shNC into the tail vein. Scale bar: 5 mm. M Maximum coronal section of lung tissue stained with H&E. Scale bar: 1000 μm. N The number and size of lung metastases in the maximum coronal section were analyzed statistically. O Lung metastases were stained with N-cadherin and E-cadherin and compared between the shNC and the shKPNA2 group. Scale bar: 20 μm.
To investigate further the role of KPNA2 in osteosarcoma metastasis in vivo, shKPNA2 or shNC 143B cells were injected into mice via the lateral tail vein. Four weeks after injection, the mice harboring shKPNA2 143B cells had less and smaller metastatic nodules in their lungs (Fig. 3L–N). The IHC staining showed that N-cadherin levels were lower and E-cadherin levels were higher in the shKPNA2 group than in the shNC group (Fig. 3O). Taken together, these results showed that KPNA2 promoted cell migration, invasion and cancer metastasis in osteosarcoma.
3.4 Identification of KPNA2 targets by RNA-Seq in osteosarcoma
To explore the molecular mechanisms of KPNA2 activity in osteosarcoma, RNA-Seq was performed to compare gene expression profiles after KPNA2 knockdown in osteosarcoma cells. A total of 886 differentially expressed genes (DEGs) were obtained including 414 downregulated and 472 upregulated genes (Additional file 3: Sheet S1, ∣log (FC)∣ > 1 and P-value < 0.05). Subsequently, Gene set variation analysis (GSVA) enrichment analysis was performed to explore the biological behaviors of KPNA2 in osteosarcoma tumorigenesis. As shown in Fig. 4A, siKPNA2 was positively associated with downregulation of the hedgehog signaling pathway. GLI proteins, including GLI1, GLI2, and GLI3, are central effector molecules of the hedgehog pathway. Further analysis showed that only GLI1, not GLI2 and GLI3, was a DEG, as presented in a volcano map (Fig. 4B) and heat map (Fig. 4C). Therefore, we speculated that hedgehog/GLI1 might be a key downstream effector signaling pathway of KPNA2 in osteosarcoma cells. Subsequently, RT-qPCR (Fig. 4D) and western blot (Fig. 4E and F) were further used to validate that KPNA2 knockdown significantly downregulated GLI1, POU5F1/OCT4, SOX2 and MYC/c-Myc in osteosarcoma cells, which are closely related to the hedgehog signaling pathway. These results suggested that KPNA2 was positively related to the hedgehog/GLI1 pathway in osteosarcoma.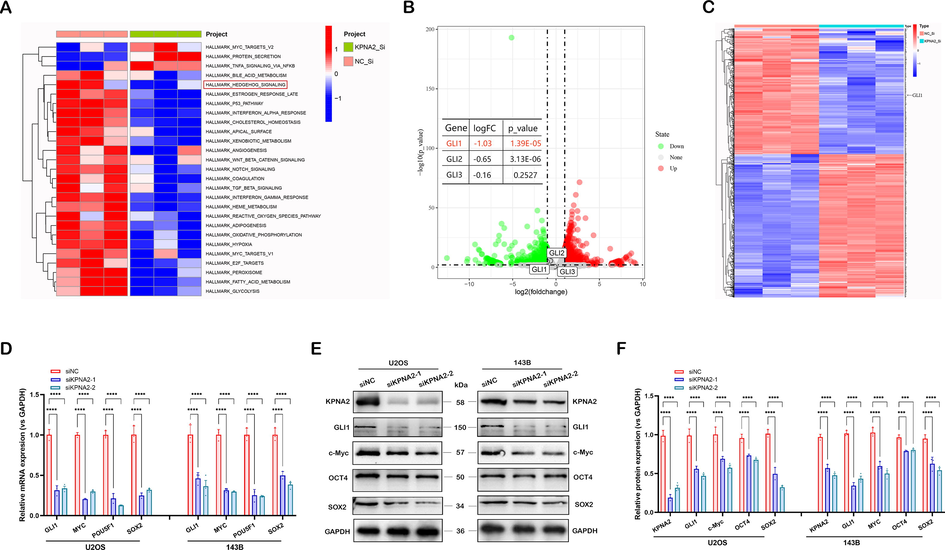
Identification of KPNA2 targets by RNA-Seq in osteosarcoma. A GSVA enrichment analysis was performed to explore the biological behaviors of KPNA2 on tumorigenesis in osteosarcoma, and the results were shown by a heat map. B DEGs and GLIs were presented in a volcano map. C DEG and GLI1 were presented in a heat map. D–F The expression of GLI1, MYC/c-Myc, POU5F1/OCT4 and SOX2 was detected in U2OS and 143B cells using RT-qPCR and immunoblotting.
3.5 KPNA2 promoted osteosarcoma growth and metastasis via the hedgehog/GLI1 signaling pathway
In order to determine whether KPNA2 was able to regulate the biological characteristics of osteosarcoma cells through the hedgehog/GLI1 pathway, we co-transferred oeKPNA2 and siGLI1 (siGLI1-3) into U2OS and 143B cells. qPCR showed that siGLI1-3 had the highest transfection efficiency among the three transfection fragments (Additional file 1: Fig. S5A). Therefore, siGLI1-3 was selected for the follow-up experiments. The results of western blot (Fig. 5A and Additional file1: Fig. S3A) showed that oeKPNA2 could upregulate the expression of OCT4, SOX2, N-cadherin and PCNA, and downregulate the expression of P21 and BAX proteins; however, these regulatory effects could be reversed or partly reversed by siGLI1 in U2OS and 143B cells. Rescue experiments in the CCK8 assay (Fig. 5B and Additional file 1: Fig. S3B), cell cycle assay (Fig. 5C and D, and Additional file 1: Fig. S3C and D), apoptosis assay (Fig. 5E and F, and Additional file 1: Fig. S3E and F), Transwell assay (Fig. 5G and H, and Additional file 1: Fig. S3G and H) and wound healing assay (Fig. 5I and J, and Additional file 1: Fig. S3I and J) further demonstrated that the functional regulation of osteosarcoma cells by KPNA2 depends on GLI1. Thus, KPNA2 promoted osteosarcoma tumorigenesis and metastasis via the hedgehog/GLI1 pathway.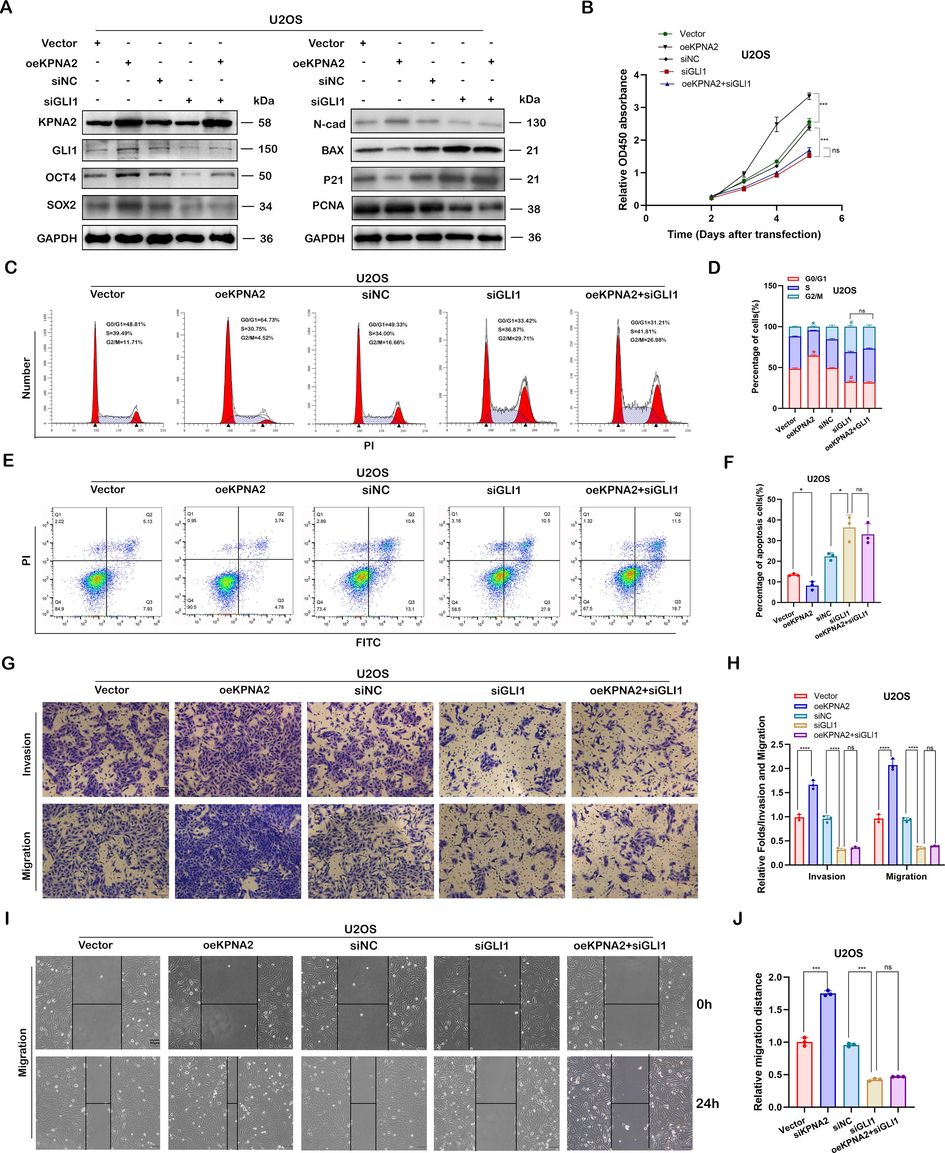
KPNA2 promoted osteosarcoma growth and metastasis via the hedgehog/GLI1 pathway. A Knockdown of GLI1 (siGLI1-3) reversed or partly reversed the effects of oeKPNA2 on the expression of OCT4, SXO2, N-cadherin, PCNA, P21 and BAX proteins in U2OS cells, using immunoblotting. Knockdown of GLI1 reversed or partly reversed the effects of oeKPNA2 on cell function by CCK8 assay (B), cell cycle assay (C and D), and apoptosis assay (E and F), in U2OS cells. G–J Knockdown of GLI1 reversed or partly reversed the promotor effects of oeKPNA2 on the cell migration and invasion ability of U2OS cells by the Transwell assay or wound healing assay. Scale bar: 50 μm.
3.6 KPNA2 regulated the hedgehog/GLI1 pathway in a c-Myc- dependent manner
GLI1, also known as transcription factor, executes its transcriptional regulation in cells by being imported into the nucleus (Hatayama and Aruga 2012; Hui and Angers 2011). The most common biological function of KPNA2 is to carry transcription factors into the nucleus, and thus to regulate gene expression (Drucker et al. 2019; Xiang et al. 2019). Moreover, a recent study demonstrated that GLI ciliary localization and hedgehog pathway activation were regulated by karyopherin β2 (Han et al. 2017). Thus, we speculated that KPNA2 might directly regulate the nuclear importation of GLI1 in osteosarcoma cells. However, the endogenous Co-IP experiment did not support the interaction between KPNA2 and GLI1 protein (Fig. 6A). Therefore, we hypothesized that KPNA2 might regulate GLI1 expression through other transcription factors. Quantitative proteomics and mass spectrometry were performed by Wang et al. to identified cargo proteins for KPNA2, and they demonstrated that transcription factors p53, E2F1 and c-Myc were the most statistically significant cargo proteins (Wang et al. 2012). However, only c-Myc was predicted to be the transcription factor of GLI1 by UCSC Genome Browser (https://genome.ucsc.edu/) and JASPAR (https://jaspar.genereg.net/) transcription factor predicting tools (we selected TFBS predictions with a PWM relative score ≥ 0.8 and a P-value < 0.001). The above speculation suggests that KPNA2 may regulate GLI1 expression through the transcription factor c-Myc in osteosarcoma cells.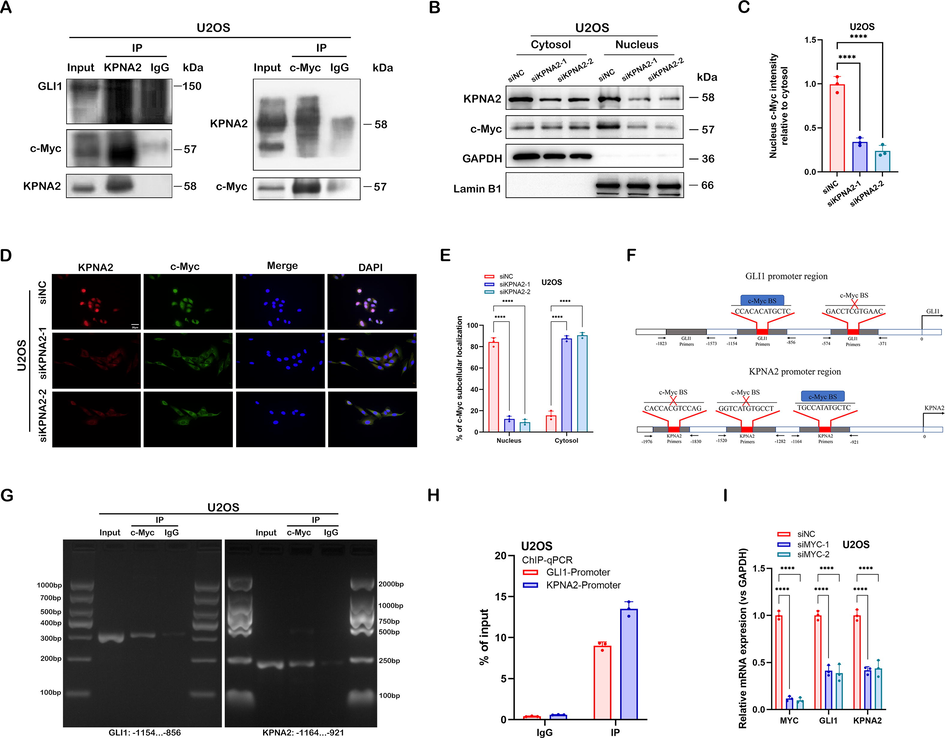
KPNA2 regulated the hedgehog/GLI1 pathway in a c-Myc- dependent manner. A Co-IP was performed to examine the endogenous interaction between KPNA2 and c-Myc or GLI1; cell lysates of U2OS cells were precipitated with anti-KPNA2 or anti-c-Myc antibodies, and the precipitates were examined by immunoblotting. B and C The siNC- or siKPNA2-depleted U2OS cells were subjected to extraction of the cytosol and nuclear fractions. Subsequently, western blotting was performed to detect the expression of KPNA2 and c-Myc. Lamin B1 and GAPDH were used as reference proteins for nuclear and cytoplasmic fractions, respectively. D and E The U2OS cells were prepared for immunofluorescence staining using an anti-KPNA2 antibody to detect the subcellular expression of KPNA2 and c-Myc. Nuclei were stained with DPAI. Scale bar: 20 μm. F GLI1 and KPNA2 promotors were analyzed and designed to identify the c-Myc-binding site (c-Myc BS) by JASPAR. G and H ChIP-PCR and ChIP-qPCR were performed to detect the endogenous interaction between c-Myc BS and the promoter regions of GLI1 or KPNA2 in U2OS cells. I Effect of MYC knockdown (siMYC-1 and siMYC-2) on the expression of GLI1 and KPNA2 in U2OS cells by RT-qPCR.
We subsequently used the Co-IP assay to examine the interaction between KPNA2 and c-Myc in osteosarcoma cells, and the results showed that endogenous c-Myc was co-immunoprecipitated with KPNA2 in U2OS and 143B cells (Fig. 6A and Additional file 1: Fig. S4A). Western blotting (Fig. 6B and C, and Additional file 1: Fig. S4B and C) and cell immunofluorescence assay (Fig. 6D and E, and Additional file 1: Fig. S4D and E) showed that KPNA2 was ubiquitously located in both nucleus and cytoplasm, whereas c-Myc mainly resided in the nucleus; however, c-Myc was mainly localized to the cytoplasm after KPNA2 had been depleted. These results indicated that KPNA2 mediated the shuttle of c-Myc from the cytoplasm to the nucleus in osteosarcoma cells. Subsequently, JASPAR was used to predict the binding sites of GLI1 promotor regions for c-Myc. We found that c-Myc could bind to two GLI1 promotor regions with a relative profile score threshold > 80% (Fig. 6F, upper). Interestingly, KPNA2 was also predicted to have promotor regions binding to c-Myc (Fig. 6F, lower). To verify direct binding of c-Myc to GLI1 and KPNA2 predicted promoter regions, we designed three primers for the promoter sequence of each gene based on the predicted result in Fig. 6F (the grey parts of the pattern diagram represent primers). The endogenous ChIP-PCR experiment revealed that c-Myc had a binding site with the promoter regions of GLI1 and KPNA2, respectively (Fig. 6G and Additional file 1: Fig. S4F). We quantified the result by a ChIP-qPCR experiment (Fig. 6H and Additional file 1: Fig. S4G). qPCR showed that siMYC-1 and siMYC-2 had the most transfection efficiency among the three transfection fragments (Additional file 1: Fig. S5B), which were selected for the follow-up experiments. We further demonstrated that knockdown of MYC significantly downregulated the mRNA expression of GLI1 and KPNA2 in U2OS and 143B cells (Fig. 6I and Additional file 1: Fig. S4H). These results suggested that KPNA2 regulated the transcriptional expression of GLI1 via mediation of c-Myc nuclear localization, and c-Myc could also regulate KPNA2 expression by a positive feedback mechanism (Fig. 7).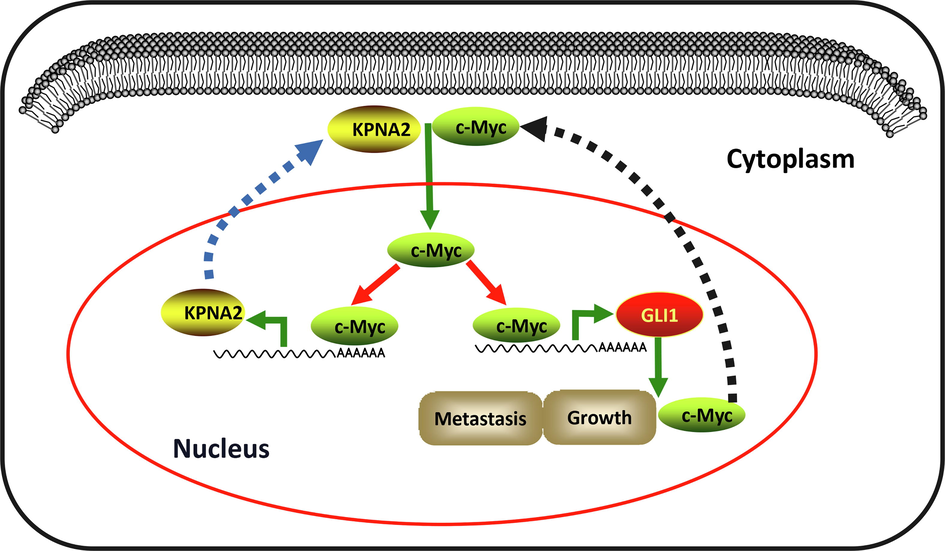
A model of KPNA2 regulates c-Myc/GLI1 signal axis in osteosarcoma. KPNA2 is overexpressed in osteosarcoma and acts as a nuclear–cytoplasmic shuttle vehicle to transport c-Myc into the nucleus. Subsequently, c-Myc binds to the promoter of GLI1 and KPNA2 to trigger their expression. Thus, KPNA2/c-Myc/GLI1 signal axis forms a feedback effect to promote osteosarcoma growth and metastasis.
4 Discussion
Aberrant expression of NTRs has been commonly demonstrated to be correlated with tumor growth and progression (Mahipal and Malafa 2016). However, its role in osteosarcoma remains largely unknown. Our study screened out the significantly high expression of KPNA2 in osteosarcoma. We demonstrated that KPNA2 was correlated with a poor clinical outcome and could serve as an independent prognostic factor for osteosarcoma. In addition, we verified that KPNA2 could be used as an effective indicator for predicting the survival of individual person when combined with clinical characteristics. Consistent with the clinical results, we demonstrated that KPNA2 promotes osteosarcoma growth and metastasis experiments conducted in vitro and in vivo. Subsequent high throughput sequencing analysis revealed that hedgehog/GLI1 is the main effector pathway of KPNA2 in osteosarcoma. The molecular interaction experiments further confirmed that: 1) KPNA2 can transfer c-Myc into the nucleus by directly binding its promotor region; 2) c-Myc transcription regulates the expression of GLI1 and KPNA2. Thus, the KPNA2/c-Myc/GLI1 signal axis plays an important regulatory role in tumorigenesis and metastasis of osteosarcoma.
As a member of the NTR family, KPNA2 has been demonstrated to be closely related to tumorigenesis (Christiansen and Dyrskjøt 2013). KPNA2 expression is abnormally high in many malignancies and is positively associated with poor prognosis (Altan et al. 2013; Zheng et al. 2010). KPNA2 is also significantly upregulated in osteosarcoma and may serve as an independent prognostic factor. Moreover, KPNA2 and clinical parameters were used to established a prognostic Nomogram model to predict the survival of individual patients with osteosarcoma in our study. Cancer biological properties, related to growth and metastasis, can be regulated by KPNA2 (Ma et al. 2019). Consistent with previous studies, our research revealed that KPNA2 promotes osteosarcoma growth by increasing cancer cell proliferation, abrogating cell arrest at the G2/M phase and enhancing the resistance of cells to apoptosis. In addition, KPNA2 enhanced osteosarcoma lung metastasis by promoting cell migration and invasion. KPNA2 promotes cancer mainly by carrying cancer-promoting proteins possessing the nuclear localization sequence (NLS) into the nucleus and then activating cancer-related signaling pathways (Drucker et al. 2019; Li et al. 2018; Radhakrishnan et al. 2020). Xiang et al. (2019) showed that high expression of KPNA2 was related to short survival of times. They further identified that KPNA2 promoted the tumorigenesis by binding with transcription factors E2F1 and E2F7 and then carrying them into the nucleus. Recently, KPNA2 was found to form the S100A2/KPNA2 cotransport complex, which can transport NFYA into the nucleus, to promote colorectal cancer metastasis (Han et al. 2022). However, the specific regulation of KPNA2 in osteosarcoma needs to be explored further.
To disclose the molecular mechanisms of KPNA2 in osteosarcoma, RNA high throughput sequencing analysis was performed. The result revealed that KPNA2 positively regulated the hedgehog/GLI1 pathway, which might be the downstream pathway of KPNA2 in osteosarcoma. The hedgehog signaling pathway plays a vital role in the tumorigenesis and metastasis of many tumors, including osteosarcoma (Jiang 2021; Kumar and Fuchs 2015). GLI proteins, including GLI1, GLI2, and GLI3, are central effector molecules of the hedgehog pathway (Hui and Angers 2011). A recent study suggested that the hedgehog/GLI1 pathway was involved in the tumorigenesis of osteosarcoma. That study confirmed that degalactotigonin inhibited the growth and metastasis of osteosarcoma through GSK3β inactivation-mediated repression of the hedgehog/GLI1 pathway (Zhao et al. 2018). Our rescue experiment also demonstrated that KPNA2 depends on GLI1 to modulate the growth and metastasis of osteosarcoma. GLI1 is a key transcription factor in the hedgehog signal transduction pathway, whose nuclear transport depends on NLS (Hatayama and Aruga 2012). Therefore, we speculate that KPNA2 may directly regulate the nuclear importation of GLI1 in osteosarcoma. However, the Co-IP experiment does not support this hypothesis in osteosarcoma. Thus, KPNA2 may regulate GLI1 expression through other transcription factors. Combined with bioinformatics prediction and previous studies, our findings suggest that c-Myc might be a bridge molecule allowing KPNA2 to regulate GLI1, which has been illuminated in the results section. Li et al. demonstrated that KPNA2 promoted metabolic reprogramming in glioblastoma by regulation of c-Myc, which makes our speculation more scientifically grounded (Li et al. 2018). In osteosarcoma cell lines, we confirmed that there exists an interaction between the molecules KPNA2 and c-Myc through CoIP assay. Then, KPNA2 promoted c-Myc localization in the nucleus, as verified by immunofluorescence and western blot assay. Therefore, the carcinogenic effect of c-Myc in osteosarcoma might be dependent or partially dependent on KPNA2.
The MYC family consists of C-MYC, L-MYC and N-MYC, which belong to the basic helix-loop-helix leucine zipper DNA binding protein superfamily (Duffy et al. 2021). MYC proteins largely function as transcriptional modulators, regulating genes involved in several different cellular processes, including cell growth, the cell cycle, cell apoptosis, stem cell formation and so forth (Kortlever et al. 2017). c-Myc has been widely studied in many cancers, including osteosarcoma, and is mainly involved in the occurrence and development of cancers (Dang 2012; Shen et al. 2020; Shen et al. 2019). Moreover, noncanonical regulation of the hedgehog mediator GLI1 by c-Myc in Burkitt lymphoma has been reported in a previous study (Yoon et al. 2013). Transcription factor prediction software JASPAR was used to predict that c-Myc could bind to the promotor regions of GLI1 and KPNA2. Following this, the ChIP assay demonstrated that c-Myc could transcriptionally regulate the expression of GLI1 and KPNA2 in osteosarcoma. Taken together, this means that KPNA2 regulates the transcriptional expression of GLI1 via mediation of c-Myc nuclear localization, and c-Myc also regulates KPNA2 expression by a positive feedback mechanism in osteosarcoma.
5 Conclusion
Our current study systematically investigated the role of KPNA2 in osteosarcoma. We confirmed that KPNA2 functions as a promoting factor in osteosarcoma growth and metastasis. Mechanistically, KPNA2 acts as a nuclear–cytoplasmic shuttle vehicle to transport c-Myc into the nucleus, where c-Myc binds to the promoter of GLI1 to trigger its expression. Interestingly, c-Myc can also transcriptionally regulate the expression of KPNA2, thus providing a positive feedback effect to amplify the pro-cancer signal further. Research efforts directed at identifying potential drug targets to interfere with the KPNA2/c-Myc/GLI1 signal axis could provide a novel therapeutic strategy to improve osteosarcoma treatment.
Author agreement
Sheng Zhou did the experiments and wrote this study. Ruiping Liu designed the experiments and conducted supervision of the study. Chao Zhuang put forward many valuable suggestions for the subject. All authors made contributions to this study and gave their approval to the submitted study.
Acknowledgements
We thank LC-Bio Technology Co., Ltd. for providing the RNA sequencing platform. We also thank GEO databases for offering the platform and contributors for the upload of effective data sets.
Funding
This work was supported by the Changzhou High-Level Medical Talents Training Project (2016CZLJ011) and the Changzhou Sci&Tech Program (CJ20210064).
Availability of data and materials
The datasets used and/or analysed during the current study are available from the corresponding author on reasonable request. The RNA-Seq data of KPNA2 knockdown has been deposited in the GEO (https://www.ncbi.nlm.nih.gov/geo/) database under the accession code: GSE206342. The microarray data of osteosarcoma tissues consulted in our study is available at GEO under accession numbers GSE87624 and GSE21257.
Declaration of Competing Interest
The authors declare that they have no known competing financial interests or personal relationships that could have appeared to influence the work reported in this paper.
References
- Nuclear karyopherin-α2 expression in primary lesions and metastatic lymph nodes was associated with poor prognosis and progression in gastric cancer. Carcinogenesis. 2013;34:2314-2321.
- [CrossRef] [Google Scholar]
- The cargo spectrum of nuclear transport receptors. Curr. Opin. Cell Biol.. 2019;58:1-7.
- [CrossRef] [Google Scholar]
- The nuclear pore complex: understanding its function through structural insight. Nat. Rev. Mol. Cell Biol.. 2017;18:73-89.
- [CrossRef] [Google Scholar]
- Alterations of the nuclear transport system in hepatocellular carcinoma - New basis for therapeutic strategies. J. Hepatol.. 2017;67:1051-1061.
- [CrossRef] [Google Scholar]
- Components and regulation of nuclear transport processes. FEBS J.. 2015;282:445-462.
- [CrossRef] [Google Scholar]
- Karyopherins and nuclear import. Curr. Opin. Struct. Biol.. 2001;11:703-715.
- [CrossRef] [Google Scholar]
- The functional role of the novel biomarker karyopherin α 2 (KPNA2) in cancer. Cancer Lett.. 2013;331:18-23.
- [CrossRef] [Google Scholar]
- Karyopherin α2-dependent import of E2F1 and TFDP1 maintains protumorigenic stathmin expression in liver cancer. Cell Commun. Signal. 2019;17:159.
- [CrossRef] [Google Scholar]
- MYC as a target for cancer treatment. Cancer Treat. Rev.. 2021;94:102154
- [CrossRef] [Google Scholar]
- Lenvatinib with etoposide plus ifosfamide in patients with refractory or relapsed osteosarcoma (ITCC-050): a multicentre, open-label, multicohort, phase 1/2 study. Lancet Oncol.. 2021;22:1312-1321.
- [CrossRef] [Google Scholar]
- Importin alpha: a multipurpose nuclear-transport receptor. Trends Cell Biol.. 2004;14:505-514.
- [CrossRef] [Google Scholar]
- Regulation of Gli ciliary localization and Hedgehog signaling by the PY-NLS/karyopherin-β2 nuclear import system. PLoS Biol.. 2017;15:e2002063.
- [Google Scholar]
- The interaction between S100A2 and KPNA2 mediates NFYA nuclear import and is a novel therapeutic target for colorectal cancer metastasis. Oncogene. 2022;41:657-670.
- [CrossRef] [Google Scholar]
- Characterization of the auto-inhibitory sequence within the N-terminal domain of importin alpha. J. Biol. Chem.. 2003;278:21361-21369.
- [CrossRef] [Google Scholar]
- Gli proteins in development and disease. Annu. Rev. Cell Dev. Biol.. 2011;27:513-537.
- [CrossRef] [Google Scholar]
- Hedgehog signaling mechanism and role in cancer. Semin. Cancer Biol. 2021
- [CrossRef] [Google Scholar]
- KPNA2 expression is a potential marker for differential diagnosis between osteosarcomas and other malignant bone tumor mimics. Diagn. Pathol.. 2020;15:135.
- [CrossRef] [Google Scholar]
- Translational biology of osteosarcoma. Nat. Rev. Cancer. 2014;14:722-735.
- [CrossRef] [Google Scholar]
- Myc Cooperates with Ras by Programming Inflammation and Immune Suppression. Cell. 2017;171:1301-1315.e1314.
- [CrossRef] [Google Scholar]
- Hedgehog signaling inhibitors as anti-cancer agents in osteosarcoma. Cancers (Basel). 2015;7:784-794.
- [CrossRef] [Google Scholar]
- KPNA2 promotes metabolic reprogramming in glioblastomas by regulation of c-myc. J. Exp. Clin. Cancer Res.. 2018;37:194.
- [CrossRef] [Google Scholar]
- USP1 inhibition destabilizes KPNA2 and suppresses breast cancer metastasis. Oncogene. 2019;38:2405-2419.
- [CrossRef] [Google Scholar]
- Importins and exportins as therapeutic targets in cancer. Pharmacol. Ther.. 2016;164:135-143.
- [CrossRef] [Google Scholar]
- Addition of pamidronate to chemotherapy for the treatment of osteosarcoma. Cancer. 2011;117:1736-1744.
- [CrossRef] [Google Scholar]
- Karyopherin α-2 Mediates MDC1 Nuclear Import through a Functional Nuclear Localization Signal in the tBRCT Domain of MDC1. Int. J. Mol. Sci.. 2020;21
- [CrossRef] [Google Scholar]
- CircECE1 activates energy metabolism in osteosarcoma by stabilizing c-Myc. Mol. Cancer. 2020;19:151.
- [CrossRef] [Google Scholar]
- S1P/S1PR3 axis promotes aerobic glycolysis by YAP/c-MYC/PGAM1 axis in osteosarcoma. EBioMedicine. 2019;40:210-223.
- [CrossRef] [Google Scholar]
- A patent review on efficient strategies for the total synthesis of pazopanib, regorafenib and lenvatinib as novel anti-angiogenesis receptor tyrosine kinase inhibitors for cancer therapy. Mol. Divers.. 2022;26:2981-3002.
- [CrossRef] [Google Scholar]
- Quantitative proteomics reveals regulation of karyopherin subunit alpha-2 (KPNA2) and its potential novel cargo proteins in nonsmall cell lung cancer. Mol. Cell. Proteomics. 2012;11:1105-1122.
- [CrossRef] [Google Scholar]
- Osteosarcoma, Chondrosarcoma, and Chordoma. J. Clin. Oncol.. 2018;36:188-193.
- [CrossRef] [Google Scholar]
- E2F1 and E2F7 differentially regulate KPNA2 to promote the development of gallbladder cancer. Oncogene. 2019;38:1269-1281.
- [CrossRef] [Google Scholar]
- TNPO1-mediated nuclear import of ARID1B promotes tumor growth in ARID1A-deficient gynecologic cancer. Cancer Lett.. 2021;515:14-27.
- [CrossRef] [Google Scholar]
- Inhibition of KPNA4 attenuates prostate cancer metastasis. Oncogene. 2017;36:2868-2878.
- [CrossRef] [Google Scholar]
- Noncanonical regulation of the Hedgehog mediator GLI1 by c-MYC in Burkitt lymphoma. Mol. Cancer Res.. 2013;11:604-615.
- [CrossRef] [Google Scholar]
- Emerging next-generation sequencing-based discoveries for targeted osteosarcoma therapy. Cancer Lett.. 2020;474:158-167.
- [CrossRef] [Google Scholar]
- Degalactotigonin, a Natural Compound from Solanum nigrum L., Inhibits Growth and Metastasis of Osteosarcoma through GSK3β Inactivation-Mediated Repression of the Hedgehog/Gli1 Pathway. Clin. Cancer Res.. 2018;24:130-144.
- [CrossRef] [Google Scholar]
- Overexpression of karyopherin-2 in epithelial ovarian cancer and correlation with poor prognosis. Obstet. Gynecol.. 2010;116:884-891.
- [CrossRef] [Google Scholar]
Appendix A
Supplementary material
Supplementary data to this article can be found online at https://doi.org/10.1016/j.arabjc.2023.104805.
Appendix A
Supplementary material
The following are the Supplementary data to this article:Supplementary data 1
Supplementary data 1
Additional file 1: . KPNA2 was overexpressed in osteosarcoma and correlated with poor prognosis. Related to Fig. 1. . KPNA2 promoted osteosarcoma growth in vitro and in vivo. Related to Fig. 2. . KPNA2 promoted osteosarcoma growth and metastasis via the hedgehog/GLI1 pathway. Related to Fig. 5. . KPNA2 regulated the hedgehog/GLI1 pathway in a c-Myc- dependent manner. Related to Fig. 6. . The knockdown efficiency of GLI1 and MYC
Supplementary data 2
Supplementary data 2
Additional file 2: . The siRNA sequences (Homo sapiens). . The overexpressed plasmid of KPNA2 (Homo sapiens). . Lentiviral vector of shNC and shKPNA2 (Homo sapiens). . Primer sequences used for RT-qPCR (Homo sapiens). . Antibody information. . Primer sequences of promotors used for ChIP (Homo sapiens)
Supplementary data 3
Supplementary data 3
Additional file 3: Sheet S1. DEGs between siKPNA2 and siNC groups in U2OS cells


