Translate this page into:
Metabolomics approach to understand the hepatitis C virus induced hepatocellular carcinoma using LC-ESI-MS/MS
⁎Corresponding authors at: H. E. J. Research Institute of Chemistry, International Center for Chemical and Biological Sciences, University of Karachi, Pakistan (H.R. El-Seedi); Pharmacognosy Group, Department of Pharmaceutical Biosciences, Biomedical Centre, Uppsala University, SE- 751 23 Uppsala, Sweden (S.G. Musharraf). hesham.el-seedi@farmbio.uu.se (Hesham R. El-Seedi), musharraf@iccs.edu (Syed Ghulam Musharraf)
-
Received: ,
Accepted: ,
This article was originally published by Elsevier and was migrated to Scientific Scholar after the change of Publisher.
Abstract
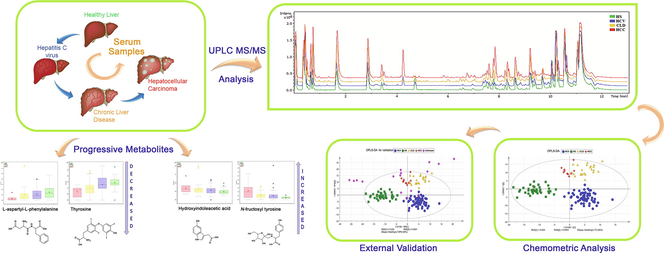
Abstract
Hepatocellular carcinoma (HCC) is a typical cancer that has region specified analysis with the incidence of hepatitis C virus (HCV) infection. This study was conducted to improve the understanding of metabolic alterations associated with HCV induced HCC which can open up new strategies to monitor the high risk of HCC. Samples of the subjects with HCV, HCV induced chronic liver disease (CLD), HCV induced HCC, and healthy controls (HS) were collected after complete blood count (CBC), hepatitis viral load, α-fetoprotein (AFP), liver function tests, and albumin. A total of 147 serum samples including HCC (n = 11), CLD (n = 24), HCV (n = 71), and HS (n = 41) were analyzed by LC-ESI-MS/MS. The 21 compounds were found to be responsible for group discrimination after the application of chemometric tools. N-fructosyl tyrosine and hydroxyindoleacetic acid showed an increase in level whereas L-aspartyl-L-phenylalanine and thyroxine showed a consistent decrease in the progression of HCV to HCC in comparison with HS indicating their importance for early detection. The biological pathways such as glycerophospholipid metabolism, phenylalanine, tyrosine, and tryptophan biosynthesis, phenylalanine metabolism and tryptophan metabolism showed alteration in some metabolites. The method was internally validated by ROC plot showing AUC value for HS, HCV, CLD, and HCC as 0.99, 1, 1, and 0.89, respectively; while 16 blind samples were also validated with 93% specificity. The untargeted metabolomics investigation of HCV, CLD, and HCC can help to understand the progression of HCV-induced HCC. It reveals significant differences in metabolites to predict prognostic and diagnostic markers.
Keywords
Hepatocellular carcinoma
Hepatitis C virus
Untargeted metabolite profiling
LC-ESI-MS/MS
- AFP
-
alpha fetoprotein
- ALP
-
alkaline phosphate
- ALT
-
alanine aminotransferase
- AST
-
aspartate aminotransferase
- BMI
-
body mass index
- CLD
-
chronic liver disease
- CNLD
-
chronic nonalcoholic liver disease
- FDR
-
false detection rate
- HCC
-
hepatocellular carcinoma
- HCV
-
hepatitis C virus
- HS
-
healthy serum
- LC-MS
-
liquid chromatography-mass spectrometry LPC, lysophosphatidylcholine
- NHC
-
normal healthy control
- OPLS-DA
-
orthogonal partial least square-discriminant analysis
- PAF
-
platelet activating factor
- PCA
-
principal component analysis
- PPI
-
proton pump inhibitor
- T4
-
thyroxine
- LC-ESI-MS/MS
-
liquid chromatography-electrospray ionization-mass spectrometry
Abbreviations
1 Introduction
Hepatitis C virus infection is a global health problem and it is evaluated to affect >180 million people worldwide (Ford et al., 2012). Each year, approximately 3–4 million people are newly infected (Ray Kim, 2002). The foremost cause of cirrhosis is chronic hepatitis and is associated with an elevated risk for progression into hepatocellular carcinoma (HCC) which is the sixth most common cancer and is the second most common reason for mortality globally (Hafeez Bhatti et al., 2016, Lafaro et al., 2015, Ogunwobi et al., 2019).
HCV infection results in inflammation that develops to fibrosis and then proceeds to cirrhosis in about 20–30% of individuals over a period of 20 to 40 years. As a result of cirrhosis around 1–2% of patients ultimately progresses to HCC (Hayes et al., 2018). Various treatment procedures such as radiation, chemotherapy, and surgery, are available but the treatment selection is decided by the cancer stage, available resources, and expert clinicians and therapists (El-Serag and Rudolph, 2007, Schlachterman et al., 2015). Alpha-fetoprotein (AFP) analysis, liver biopsy, and radiographic imaging are most commonly used diagnostic analytical tools (Wong and Frenette, 2011). Liver disease usually doesn’t show any clear signs and symptoms until it’s advanced and liver is damaged (Rane et al., 2016). Late diagnosis is the main reason for the poor survival rate in patients (Chen et al., 2011a) and the average time period from the finding of symptoms to fatality is 06–20 months (Forner et al., 2012). Although considerable research work has been done related to the prognosis, diagnosis, and therapeutics of HCV induced HCC, however, their usefulness still remains limited due to lack of sensitivity & specificity (Yim and Chung, 2010). Hence, due to the high incidence rate of HCV induced HCC worldwide and low treatment response, there is an urgent need to understand the correlation of metabolites with the progression of the disease because it would reduce complications and improve the quality life of HCV and HCC patients.
The developing field of metabolomics provides a wide chemical fingerprint of cell metabolism that can establish the pathophysiological conditions of disease at an early stage (Xie et al., 2017). Metabolic alteration in biofluids can provide comprehensive information about biological systems and their consistent interaction to analyze related disease pathology (Gowda et al., 2014). Recent developments/New growths in analytical chemistry have placed metabolomics at the frontier (Fitian et al., 2014) and have been shown to be/appeared as an effectual tool for disease diagnosis, characterization of biological pathways and biomarker screening (Chang et al., 2018, Zhu et al., 2017).
The studies which can link between HCV infection and developed HCC are very few (Patterson et al., 2011). Recently, the metabolic differences between diabetic and non-diabetic chronic nonalcoholic liver disease (CNLD); diabetic and non-diabetic HCC (El-serag et al., 2004), patients with HCV-cirrhosis and normal healthy controls (NHC) (Fitian et al., 2014) have been reported. The present study focuses on the untargeted metabolomics comparison between different groups of patients including HCV infected patients (HCV), HCV induced chronic liver disease (CLD), HCV induced hepatocellular carcinoma (HCC) patients and healthy controls (HS) using UPLC-QTOF-MS high-resolution mass spectrometry technique. A number of molecules of interest that are found to be part of altered metabolism into the progression of the disease are described for HCC that would enhance understanding of the pathobiology of the disease and predict biomarkers.
2 Patients and methods
2.1 Chemicals and reagents
Analytical grade solvents were used for LC-MS analysis. Solvents and reagents included methanol, formic acid (Daejung chemicals and metals, Siheung, Korea), acetonitrile (Tedia, Tedia way, Fairfield, USA), N-Fmoc-L-alanine (Chem-Impex International, Wood Dale, IL, USA), N-Fmoc-L-serine (OtBu) (GL Biochem, Shanghai, China). Throughout the study, deionized water (Milli-Q) 18.2 MΩ cm, obtained from Millipore assembly (Billerica, MA, USA), was utilized.
2.2 Patient selection
Hepatitis C patients, male/female, with HCC or without HCC were recruited from the out-patients department (OPD) of the National Institute of Liver and GI Diseases (NILGID), and Blood Collection Point, Dow Diagnostic Reference and Research Laboratory (DDRRL), Dow University of Health Sciences, Ojha Campus, Karachi. The control group consisted of normal healthy individuals. Written informed consent was obtained from all the 147 participants with the approval of the Institutional Review Board of Dow University (Protocol No. IRB-489/DUHS/-14) before their enrollment in the study. Independent Ethics Committee of International Center for Chemical and Biological Sciences had approved the experimental protocol (ICCBS/IEC-040-HB-2018/Protocol/1.0). Clinical history of the patient including complete blood count (CBC), prothrombin time, Hepatitis Viral Load, α-fetoprotein (AFP), Liver function tests, and Albumin were determined. Exclusion criteria included: Anti-HCV negative, HBsAg positive, history of alcoholic abuse and cirrhosis, HCV co-infection, and patients having evidence of any other liver inflammatory or some additional tumor at the same time with HCC.
2.3 Sample collection
Sample collection was done after proper evaluation, medical checkup, and checking previous records/history under the supervisionof a medical consultant. None of the participants had received any kind of treatment prior to sample collection. About 5 mL of blood was taken from patients and healthy controls by venipuncture and transferred to gel-based BD vacutainer tubes (BD Franklin Lakes NJ, USA, REF: 367381), interior coated with silicone for clot activation, then centrifuged for 5 min at 3500 rpm to separate the serum. The serum portion was immediately stored at −80℃ until further analysis.
2.4 Sample preparation
The samples were prepared as reported earlier with some modifications (Chen et al., 2011b). The frozen serum samples were thawed on ice bath and an aliquot of 100 µL of serum sample was added with 100 µL of water (containing 1.0 mg/ml each of N-Fmoc-L-alanine and N-Fmoc-L-serine (OtBu) as internal standards), followed by the addition of 400 µL of a mixture of methanol and acetonitrile (5:3). Samples were vortexed for 2 min and left at room temperature for 10 min. After centrifugation at 12,000 rpm for 20 min, the supernatant was separated and then dried completely under vacuum at room temperature and reconstituted in 200 µL of milli-Q deionized water. After vortexing for 2 min, the mixture was centrifuged at 12,000 rpm for 20 min and the supernatant was transferred to the autosampler vial for analysis. A total of 16 blind samples were also prepared for validation in the similar way as mentioned above.
A separate pool referred to as the quality control (QC) was made by mixing 10 µL aliquot of serum from each sample by following the same method and was subjected to analysis periodically after every 6 samples to provide robust quality assurance for each metabolic feature detected.
2.5 UPLC-QTOF acquisition
LC-MS analysis was performed on Bruker maXis II HR-QTOF mass spectrometer (Bremen, Germany) consisting of Thermo Scientific Dionex Ultimate 3000 liquid chromatography system coupled with QTOF mass spectrometer. A 5 µL aliquot of the sample was injected at a random order into a reverse phase, 2.0 mm × 100-mm, 1.8 µm particle, NUCLEODUR C18 Gravity column with a compatible guard column (Macherey-Nagel, Germany) held at 40 °C. For chromatographic separation mobile phase, A was water 0.1% formic acid and B was methanol with 0.1% formic acid. The column was kept at 5% B for a minute then the sample was eluted with a linear gradient of 5–95% B over 1–9 min, 95% B over 9–10.5 min, 5% B over 10.7 min, 5% B over 10.7–13 min. The flow rate was 0.5 mL/min. 0.1 M Na-formate calibrant solution was injected prior to each injection at the rate of 0.17 mL/hr using automatic switch valves. The sample temperature of 4 °C was maintained during the analysis.
The parameters of mass spectrometry for MS and MS/MS data were adjusted as follow, drying gas temp of 270 ℃, drying gas flow of 12.0 L/min, mass range of 100–1200 m/z, capillary voltage of 4500 V, and nebulizer pressure 3.1 bar. Data was recorded using Compass HyStar 4.1 acquisition software (Bremen, Germany). To condition the column, assess instrument stability and to ensure data quality, 10 QC’s were subjected at the start of each analytical batch and then one QC is injected after every 06 samples and 05 blanks were randomly injected to assess sample carryover. A column check was used to check the stability of the column before and at the end of each batch.
2.6 Data processing and statistical analysis
First the calibration of data was performed using Bruker’s Compass Data Analysis (version 4.4). After calibration features were extracted using Bruker’s MetaboScape (version 3.0) software with following parameters: 3000 counts intensity threshold, 12 spectra minimum peak length, 9 spectra minimum peak length (recursive), feature signal intensity, minimum numbers of features for extraction and presence of features is 30% of analyses, 0.3–0.8 EIC correlation, 13 min retention-time range, 100–1500 m/z mass range, and [M + H]+primary ion. N-Fmoc-L-serine (OtBu) and N-Fmoc-L-alanine as internal standards were used for checking chromatographic performance and quality control, while the intensity of N-Fmoc-L-serine (OtBu) was used for data normalization. The extracted features were exported to the .csv format and processed on Mass Profiler Professional (MPP) software 12.5. Data filtering involve 5,000 counts minimum absolute abundance with 3 number of ions minimum. Z transform base line option was selected to treat all the compounds equally irrespective of their intensity, and healthy serum set as control parameter against HCV infected, HCV induced CLD, and HCV induced HCC. All noteworthy obtained features were also checked individually in all sample files to ensure the correctness of the results.
The obtained resulting data from MetaboScape were examined by univariate student T-test (volcano plot) and multivariate statistical tools. Import of the data to SIMCA (version 15.0, Umetrics, Umeå, Sweden) was carried out for the distribution of distinct groups and detection of outlier by principal component analysis (PCA) whereas overview of after mean centering and Pareto scaling was performed by orthogonal partial least squares discriminant analysis (OPLS-DA)/ orthogonal partial least squares discriminant analysis (OPLS-DA) was performed after mean centering and Pareto scaling to show metabolic alteration in the development of HCV to HCC. A permutation randomization test was also performed in which the distribution of the test statistic under the null hypothesis is obtained. Metabolite identification was done by comparing MS/MS data of significantly distinctive features observed from the volcano plot with the NIST tandem mass spectral library and HMDB.
3 Results
A summary of the study groups is displayed in Table 1. Metabolite profiling of total 147 serum samples including 71 HCV patients, 24 CLD patients, 11 HCC patients, and 41 healthy volunteers (HS) were analyzed by UPLC-QTOF-MS and the representative base peak chromatogram (BPC) of HS, HCV, CLD, and HCC are shown in Supplementary Fig. 1. Most of our patients were males and the mean ages of HS, HCV, CLD, and HCC were 34, 45, 52 and 54 years respectively. HCC group included patients with stage A (n = 05), B (n = 03) and C (n = 03). The majority of HCC and disease control patients had an AFP level > 400 ng/ml. Liver function was assessed to be normal in most patients based on the Child-Pugh score in range of A5 and B7. HCC patients predominantly showed nodular HCC with multinodular: 36.3% and uninodular: 45.4%. While comparing cases and controls, there were no significant variations observed in body mass index (BMI), diabetes, smoking status, statin, and other hypolipemic treatment. Aspartate aminotransferase (AST), Alanine aminotransferase (ALT), Alkaline phosphatase (ALP), Albumin, and Total bilirubin, values were found to be greater in HCC and CLD cases as compared with HCV and HS group. Categorical variables are presented as numbers and percentages; continuous variables are presented as mean and standard deviations. AFP, alpha fetoprotein; ALP, alkaline phosphate; ALT, alanine aminotransferase; AST, aspartate aminotransferase; CLD, chronic liver disease; HCC, hepatocellular carcinoma; HCV, hepatitis C virus; SD, standard deviation.
Variables
Statistics
Control
HCV Patients
CLD Patients
HCC patients
Individuals per group
N
41
71
24
11
Age at recruitment, Years
Mean ± SD
Range34 ± 6
25–5045 ± 9
30–6052 ± 10
30–6854 ± 8
35–66
Hepatitis Viral Load, IU/mL
Mean ± SD
RangeNil
35x 106 ± 15 × 107
(>12–50 × 107)37x106 ± 19 × 107
(>20–55 × 107)40x 106 ± 23 × 107
(>40–65 × 107)
Alpha-fetoprotein (AFP), ng/mL
Mean ± SD
Range5.86 ± 2.03
≤4027.6 ± 3.0
5.4–56.3610.7 ± 150
6.96–27913932.7 ± 420
8.3–65087
HCC Stage*
A
B
CN(%)
N/A
N/A
N/A
5(45.4)
3(27.2)
3(27.2)
Child-Pugh score
A5 to B7
B9 to C13N(%)
N/A
N/A
N/A
7(63.6)
5(45.4)
Tumor characteristics
No tumor
Uninodular
Multinodular
Diffuse and/or metastasesN(%)
N/A
N/A
N/A
-
5(45.4)
4(36.3)
1(9.0)
Liver function tests
Alanine aminotransferase (ALT), U/L
Mean ± SD
Range20.3 ± 6.6
12–3563.6 ± 15.2
19–15385.4 ± 22.1
21–186115 ± 25
23–256
Aspartate aminotransferase (AST), U/L
Mean ± SD
Range29 ± 11
15–55106.3 ± 69.03
29–174150.4 ± 82.2
36–258212.4 ± 77.2
43–343
Alkaline phosphatase (ALP), U/L
Mean ± SD
Range43.6 ± 7.57
30–120118.1 ± 28.64
73–380156.2 ± 28.64
85–427255.6 ± 33.78
88–525
Albumin, g/dL
Mean ± SD
Range4.0 ± 1.5
3.8–5.53.7 ± 0.7
1.71–4.493.1 ± 1.2
1.3–3.922.6 ± 0.6
0.97–3.43
Total bilirubin, mg/dL
Mean ± SD
Range0.7 ± 0.25
0.2–1.03.2 ± 0.8
0.2–5.73.8 ± 1.5
0.3–8.94.5 ± 5.8
0.5–11.41a
3.1 Metabolic profiling and identification
MetaboScape software generated 2599 features in all samples. These features on filtering, followed by ANOVA, results in 129 features showing significant up/down-fold changes in HCC, 96 in CLD, and 52 in HCV infected in contradiction of healthy control generated with Benjamini Hochberg FDR at<0.05p-value and fold change > 1.5. Volcano plot also showed notable features between HS vs HCV, HS vs CLD, and HS vs HCC. After combining the two lists, 13 features have been commonly identified by comparing the MS/MS spectra with those available in the NIST tandem mass spectral library and 05 features are identified by HMDB, based on their MS/MS spectra while 03 features were annotated on the basis of exact mass only, shown in Table 2. LPC, lysophosphatidylcholine
S.No.
Name
Retention Time
Formula
Ion type
Observed mass
Exact mass
Error (ppm)
Identification level
1
1,20-Eicosatetraenedioic acida
9.71
C20H30O4
[M + H]+
335.2195
335.2216
−6.26
2
2
C17-Sphinganinea
7.79
C17H37NO2
[M + H]+
288.2902
288.2897
1.73
2
3
Glutamyltyrosinea
2.46
C14H18N2O6
[M + H]+
311.1241
311.1237
1.29
2
4
Glycocholic acida
8.76
C26H43NO6
[M + Na]+
488.2985
488.2982
0.61
2
5
L-Aspartyl-L-phenylalaninea
3.03
C13H16N2O5
[M + H]+
281.1134
281.1131
1.07
2
6
LPC 14:0a
9.81
C22H46NO7P
[M + Na]+
490.2903
490.2904
−0.20
2
7
LPC 16:0a
10.14
C24H50NO7P
[M + H]+
496.3397
496.3397
0.00
2
8
LPC 17:0a
10.44
C25H52NO7P
[M + Na]+
532.3371
532.3373
−0.38
2
9
LPC 18:2a
10.07
C26H50NO7P
[M + H]+
520.3396
520.3397
−0.19
2
10
N-Fructosyl tyrosinea
0.8
C15H21NO8
[M + H]+
344.1343
344.1339
1.16
2
11
PAF C-16a
10.54
C26H54NO7P
[M + Na]+
546.3537
546.353
1.28
2
12
Thr-Cys-Arga
5.22
C13H26N6O5S
[M + H]+
379.1759
379.1758
0.26
2
13
Unknown (carbon number 11)a
0.97
C11H20N2O3
[M + H]+
229.1547
229.1546
0.44
2
14
1-Methylguanineb
0.57
C6H7N5O
[M + H]+
166.0724
166.0723
0.60
2
15
Dioleoylphosphatidylcholineb
11.61
C44H84NO8P
[M + H]+
786.5996
786.6007
−1.40
2
16
Hydroxyindoleacetic acidb
1.35
C10H9NO3
[M + H]+
192.0656
192.0655
0.52
2
17
L-Tryptophanb
2.89
C11H12N2O2
[M + H]+
205.0974
205.0971
1.46
2
18
Thyroxineb
7.87
C15H11I4NO4
[M + H]+
777.6947
777.6939
1.03
2
19
3-Indolepropionic acidc
6.41
C11H11NO2
[M + Na]+
212.0684
212.0681
1.41
2
20
Glycerol-3-phosphocholinec
0.43
C8H20NO6P
[M + H]+
258.1099
258.1101
−0.77
2
21
L-Phenylalaninec
6.56
C9H11NO2
[M + H]+
166.0865
166.0862
1.81
2
3.2 Chemometric analysis
Various uni/multivariate statistical analyses were performed for the interpretation of data. The univariate analysis that is volcano plot were plotted on the features observed from MetaboScape software between HS vs HCV (Fig. 1A), HS vs CLD (Fig. 1B), and HS vs HCC (Fig. 1C). The plots presenting orange dots are significantly different from healthy controls by log fold change limit > 1.5 or p-value < 0.05 shown in Supplementary Table 1. Besides the univariate analysis of data, hierarchical clustering was also generated for the clustering of study groups using Mass Profiler Professional (MPP) software 12.5. A dendrogram was generated for the 21 significantly different metabolites (Fig. 2) using their normalized and averaged intensities by applying Harmonic distance metric and complete linkage parameters. Among these 18 were identified and 3 were annotated. The four subject groups were categories into two levels; in level 1, HCC and HCV groups were clustered together with 1.8 × 10⁻⁴ difference, while in level 2, CLD and HS were at dissimilarity level of 5.9 × 10⁻³. On the whole, these two levels were dissimilar from each other with a value of 1.3 × 10⁻².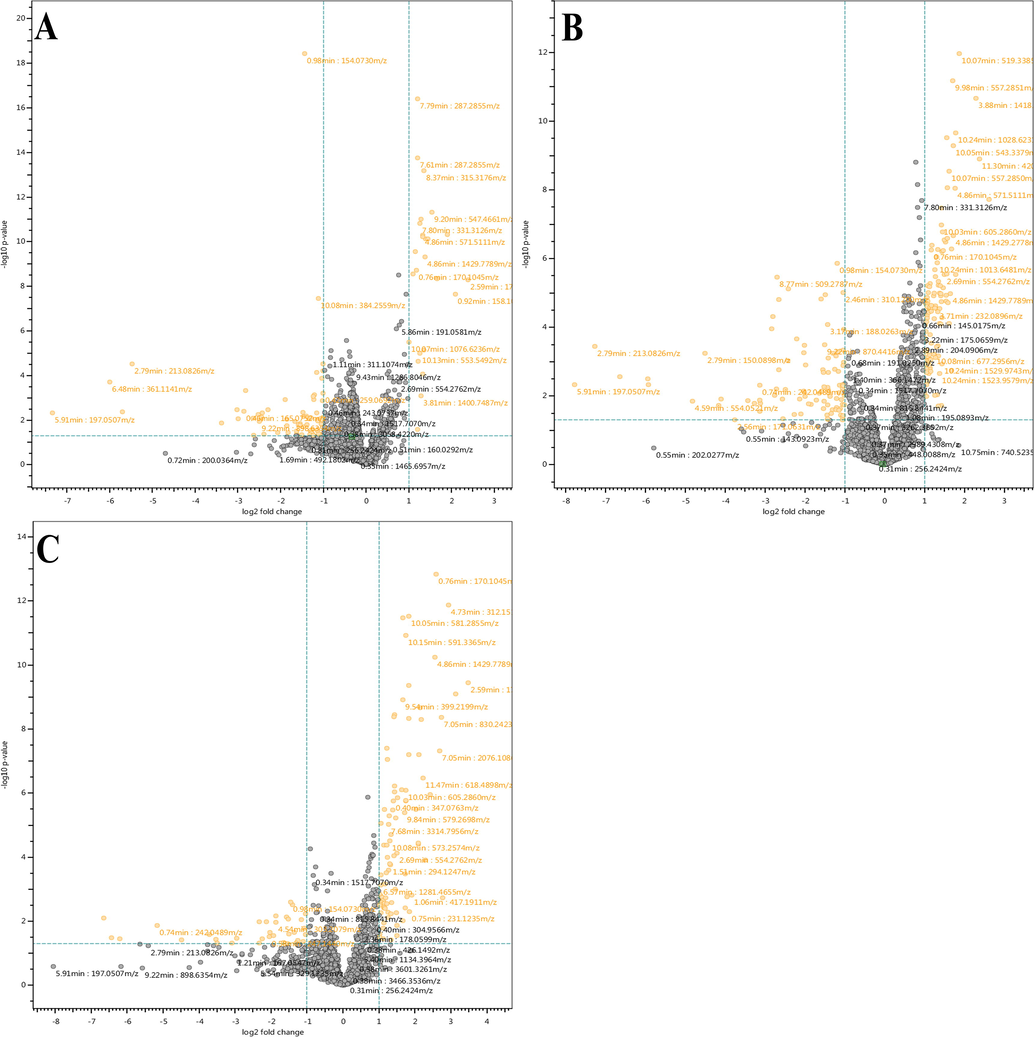
Volcano plots showing significantly distinctive features. (A) HS vs HCV, (B) HS vs CLD, and (C) HS vs HCC.
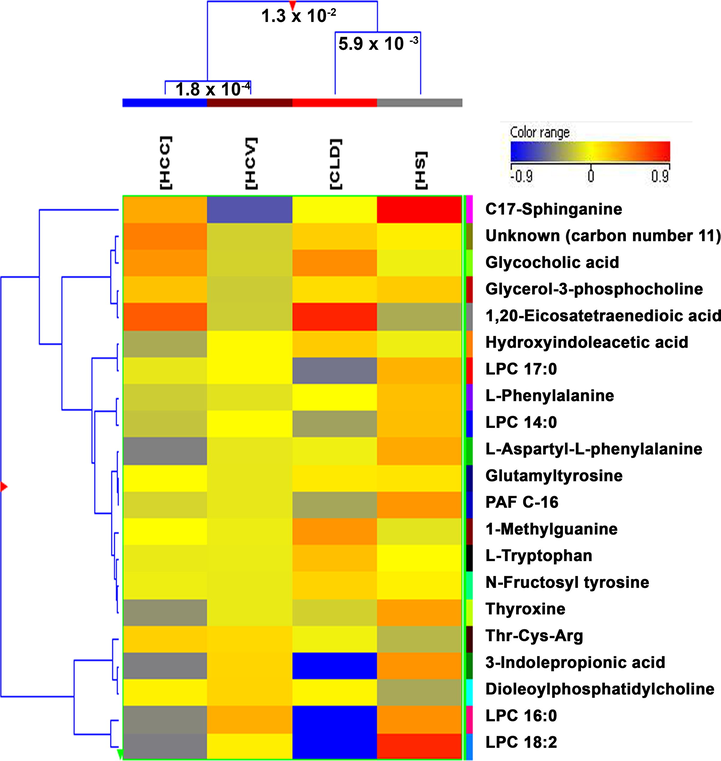
Comparison of four groups; HS, HCV, CLD, and HCC by hierarchical clustering for the 18 identified and 3 annotated features that were found significantly different.
For the multivariate statistical analysis, SIMCA software was used. The PCA scores plot (Supplementary Fig. 2) shows the maximum variability within the groups based on disease category, gender, and age; and doesn’t show any trend of separation between groups. However, the OPLS-DA model (Fig. 3) reveal the evident separation between the all four disease groups after excluding the outliers observed in the PCA by hotelling’s T2 plot (Supplementary Fig. 3). To check the stability of instrument and analysis reproducibility, PCA was generated with QC data (Supplementary Fig. 4) showing all QC pools were lie between the samples.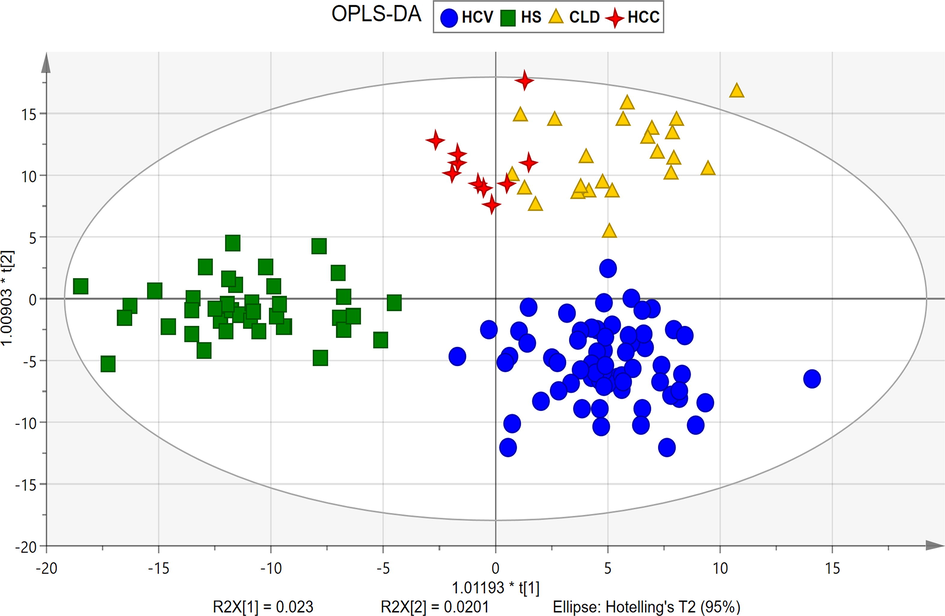
OPLS-DA score plot showing evident separation between all four groups, HS (square), HCV (circle), CLD (triangle), HCC (4-point star).
Internal validation by the ROC curve for OPLS-DA was plotted between the true positive rate (TPR, sensitivity) and false positive rate (FPR, 1-specificity). Our study shows 100% sensitivity; while HCV, CLD, and HCC showed 98.5%, 100%, and 90.9%, specificity respectively. The area under curve values for HS, HCV, CLD, and HCC were found to be 0.99, 1, 1, and 0.89, respectively (Supplementary Fig. 5). The permutation randomization test (500 times) of the OPLS-DA model including correlation coefficient between the original Y and the permuted Y versus the R2 (cum) and Q2 (cum) of HS, HCV, CLD, and HCC with the regression line shown in Supplementary Fig. 6 (A-D). The indication for the validity of the original model is that R2 original point to the right is higher than the permuted values to the left. The intercept (R2 and Q2 when correlation coefficient is zero) for HS, HCV, CLD, and HCC are R2 = 0.496, 0.491, 0.5, 0.509 and Q2 = -0.347, −0.317, −0.312, −0.321 that is very small which shows the model is satisfactory. External validation of the method was done using 16 blind samples and validated using above mentioned internally validated OPLS-DA model (Supplementary Fig. 7). The misclassification table for OPLS-DA (Supplementary Table 2) shows that all samples were correctly classified in their own group except 1 blind sample from the HCV group which classified as HCC samples, this might due to the metabolic profile for the sample which start to shift towards carcinoma.
3.3 Differential metabolites in diseased and healthy control
It has been reported previously that HCC is advanced from CLD (liver cirrhosis) which primarily progresses from HCV infection (Axley et al., 2018), however, it is very hard to identify HCC at an initial stage. Considerable changes were observed in the concentrations of several metabolites in 03 stages of liver disease compared with healthy controls (Fig. 4 and Supplementary Fig. 8) that seems differently in the development of the disease. A group of metabolites 3-indolepropionic acid, LPC 14:0 (1-myristoyl-sn-glycero-3-phosphocholine), LPC 16:0 (1-palmitoyl-sn-glycero-3-phosphocholine), LPC 18:2 (1-(9Z,12Z-octadecadienoyl)-sn-glycero-3-phosphocholine), LPC 17:0 (lysophosphatidylcholine 17:0), PAF C-16, L-tryptophan were found considerably down regulated in CLD as compare to healthy controls. Whereas, 1-methylguanine, glutamyltyrosine, glycocholic acid, unknown (carbon number 11) (ID # 1370), 1,20-eicosatetraenedioic acid shows up-regulation in CLD as compared to HS. N-fructosyl tyrosine and hydroxyindoleacetic acid showed an increase in level from HCV to HCC whereas L-aspartyl-L-phenylalanine and thyroxine showed a decrease in level from HCV to HCC in comparison with HS. L-phenylalanine is up-regulated in HCC and C-17-sphinganine was found down-regulated in HCC as compared to HS. However, glycerol-3-phosphocholine, Thr-Cys-Arg, and dioleoylphosphatidylcholine do not show any clear alteration in their levels.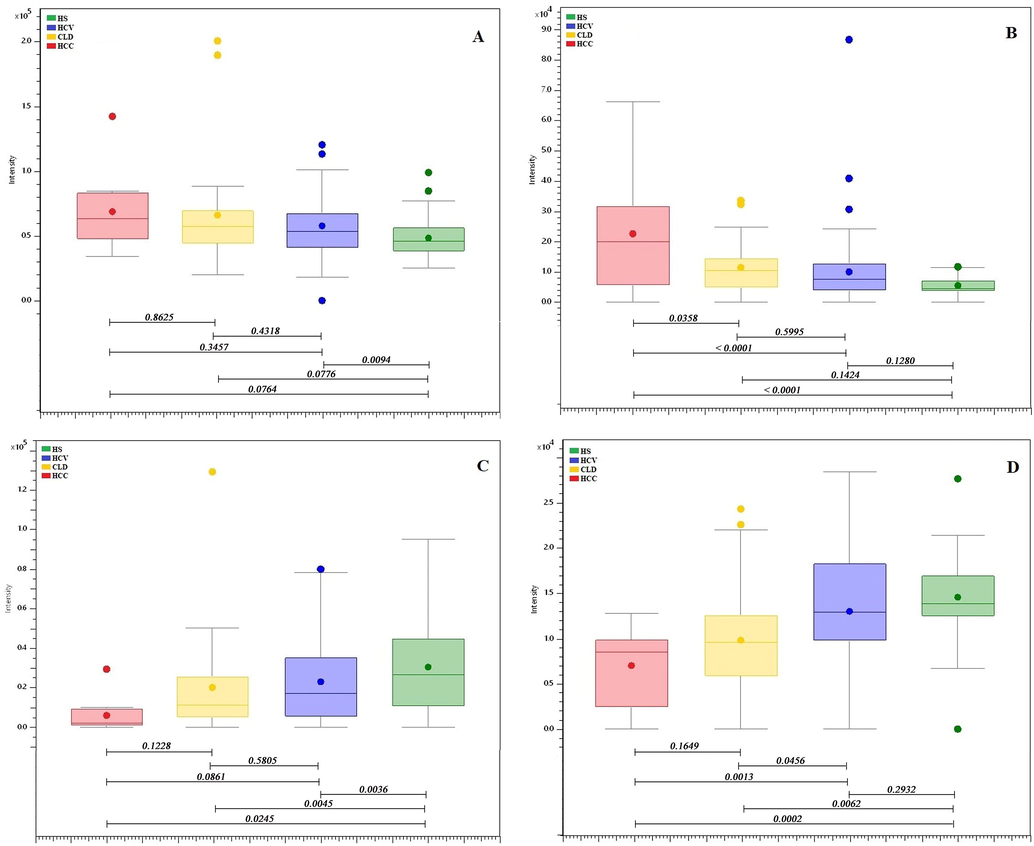
Box-and-Whisker plots of identified metabolites showing the progression of the disease. (A) Hydroxyindoleacetic acid, (B) N-fructosyl tyrosine, (C) L-aspartyl-L-phenylalanine, and (D) Thyroxine.
3.4 Pathway analysis
MetaboAnalyst 4.0 online software (www.metaboanalyst.ca/) was used to identify the biological pathways that are involved in the metabolism and progression of HCV to HCC. About 10 pathways (Fig. 5) were complemented according to the p values, impact factor and FDR value from the pathway enrichment analysis by KEGG metabolic pathway database and HMDB. Consequently, 6 out of 10 identified pathways (glycerophospholipid metabolism, tryptophan metabolism, phenylalanine, tyrosine, tryptophan biosynthesis, aminoacyl-tRNA biosynthesis, phenylalanine metabolism, and tyrosine metabolism) (Chen et al., 2011b, Fitian et al., 2014, Gao et al., 2015) had been reported earlier, however, we have observed alterations only in glycerophospholipid metabolism (Supplementary Fig. 9), phenylalanine, tyrosine, tryptophan biosynthesis (Supplementary Fig. 10), phenylalanine metabolism (Supplementary Fig. 11) and tryptophan metabolism (Supplementary Fig. 12) out of 6 reported pathways with FDR value <1 and p-value < 0.05.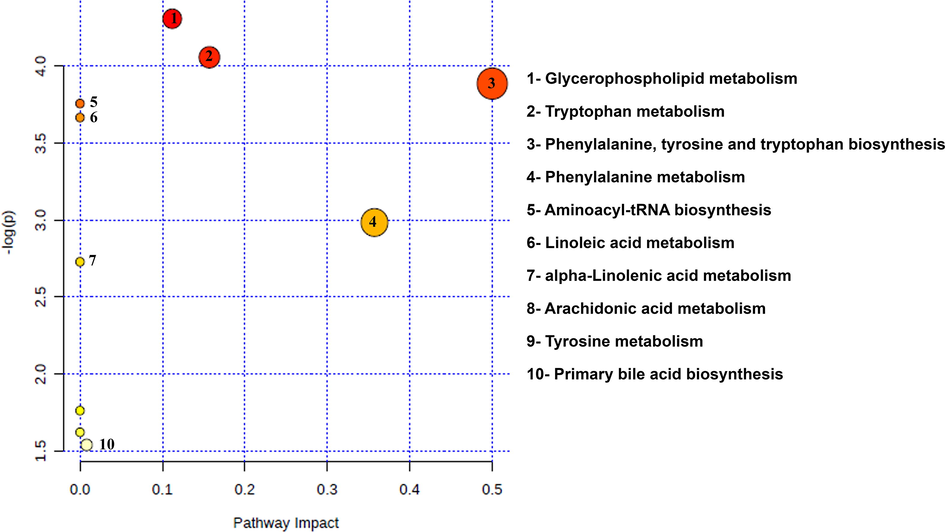
Summary of the biological pathways involved in the liver disease, analyzed by MetaboAnalyst 4.0 Software.
4 Discussion
In the present study, a UPLC-QTOF-MS high-resolution mass spectrometry technique was applied to assess the metabolic characteristics that were associated with the development of hepatocarcinogenesis.
The largest number of molecules of interest that were altered in the serum of HCC patients compared to healthy controls was found to belong to the phospholipid group. Multiple glycerophospholipids (LPC 16:0, LPC 14:0, LPC 17:0, LPC 18:2, and glycerol-3-phosphocholine) were identified and were found to be down-regulated in CLD and HCC in comparison with HS and HCV infection. Alterations in LPC 18:2 and phosphatidylcholine levels were observed and suggest the effect on glycerophospholipid metabolism. An enzyme phospholipase A2, hydrolyze the phosphatidylcholines (PCs) forming LysoPCs, having vast significance in-vivo and is known to participate in various physiological functions which include tumor cell invasiveness, inflammations, and cell proliferation. The lysoPCs may mainly down regulated during the malignant regeneration as a result of fast membrane PC turnover (Chen et al., 2011b, Taylor et al., 2007). Phosphatidylcholine (Dipalmitoylphosphatidylcholine) helps in the protection against liver fibrosis and liver damage however we have identified LPC 16:0 in our samples which may be formed by the breakdown of phosphatidylcholine.
Dysregulation of metabolism (specific to amino acids) in HCC has been reported by several studies (Chen et al., 2011b, Fitian et al., 2014). Previously, serum levels of various amino acids were found to be remarkably increased in HCC in comparison to a healthy individual. L-tryptophan and L-phenylalanine are the essential amino acids and are part of phenylalanine, tyrosine, and tryptophan biosynthesis. It had been reported earlier that the level of L-phenylalanine and L-tryptophan were found elevated in HCC (progresses from hepatitis B virus) compared to HS (Gao et al., 2015) whereas we have observed decrease level of L-tryptophan and L-phenylalanine in HCC (progresses from HCV) compared to HS. From this it can be apparent that the regulation of L-tryptophan and L-phenylalanine in HCC progresses from HCV is different from the regulation of HCC progresses from HBV.
In the present study, hydroxyindoleacetic acid is found to be increased throughout the development of HCV to HCC (Fig. 4A). This compound belongs to indole-3-acetic acid class and is also involved in the tryptophan metabolism. It is formed by the breakdown of serotonin, excreted in urine and found in excess in most tumors, particularly in carcinoids (Wishart et al., 2018). Additionally, a total four metabolites were identified that either increase or decrease with the progression of the disease, however, only hydroxyindoleacetic acid appeared in the biological pathways that were identified by the MetaboAnalyst 4.0 software. The remaining three metabolites that show clear progression in the disease are N-fructosyl tyrosine (Fig. 4B), L-aspartyl-L-phenylalanine (Fig. 4C), and thyroxine (Fig. 4D). L-aspartyl-L-phenylalanine is the metabolic byproduct of aspartame, we found that its level decreases with disease progression from HCV to CLD and HCC. Previously glutamine and aspartame were also reported to be decreased in cirrhosis (Safaei et al., 2016). Aspartame-induced liver inflammation and necrosis are related with glutathione depletion and a decrease in glutathione peroxidase and glutathione reductase activities (Abhilash et al., 2011).
Thyroxine (T4) is the major hormone of thyroid gland and is secreted into the blood from thyroglobulin by proteolysis. The abnormalities or dysfunction of thyroxine is frequently associated with liver disease (Huang and Liaw, 1995). People infected with chronic liver disease might also suffer from thyroiditis, hypothyroidism, and hyperthyroidism. Patients who are inflicted with hyperthyroidism or subacute thyroiditis may demonstrate abnormal liver function in tests, which then resumes normal functionality as the condition of thyroid improves. Our results were also consistent with the previous studies (Malik and Hodgson, 2002). We have observed that as the disease progresses from HCV to HCC, thyroxine level decreases with severity of hepatic dysfunction. Moreover, the increased level of N-fructosyl tyrosine was observed as the disease progresses from HCV to HCC likewise mentioned that the increase in the level of tyrosine in HCC patients is formed by the hydroxylation of phenylalanine (Tessari et al., 2010).
During the investigation, there are some identified metabolites that didn’t match with any metabolic pathway with FDR < 1, however, they were reported earlier in the hepatocarcinogenesis. These include, 1,20-eicosatetraenedioic acid (Loomba et al., 2015), glycocholic acid (Chen et al., 2011b), glutamyltyrosine (Kalhan et al., 2011), 1-methylguanine (Kerr, 1985), and platelet-activating factor (PAF) (Mathonnet et al., 2006).
Taken together, the results presented that identified metabolites may suggest to have some diagnostic and prognostic values for hepatocellular carcinoma and to explore the proportional mechanisms regarding the progression of HCC, these compounds require further investigation with accurate characterization and validation.
5 Conclusion
Untargeted metabolomics investigation of HCV infected, HCV induced CLD, and HCC shows a significant difference in the metabolites pertaining to phospholipid and amino acid metabolism. The statistical tools differentiated diseased individuals and healthy controls with high sensitivity and specificity. The biological pathways of identified metabolites are interrelated and help to understand the mechanism in the development of liver cancer. Interestingly, four metabolites reveal valuable information about the progression of disease, however, further validation of metabolic disturbances and their mechanisms that influences the progression is required. The limitation is the small sample size of CLD and HCC as in most of the cases either patient’s survival rate decreases or may recover at the stage of HCV; hence unable to collect more samples of CLD and HCC. The identified metabolites responsible for the progression of HCV to HCC may be useful to diagnose liver cancer at an early stage by a better understanding of the disease.
6 Funding support statement
The sample collection of study patients and related clinical assessment and diagnostic tests was supported by the Higher Education Commission (HEC), National Research Program for Universities (NRPU) Grant Ref No: 20–3920/NRPU/R&D/HEC/14/405 awarded to Dr. Talat Roome, Dow University of Health Sciences.
Ethics approval statement: Independent Ethics Committee of International Center for Chemical and Biological Sciences had approved the experimental protocol (ICCBS/IEC-040-HB-2018/Protocol/1.0).
Acknowledgments
The authors are thankful to Prof. Dr. Farzana Shaheen for providing internal standards and Ms. Naheed Akhtar and Ms. Nurmeen Adil for their assistance in tagging and aliquoting of the samples. The authors are also grateful to Mr. Arsalan Tahir and Mr. Junaid ul Haq for technical support in MS analysis.
Author Contribution
Study design: SGM, TR; Sample collection and diagnostic studies: TR, AR; Experiments, Investigation and Data interpretation: SK, AA; Statistical Analysis, Software, and Validation: AJS, SK; Biological interpretation: AI, SK. Clinical support and assessment of patients: SMZA, HS; HRES, SGM assisted in reviewing the manuscript. All authors contributed to manuscript writing.
Declaration of Competing Interest
The authors declare that they have no known competing financial interests or personal relationships that could have appeared to influence the work reported in this paper.
References
- Effect of long term intake of aspartame on antioxidant defense status in liver. Food Chem Toxicol.. 2011;49(6):1203-1207.
- [Google Scholar]
- Hepatitis C Virus and Hepatocellular Carcinoma: A Narrative Review. J Clin Transl Hepatol.. 2018;6(1):79-84.
- [Google Scholar]
- Alternations of Metabolic Profile and Kynurenine Metabolism in the Plasma of Parkinson's Disease. Mol Neurobiol.. 2018;55(8):6319-6328.
- [Google Scholar]
- Identification of serum biomarkers of hepatocarcinoma through liquid chromatography/mass spectrometry-based metabonomic method. Analytical and bioanalytical chemistry.. 2011;401(6):1899.
- [Google Scholar]
- Chen T, Xie G, Wang X, Fan J, Qiu Y, Zheng X, Qi X, Cao Y, Su M, Wang X, Xu LX, Yen Y, Liu P, Jia W. Serum and urine metabolite profiling reveals potential biomarkers of human hepatocellular carcinoma. Mol Cell Proteomics. 2011b;10(7):M110 004945.
- Hepatocellular carcinoma: epidemiology and molecular carcinogenesis. Gastroenterology.. 2007;132(7):2557-2576.
- [Google Scholar]
- Diabetes increases the risk of chronic liver disease and hepatocellular carcinoma. Gastroenterology.. 2004;126(2):460-468.
- [Google Scholar]
- Integrated metabolomic profiling of hepatocellular carcinoma in hepatitis C cirrhosis through GC/MS and UPLC/MS-MS. Liver International.. 2014;34(9):1428-1444.
- [Google Scholar]
- Chronic hepatitis C treatment outcomes in low- and middle-income countries: a systematic review and meta-analysis. Bulletin of the World Health Organization.. 2012;90(7):540-550.
- [Google Scholar]
- Serum Metabolomics to Identify the Liver Disease-Specific Biomarkers for the Progression of Hepatitis to Hepatocellular Carcinoma. Sci Rep.. 2015;5:18175.
- [Google Scholar]
- Metabolomics-based methods for early disease diagnostics. Expert Review of Molecular Diagnostics.. 2014;8(5):617-633.
- [Google Scholar]
- Hepatocellular Carcinoma in Pakistan: National Trends and Global Perspective. Gastroenterology Research and Practice.. 2016;2016:1-10.
- [Google Scholar]
- Molecular Mechanisms of Hepatocarcinogenesis Following Sustained Virological Response in Patients with Chronic Hepatitis C Virus Infection. Viruses.. 2018;10(10)
- [Google Scholar]
- Clinical associations between thyroid and liver diseases. Journal of gastroenterology and hepatology.. 1995;10(3):344-350.
- [Google Scholar]
- Plasma metabolomic profile in nonalcoholic fatty liver disease. Metabolism.. 2011;60(3):404-413.
- [Google Scholar]
- Induction of adipocyte formation in 10T1/2 cells by 1-methylguanine and 7-methylguanine. Tumour biology: the journal of the International Society for Oncodevelopmental Biology and Medicine.. 1985;6(2):115-121.
- [Google Scholar]
- Epidemiology of Hepatocellular Carcinoma. Surgical Oncology Clinics of North America.. 2015;24(1):1-17.
- [Google Scholar]
- Polyunsaturated fatty acid metabolites as novel lipidomic biomarkers for noninvasive diagnosis of nonalcoholic steatohepatitis. J Lipid Res.. 2015;56(1):185-192.
- [Google Scholar]
- The relationship between the thyroid gland and the liver. QJM: An International Journal of Medicine.. 2002;95(9):559-569.
- [Google Scholar]
- Platelet-activating factor in cirrhotic liver and hepatocellular carcinoma. World J Gastroenterol.. 2006;12(17):2773-2778.
- [Google Scholar]
- Mechanisms of hepatocellular carcinoma progression. World J Gastroenterol.. 2019;25(19):2279-2293.
- [Google Scholar]
- Aberrant Lipid Metabolism in Hepatocellular Carcinoma Revealed by Plasma Metabolomics and Lipid Profiling. Cancer Research.. 2011;71(21):6590-6600.
- [Google Scholar]
- Liver diseases and herbal drugs:-A review. J Innov Pharm Biol Sci.. 2016;3(2):24-36.
- [Google Scholar]
- Global epidemiology and burden of hepatitis C. Microbes and Infection.. 2002;4(12):1219-1225.
- [Google Scholar]
- Metabolomic analysis of human cirrhosis, hepatocellular carcinoma, non-alcoholic fatty liver disease and non-alcoholic steatohepatitis diseases. Gastroenterology and hepatology from bed to bench.. 2016;9(3):158.
- [Google Scholar]
- Current and future treatments for hepatocellular carcinoma. World J Gastroenterol.. 2015;21(28):8478-8491.
- [Google Scholar]
- Plasma lyso-phosphatidylcholine concentration is decreased in cancer patients with weight loss and activated inflammatory status. Lipids Health Dis.. 2007;6:17.
- [Google Scholar]
- Effect of liver cirrhosis on phenylalanine and tyrosine metabolism. Current Opinion in Clinical Nutrition and Metabolic Care.. 2010;13(1):81-86.
- [Google Scholar]
- HMDB 4.0: the human metabolome database for 2018. Nucleic Acids Res.. 2018;46(D1):D608-D617.
- [Google Scholar]
- Updates in the management of hepatocellular carcinoma. Gastroenterology & hepatology.. 2011;7(1):16.
- [Google Scholar]
- Metabolomic applications in hepatocellular carcinoma: toward the exploration of therapeutics and diagnosis through small molecules. RSC Advances.. 2017;7(28):17217-17226.
- [Google Scholar]
- An Overview of Biomarkers and Molecular Signatures in HCC. Cancers.. 2010;2(2):809-823.
- [Google Scholar]
- Metabolic Perturbation and Potential Markers in Patients with Esophageal Cancer. Gastroenterol Res Pract.. 2017;2017:5469597.
- [Google Scholar]
Appendix A
Supplementary data
Supplementary data to this article can be found online at https://doi.org/10.1016/j.arabjc.2020.11.013.
Appendix A
Supplementary data
The following are the Supplementary data to this article:


