

Translate this page into:
Microbiologically-influenced corrosion of the electroless-deposited NiP-TiNi – Coating
⁎Corresponding authors. abubakr_2@yahoo.com (Aboubakr M. Abdullah), kmahmoud@hbku.edu.qa (Khaled A. Mahmoud)
-
Received: ,
Accepted: ,
This article was originally published by Elsevier and was migrated to Scientific Scholar after the change of Publisher.
Abstract
In this study, we reveal the microbiologically influenced corrosion (MIC) behavior of the new electroless NiP-TiNi nanocomposite coating in simulated seawater using the electrochemical impedance spectroscopy (EIS) technique after different periods of incubation time (7, 10, 14, 21, 28 days) in a sulfate-reducing bacteria (SRB) medium. The biofilm formation and the corrosion products were characterized using the scanning electron microscope (SEM) and X-ray photoelectron spectroscopy (XPS). The EIS results revealed the carbon steel (CS)/NiP-TiNi and NiP-TiNi/SRB biofilm interfaces' characteristics after different incubation times in the SRB media. EIS measurements revealed that the NiP-TiNi nanocomposite coating's MIC resistances are superior relative to API X80 carbon steel and a TiNi-free NiP coating, with ∼93% of corrosion inhibition efficiency after 28 days of incubation.
Keywords
NiP
TiNi nanoparticle
Coating
Microbial Corrosion
Electrochemical Impedance Spectroscopy

1 Introduction
One of the most commonly used iron-carbon alloys for construction pipelines is carbon steel (CS). This is due to its high efficiency and economic value as a way to transport hydrocarbon products that are contained in petroleum products. The most crucial problems occur when using carbon steel pipelines carrying a harsh saline microbial media, which leads to accelerated pipeline failures (Peng and Park, 1994; Javaherdashti, 1999; Jeffrey and Melchers, 2003; Zuo et al., 2004). The presence of the microorganisms in the seawater leads to a biofilm formation by attaching themselves to the pipeline networks where they colonize and proliferate (Scotto et al., 1985). Therefore, biofilms are described as a community of microbial populations that consist of their cells and metabolic products that include extracellular polymeric substance (EPS) (Parthipan et al., 2018; Parthipan et al., 2018). Depending on the structure of the biofilm, various changes occur in the electrochemical behavior at the metal surface and change in the environment surrounding to the metal surface. These changes will trigger the process called biocorrosion or microbiologically influenced corrosion (MIC) (San et al., 2012; Reza, 2008; Mehanna et al., 2009; Sherar et al., 2011; Parthipan et al., 2021). Sulfate-reducing bacteria (SRB) is one of the most destructive microorganisms that are responsible for MIC since they can generate sulfide species in anaerobically environments (Enning et al., 2012; Rasheed et al., 2019; Rajasekar et al., 2010; Parthipan et al., 2021), such as hydrogen sulfides (H2S), metal sulfides, and sulfates, which result in severe damage of the metal surface (Tambe et al., 2016; Vance and Thrasher, 2005; Parthipan et al., 2017). Notably, the production of H2S gas in high concentrations causes intrinsic heterogeneity on the metal surface that leads to electrochemical reactions resulting in harsh localized corrosion processes (Enning and Garrelfs, 2014; Sun et al., 2011; Antony et al., 2010). Furthermore, because of the uncontrolled production of toxins, including sulfide that results from the presence of the SRB in the field, the workers may suffer from health problems and safety risks (Williamson et al., 2011; Crook et al., 2017).
MIC in anaerobic environments may be responsible for almost 25% of the corrosion damage of the metals that take place annually (Duan et al., 2006; Wang et al., 2010). As a result, the research regarding the methods of shielding the surface of the pipelines with a hard and thick protective coating is noteworthy and significant (Wen et al., 2009; Kuber Parande et al., 2005). Current industrial development focuses research on producing the next generation of antibacterial coating to offer safety and an economically valuable solution to guard pipelines against bio-corrosion in accordance with the needs of the petrochemical and oil and gas industries (Beale et al., 2010; Ashassi-Sorkhabi et al., 2012). Occasionally, the formation of biofilms and the colonization of bacteria may cause temporary corrosion inhibition action (San et al., 2014). Autocatalytic electroless NiP coatings have gained a lot of popularity recently because of their exceptional resistance to scratching, corrosion, and general wear (Wang et al., 2017; Fayyad et al., 2018; Ashassi-Sorkhabi and Es′haghi, 2013). The structure of the NiP coating is crucial in determining its properties. The physical, chemical and mechanical properties of the NiP coating can be further improved by incorporating additional hard phase particles in the NiP matrix (Chen et al., 2010; Gay et al., 2007; de Hazan et al., 2010; Fayyad et al., 2018). Besides, other NiP composite coatings were created to minimize the adhesion of the bacteria on the pipeline surface, averting the biofilm formation, such as Ni–Zn–P (Fadl-allah et al., 2016), NiP–PTFE (Zhao and Liu, 2006) and NiP–ND (Chenghuo and Hong, 2017).
Recently, we showed that the incorporation of phase memory alloys TiNi nanoparticles within the NiP matrix significantly improves the microstructure, mechanical, and corrosion resistance of the NiP coating compared with the TiNi – free ones (Fayyad et al., 2019). Additionally, we reported that the electroless NiP-TiNi nanocomposite coating (NiP-TiNi NCC) decreased the cell viability of Escherichia coli from 100% to 19%. However, no previous work has studied the resistance of this coating to MIC, which is highly important before deploying this new coating into the field. In the current work, we present a full systematic electrochemical impedance (EIS) study for the outstanding antimicrobial capability of the newly developed electroless NiP-TiNi nanocomposite coating (NCC) compared with the API X80 bare CS and the TiNi-free NiP coating. EIS fully characterizes the CS/NiP-TiNi and NiP-TiNi/SRB biofilm interfaces. Furthermore, the bulk and surface characterization using scanning and high-resolution transmission electron microscopes (SEM & HRTEM) coupled with energy dispersive x-ray spectroscopy (EDS), and x-ray photoelectron spectroscopy (XPS) are used to evaluate the coating and the biofilm/corrosion products as well as to follow the alteration in the chemical composition and/or the morphology of the coating at different periods of incubation time in SRB.
2 Experimental work
2.1 Materials
Coupons of CS pipeline of type API X80 (Tianjin Tiangang Guanye Co., Ltd., Tianjin, China) and the dimension of 20 × 15 × 5 mm3 were used. The elemental analysis of the CS is showed in Table 1.
Element
C
Si
Mn
Ni
Cr
Mo
Cu
V
Fe
Wt. %
0.13
0.10
0.54
0.02
0.04
0.01
0.02
0.25
balance
The chemicals, acetone, NaOH, Na2CO3, Na3PO4, and H2SO4 were purchased from Sigma-Aldrich (St. Louis, MO, USA) were used for the pretreatment process of the steel coupons. The commercial electroless solution named “Nichem 3100” was purchased from Atotech Deutschland GmbH (Berlin, Germany). It contains two main materials, the essential salt (5–5.5 g L−1 nickel sulfate) and the reducing agent (24–32 g L−1 sodium hypophosphite). Nanoparticles with almost 60–70 nm diameter of Titanium Nickel (TiNi) were obtained from US Research Nanomaterials Inc. Houston, TX 77084, USA.
2.2 Coupon preparation
Emery paper of different grit sizes up to 2000 were used to refine the steel coupon surfaces. For extra refining, micro-polish alumina suspension (3 µm) was utilized. The coupons were pretreated chemically according to the following steps; (i) they were immersed for 15 min in a bath of acetone under ultrasonication for degreasing. (ii) They were submerged for 5 min at 80 ± 5 °C in a chemical solution consisting of 30 g L−1 Na3PO4, 50 g L−1 NaOH, and 30 g L−1 Na2CO3 for chemical pretreatment to remove any contamination and remove the oxide layer. (iii) Solution of 15 wt% H2SO4 was used for etching the polished coupons for 20 s at room temperature to facilitate the adhesion of the coating. Deionized water was used to rinse the coupons after each step of the pretreatment stage. For the NiP coating preparation, (i) adjust the pH and the temperature of the used commercial electroless plating solution (1 L) at 4.5 ± 0.1 and 88 ± 1 °C, respectively; (ii) stir the solution at 300 rpm during the whole electroless plating process for 2 h to avoid the bubble formation within the coating; (iii) submerge the pretreated coupons immediately after the pretreatment process in the electroless solution for plating; (iv) after passing the plating time (2 h), get out the plated samples, wash and dry with deionized water and blowing air. For the preparation of the NiP-TiNi NCC, the commercial plating solution was modified as follows: (i) 1 g of TiNi was added to 1 L of NiP electroless bath; (ii) mix and sonicate the mixture for 60 min, at room temperature, to ensure the homogeneous spreading of the nanoparticle in the electroless solution, using ultrasonic disperser (Fisher Scientific UK Ltd, Loughborough, UK) before starting the plating process. Then, stop and remove the sonicator from the solution. Complete the plating process as previously mentioned for the NiP plating starting from step (ii).
2.3 Coupons incubations with SRB culture
Sludge biomass - enriched mixed SRB culture was used in this study, as described earlier (Rasheed et al., 2019; Rasheed et al., 2018). Briefly, the active SRB culture was prepared using Postgate’s C medium (Postage, 1984; Javed et al., 2017; Wade et al., 2017). A 1000 mL of the Postgate’s C medium consists of 2 g MgSO4/MgCl2, 0.5 g Sodium Citrate, 1 g CaSO4·2H2O, 1 g NH4Cl, 20 g NaCl, 3 g Na2SO4, 0.5 g KCl, 0.04 g SrCl2, 0.1 g KBr, 0.5 g K2HPO4, 3.5 g Sodium Lactate and 1 g Yeast Extract. Initially, 1 N NaOH solution was used to adjust the pH of the medium to approximately 7.5 under anaerobic conditions and was incubated at 35 °C. The blackening of the media was an indication that sulfate had been reduced and sulfide had been produced. SRB inhibition experiments were conducted by incubating the coupons, which are CS, and CS coated with NiP, and NiP-TiNi coatings, in liquid medium containing enriched mixed SRB culture (250 mg VSS L−1) along with modified Postgate C medium. Coupons were incubated in a sealed glass container after purging with N2 gas for 30 min to make an anaerobic atmosphere and kept in a shaking incubator at 37 °C for different time intervals (Jogdeo et al., 2017). At certain time intervals, the coupon samples were removed from the incubation media to perform the electrochemical, bulk, and surface analysis after gently washing with DI water. Recovered coupons from the incubator for the different characterizations after a certain time were used once and were never returned to the incubator again.
2.4 Characterization of the biofilm/corrosion products
The coupons were recovered from the “SRB enriched” media and fixed with 2.5% glutaraldehyde solution and systematically dehydrated using 25, 50, 75, 90, and 100% ethanol (vol %) for 10 min each before carrying out the SEM and XPS analysis (Chen et al., 2016). To maintain dryness, the coupons were kept under a N2 atmosphere. The coating morphologies and the distribution of the TiNi nanoparticles in the NiP matrix were investigated by NOVA NanoSEM 450 SEM and Talos F200X high-resolution TEM (ThermoFisher Scientific, Hillsboro, Oregon, USA), respectively (Fayyad et al., 2019). However, the SEM and EDS analysis of the surface coatings after biofilm/corrosion product formation were investigated by an FEI Quanta 650 FEG SEM (ThermoFisher Scientific, Hillsboro, OR, USA) after sputtering the samples with gold (3 nm). The visual appearance of the incubated coupons after different days of incubation were assessed by capturing optical images using a Nikon digital camera (DSLR D5100). The XPS analysis was performed with ESCALAB 250X (ThermoFisher Scientific, Waltham, MA, USA) using AlKα excitation radiation (25 W, hυ = 1486.5 eV) with 100 eV pass energy and a step size of 1 eV to investigate the corrosion products on the coated samples. For removing the corrosion product, the samples were sonicated in ethanol for 10 s followed by sonication in a solution containing 5 mL L−1 HCl and 3.5 g L−1 hexamethylene tetramine for 5 min. Then, the coupons were rinsed with DI water, dried under N2, and kept at an inert atmosphere until the analysis.
2.5 Electrochemical studies
EIS was used to assess the corrosion performance of the composite coatings after incubation. The experiments were done utilizing a Gamry Reference 3000 electrochemical workstation (Gamry, Warminster, PA, USA) at room temperature in simulated seawater (Kakutani et al., 2017; Zakowski et al., 2014). Table 2 showed the composition of the simulated seawater. Solution media was deaerated with nitrogen gas prior to each experiment.
Salt
g/Kg solution
Sodium chloride (NaCl)
23.93
Sodium sulfate (Na2SO4)
4.008
Potassium chloride (KCl)
0.677
Sodium bicarbonate (NaHCO3)
0.196
Potassium bromide (KBr)
0.098
Boric acid (H3BO3)
0.026
Sodium fluoride (NaF)
0.003
A three-electrode cell containing the measured coupon, graphite rod, and Ag/AgCl electrodes were used as the working, counter, and reference electrodes, respectively. A 10 mV AC amplitude-frequency was utilized and applied over 1 × 10⁻² to 1 × 10⁵ Hz. After obtaining a steady-state open-circuit potential, the EIS data were recorded. A 1 cm2 area of the surface of the incubated coated coupons was exposed to the simulated seawater electrolyte. The obtained EIS data were fitted using Gamry’s Echem Analyst software. The protection efficiency (IE) of the coatings can be calculated using the following Equation (Fayyad et al., 2018):
3 Results and discussion
3.1 Surface characterization and composition of the coatings
The SEM images of the CS, NiP, and NiP-TiNi NCC before incubation in SRB media can be seen in Fig. 1(a, b and c, respectively). The surfaces of NiP (Fig. 1b) and NiP-TiNi NCCs (Fig. 1c) have spherical-like nodules resembling the shape of cauliflower. The presence of TiNi nanoparticles within the NiP matrix results in the less-porous, and more compact structure coating. A further analysis, shown in Fig. S1, was collected using the EDS mapping of the cross-sectional area for the NiP-TiNi NCC, which illustrates the adhesion between the substrate and the composite coating. Moreover, the high concentration of the nickel (80 wt%) and the appearance of P and Ti in the NiP-TiNi NCC, as seen in EDS measurements in Fig. S2, confirms the excellent electroless deposition of the composite coating. Furthermore, as seen in Fig. 2a, TEM measurements illustrate the uniform and homogeneous allocation of the TiNi in the NiP coating. Furthermore, Fig. 2b shows the high angle annular dark-field (HAADF) image, and Fig. 2 (c, d, e, and f) reveals the TEM/EDS mapping measurements for the NiP-TiNi. From both, we can conclude that Ti is more reactive than Ni (Es-Souni et al., 2005); therefore, the appearance of the oxygen in the same place as Ti proves the oxidation of Ti in the TiNi into TiO2, which is known to have high resistance to corrosion and bactericidal activity, as will be shown later. Furthermore, the homogeneous distribution of the TiNi nanopartricles in the NiP coating is clearly observed, as shown in Fig. 2a.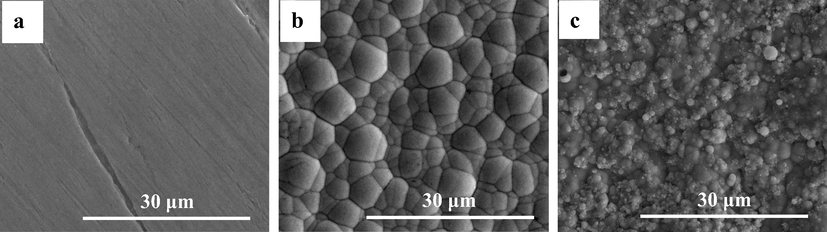
SEM morphological images of (a) CS, (b) NiP, and (c) NiP-TiNi NCC before incubation.
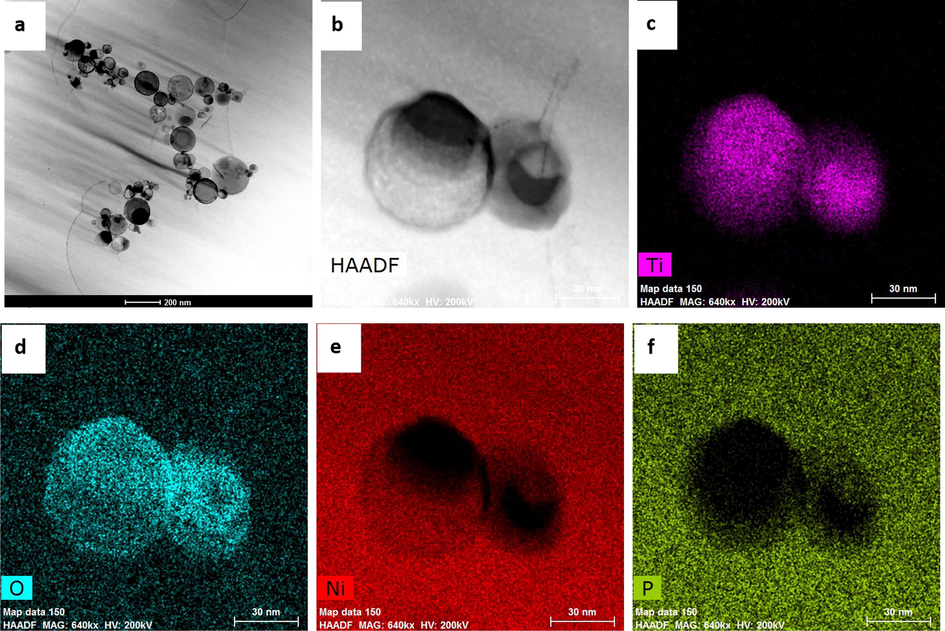
TEM (a and b) HAADF micrographs for the surface of the NiP-TiNi NCC, and EDS mapping for (c) Ti, (d) O, (e) Ni and (f) P present in the coating matrix.
The optical macrographs of the coupons after 0, 7 and 28 days of incubation are given in Fig. 3. A clear layer of biofilm was observed on the CS surface after 7 days of incubation (Fig. 3a′). However, a thinner biofilm layer is visible on the NiP (Fig. 3b′) and NiP-TiNi (Fig. 3c′) surfaces after the same period. After 28 days of incubation, a thick heterogeneous corrosion product layer can only be observed on the CS (Fig. 3a′′) compared with those on the NiP (Fig. 3b′′) and NiP-TiNi NCC (Fig. 3c′′). Fig. 4 gives the SEM images showing the morphological structure of the biofilm formed on the CS, NiP, and NiP-TiNi coatings in SRB inoculated media after 7, 10, and 28 days of incubation. After 7 days of incubation, numerous intact SRB are visible on the CS surface in addition to the heterogeneous, porous, and three-dimensional biofilm covered mainly with EPS (Fig. 4a).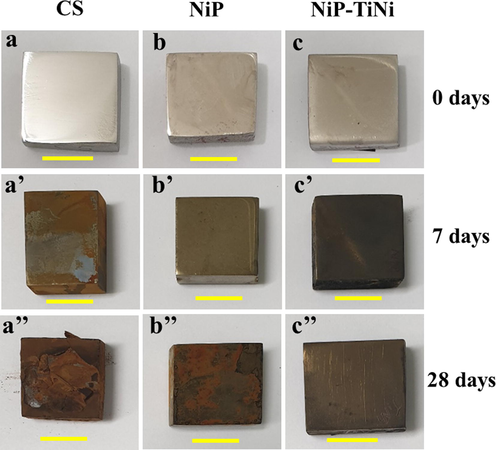
Macrographs of CS (a, a′, a′′) coated with NiP (b, b′, b′′) or NiP-TiNi (c, c′, c′′) coupons after 0 (a, b, c), 7 (a′, b′ and c′) and 28 days (a′′, b′′ and c′′) of incubation in SRB media. The scale bar is 1 cm.
![SEM images of coupon surfaces incubated with SRB [(a, a′, a′′) CS, (b, b′, b′′) NiP and (c, c′, c′′) NiP-TiNi NCC] after (a, b and c) 7, (a′, b′, c′) 10, (a”, b”, c”) and 28 days of incubation.](/content/184/2021/14/12/img/10.1016_j.arabjc.2021.103445-fig4.png)
SEM images of coupon surfaces incubated with SRB [(a, a′, a′′) CS, (b, b′, b′′) NiP and (c, c′, c′′) NiP-TiNi NCC] after (a, b and c) 7, (a′, b′, c′) 10, (a”, b”, c”) and 28 days of incubation.
The bacterial cells can easily adhere to the metal surface with the help of EPS and form a biofilm, as seen in Fig. 4a (Chen et al., 2017). The biofilm formation, in the case of CS, is at its maximum at 7 days of incubation in SRB and starts to decay after 7 days of incubation. Hence, the number of bacterial cells is reduced after 10 days of incubation for the CS coupon, as shown in Fig. 4a′. Very few bacterial cells are present on the NiP and NiP-TiNi coatings after 7 days of incubation, even with apparent damage to the bacteria such as reduced cell size and damaged cell walls (Fig. 4b, and c). There is no significant difference between the SEM images of NiP and NiP-TiNi coupons after 7 (Fig. 4b, and c) and 10 days of incubations (Fig. 4b′, and c′). The possible reasons for this behavior are: (i) both coatings can prevent bacterial attachment on the surface, and (ii) the leaching of metal ions from the coatings may cause bacterial damage. It has been proved that the NiP coating prevents the bacterial attachment, and the release of Ni2+ (because of corrosion) from the NiP coating has been shown to damage the bacterial cell wall (Zhao and Liu, 2006; Zhao et al., 2013; An et al., 2013; Sharifalhoseini et al., 2015; Liu et al., 2018). Also, (iii) in the NiP-TiNi composite coatings, the formation probabality of TiO2 on the surface (Fig. 2c and d) may contribute to the synergic antibacterial activity of the composite (Xing et al., 2012). The TiO2 antimicrobial activity could have a noticeable contribution even in the absence of photo activation (Senarathna et al., 2017) most likely due to the electromagnetic attraction that occurs between the positively charged TiO2 and the microorganisms, which has a negative charge. As a result, oxidation reactions may take place leading to deactivate the cellular enzymes and the DNA of the microorganisms and forming pits in the bacterial cells walls that increase its permeability and promote cell death (Nakano et al., 2013). After 28 days of incubation, the significant portion of the CS surfaces is already covered with heterogeneous corrosion products along with a porous and complicated structure of biofilm (Fig. 4a′′) (Rasheed et al., 2019). The surface morphologies of NiP and NiP-TiNi are entirely different from the CS coupons after 28 days of incubation. A porous kind of corrosion product is visible, and there is no adherent corrosion product layer on the surface, which reveals a significant corrosion inhibition induced by the surface coatings (Fig. 4b′′ and c′′).
EDS analysis given in Fig. S3 reveals the presence of Fe and S on the surface, confirming the SRB-induced corrosion. For the incubated CS, NiP, and NiP-TiNi coupons, the percentage of Fe is 68.75, 4.14, and 2.59%, respectively, while the S percentage is 12.5, 3.2, and 2.45%, respectively. The significant reduction in the Fe and S content confirms the MIC inhibition of the coating surfaces. Also, it is confirmed that the MIC inhibition efficiency of the NiP-TiNi coating is higher than that of the TiNi-free coating, which is also confirmed using the EIS analysis as will be shown later.
3.2 XPS analysis
The XPS survey analysis for CS, NiP, and NiP-TiNi NCC after 28 days of incubation, is revealed in Fig. 5. It accentuates the Fe 2p, C 1s, N 1s, O 1s, S 2p, and S 2s peaks. The peaks for Fe 2p, S 2p, and S 2s in the survey of CS confirm the formation of sulfide and organic sulfur due to the SRB activity. The additional peaks for Ni 2p and P 2p are present in both NiP and NiP-TiNi, which arises from the coating surface and/or the leaching of Ni2+ from the coating into the biofilm suspension. There are no specific peaks for S 2p (in the 160–170 eV range) and S 2s (in the 220–230 eV range) in both NiP and NiP-TiNi coupons, which affirms the lack of sulfide and organic sulfur on the surfaces. In other words, it confirms the MIC inhibition imparted by the NiP and NiP-TiNi coatings on the CS surface. These XPS results are in good agreement with the EIS (shown later) and SEM analysis.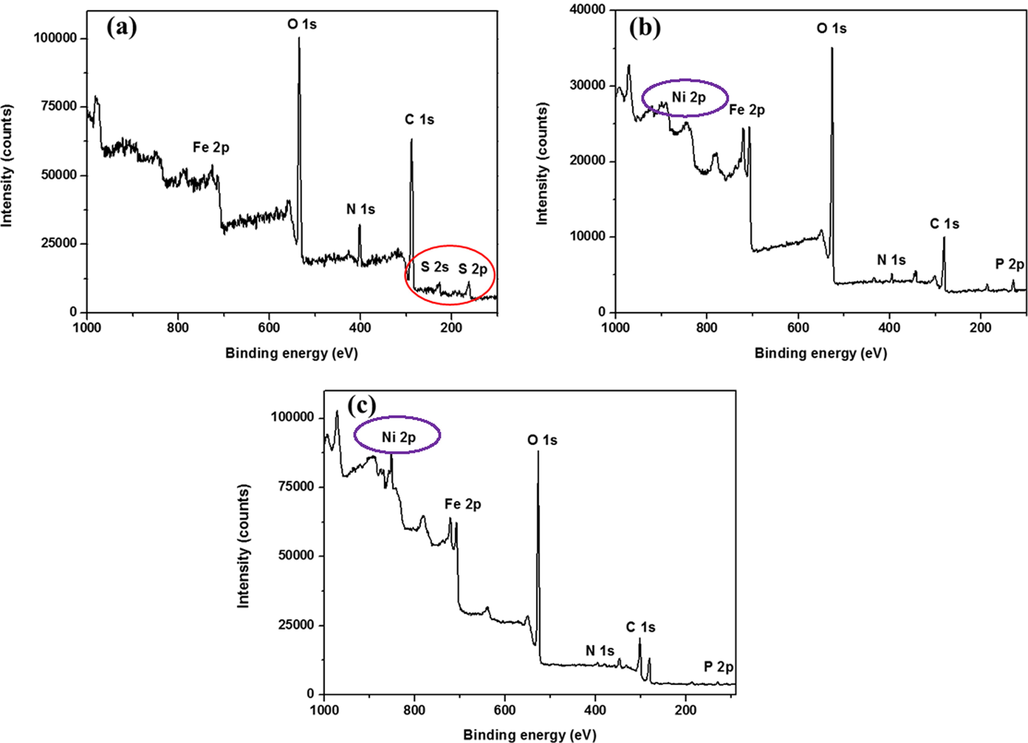
Full XPS survey for SRB (a) CS, (b) NiP and (c) NiP-TiNi. Coupons after 28 days of incubation in SRB.
To explore the nature of the corrosion products on the CS surface, the high-resolution spectra for Fe 2p and S 2p of CS after 28 days of incubation are recorded and shown in Fig. 6. The fitting for the S 2p spectrum shows a monosulfide (S2–) peak at around 161.3 eV (S 2p1/2), disulfide (S22–) peak at 162.2 eV (S 2p3/2), polysulfide (Sn2–) peak at 163.7 eV (S 2p3/2), and SO42– peak at 168.8 eV (S 2p3/2) (Chen et al., 2016; Yuan et al., 2013). The (S2–) and (S22–) peaks may originate from the Fe-S bond, and the Sn2– peak may originate from S-S bonds (Yuan et al., 2013). The fitting for the Fe 2p spectrum shows a sharp peak at 707.6 eV (Fe 2p3/2), which corresponds to mackinawite (Fe1+xS) as well as pyrite (FeS2) and the peak at 710.3 eV (Fe 2p3/2) corresponds to FeS (Yuan et al., 2013). An additional peak at 722.5 eV corresponds to the Fe2+ state is also present in the spectrum (Shaw et al., 2017). The presence of these peaks confirms the formation of FeS, FeS2, FeSO4, and organic sulfur as a result of the SRB activity.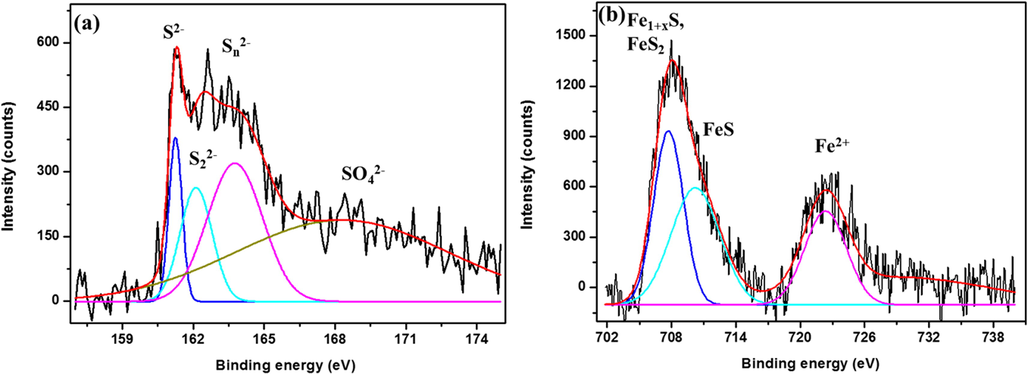
High-resolution spectra of (a) S 2p and (b) Fe 2p for CS coupon surfaces after 28 days of incubation with SRB.
3.3 Post-corrosion morphology
Fig. 7 shows the SEM images of the coupon surfaces (after 28 days of incubation) after removing the biofilm and corrosion products. Surface pitting with a pit size of 2–6 μm is observed in the CS coupon (Fig. 7a), while no pits are present on the NiP (Fig. 7b) and NiP-TiNi (Fig. 7c) surfaces. Also, the EDS analysis is performed after removing the corrosion products to evaluate variations in the elemental compositions of NiP and NiP-TiNi coatings due to the effect of the MIC corrosion, as shown in Fig. S4 (a and b, respectively). There is about 4.15 and 5.01% decrease in the Ni wt % in the NiP and NiP-TiNi coatings, respectively, after removing the corrosion products from the incubated surface in comparison with their coated coupons before corrosion/incubation (Compare Figs. S2 and S4). These results indicate minimal corrosion damage of NiP-TiNi coating compared with the NiP one. This is also confirmed from the traces of Ti (0.94 wt%) in the NiP-TiNi NCC after removing the biofilm clarify that it is not entirely dissolved even after the increased time of incubation of 28 days (Fig. S4b). It also indicates the further antimicrobial ability of NiP-TiNi coating, which will be quantitatively estimated using the EIS measurements.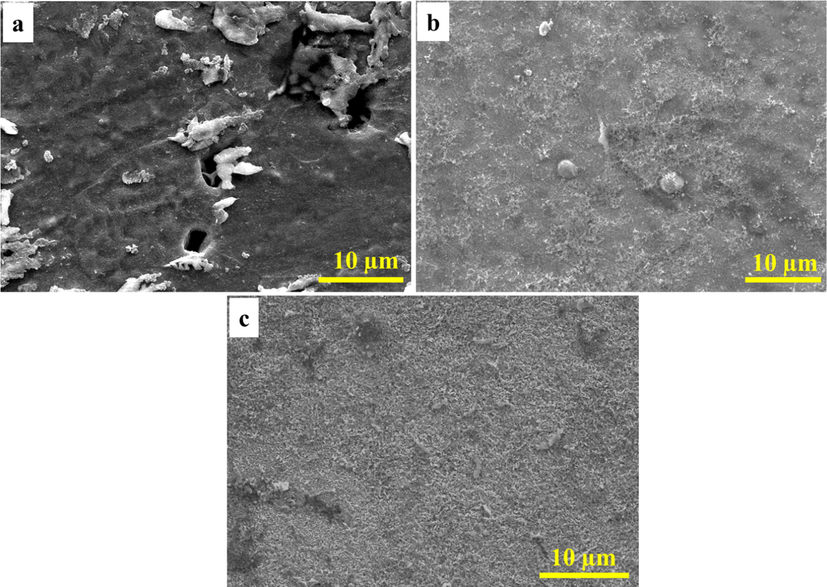
SEM images of the coupon surfaces after removing the biofilm and corrosion products. (a) CS, (b) NiP and (c) NiP-TiNi.
3.4 Electrochemical impedance spectroscopy (EIS)
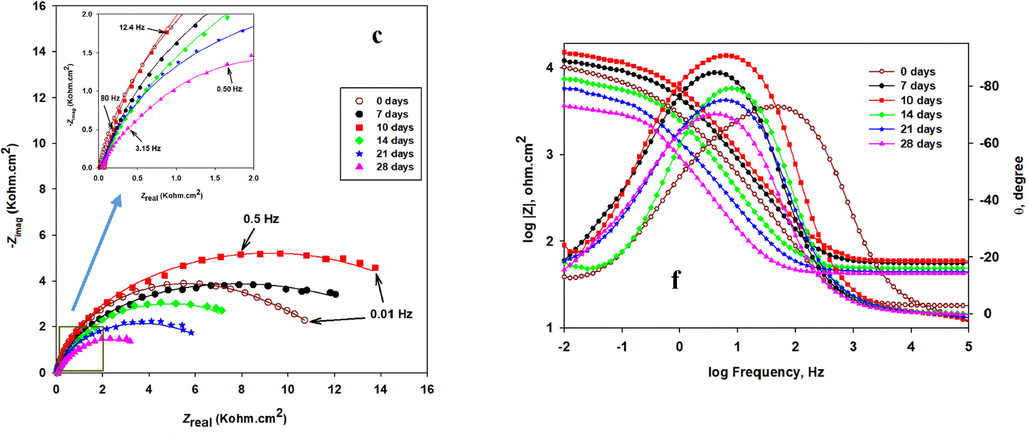
EIS is used to describe the electrochemical behavior at the interface of the metal/biofilm to evaluate the SRB biofilm and its influence on the corrosion process (Yuan et al., 2013). Fig. 8 represents the Nyquist plots (a-c), which are measured at 10 mV AC amplitude-frequency, and their corresponding Bode module |Z| plots (d-f) of the SRB-incubated CS, CS/NiP, and CS/NiP-TiNi, respectively. The magnifications of the low impedance regions of the Nyquist plots of the different coupons can be seen in the insets in Fig. 8(a-c). The incubation with SRB is done for different periods (7, 10, 14, 21, and 28 days), and then the coupons are immersed in simulated seawater at room temperature for the EIS characterization. The EIS spectra for the non-incubated CS, CS/NiP, and CS/NiP-TiNi samples (denoted as 0 days) are examined under the same conditions and used as control samples to compare the electrochemical behavior of the same coupons before and after incubation. The smaller the Nyquist semicircle diameter, the smaller the charge transfer resistance through the metallic surface/electrolyte solution interface, and consequently, the higher the corrosion rate is (Chongdar et al., 2005). Notably, in Fig. 8a for CS, the highest diameter for the Nyquist semicircle of the incubated CS samples is at 7 days of incubation. Although at 10 days of incubation, the semicircle diameter is decreased, it is still wider compared to the control (without incubation), and those incubated for longer periods. This indicates that the protective SRB biofilm formation is completed at 7 days of incubation, which is in line with several previous works (Liu et al., 2015; AlAbbas et al., 2013). After 7 days, a gradual breakdown starts to occur in the protective biofilm leading to higher corrosion rates due to the diffusion of the aggressive electrolyte and the SRB-induced corrosion due to the generated local acidity and sulfide ions. It is reported that the biofilm of the SRB has a substantial inhibitive effect on the corrosion during the first days of incubation (Yin et al., 2018). The SRB-incubated CS/NiP and CS/NiP-TiNi samples switched their behavior with the coating-free CS, where the diameter of the Nyquist semicircles is the highest at 10 days of incubation, not 7 days as in the case of the bare SRB-incubated CS. In fact, due to the presence of P, which is an essential element for the growth of microorganisms (Miettinen et al., 1997), it was expected that the completion of the protective biofilm would be in less than 7 days. The reason for this unexpected behavior is attributed to the presence of Ni and Ti in the NiP and NiP-TiNi coatings, which has an inhibitive effect on the biofilm growth (Vahedi et al., 2017; Yasuyuki et al., 2010). However, the general trend remains the same for the coated and uncoated CS beyond 10 days of incubation, where the diameters of the Nyquist semicircles decrease gradually as the incubation time increases. The order of the diameters of the Nyquist semicircles is as follows: SRB-incubated NiP-TiNi > SRB-incubated NiP > SRB-incubated CS, as shown in Fig. 8 (a, b and c). This order indicates that the NiP coating has significant corrosion protection against MIC. Furthermore, the presence of TiNi nanoparticles in the NiP matrix enhances the MIC resistance (Rct) of the NiP coating by about 73% after 10 days of incubation, as will be shown later in Table 3. This is referred to many reasons; (i) the uniform allocation of TiNi nanoparticles inside the NiP matrix, the compactness, and excellent adhesion of the NiP-TiNi composite coating with the substrate, as shown in Fig. S1, decreases the defects in the NiP matrix and consequently, impedes the SRB from reaching the substrate, (ii) As shown in Fig. S2 (EDS measurements), the addition of TiNi leads to a significant decrease (about 54.5%) in the percentage of the P in the Ni-P coating, and (iii) The presence of Ni, Ti, and the formation of TiO2 in the composite coating, as mentioned in section 3.1, enhances the bactericidal activities of the NiP-TiNi (Yasuyuki et al., 2010; Fu et al., 2005; Lemire et al., 2013). Moreover, (iv) the formation of the biofilm layer that comes from the inhibited SRB in addition to the corrosion products, act as a barrier to the corrosive ions (Castaneda and Benetton, 2008), as displayed later in Table 3 (the comparison of the Rct values of the coatings before and after incubation). This helps in enhancing the corrosion protection of the NiP and NiP-TiNi coatings.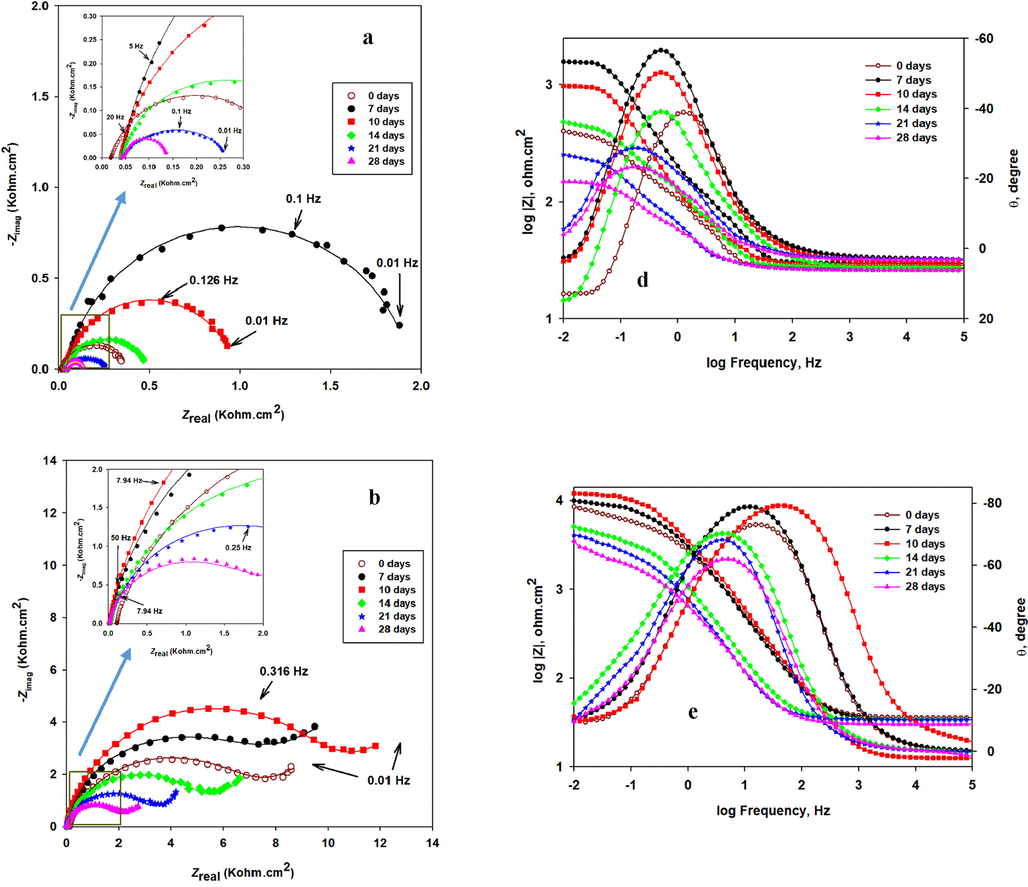
The Nyquist (a-c) and Bode module |Z| and phase angle plots (d-f) of incubated CS, CS/NiP, and CS/NiP-TiNi coatings, respectively, incubated with SRB for different bacterial growth and tested in simulated seawater at room temperature. The inset in a, b and c are the enlargements of the low impedance regions.
The Nyquist (a-c) and Bode module |Z| and phase angle plots (d-f) of incubated CS, CS/NiP, and CS/NiP-TiNi coatings, respectively, incubated with SRB for different bacterial growth and tested in simulated seawater at room temperature. The inset in a, b and c are the enlargements of the low impedance regions.
Coating type
Time (day)
Rf (Ω.cm2)
CPEf
Cf (µF.cm−2)
Rpo (Ω.cm2)
CPEcoat
Ccoat (µF.cm−2)
Rct (Ω.cm2)
CPEdl
Cdl (µF.cm−2)
deff (nm)
W (S.s1/2)
PE (%)
Y01 (sn ohm−1 cm−2)
n1
Y02 (sn ohm−1 cm−2)
n2
Y03 (sn ohm−1 cm−2)
n3
CS
0
7
10
14
21
28---
534
410
275
115
72.5---
299 × 10−6
315 × 10−6
655 × 10−6
7.90 × 10⁻³
15.0 × 10⁻³
---
0.85
0.88
0.86
0.94
0.89---
216.3
238.8
495.5
7852
15,156---
---
---
---
---
------
---
---
---
---
------
---
---
---
---
------
---
---
---
---
---370
1030
875
450
250
1208.20 × 10−3
4.50 × 10⁻³
9.46 × 10⁻³
11.7 × 10⁻³
20.0 × 10⁻³
46.0 × 10⁻³
0.58
0.58
0.65
0.60
0.62
0.5518,317
13,662
29,522
35,409
53,632
186,1220.0039
0.0052
0.0024
0.0022
0.0013
0.0004---
635.8
288
---
---
------
64.1
57.7
17.7
---
---
NiP
0
7
10
14
21
28---
4706
6310
3807
2570
2200---
50 × 10−6
27 × 10−6
61 × 10−6
188 × 10−6
248 × 10−6
---
0.90
0.86
0.88
0.84
0.83---
42.6
20.2
49.9
164
219640
900
1260
1082
617
160523 × 10−6
400 × 10−6
392 × 10−6
464 × 10−6
618 × 10−6
4.57 × 10⁻³
0.87
0.88
0.90
0.90
0.92
0.93444
348
362
430
568
44637900
9400
11,900
7200
4132
2900711 × 10−5
638 × 10−5
175 × 10−5
310 × 10−5
333 × 10−5
618 × 10−5
0.85
0.88
0.82
0.80
0.77
0.7914,475
11,150
3408
6738
7287
13,3100.005
0.006
0.021
0.011
0.009
0.0050.90 × 10−3
1.20 × 10⁻³
1.70 × 10⁻³
36.7 × 10⁻³
20.1 × 10⁻³
8.50 × 10⁻³
95.3
96.0
96.8
94.8
91.0
87.2
NiP-TiNi
0
7
10
14
21
28---
7254
10,260
7070
3477
2010---
28 × 10−6
19 × 10−6
141 × 10−6
264 × 10−6
562 × 10−6
---
0.88
0.86
0.80
0.80
0.84---
22.5
14.5
141
258
575910
1245
2300
1930
1612
1500173 × 10−6
158 × 10−6
117 × 10−6
129 × 10−6
223 × 10−6
549 × 10−6
0.80
0.99
1
0.82
0.88
0.99109
155
117
95
194
54810,900
13,130
20,640
9680
6700
5180446 × 10−5
322 × 10−5
283 × 10−5
342 × 10−5
407 × 10−5
552 × 10−5
0.90
0.92
0.98
0.93
0.91
0.926867
4459
3075
4451
5644
73890.010
0.016
0.023
0.016
0.013
0.009---
5.90 × 10⁻³
5.30 × 10⁻³
---
---
---96.6
97.2
98.2
96.2
94.5
92.9
In the Bode module |Z| plots, the higher values of |Z| at low frequencies indicate the lower rates of corrosion (Su et al., 2015). According to the Bode module |Z| plots of the incubated CS, NiP, and NiP-TiNi samples, Fig. 8(d-f), it is noted that they are consistent with their corresponding Nyquist plots. Obviously, in the phase angle plots for the CS (Fig. 8d), there is a shift in the phase peaks to the low frequencies side with increasing the time of incubation more than 14 days. This shift is attributed to either the presence of SRB, which creates a conductive and porous layer of iron sulfide that has a significant high electrical capacitance that leads to a higher corrosion rate (AlAbbas et al., 2013). Also, it may be due to the electrons consumed from the surface of the steel by SRB through their electron transport pathways (Sherar et al., 2011). Regarding the NiP coating (Fig. 8e), it is noted that there is a smaller shift in the phase peaks to the low frequencies with increasing the incubation time compared to the shift in the phase peaks of the CS whereas, the phase angle θ vs. log frequency plots for the NiP-TiNi nanocomposite coatings do not show that shift with increasing the incubation time. This demonstrates that the NiP-TiNi nanocomposite coating has significant protection against the MIC for extended periods.
The increase in the corrosion rate as the incubation times increases beyond 7 days (in case of CS) and 10 days (in case of the coated CS) is related to the bio-catalytic activities of the SRB, which produces sulfide ions, as in Eq. (3) and subsequently conductive iron or nickel sulfide layers, as in Eq. (6) and Eq. (7). The produced iron or nickel sulfide layer plays an important role in accelerating the corrosion rate. The electrochemical reactions and the bio-catalytic of the SRB are taken place as the following:
In the anaerobic environment, the hydrogen is obtained by the cathodic reaction of the water dissociation
Through the hydrogenase enzymes, the SRB uses the cathodic hydrogen to acquire the needed electrons to reduce the sulfate to sulfide as follows:
Some sulfide ions that produced biologically in Eq. (3) will convert to hydrogen sulfide especially in acidic media as the below:
In the case of the control sample (CS), the anodic reaction of the reduction of the iron takes place as in Eq. (5).
The production of hydrogen sulfide as in Eq. (4) and the oxidation of iron in Eq. (5) encourages the formation of iron sulfide as follows:
Therefore, due to the increase in the metabolic activities of the SRB with increasing the incubation time, higher concentrations of sulfide and other biological compounds are produced on the surface of the coupons that results in enhancing the corrosion process.
In the case of NiP or NiP-TiNi coatings samples, in addition to the previous Eqs, the nickel ions will react with the hydrogen sulfide, as in Eq. (7), forming nickel sulfide, which is the main element in the corrosion products, as shown in Fig. S3 (EDS results). This indicated that the H2S encourages, to some extent, the penetration of the electrolyte through the coating leading to localized corrosion and, consequently, coating detaching, especially after long immersion time (Li et al., 2019).
The fitting (solid lines) of the EIS measured data (dotted symbols) for the different incubated specimens shown in Fig. 8 is done using the electrical equivalent circuits in Fig. 9 (a-f). These equivalent circuits are composed of one (a), two (b, c, and e), and three (d and f) time constants. The equivalent circuits elements are Rs (solution resistance), Rct (charge transfer resistance at the double layer), CPEdl (constant phase element representing a non-ideal capacitor behavior that associated with the electrical double layer at the metal/coating interface), Rf (biofilm resistance), CPEf (constant phase element of the biofilm), Rpo (the coating pore resistance), CPEcoat (constant phase element for the coating), and W (Warburg diffusion resistance). The constant phase element (CPE) is a pseudo-capacitive element, which is related to the surface roughness and inhomogeneity in addition to the non-uniform current distribution at the surface (Gad El-Rab et al., 2012). The impedance of CPE is calculated using the following Equation (Njoku et al., 2017);
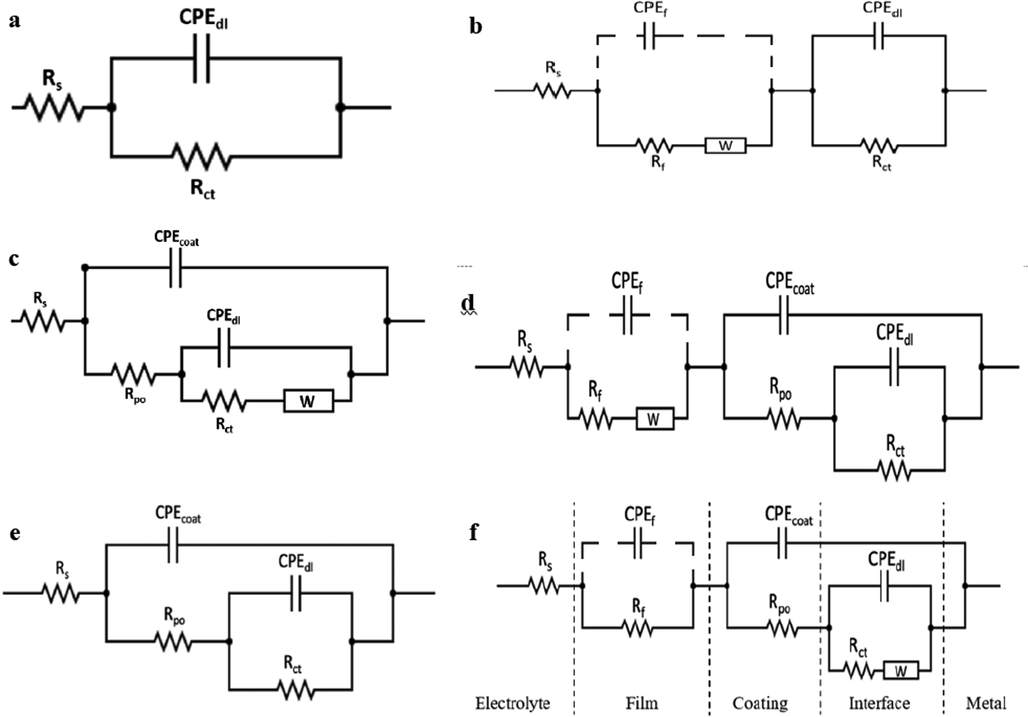
Equivalent circuits that fit the experimental impedance results of the different specimens before (a, c and e) and after (b, d and f) different incubation time with SRB. (a) One-time constant equivalent circuit. (b, c and e) Two-time contants and (d and f) three-time constants equivalent circuits. The dashed CPE elements refer to unmeasured capacitance as the characteristic frequency of this non-ideal capacitor (CPE) is out of the operational limit and the equipment capability.
The full parameters that are deduced from fitting the measured EIS data shown in Fig. 8 using the equivalent circuits in Fig. 9 are expressed in Table 3. It is worth mentioning that the characteristic frequency,
, of the biofilm is in the range of ≥ 26 M Hz, which is out of the operational range of our experiment and the capability of the existing commercial equipment so far. The characteristic frequency was calculated using Eq. (11) (Njoku et al., 2017);
As noticed from Table 3, the value of the Rct for the CS coupon at 7 days of incubation (1030 Ω cm2) is about 2.8 times its value before incubation (370 Ω cm2). This is due to the complete formation of the biofilm on the CS coupon after 7 days of incubation, which is supported by the highest value of the Rf (biofilm resistance). At 10 and 14 days of incubation, although the Rct and Rf values of the CS coupon start to decrease, the biofilm still gives some protection efficiency (about 57.7% and 17.7%, respectively), as shown in Table 3. Therefore, the equivalent circuit of two-time constants with Warburg diffusion element (W) shown in Fig. 9b is utilized to fit the EIS data of CS that measured at 7 and 10 days of incubation only. The Warburg diffusion element (W), is added to the equivalent circuit to be used when the diffusion of chloride ions inside and the corrosion product outside the biofilm is a limiting step. Therefore, W appears in the film’ RC component. Whereas, the EIS data of the CS specimen before incubation is fitted using the one-time constant equivalent circuit (Fig. 9a). However, the two-time constant without the (W) is used to fit the EIS data at 14, 21, and 28 days of incubation for CS specimens since, at that time, the effect of the biofilm is not significant. Consequently, further reduction in the Rct and Rf values of the CS coupons is noticed. This is due to the gradual degradation of the biofilm and the creation of the sulfide and other organic compounds, e.g., EPS, as clarified by the XPS results, at the metal/biofilm interface generating an aggressive medium and enhances the corrosion rate.
Similarly, the Rct values of the NiP and NiP-TiNi coatings at 7 days of incubation are 9,400 and 13,130 Ω cm2, respectively, which are higher than their corresponding values at 0 days of incubation, as shown in Table 3. The difference in Rct values before and after incubation, in addition to the appearance of Rf at 7 days of incubation, clearly indicates the formation of the biofilm. A Further increase in the Rct and Rf values of the NiP and NiP-TiNi coatings at 10 days of incubation has occurred. This indicates a thin passive EPS film, which consists of carbohydrate, protein, humic substances, and lipids, is formed on the coatings after 7 days of incubation time. Nevertheless, after 10 days of incubation, the biofilm thickens is non-uniform, as clarified from SEM images.
Generally, it is well recognized that the low-frequency region refers to the inner layer, whereas the high and the intermediate frequency region reflect the outer layer (Oskuie et al., 2012; Tsai et al., 2010). Before incubation of the coated coupons (NiP or NiP-TiNi), the combination of CPEdl and Rct represents the low-frequency time constant that corresponds to the substrate/coating interface (the inner layer). In contrast, the high-frequency time constant (CPEcoat and Rpo) demonstrates the coating/solution interface (outer layer). The EIS data of the NiP and NiP-TiNi coatings at 0 days incubation are fitted using the two-time constants equivalent circuits with and without diffusion, respectively, as shown in Fig. 9 (c and e). Despite both circuits shown in 9b and 9c having two-time constants, the circuit in Fig. 9c has only a temporary effect of the biofilm and the metal (in series), while the later one has the permanent effects of both coating and metal (in parallel). After the incubation of the NiP and NiP-TiNi coated coupons, a new high-frequency time constant (CPEf and Rf), which demonstrates the formation of the biofilm in the outer layer, exist. Accordingly, the three-time constants equivalent circuits model, Fig. 9 (d and f), are used to fit their EIS data. Since the biofilm has a remarkable effect after 7 and 10 days of incubation, the EIS results of both NiP and NiP-TiNi coatings are fitted using the equivalent circuit shown in Fig. 9d, which has a Warburg diffusion element (W) at the film area. A more incubation time beyond 10 days showed a diminishing of the biofilm effect. Therefore, the equivalent circuit shown in Fig. 9f is suitable to fit the EIS data of NiP coating due to the diffusion of the electrolyte into the coating. Therefore, the (W) component apprears in the interface area. Also, the EIS data of NiP-TiNi coating are fitted using the same equivalent circuits (Fig. 9f) but without diffusion (W) at the interface, which is indicative of barrier coating characteristics. It is noticed that the Nyquist plots of the NiP coating (Fig. 8b) before and after incubation were a semicircle with a straight line at lower frequencies, which may be due to the penetration of the electrolyte and/or SRB within the coating, as previously described. This is consistent with their equivalent circuits models (Figure c, d, and f), which contain the diffusion term (W).
Moreover, the presence of TiNi nanoparticles in the NiP coating increases the Rct and Rpo values of the resulted NiP-TiNi nanocomposite coating, as shown in Table 3, through all incubation times even at 28 days of incubation where there is up to 79% and 838% increase, respectively, in comparison with the corresponding Rct and Rpo values of the TiNi-free coating. As a consequence, the NiP-TiNi coating showed about 93% protection efficiency after 28 days of incubation. All protection efficiencies for all specimens throughout the different immersion time are illustrated in Table 3, which clarifies that the highest efficiency is appeared with NiP-TiNi coating after 10 days of incubation. In addition, the NiP-TiNi coating throughout all the incubation days have the lowest double layer capacitances (Cdl) compared to those of both bare metal and NiP coating, as shown in Table 3. It is worth mentioning that since the Ccoat are related to the porosity of the coatings, low values represent samples with less porosity. i.e., the NiP-TiNi was less porous, resulting in low permeation of chloride ions, which means higher protection against corrosion. Also, since the Cf and Ccoat are related to the porosity of the biofilm and the coatings, respectively, their low values represent samples with less porosity. i.e., the NiP-TiNi coating was less porous, resulting in low permeation of chloride ions, which means higher protection against corrosion. On the contrary, as shown in Table 3, the porosity of the biofilm that is grown on the NiP coating was moderate between that of both the substrate and the NiP-TiNi coating. This means that the high biofilm porosity on CS can permit to the chloride ions to diffuse through it and reach to the substarte causing corrosion. Furthermore, it is noticed that the composite coating have the largest values of the effective thickness of the oxide layer (deff) compared to those of substare and the NiP coating. This confirms the high corrosion protection efficiency of the NiP-TiNi nanocomposite coating against SRB induced MIC during all the incubation time, as shown in Table 3. The reason is referred to the structure and composition of the composite coatings, which delay the massive growth of the SRB. This bacterial growth inhibition occurs due to the easy penetration of the bacterial cell wall by the Ni2+ ions, which are released from the coatings and also the formation of TiO2 that improves the antibacterial activity of the NiP-TiNi composite coating. SEM images shown in Fig. 4 confirm that there are a few bacteria, which are not uniformly distributed on the surface of the incubated NiP-TiNi composite coating.
4 Conclusion
Microbiologically influenced corrosion (MIC) of CS coated with NiP or NiP-TiNi nanocomposite coatings is thoroughly investigated after different incubation periods in SRB media using SEM, EDS, and XPS as well as electrochemically, after immersing the bare and coated CS coupons in the simulated seawater, using EIS. Before incubation, the SEM/EDS and TEM mapping detected the good electroless deposition of the NiP-TiNi composite coatings on the CS with homogeneous distribution of the TiNi in the NiP matrix. After incubation, the XPS confirmed that the biofilm and corrosion products are mainly consisted of iron sulfides and oxides, which are remarkably minimized on the surface of the NiP-TiNi composite coating compared to the other CS, and the TiNi-free coated coupons. The electrochemical analysis showed that the complete formation of the biofilm on the coated CS took a longer time (10 days of incubation) compared with the coating-free CS to reach its maximum protection. In addition, the biofilm presence altered the kinetic behavior of the coated CS by adding extra time constant in the equivalent electrical circuit used to fit the measured EIS data. Furthermore, EIS showed that the charge transfer resistance (Rct) of the incubated NiP-TiNi nanocomposite coated coupon is 43 and 1.8 times higher compared to that of the incubated CS and the incubated NiP coated coupons, respectively, after 28 days of incubation time. Therefore, the presence of TiNi nanoparticles in the NiP matrix in the new NiP-TiNi electroless coating for CS resulted in a distinct antimicrobial corrosion behavior against SRB because of the reduction of the phosphorous in the coating in addition to the formation of TiO2, which is known by its superior activity towards the mitigation of MIC. Thus, the TiNi-NiP coating has excellent potential for applications in the oil and gas fields where MIC is a significant risk.
Acknowledgments
The authors are grateful to the financial support from NPRP grants NPRP8-1212-2-499 and NPRP8-286-02-118 from the Qatar National Research Fund (a member of Qatar Foundation). The statements and findings made herein are solely the responsibility of the authors. Also, this publication was supported by Qatar university Internal Grant No. IRCC-2021-015. The authors would like to thank the Central laboratory Unit (CLU), Qatar University, for SEM analysis. The authors also acknowledge the Core Labs of Qatar Environment and Energy Research Institute, Hamad Ben Khalifa University for the TEM support they provided for this article.
Data availability
The raw/processed data required to reproduce these findings cannot be shared at this time due to technical or time limitations. However, it will be shared with anyone upon request.
Declaration of Competing Interest
The authors declare that they have no known competing financial interests or personal relationships that could have appeared to influence the work reported in this paper.
References
Appendix A
Supplementary data
Supplementary data to this article can be found online at https://doi.org/10.1016/j.arabjc.2021.103445.
Appendix A
Supplementary data
The following are the Supplementary data to this article:


