

Translate this page into:
Novel 2,5-disubstituted-1,3,4-oxadiazole derivatives induce apoptosis in HepG2 cells through p53 mediated intrinsic pathway
⁎Corresponding author at: Associate Professor, Faculty of Pharmacy, AIMST University, Jalan Bedong Semeling 08100, Bedong Kedah Darul Aman, Malaysia. Tel.: +60 44298000; fax: +60 44298009. vasanth1780@gmail.com (P. Vasanth Raj)
-
Received: ,
Accepted: ,
This article was originally published by Elsevier and was migrated to Scientific Scholar after the change of Publisher.
Peer review under responsibility of King Saud University.
Abstract
A series of novel 1,3,4-oxadiazole derivatives (OSD, OCOD, ONOD, OPD, COD, PMOD, and PCOD) were synthesized and characterized. Their structures were confirmed on the basis of IR, NMR and mass spectroscopy and molecular weights were found in the range 300–325 g/mol. Cancerous cell lines (MCF-7, HepG2) and non-cancerous cell lines (Chang liver cells) were treated with these compounds for 48 h, which caused dose dependent decrease in the cell viability. From the seven derivatives, OSD was found to be most potent with IC50 value close to 50 μM on all tested cell lines. Hence, this compound was selected for mechanistic study on HepG2 cell lines. Fluorescent cell staining and DNA fragmentation study of 50 μM OSD on HepG2 cells, showed events marked by apoptosis such as nuclear fragmentation, cytoplasm shrinkage and DNA damage. Further, the cells with same treatment were quantified for apoptosis using annexin V-PI flow cytometric technique. The percentage of apoptotic cells was significantly higher (p < 0.05) after OSD treatment compared to control cells. OSD induced a significant increase (p < 0.05) in the expression of the tumor suppressor p53 in HepG2 cells. The constitutive expression of anti-apoptotic protein Bcl-2 significantly decreased (p < 0.05) after treatment, while the expression of proapoptotic protein Bax significantly increased (p < 0.05). The change in Bax to Bcl-2 ratio suggested involvement of Bcl-2 family in induction of apoptosis. Furthermore, the levels of caspase-9 and caspase-3 were significantly (p < 0.05) up regulated in HepG2 cells after OSD treatment. The data suggest that 1,3,4-oxadiazole derivatives induce apoptosis mediated by intrinsic pathway of apoptosis. The findings strengthen the potential of the 1,3,4-oxadiazole scaffold OSD, as an agent with chemotherapeutic and cytostatic activity in human hepatocellular carcinoma in vitro.
Keywords
1,3,4-Oxadiazole derivatives
Apoptosis
HepG2
Flow cytometry
Intrinsic pathway
Gene expression

- IC50
-
cytotoxic concentration which kills 50% cells
- DMEM
-
Dulbecco’s Modified Eagle’s Medium
- FBS
-
fetal bovine serum
- MTT
-
3-(4,5-dimethylthiazol-2-yl)-2,5-diphenol tetrazolium bromide
- OCOD
-
1-(2-(2-chlorophenyl)-5-(pyridin-4-yl)-1,3,4-oxadiazol-3(2H)-yl) ethanone
- ONOD
-
1-(2-(2-nitrophenyl)-5-(pyridin-4-yl)-1,3,4-oxadiazol-3(2H)-yl) ethanone
- OSD
-
2-(3-acetyl-5-(pyridin-4-yl)-2,3-dihydro-1,3,4-oxadiazol-2-yl) phenyl acetate
- PBS
-
phosphate buffer saline
- PCR
-
polymerase chain reaction
- SDS
-
sodium dodecyl sulfate
- TBST
-
tris buffered saline-tween-20
Abbreviations
1 Introduction
Cell death is an important process in tissue development and homeostasis. Cell death can be through various processes such as apoptosis, necrosis, autophagy and cornification. This depends on the morphological appearance, enzymological criteria and functional aspects of the cell (Kroemer et al., 2005). The term apoptosis, synonymously used for “programmed cell death”, was coined by Kerr et al. Loss of apoptosis is considered as one of the hallmarks in cancer (Hanahan and Weinberg, 2000). Kerr et al. described massive apoptosis in hormone-dependent tumor following hormone withdrawal. This raised the possibility that apoptosis serves as a barrier to cancer (Uren and Vaux, 1996).
Apoptosis is characterized by typical morphological events such as cytoplasm shrinkage, plasma membrane blebbing, fragmentation of DNA and phagocytosis by neighboring cells (Trump et al., 1997). In cancer research, apoptotic pathways have been well studied. Caspases and cysteine aspartate-specific proteases are important players during cell death by apoptosis. Dismantling of cells in apoptosis is executed by caspases (Nicholson, 1999). Activation of caspases is triggered via two important pathways, extrinsic and intrinsic. The extrinsic pathway of apoptosis is mediated by binding of appropriate ligands such as TNF-α and FAS to their receptors. In intrinsic pathway mitochondrion is the central organelle, which is controlled by pro- and anti-apoptotic proteins. This pathway is characterized by release of cytochrome C from the mitochondrial inner membrane into the cytosol. This event is tightly synchronized by pro- and anti-apoptotic members of the Bcl-2 family proteins. Once released into the cytosol, cytochrome C activates cascade of caspases, which eventually leads to cell death. Improved knowledge of these proteins and their mechanism at molecular level has resulted in the discovery of new drugs targeting apoptosis. Alteration of apoptosis by targeting pro- and anti-apoptotic proteins may be a significant way of treating cancer (Alam, 2003).
1,3,4-Oxadiazoles are a class of heterocyclic compounds with broad-spectrum biological activities. Compounds bearing 1,3,4-oxadiazole nucleus are known to exhibit anticancer activity (Abu-Zaied et al., 2011). Although work on pharmacological activities of various substituted 1,3,4-oxadiazole derivatives has been studied well, very few studies have investigated the molecular mechanism involved in apoptotic activity of these compounds (Aboraia et al., 2006; Ouyang et al., 2006).
In this study, anticancer effects of a new series of 1,3,4-oxadiazole derivatives on cultured HepG2 human hepatocellular carcinoma cells were investigated, owing to their potential clinical application and attractive biological activities. The results demonstrated that 1,3,4-oxadiazole derivatives induce considerable death in the HepG2 cells with the dying cells exhibiting the biochemical features of apoptosis. The mechanism by which these derivatives reduced proliferation of human hepatocellular carcinoma cells was also explored by flow cytometry.
2 Materials and methods
2.1 Synthesis of 2, 5-disubstituted-1, 3, 4-oxadiazoles
Isonicotinic acid hydrazide (Isoniazid, 0.03 M) and ring substituted aromatic aldehyde (0.03 M) were dissolved in 25 mL of methanol and refluxed for 30 min in the presence of a few drops of glacial acetic acid. The product separated (Schiff base) was filtered and recrystallized from ethanol (yield 85–90%). The Schiff base was heated over reflux with acetic anhydride for 5 h. The reaction mixture was poured onto ice and stirred for 30 min when the 1,3,4-oxadiazole separated. It was filtered, washed, dried and recrystallized. The seven 1,3,4-oxadiazole derivatives synthesized in the present study were coded OSD, OCOD, ONOD, OPD, COD, PMOD, and PCOD (Durgashivaprasad et al., 2014, 2015). The structures were confirmed on the basis of IR, NMR and mass spectroscopy. The synthetic steps for the preparation of three derivatives are given in Fig. 1.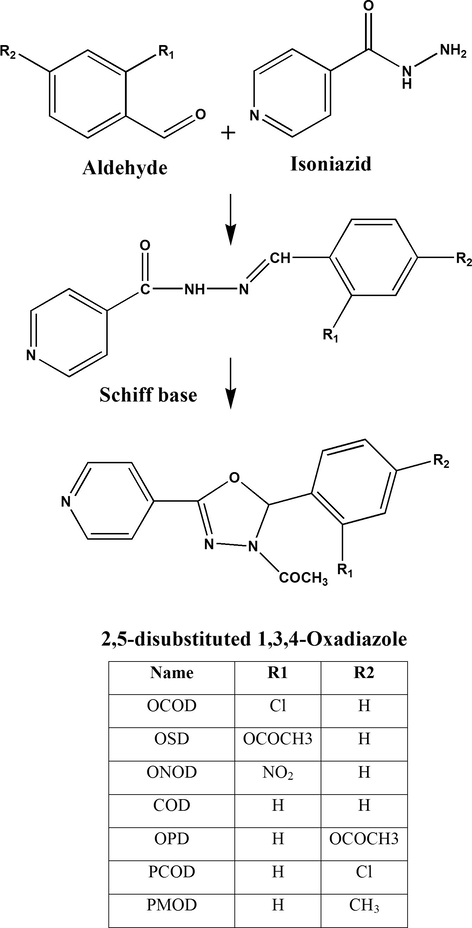
Chemical structures and synthetic steps involved in preparation of derivatives of 2,5-disubstituted-1,3,4-oxadiazoles.
2.1.1 Analytical data for the three compounds (Table 1)
1-[2-(2-Chlorophenyl)-5-(pyridin-4-yl)-1,3,4-oxadiazol-3-(2H)-yl] ethanone (OCOD): MP 82 °C, Yield 60%, IR (KBr) 3022 cm−1 (Aromatic), 1660 cm−1 (N—COCH3), 1267 cm−1 (—C—O—C—), 713 cm−1 (Ar—Cl) NMR (DMSO-d6) δ 2.33 (s, 3H, N—COCH3), 6.9 (s, 1H, —O—CH—N(COCH3), 7.2–7.7 (d, 6H, Ar—H), 8.8 (2H, —CH—N—CH—). [M]+ 302.
Compound
Molecular formula
Molecular weight (g/mol)
Melting point (°C)
OCOD
C15H15ClN3O2
301.06
82
OSD
C17H11N3O4
325
160
ONOD
C15H12N4O4
312.28
165
COD
C17H15N3O2
293.32
65
OPD
C17H11N3O4
325
140
PCOD
C15H12ClN3O2
301.06
120
PMOD
C16H15N3O2
281.31
80
2-[3-Acetyl-5-(pyridin-4-yl)-2,3-dihydro-1,3,4-oxadiazol-2-yl]phenyl acetate (OSD): MP 160 °C, Yield 64%, IR (KBr) 3045 cm−1 (Aromatic), 1768 cm−1 (OCOCH3), 1670 cm−1 (N—COCH3), 1271 cm−1 (C—O—C, asymmetric). NMR (DMSO-d6) δ 2.1(3H, N—COCH3), 2.21 (3H, O—COCH3), 3.16 (1H), 7.2–7.7 (4H, aromatic), 8.7 (4H, pyridine) [M]+ 325.
1-[2-(2-Nitrophenyl)-5-(pyridin-4-yl)-1,3,4-oxadiazol-3(2H)-yl]ethanone (ONOD): MP 165 °C, Yield 70%, IR (KBr) 3060 cm−1 (Aromatic), 1670 cm−1 (N—COCH3), 1530 and 1444 cm−1 (—NO2), NMR (DMSO, d6) δ 2.3 (3H, —COCH3), 7.07 (1H, O—CH—N—COCH3), 7.3–7.6 (6H, Ar—H), 8.6 (2H, —CH—N—CH—), [M]+ 312.
1-(5-(Pyridin-4-yl)-2-styryl-1,3,4-oxadiazol-3(2H)-yl) ethanone (COD): MP 65 °C, Yield: 67%, IR (KBr) 1757 cm−1 (—COCH3), 1676 cm−1 (—CH⚌CH—), 1242 cm−1 (—C—O—C—, asymmetric), 1062 cm−1 (—C—O—C, symmetric), 3470–3030 cm−1 (—Ar), 2920 and 2850 cm−1 (—CH2— of Ar), 1630–1430 cm−1 (—C⚌N, pyridine).
4-(3-Acetyl-5-pyridin-4-yl)-2,3-dihydro-1,3,4-oxadiazol-2-yl)phenyl acetate (OPD): MP 140 °C, Yield 64%, IR (KBr) 1751 cm−1 (—OCOCH3), 1680 cm−1 (—COCH3), 1265 cm−1, (—C—O—C—, asymmetric), 1020 cm−1 (—C—O—C—, symmetric), 2933–2850 cm−1 (CH2—Ar), 3070 cm−1 (Ar), 1598–1411 cm−1 (—C⚌N, pyridine) NMR (DMSO-d6) δ 2.26 (3H, s, —COCH3), 2.28 (3H, s, —OCOCH3), 7.24 (1H, s, O—CH—N—), 7.19–7.57 (4H, m, Ar—H), 7.71–8.80 (4H, m, Ar—H of pyridine); [M]+ 325.
1-(2-(4-Chlorophenyl)-5-(pyridin-4-yl)-1,3,4-oxadiazol-3(2H)-yl) ethanone (PCOD): MP 120 °C, Yield: 71%, IR (KBr) 1660 cm−1 (—COCH3), 713 cm−1 (Ar—Cl), 1267 cm−1 (—C—O—C, asymmetric), 1035 cm−1 (—C—O—C, symmetric), 2958 and 2848 cm−1 (—CH2—, Ar), 3313 cm−1 (—Ar), 1442 cm−1 (—C⚌N, pyridine); [M+1]+ 302.08.
1-(5-(Pyridin-4-yl)-2-p-tolyl-1,3,4-oxadiazol-3(2H)-yl) ethanone PMOD: MP 80 °C, Yield: 64%, IR (KBr) 1317 cm−1 (—CH3), 1670 cm−1 (—COCH3), 1255 cm−1 (—C—O—C, asymmetric), 1022 cm−1 (—C—O—C, symmetric), 3441 cm−1 (—Ar), 2930 and 2835 cm−1 (—CH2—, of Ar), 1612–1411 cm−1 (—C⚌N, pyridine); [M+1]+ 282.17.
2.2 Chemicals
FBS, DMEM, antibiotic–antimycotic, PCR kits, MTT reagent, sulforhodamine B dye (SRB), agarose, and other chemicals for western blotting were purchased from Sigma–Aldrich, St Louis, USA. Primary rabbit polyclonal antibodies against Bax, Bcl-2, p53, cytochrome C, caspase-9, caspase-3 and secondary antibody (goat anti-rabbit IgG-HRP) were purchased from Santa Cruz Biotechnology, Inc., USA. Primers for reverse transcriptase-PCR were purchased from Bioserve Technologies Pvt. Ltd., Hyderabad, India. HEPES sodium salt buffer solution, dithiothreitol (DTT), SDS, bovine serum albumin (BSA), and common laboratory chemicals were purchased from Himedia Lab Pvt. Ltd., Mumbai, India. All other chemicals were of highest grade and were procured from either Sigma or Merck.
2.3 Cell culture and cell viability assay
Human hepatocellular carcinoma cells HepG2 and human breast cancer cells MCF-7, were used in the study. Cell lines were purchased from NCCS Pune, India. HepG2 and MCF-7 cells were grown in DMEM supplemented with 10% heat-inactivated FBS, 1% antibiotic–antimycotic solution in a humidified incubator (5% CO2 in air at 37 °C). Cells (2 × 10⁵ cells/ml) were cultured in T25 flasks.
2.3.1 Cell viability by MTT and SRB assay
HepG2 and MCF-7 cells were seeded for 24 h in 96-well plates at 1 × 10⁴ cells/well. The compounds were added in quadruplicates at different concentrations and incubated for 48 h. For MTT assay (Denizot and Lang, 1986), 50 μL of MTT reagent (2 mg/ml in PBS) was added and incubated for 4 h at 37 °C. The purple colored formazan crystals were then dissolved in 50 μL isopropanol for 15 min with shaking. The absorbance was measured at 540 nm using the microplate reader (Bio-Tek, ELX-800 MS). For Sulforhodamine B (SRB) assay (Skehan et al., 1990), cells were fixed by 50% trichloroacetic acid (TCA). Fixed cells were incubated with SRB (0.4% in TCA) dye for 30 min. Dye was solubilized using 10 mM tris base solution. Absorbance was measured at 540 nm and IC50 was calculated. Cisplatin, a standard anticancer drug was used as positive control.
2.4 Nuclear staining
Condensation of chromatin is a dramatic event in cells undergoing apoptotic death (Trump et al., 1997). Nuclear staining was performed as per the standard protocol (Kumar et al., 2012). Briefly, 1 × 10⁵ HepG2 cells per mL were grown in 12-well plates and subjected to the treatment with OSD at 50 μM concentration or 12 μM cisplatin (both below IC50). After fixing, the cells were stained with acridine orange (0.1 mg/ml) and Hoescht 33342 (10 μg/ml), and observed under fluorescence microscope. When acridine orange intercalates into double stranded DNA it emits green fluorescence upon excitation at 480–490 nm. Hoescht 33342 dye is excited by ultraviolet light at around 350 nm and emits blue fluorescence.
2.5 DNA fragmentation assay
Important signature of apoptosis is the cleavage of nuclear DNA into small-sized fragments (Basnakian and James, 1994). 1 × 10⁵ HepG2 cells per mL DMEM were grown in T25 flasks for 24 h and treated with either 50 μM OSD or 12 μM cisplatin. After 24 h of drug incubation, the genomic DNA was extracted from cells with phenol–chloroform extraction procedure, resolved on 1.5% agarose gel containing 0.5 μg/ml ethidium bromide (Kumar et al., 2014). Fragmentation pattern was observed under UV light with the help of Alpha Innotech, Inc gel doc system.
2.6 Quantitative FITC-annexin V/PI bivariate flow cytometry
Apoptosis determination was done using Sigma’s annexin V-FITC apoptosis detection kit, following the manufacturer’s protocol. Briefly, 1 × 10⁶ HepG2 cells/ml DMEM were cultured and treated with OSD at 50 μM and cisplatin at 12 μM concentrations. After 24 h of incubation, cells were removed with scraper, centrifuged and washed with PBS twice. Cells were suspended in 1X binding buffer (10 mM HEPES/NaOH, pH 7.5 containing 0.14 M NaCl and 2.5 mM CaCl2) and subjected to 5 μl of annexin V-FITC and 10 μl of propidium iodide stain in binding buffer at room temperature for 10 min in the dark (Jain et al., 2013). Apoptotic cells were analyzed by fluorescence-activated cell sorting using Cell Quest Pro software.
2.7 Reverse transcriptase-PCR analysis
50 μM OSD and 12 μM cisplatin were incubated for 24 h over HepG2 cells and the RNA was isolated using trizol extraction procedure (Kumar et al., 2012). The cDNA (complementary DNA) was synthesized from isolated RNA and amplified using primers for Bcl-2, p53, Bax, (Table 3), using Invitrogen’s KOD hot start DNA polymerase as per manufacture’s protocol. PCR product was visualized on 1.5% agarose gel using ethidium bromide and optical densities of DNA bands computed by Alpha Innotech software, USA (Jagani et al., 2013; Mullis et al., 1986). Bands were subjected to statistical analysis. All the values are mean ± SEM of four determinations in triplicate
Sr. no.
Compound
HepG2 mean ± SEM
MCF-7 mean ± SEM
Chang liver cells mean ± SEM
1
OSD
52.71 ± 3.54
15.47 ± 0.79
42.38 ± 2.34
2
OCOD
82.73 ± 3.78
94.19 ± 2.45
65.17 ± 1.57
3
ONOD
114.71 ± 5.11
85.69 ± 1.81
122.20 ± 1.81
4
OPD
395.09 ± 5.65
230.27 ± 1.02
601.79 ± 4.91
5
COD
163.70 ± 4.90
154.15 ± 3.41
297.98 ± 4.64
6
PMOD
529.03 ± 7.22
311.23 ± 0.98
640.46 ± 3.01
7
PCOD
499.13 ± 3.22
289.54 ± 1.73
476.605 ± 3.27
8
Cisplatin
11.09 ± 0.59
10.53 ± 0.56
81.67 ± 2.33
Primer
Sequence (5′–3′)
Annealing temperature (°C)
Bcl-2
F
GGAGCGTCAACAGGGAGATG
56
R
GATGCCGGTTCAGGTACTCAG
Bax
F
CCAAGAAGCTGAGCGAGTGTCTC
56
R
AGTTGCCATCAGCAAACATGTCA
p53
F
CAGCTTTGAGGTTCGTGTTTGT
51
R
ATGCTCTTCTTTTTTGCGGAAA
2.8 Western blot analysis
1 × 10⁵ HepG2 cells/ml DMEM were cultured in T25 flasks for 24 h and incubated with 50 μM OSD and 12 μM cisplatin for another 24 h. After exposure, the total proteins were extracted from cells using Invitrogen’s trizol reagent as per the manufacturer’s protocol. The extracted proteins were quantified by Lowry method after solubilizing the proteins in 0.1% SDS solution. These proteins were then resolved on 15% SDS polyacrylamide gel and transferred onto a nitrocellulose membrane. The membrane was blocked with casein (1%) in Tris buffer saline and incubated overnight at 4 °C with antibodies for Bcl-2, p53, Bax, caspase-9 and caspase-3. β-Actin was used as marker for western blotting. At the end of incubation, the membrane was washed with TBST and incubated with the secondary antibody conjugated with horseradish peroxidase (HRP) for 4 h at 4 °C. The proteins were detected by using TMB/H2O2 as a chromogenic substrate. Bands were subjected to statistical analysis.
2.9 Cytochrome C in mitochondrial fraction
For the detection of cytochrome C in mitochondrial fraction, after 24 h treatment, mitochondria were isolated from HepG2 cells by sucrose density gradient centrifugation (Arnoult et al., 2002; Eskes et al., 1998). Mitochondrial fraction was assessed by western blotting for the presence of Cytochrome C, as described in Section 2.8.
2.10 Statistical analysis
Data are represented as the mean ± SEM of the specified number of experiments. Statistical analysis of the data was done by one-way ANOVA followed by Tukey’s post hoc test (GraphPad Prism Version 5.02, Instat Software, La Jolla, CA, USA). A value of p < 0.05 was considered significant.
3 Results
3.1 Effects on cell viability
The compounds decreased HepG2 and MCF-7 cells viability in a concentration dependent manner. The IC50 value of OSD was significantly lower (p < 0.05) than OCOD, ONOD. Therefore, for further mechanistic studies, OSD was selected as the leading candidate and additionally, a concentration below IC50 was selected for the compound OSD (50 μM) as well as cisplatin (12 μM) (Table 2).
3.2 OSD induced nuclear condensation
Nuclear staining of OSD-treated HepG2 cells with acridine orange (AO) and Hoescht 33342 (Fig. 2) indicated typical apoptotic morphology like nuclear fragmentation (NF) and cytoplasm shrinkage (CS). In contrast, the untreated HepG2 cells showed intact nuclear architecture. The morphological changes induced by OSD and cisplatin were similar and comparable.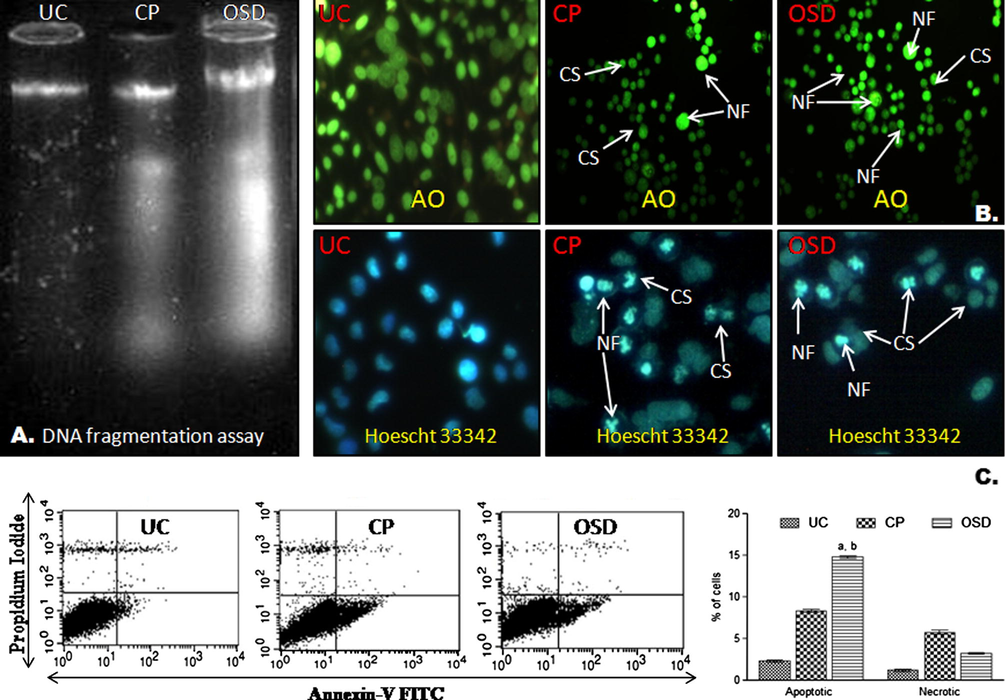
Apoptotic studies. (A) DNA fragmentation assay. DNA extracted from HepG2 cells viewed on ethidium bromide stained gel. DNA from untreated cells (UC), DNA from cisplatin treated cells (CP), and DNA from OSD treated cells (OSD). DNA from OSD treated cells showed fragmentation pattern comparable to DNA from cisplatin treated cells. (B) Nuclear staining of HepG2 cells with Acridine orange (AO)- stained in green color and Hoescht 33342- stained in blue color. Untreated HepG2 cells (UC) had intact, oval nucleus. Arrows indicate cytoplasmic shrinkage (CS) and nuclear fragmentation (NF) in cisplatin (CP) and OSD treated cells. (C) Flow cytometric analysis using annexin-V FITC and propidium iodide (PI). Untreated HepG2 cells (UC), cells after cisplatin treatment (CP), and cells after OSD treatment (OSD). Lower right (LR), % early apoptotic cells (annexin-V stained cells); Upper right (UR), % late apoptotic cells (PI and annexin-V stained cells); Lower left (LL) % live cells; Upper left (UL), % of necrotic cells (PI stained cells). The data are represented as the mean ± SEM of three independent experiments. ap < 0.05 compared to cisplatin; bp < 0.05 compared to necrotic cells.
3.3 OSD induced fragmentation of DNA
The agarose gel electrophoresis of the compound OSD-treated DNA showed fragmentation with a ladder-like pattern. The results of cisplatin were similar (Fig. 2). The control DNA was intact.
3.4 Apoptosis versus necrosis
The percentage of apoptotic cells in the OSD-treated cells was significantly higher (ap < 0.05) compared to cisplatin. The cells in the lower right (LR) quadrant of the histogram (Fig. 2) represent the number of early apoptotic cells stained with annexin V-FITC. The percentage of cells undergoing apoptosis upon treatment with OSD was significantly higher (bp < 0.05) than the necrotic cells.
3.5 OSD increased p53 expression
The treatment of HepG2 cells with 50 μM OSD resulted in a significant increase (p < 0.05) in expression of p53 (Fig. 3A) and basal level of p53 protein (Fig. 3A) compared to the untreated HepG2 cells. Similar results were seen with cisplatin.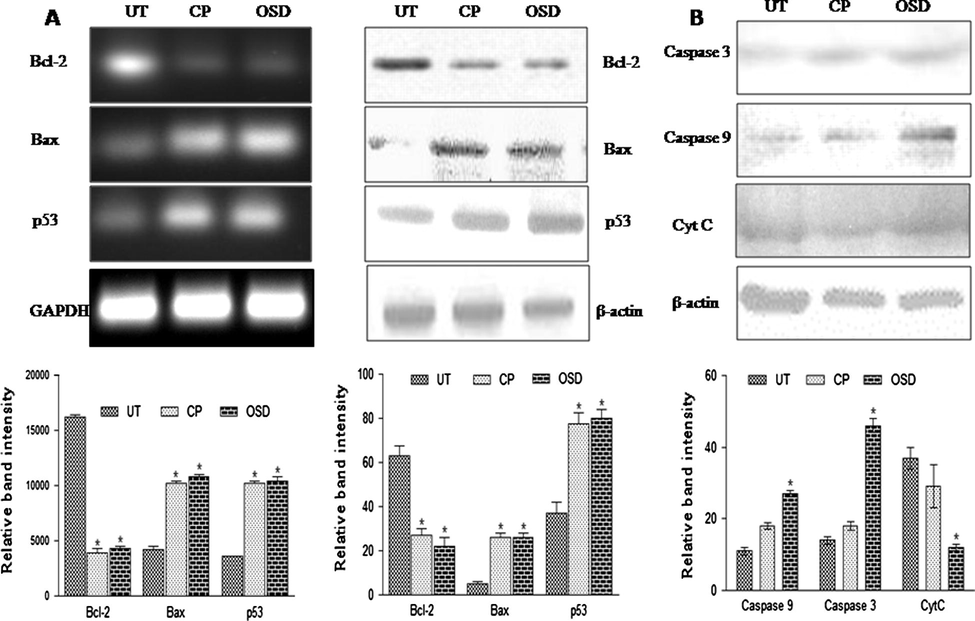
Gene expression studies. (A) Reverse transcriptase PCR and western blot analysis of Bcl-2, Bax and p53. Significant decrease (p < 0.05) in Bcl-2 mRNA expression and significant increase (p < 0.05) in bax and p53 mRNA expression was observed in OSD treated cells when compared to untreated cells (UT). Corresponding results were noted in western blot analysis for all three proteins. Similar results were seen with the mRNA and protein expression of cisplatin (CP) treated cells. (B) Western blot analysis of caspase-3, caspase-9 and CycC. Significant increase (p < 0.05) was found in the caspase-3, caspase-9 protein expression, while a significant decrease (p < 0.05) was noted in CytC of OSD treated cells when compared to untreated cells (UT). Similar results were seen with the protein expressions of cisplatin (CP) treated cells. The data are represented as the mean ± SEM of three independent experiments. p < 0.05 compared to UT.
3.6 OSD altered Bax/Bcl-2 ratio
OSD and cisplatin treatment resulted in significantly decreased (p < 0.05) level of Bcl-2 compared to untreated cells (Fig. 3A). The expression of Bax was significantly higher (p < 0.05) in OSD and cisplatin treated cells. The results indicated that OSD induced apoptosis by altering Bax/Bcl-2 ratio in HepG2 cells as compared to untreated cells.
3.7 OSD activated caspase-9, -3 and induced cytochrome C release from the mitochondria
The expression of caspase 3 and caspase 9 was significantly higher (p < 0.05) in OSD-treated cells, compared to untreated cells (Fig. 3B). OSD also produced a decrease of cytochrome C in mitochondrial fraction of HepG2 cells compared with untreated mitochondrial fraction (Fig. 3). The OSD treatment seems to cause the release of cytochrome C into the cytosol. PCR and western blot analysis of OSD-treated HepG2 cells showed that expression of caspase-9 and caspase-3 significantly increased (p < 0.05) when compared with untreated HepG2 cells.
4 Discussion
In the present work, 2, 5-disubstituted-1, 3, 4-oxadiazoles were synthesized and characterized. The compounds were made by cyclizing a schiff base. The schiff bases were made by a condensation reaction involving isoniazid and seven different aldehydes. These aldehydes have different substitutions. Differing substitutions could produce differences in activities as well, which may be due to differences in physico–chemical properties and binding to relevant biological sites. For instance, in the present case the most active molecule is OSD, which has an acetyl substitution in the phenyl ring at the ortho position. OSD differs from OPD in the position of the substitution. OPD also carries an acetyl phenyl ring, but the acetylation is in the para position. Similarly the other two active molecules, viz., OCOD and ONOD have a chloro and a –NO2 substitution, respectively, at the ortho position in the phenyl ring. It seems that ortho- substitutions on the phenyl ring confers activity, which may be due to interactions with relevant biological sites.
The inhibitory effect of these derivatives was tested on human hepatocellular carcinoma cells HepG2, human breast cancer cells MCF-7 and non-tumoral Chang liver cells. The MTT and SRB results showed antiproliferative activity of these compounds on all three cell lines. However, out of the seven derivatives used for screening of their cytotoxicity, only OSD showed IC50 value close to 50 μM on all tested cell lines. Hence, this compound was selected for mechanistic study on HepG2 cell lines. The dying HepG2 cells exhibited morphological and biochemical features that characterized apoptosis, as shown by chromatin condensation, formation of apoptotic bodies and DNA fragmentation (Fig. 2).
One of the main causes of tumor development is inhibition of apoptosis. Many chemopreventive agents inhibit carcinogenic process through induction of apoptosis (Alam, 2003). Therefore, quantification of apoptosis and necrosis was further studied by flow cytometry using annexin-V FITC and propidium iodide dyes. Data showed that early apoptosis was induced in HepG2 cells after OSD treatment (Fig. 2). The results were comparable to cisplatin.
Tumor suppressor p53 protein is one of the regulators of apoptosis (El-Deiry, 2003). To investigate the possible role of p53 in OSD-induced apoptosis, regulation of p53 mRNA and P53 protein levels was investigated by PCR and western blotting, respectively. It is evident from the results that p53 mRNA level and basal level of p53 protein significantly increased (p < 0.05) after OSD treatment in HepG2 cells. This suggests that apoptosis by OSD is mediated via p53 protein expression.
Both Bcl-2 and Bax are targets of tumor suppressor p53 protein. The role of Bcl-2 family proteins is well known in apoptosis as they are important players in apoptotic cell death. In regulation of intrinsic pathway of apoptosis Bcl-2 and Bax protein ratio has been recognized as a key factor (Lindsay et al., 2010). In the present study, the increase in the OSD-induced apoptosis was associated with significant (p < 0.05) up regulation of protein Bax and significant (p < 0.05) down regulation of protein Bcl-2. Analysis of the data obtained from reverse transcriptase PCR and western blot analysis revealed that OSD affects the Bcl-2/Bax ratio and therefore, leads to mitochondrial membrane disruption in HepG2 cells.
Change in Bax/Bcl-2 ratio disrupts mitochondrial membrane and can promote the release of cytochrome C from mitochondria into the cytosol, which in turn, activates caspase-9 and capase-3 (Lindsay et al., 2010). Caspase-3 is one of the executioners of apoptosis (Nicholson, 1999). The result showed that cytochrome C was reduced in mitochondrial fraction after treatment of HepG2 cells with OSD and the change in Bax/Bcl-2 ratio resulted in release of cytochrome C from the mitochondria. Antibodies in this study for caspase-3 and caspase-9 expression were used against the active form of caspase-3 and 9. Thus increased expression of caspase 3 and 9 represents upregulation of their active form. All these results indicate that OSD induced the apoptotic-signaling pathway in HepG2 cells.
5 Conclusion
OSD exhibits its antiproliferative effect by induction of p53 mediated intrinsic pathway of apoptosis in HepG2 cells. The findings confirm the potential of the 1,3,4-oxadiazole derivative, OSD, as an agent with chemotherapeutic and cytostatic activity in human hepatocellular carcinoma. However, further investigation of its in vivo activity is necessary to exploit its tumor reducing potential and toxicity profile.
Acknowledgments
We would like to thank Manipal College of Pharmaceutical Sciences, Manipal and Manipal University for providing research facility. The financial support from DST-FIST is gratefully acknowledged.
References
- Novel 5-(2-hydroxyphenyl)-3-substituted-2,3-dihydro-1,3,4-oxadiazole-2-thione derivatives: promising anticancer agents. Bioorg. Med. Chem.. 2006;14:1236-1246.
- [Google Scholar]
- Synthesis and in vitro anti-tumor activity of new oxadiazole thioglycosides. Eur. J. Med. Chem.. 2011;46:229-235.
- [Google Scholar]
- Mitochondrial release of apoptosis-inducing factor occurs downstream of cytochrome c release in response to several proapoptotic stimuli. Sci. STKE. 2002;159:923.
- [Google Scholar]
- A rapid and sensitive assay for the detection of DNA fragmentation during early phases of apoptosis. Nucl. Acids Res.. 1994;22:2714.
- [Google Scholar]
- Rapid colorimetric assay for cell growth and survival: modifications to the tetrazolium dye procedure giving improved sensitivity and reliability. J. Immunol. Methods. 1986;89:271-277.
- [Google Scholar]
- Novel 2,5-disubstituted-1,3,4-oxadiazoles as anti-inflammatory drugs. Indian J. Pharmacol.. 2014;46:521-526.
- [Google Scholar]
- Anti-tubercular activity of synthesized novel 2,5-disubstituted-1,3,4-oxadiazole derivatives. Indian Drugs. 2015;52:40-44.
- [Google Scholar]
- The role of p53 in chemosensitivity and radiosensitivity. Oncogene. 2003;22:7486-7495.
- [Google Scholar]
- Bax-induced cytochrome C release from mitochondria is independent of the permeability transition pore but highly dependent on Mg2+ ions. J. Cell Biol.. 1998;143:217-224.
- [Google Scholar]
- Improvement of therapeutic efficacy of PLGA nanoformulation of siRNA targeting anti-apoptotic< i> Bcl-2</i> through chitosan coating. Eur. J. Pharm. Sci. 2013
- [Google Scholar]
- A study on the role of (+)-catechin in suppression of HepG2 proliferation via caspase dependent pathway and enhancement of itsin vitro and in vivo cytotoxic potential through liposomal formulation. Eur. J. Pharm. Sci.. 2013;50:353-365.
- [Google Scholar]
- Classification of cell death: recommendations of the nomenclature committee on cell death. Cell Death Differ.. 2005;12:1463-1467.
- [Google Scholar]
- Elucidation of structure–activity relationship of 2-quinolone derivatives and exploration of their antitumor potential through Bax-induced apoptotic pathway. Chem. Biol. Drug Des.. 2012;80:291-299.
- [Google Scholar]
- Preliminary investigation of cytotoxic potential of 2-quinolone derivatives using in vitro and in vivo (solid tumor and liquid tumor) models of cancer. Arabian J. Chem.. 2014;7:409-417.
- [Google Scholar]
- Bcl-2 proteins and mitochondria-specificity in membrane targeting for death. Biochim. Biophys. Acta (BBA)-Mol. Cell Res. 2010
- [Google Scholar]
- Specific enzymatic amplification of DNA in vitro: the polymerase chain reaction. Cold Spring Harbor Symp. Quant. Biol. 1986:263.
- [Google Scholar]
- Caspase structure, proteolytic substrates, and function during apoptotic cell death. Cell Death Differ.. 1999;6:1028.
- [Google Scholar]
- Oxadiazole derivatives as a novel class of antimitotic agents: synthesis, inhibition of tubulin polymerization, and activity in tumor cell lines. Bioorg. Med. Chem. Lett.. 2006;16:1191-1196.
- [Google Scholar]
- New colorimetric cytotoxicity assay for anticancer-drug screening. J. Nat. Cancer Inst.. 1990;82:1107-1112.
- [Google Scholar]
- The pathways of cell death: oncosis, apoptosis, and necrosis. Toxicol. Pathol.. 1997;25:82-88.
- [Google Scholar]


