

Translate this page into:
Physicochemical parameter influences and their optimization on the biosynthesis of MnO2 nanoparticles using Vernonia amygdalina leaf extract
⁎Corresponding author. yilkal.dessie@astu.edu.et (Yilkal Dessie)
-
Received: ,
Accepted: ,
This article was originally published by Elsevier and was migrated to Scientific Scholar after the change of Publisher.
Peer review under responsibility of King Saud University.
Abstract
The manganese dioxide nanoparticles (MnO2 NPs) were synthesized using Vernonia amygdalina leaf extract which was used as a reducing, capping, and stabilizing agents due to the presence of bioactive phytochemical compounds. Twenty five runs were designed to investigate the effect of V. amygdalina leaf extract ratio (A), initial potassium permanganate (KMnO4) concentration (B), pH (C), and reaction time (D) on the biosynthesized MnO2 NPs using 4-factor, 4-level D-Optimal Response Surface Quadratic Design Model approach. The relationship between physicochemical variables and absorption responses were established using transform second degree polynomial quadratic model. The effects of each absorption responses were analyzed by ANOVA principle using quadratic equations. A very low p-values (<0.0001), non-significant Lack of Fit F-values, and reasonable regression coefficient values (coefficient R2 = 0.9790, adjusted R2 = 0.9496, and predicted R2 = 0.8452) suggested that there is an effective correlation between experimental results and predicted values. Numerical and graphical optimized results demonstrated that the optimized conditions for the predicted absorbance at 320 nm (1.095) were suggested at 43.72%, 1.81 mM, 6.02, and 103.42 min for V. amygdalina leaf extract ratio, initial KMnO4 concentration, pH, and reaction time, respectively. Under these optimal conditions, the average absorbance from four experimental run was recorded to be 0.9678. This result was very closest to the predicted values. The average size elucidated by X-ray diffraction (XRD) analysis was found in the range between 20 nm and 22 nm. The stretching/or and vibrational, surface topography, thermal, and surface roughness as well as its porosity distributions were investigated by UV–Vis spectroscopy, Fourier transforms infrared (FTIR), scanning electron microscopy (SEM), differential scanning calorimeter (DSC), and Gwyddion software analysis.
Keywords
Manganese dioxide nanoparticles
Vernonia amygdalina
Optimization process
D-optimal design
Physicochemical parameters
Surface roughness

1 Introduction
Nanomaterials with good performance have a versatile and superior properties corresponding to the bulk counterparts (Bayoudh et al., 2015). Among these nanomaterials, metal oxide nanoparticles (NPs) have concerned a considerable interest attention due to their wide ranging potential applications (Jaganyi et al., 2013). Metal oxides in the form of diatomite ternary complex (Li et al., 2019a), core-shell structure (Yang et al., 2014), diatom hybrid structure (Li et al., 2019b), and ternary nanocomposites (Huang, 2019) exhibited a high supercapacitors performances applications due to providing a fast ionic channels. One of these oxide NPs, different forms of manganese oxides (e.g., MnO, MnO2, Mn2O3, and Mn3O4) are an interesting classes of inorganic materials due to having wide range of oxidation states, various physical and chemical properties, green nature, and cost-effectiveness (Jassal et al., 2016; Kareem Jassem et al., 2019). MnO2 NPs have attracted a required material of interest because of its low cost, compatibility, environmental friendly nature, catalytic effectiveness (Moon et al., 2015; Sen et al., 2013), electrochemical and surface functionality (Dessie et al., 2020, 2019). Its existence in different crystallographic forms like α, β, γ, and δ, redox stability, and fast electrokinetics activity due to its high surface area and presence of large number of active sites makes MnO2 NPs is an important functional material (Yuan et al., 2014). Thus, the significant interest to synthesis and obtain a well dispersed, uniform, and an ultrafine MnO2 NPs have been a current strategy for wide range of applications (Moon et al., 2015). In order to improve its application performance as well, MnO2 could be synthesized through several chemical methods, such as immersion (Le et al., 2019), hydrothermal (Chen et al., 2018a), electrochemical (Mahmudi et al., 2018), precipitation (Touach et al., 2016), and quick chemical precipitation technique at different temperature (Kareem Jassem et al., 2019).
Bitter Leaf (Vernonia amygdalina) is derived from the leaves of a small ever-green shrub found in tropical Africa and Asia, As the name implies, the leaf is bitter to taste (Alara et al., 2019). The plant grows in a range of ecological zones in Africa and the Arabian Peninsula (Adiukwu et al., 2017). It belongs to Asteraceae and genus Vernonia family and used as a common traditional medicine in Ethiopia to treat various diseases (Habtamu and Melaku, 2018). The crop has thousands of species. These plant leaves have great nutritional, herbal, and medicinal value. It was reported that, at least 13 other new compounds have been found in these leaves (Boyo et al., 2012). According to the work done by Alara et al. (Alara et al., 2019), the ethanolic extract of V. amygdalina leaf contains flavonoids, alkaloids, steroids, terpenoids, glycosides, tannins, phenols, saponins, and the absence of anthraquinones. The presence of such bioactive phytochemicals and other secondary active molecules, such as resins, proteins, carbohydrates, and saponins in their leaves are responsible for an anti-oxidants bioactivities (Alara et al., 2019; Nasrollahzadeh et al., 2018). Such bioactivities help to synthesis NPs having lower dimensional structure (<100 nm) (e.g., Ag2O) (Widyaningtyas et al., 2019). Chemically, the presence of active biomolecules in plants helps for nucleation and growth mechanism in green methodology for efficient metal oxide based NPs preparation (Sanchez-Botero et al., 2017).
An extensive biological sources from plant extracts and microorganisms help to synthesis NPs from its metal precursors (Singh et al., 2016). Since, microorganisms (either bacteria or fungi) mediated based synthesis is not feasible for large scales production due to the requirements of highly aseptic conditions, and cell culture maintenance. To solve these problems, emphasis are given to plant based synthesis rather than microorganisms due to ease of improvement, i.e., it eliminates the elaborate process of maintaining cell culture, safe to handle with a full range of metabolites and other active groups, as well as its simplicity to avoid complex mediated synthesis (multi-step reactions) (Sila et al., 2019). Based on such criteria, plant assisted synthesis of NPs have captured a considerable attractive interest in the areas of modern nano-science and technology beyond its flexibility, biocompatibility, and eco-friendly in nature (Prasad and Patra, 2017). Green method has preferred and recognized as an alternative and efficient ways to prepare NPs in a safe, eco-friendly, and biocompatible fashion (Hoseinpour et al., 2018; Ogunyemi et al., 2019) while chemical method which needs high cost and using toxic chemicals may create some hazardous effect (Sivanesan et al., 2017). So, the need to minimize such toxic reagents and to develop a well-dispersed NPs using plants extracts are a well-established strategy in the current research worldwide (Chatterjee et al., 2017; Sanchez-Botero et al., 2017). Recent work supported that NPs from various metal oxides have been synthesized using plant extracts due to their primary anti-oxidant activity (Souri et al., 2019) and efficiency in reducing capability (Hashem et al., 2018). In addition, their stabilizing and capping ability help to prevent a dense aggregation which may hinder the synthesis of small sized NPs (Sila et al., 2019). Hope fully, it was proved that plant bioactive chemicals extracted from its different body parts have a continuous value added activities in various research’s (Adiukwu et al., 2017; Manjula et al., 2019; Ogunyemi et al., 2019). It has been elucidated that most of these biomolecules contains an active functional groups, such as hydroxyl, aldehyde, amine, and carboxyl units, which are a primary source of electrons (Baghkheirati and Bagherieh-Najjar, 2016) and might play an important role in the reduction and stabilization of nanomaterial’s (Dare et al., 2015).
Nowadays, both top-down (dry) and bottom-up (wet) methods have been a key strategy to synthesis well-dispersed NPs. However, the imperfection of surface structure and significant crystallographic damage problem associated with top-down approach leads to prefer bottom-up methodology (Sila et al., 2019). So, the biosynthesis of MnO2 NPs resulting from bottom-up technique using different plant extracts, such as chamomile (Matricaria chamomilla L.) (Ogunyemi et al., 2019), Kalopanax pictus (Moon et al., 2015), Sapindus mukorossi (raw reetha) (Jassal et al., 2016), Vitis vinifera grape stems and Malus domestica ‘Cortland’ apple peels (Sanchez-Botero et al., 2017), Aegle marmelos (Sivanesan et al., 2017), Brassica oleracea (cabbage) (Chatterjee et al., 2017), Phyllanthus amarus (Prasad and Patra, 2017), lemon juice and peel extracts (Hashem et al., 2018), Yucca gloriosa (Hoseinpour et al., 2018; Souri et al., 2019), and Gardenia resinifera (Manjula et al., 2019) have been well studied. However, the green synthesis of MnO2 NPs using V. amygdalina leaf aqueous extract and the way to optimize four main experimental conditions (physicochemical parameters) for the better and stabilized fabrication using Design Expert Software strategy have not been studied elsewhere. Hence, this is the first report to synthesis, optimize, and characterize MnO2 NPs using leaf extract of V. amygdalina.
Physicochemical parameters optimization using classical methods through changing one factor per time is an inefficient and time consuming strategy. Optimizing a single factor using these methods is run by fixing the other factors without considering interactions among themselves. So, such optimizations cannot provide a full insight between two parameter interactions at a time (Liu et al., 2018a). Hence, an efficient, recent, and cost effective mathematical and statistical analysis method known as Response surface methodology (RSM) improves and solves all demerits which were identified from classical methods. RSM is very popular experimental designs to reduce cost and time. It has been widely applied to get the optimum conditions during well dispersed and stabilized NPs synthesis followed by evaluating interaction effects between each process variables (Othman et al., 2017). The design of experiments is a need for deriving a relationship between a response (dependent variable) and a set of experimental factors (independent variables) in many industries at large. However, a completely randomized full factorial design is quite challenging to perform a high number of experimental runs. In such a way as like as I-optimal design, the D-optimal design would reduce the required number of runs to a fraction of the full factorial experiment (Yousefi et al., 2019). In order to achieve an optimal conditions for MnO2 NPs synthesis using Yucca gloriosa leaf extract Souri et al. (Souri et al., 2019), have been reported only 3-factor with 3-level optimization using I-optimal coordinate exchange Design. Since three factors and three levels optimization strategy still lacks to synthesize a well dispersed and stabilized NPs. Therefore, it needs to add an additional factors and levels to obtain more optimized MnO2 functional NPs. Hence to be successful, further research should be needed. So, in this paper, we report a facile green method to synthesize MnO2 NPs by using potassium permanganate (KMnO4) as a starting material and V. amygdalina leaf aqueous extract and employing 4-variables:4-levels followed by analyzing their interactions was conducted for optimization to obtain the higher yield after optimization with D-Optimal Response Surface Quadratic Design Model approach.
2 Materials and methods
2.1 Materials
Potassium permanganate (KMnO4) 99% was supplied by Alpha Chemika (Mumbai, India). The chemical and solvent available for these work were analytical grade and used as received without further purification. Distilled water was used for all experimental run. A double beam UV–Vis spectroscopy (Azzota SM-1600 SPECTROPHOTOMETER, USA) was helped to elucidate and measure the optical properties in the range of 200–800 nm. The thermal analysis was performed using a differential scanning calorimeter (PerkinElmer, DSC 4000, USA). A sample mass of 2.8 mg was placed in DSC aluminum pan. The test was carried out with an empty aluminum pan as a reference, nitrogen (N2) atmosphere with flow rate of 20 mL min−1, and a heating rate of 10 °C min−1 with a process scheme of rapid isothermal treatment to 50 °C in 1 min and then heated from 50 °C to 445 °C. The crystalline phase of the synthesized MnO2 NPs was performed using Shimadzu diffractometer (XRD-7000, Tokyo, Japan) with a voltage of 40 kV and a current of 30 mA using at (Cu Kα = 1.5406 Å) radiation as an X-ray source. The scanning rate was 2° min−1 in the 2θ range from 10 to 80° and the crystallite size of the nanoparticles was found using the Scherrer’s formula. Fourier transforms infrared (FTIR) spectra of the samples were recorded with a Perkin Elmer FT-IR BX spectrophotometer in the range 4000–400 cm−1 with samples prepared using KBr pellets. SEM was performed using a JEOL Ltd. instrument with a model of JCM-6000Plus to observe the structural morphology of MnO2 NPs. After importing the SEM image to the Gwyddion software (http://gwyddion.net), display of 3D data, the height distribution, surface roughness, and pore structure of MnO2 NPs surface was distinguished, calculated, and recorded.
2.2 Collection of plant leaf
Fresh leaves of V. amygdalina was collected from Adama Science and Technology University, Adama, Ethiopia (latitude 8o33′43.56″ North and longitude 39o17′23.28″ East) shown on the supplementary (Fig. S1a). The collected plant leaf was washed three times with distilled water and air dried in the shade until the moisture content was completely removed. The dried V. amygdalina leaf (Fig. S1b) was grounded to reduce its size physically using mortar and pestle to tiny particles (Fig. S1c) and stored in polythene bags until used.
2.3 Preparation of plant extract
10 g dried powder of V. amygdalina was boiled followed by stirring for 15 min in 250 mL Erlenmeyer flask filled with 200 mL of distilled water. A dark brown color extract solution was obtained (see Fig. S2a). The extract was allowed to settle for 30 min at room temperature. Then, the clear extract was collected by filtration using Whatman no. 1 filter paper (see Fig. S2b), and centrifuged at 4000 rpm for 15 min. Finally, the extract (supernatant) with a pH of 6.31 was collect in a colored bottle and stored at 4 °C until further uses.
2.4 Biosynthesis of MnO2 nanoparticles
Different aqueous solutions of initial potassium permanganate concentrations (0.5, 1, 1.5, and 2.5 mM) were prepared in different pH values (4, 5, 6, and 8). Twenty five (25) runs were designed using Design-Expert 11 (version 11.0.5.0) to survey the effect of plant extract, permanganate ion concentration, pH, and reaction time Table 1. To synthesis the required MnO2 NPs, different volumetric ratios (20, 30, 40, and 60%) of V. amygdalina crude extract were added to the above solutions and stirred at room temperature for various time long (45, 60, 75, and 105 min). Each of the samples (precipitates) was obtained by centrifuging at 4000 rpm for 15 min. Finally, the obtained NPs were washed with distilled water and ethanol several times (see Scheme 1), and the washed samples were suspended in 10 mL distilled water for UV–Vis spectrophotometric measurements for optimization. The design expert software was used to evaluate the overall variance analysis (probability < 0.5) at about 95% confidence interval to obtain the superior yield of MnO2. Such better and higher yield in terms of responses were stated using the fitted non-linear equation Eq. (1) given below. The correlation between the experimental factors and the absorbance response at 320 nm was also visualized using three dimensional (3D) graphs. The optimum variables levels for the required yield are attained from the RSM. Therefore, the following second order polynomial equation was used to evaluate the relationship between different physicochemical variables and the response (Othman et al., 2017).
Std+
Run
Factor 1
Factor 2
Factor 3
Factor 4
Absorbance (320 nm)
A: Extraction (%)
B:Permanganate ion (mM)
C:pH -
D:Time (Minute)
Actual (non-transform)
Actual (transform to sqrt)
Predicted (transform to sqrt)
9
1
60
2.5
8
45
0.967
0.9834
0.9343
22
2
60
2.5
8
105
0.985
0.9925
1.02
24
3
20
1
4
105
0.212
0.4604
0.4908
15
4
60
1
5
75
0.263
0.5128
0.6090
19
5
20
2.5
5
75
1.056
1.03
0.9609
11
6
40
1.5
6
75
0.724
0.8509
0.8667
14
7
40
1.5
8
75
0.738
0.8591
0.8570
21
8
20
1.5
8
105
0.823
0.9072
0.9293
16
9
60
0.5
8
75
0.011
0.1049
0.1230
7
10
30
2.5
4
45
1.046
1.02
1.06
3
11
30
2.5
8
45
1.051
1.03
1.12
17
12
30
0.5
6
45
0.022
0.1483
0.1720
18
13
30
0.5
6
75
0.029
0.1703
0.1505
12
14
40
1.5
6
75
0.832
0.9121
0.8667
4
15
60
1
6
45
0.314
0.5604
0.5640
8
16
20
1
4
45
0.387
0.6221
0.5155
23
17
40
2.5
4
105
1.054
1.03
1.03
6
18
60
0.5
4
45
0.034
0.1844
0.1723
1
19
60
2.5
4
45
1.156
1.08
1.07
13
20
40
1.5
8
75
0.862
0.9284
0.8570
5
21
20
2.5
8
45
1.371
1.17
1.15
25
22
20
1.5
8
105
0.886
0.9413
0.9293
2
23
20
0.5
8
45
0.043
0.2074
0.2070
10
24
20
1
4
60
0.132
0.3633
0.4638
20
25
60
0.5
4
105
0.178
0.4219
0.3658
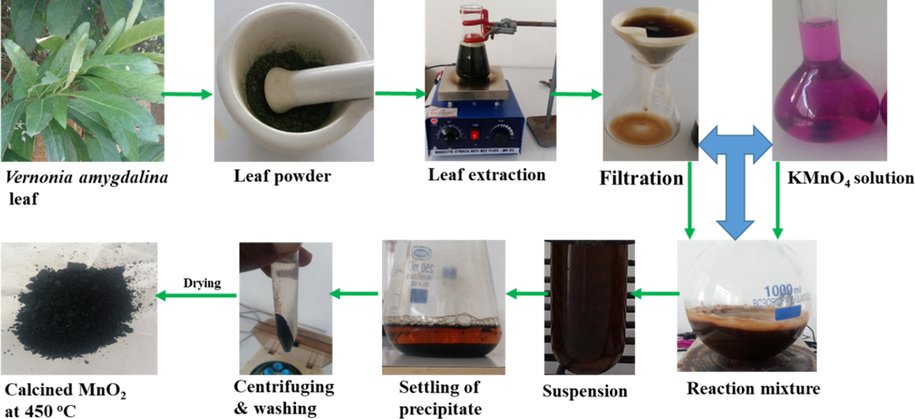
Green synthesis protocol for MnO2 NPs preparation.
2.5 Experimental design
Design of experiments is a systematic method that used to determine the relationship between different independent physicochemical factors and responses based on the statistical significance of the designed model. For this experiment four different experimental factors (independent variables) such as (A) extraction, (B) permanganate ion, (C) pH, and (D) reaction time values were studied. Their reasonable ranges with the actual minimum and maximum values in terms of coded symbol of “−1” and “+1”, respectively, are mentioned in Table 2. According to the listed variables and their ranges, a serious of cases was obtained based on best D-optimal design response surface approach. However, the RSM optimization of experimental parameters using central composite and Box-Behnken designs are common but to optimize and control parameters for long independent factors and coded levels centrally are difficult (Liu et al., 2018a). Thus, the choice of an optimal design with best D-optimal algorithm for our experimental results are going to be chosen as the best recommended model to build the precise fitting by adding different multi-linear constraints and center of points followed by reasonable point selection chances based on our needs. So, we can specify the model we wish to fit but other designed models need a specific pattern to the design points. As it saw from UV–Vis absorption spectra of each run shown in Fig. S3 described that absorption intensity was increase and it depends on the concentration of the MnO2 NPs. An increase in the absorption intensity indicated the better in solubility and dispersion of the synthesized MnO2 NPs in solution (Souri et al., 2018).
Coded factor
Parameters
Units
Type
Minimum
Maximum
Coded Low
Coded High
Mean
Std. Dev.
A
Extraction
(%)
Numeric
20.00
60.00
−1 = 20.00
+1 = 60.00
38.40
16.75
B
Permanganate ion
(mM)
Numeric
0.5000
2.50
−1 = 0.50
+1 = 2.50
1.48
0.7969
C
pH
–
Numeric
4.00
8.00
−1 = 4.00
+1 = 8.00
6.08
1.75
D
Time
(Minute)
Numeric
45.00
105.00
−1 = 45.00
+1 = 105.00
69.60
24.06
2.6 Response surface methodology
The regression models and experiment design method justification of physicochemical parameter dependence of high yield MnO2 NPs using D-Optimal Response Surface Quadratic Design Model approach was clearly understood in this work. In order to illustrate the capability of the designed models, the regression coefficient (R2), insignificant lack of fit, significant model, and p-values were studied. Simultaneously, the suggestion of linear, quadratic (squared), and two factor interaction (2FI) regression models were visualized. From the suggested quadratic model, the sequential F-tests, lack-of-fit tests, adjusted R2, predicted R2, and coefficient R2 values were evaluated to perform the acceptance of the designed RSM. For a selected regression model, the significance of each physicochemical factor was examined from ANOVA analysis. Recent research studies suggested that, the significant of the model and insignificant Lack of Fit are the two main qualified approaches for any response predictions to represent the degree of fitting between the predicted model and the experimental work (Chen et al., 2018b; Maghsoudy et al., 2019). So, the designed RSM in our work are therefore an efficient technique to manage all the experimental factors with acceptable significant P-value (p-value < 0.05) which affect the yield of MnO2 NPs during its synthesis in the presence of V. amygdalina leaf extract.
3 Results and discussions
3.1 Statistical and regression model analysis
The model analysis to represent linear relationship between two variables (statistical correlation) and to fit a best line, as well as to estimate one independent variable on the basis of another variable (regression) of MnO2 NPs absorption responses with four physicochemical variables were examined by using the least squares regression model technique. All the polynomial models, such as linear, two-factor interaction (2FI), fully quadratic, and cubic models were statistically evaluated (Table S1). Suggested but not aliased model from the response surface was selected. Liu et al. (2018a) have reported that estimation of aliased model is not needed due to the insignificant correlation relation between predicted and experimental data. In this study, MnO2 NPs was successfully synthesized using V. amygdalina leaf extract as a stabilizing and reducing agent (bioactive agents) (see the mechanism in Scheme 2) while aqueous potassium permanganate solution was used as a precursor at different experimental conditions Table 1. Design-Expert 11 software (version 11.0.5.0) was employed to build the absorption spectra as a response surface model. During the analysis if the relationship unstable and graphs those are not accurate, the aliased model (Cubic) cannot be selected as a suggested model for these optimizations. Furthermore, if the selected model is acceptable, the maximum parameter coefficient R2, adjusted R2, and predicted R2 must be deduced for the accuracy of the response surface. Therefore, for our experimental work, the regression coefficient values (coefficient R2 = 0.9790) means that 97.90% of both observed and predicted data can be explained by using this model. The Predicted R2 of 0.8452 is in reasonable agreement with the Adjusted R2 of 0.9496; i.e. the difference is less than 0.2. On the other hand, an Adequate Precision measures the signal-to-noise ratio. A ratio greater than 4 is desirable. So, the ratio of 16.8861 indicates an adequate signal. As a result, this model can be used to navigate the design space. Therefore, the fully quadratic model is finally selected to build the response surface for the subsequent optimization process to perform a well-stabilized MnO2 NPs synthesis Table 3.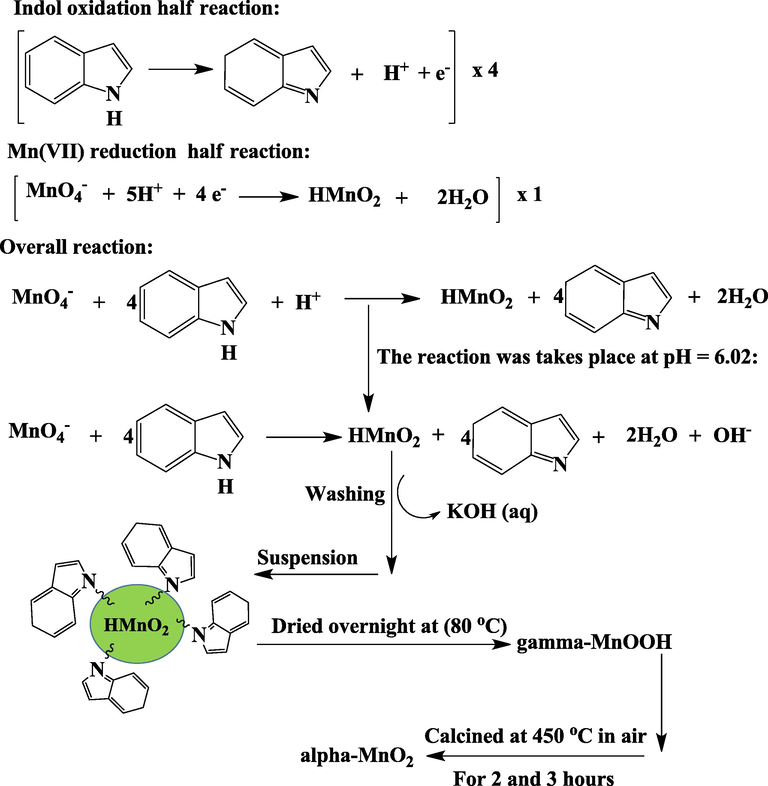
Proposed reaction mechanism for biosynthesis of α-MnO2 NPs.
Std. Dev.
0.0787
R2
0.9790
Mean
0.6992
Adjusted R2
0.9496
C.V. %
11.26
Predicted R2
0.8452
Adeq Precision
16.8861
PRESS
0.4576
−2 Log Likelihood
−79.04
BIC
−30.75
AICc
4.30
Design-Expert 11, which is a statistical software package from Stat-Ease Inc., provides an extensive diagnostic capability to check how the statistical assumptions are conducted to underlying the data analysis. So, from the UV–Vis spectrophotometer responses obtained by measuring the absorption of the MnO2 NPs chosen at 320 nm and using the second-degree polynomial mathematical equations Eqs. (2) and (3) in terms of coded and actual factors are given as follows:
Coded factor equation:
Actual factor equation:
3.2 ANOVA or variance analysis
The evaluation of ANOVA with this quadratic model could successfully describe all the experimental runs Table 4. To suggest if the fitted model is relevant (significant), experimental data in terms of Fisher's (F-test), probability (P-value), and coefficient of variation (R2), and Lack of Fit are used. According to Liu et al. (2018a), the p-value is the probability that the given statistical model is the same as or greater magnitude than the actual observed results when the null hypothesis is true. If the p-value is small, the probability of the null hypothesis occurrence is small. Therefore, smaller p-value of the model corresponds to more significance of the results for all physicochemical parameters. From this works shown on the table, F-values of the analyzed model term is 33.32 There is only a 0.01% chance that an F-value this large could occur due to noise while p-values is < 0.0001. P-values less than 0.0500 indicate the suggested quadratic model is significant. The Lack of Fit F-value of 5.04 implies the Lack of Fit is not significant relatives to the pure error. There is a 10.59% chance that a Lack of Fit F-value this large could occur due to noise. Non-significant lack of fit is good, and we want the model to fit and much enough to optimize the required physicochemical parameters to synthesis an effective MnO2 NPs with better yield. A high F-value with low p-value (<0.001) can show that an optimization strategy is better with the proposed designed model (Peng et al., 2020). Terms with significant quadratic model indicate that the proposed model is sufficient and adequate to explain the relationship between the experimented independent variables (factors) under the corresponding responses.
Source
Sum of Squares
df
Mean Square
F-value
p-value
Model
2.89
14
0.2066
33.32
< 0.0001
significant
A-Extraction
0.0034
1
0.0034
0.5418
0.4786
B-Permanganate ion
1.68
1
1.68
270.55
< 0.0001
C-pH
0.0021
1
0.0021
0.3326
0.5769
D-Time
0.0075
1
0.0075
1.21
0.2979
AB
0.0033
1
0.0033
0.5245
0.4855
AC
0.0372
1
0.0372
5.99
0.0344
AD
0.0175
1
0.0175
2.83
0.1235
BC
0.0003
1
0.0003
0.0545
0.8202
BD
0.0101
1
0.0101
1.63
0.2301
CD
0.0011
1
0.0011
0.1712
0.6877
A2
0.0015
1
0.0015
0.2442
0.6318
B2
0.1791
1
0.1791
28.88
0.0003
C2
0.0013
1
0.0013
0.2081
0.6580
D2
0.0088
1
0.0088
1.42
0.2611
Residual
0.0620
10
0.0062
Lack of Fit
0.0571
7
0.0082
5.04
0.1059
not significant
Pure Error
0.0049
3
0.0016
Cor Total
2.95
24
Residuals are the deviation between predicted and actual (observed) values and expected to follow a normal distribution if the experimental errors are random. The adequacy of the model in terms of residuals should follow a straight line deducing that the errors are distributed normally (Fig. 1a). That is all residuals are not correlated with each other as an effect during positive and negative residual distributions. Thus, a random scattering of experimental data points across the horizontal line of residuals suggests that the proposed models are adequate and the statement is also supported by other study (Mondal and Purkait, 2017). Therefore, the distribution of an experimental run through these lines follows a normal distribution at 95% confidence interval limit. This type of curve is often formed due to the characteristic model accuracy i.e., the set up model doesn’t need an additional transformation of the response. The actual and predicted absorption values are indicated in (Fig. 1b), where the determined regression coefficient (R2) was (0.9780) and these indicated a good agreement with the proposed model. The actual and predicted numerical lists of data are given in Table 1, and the predicted values are normally produced from the fitted quadratic model. Therefore, from the determined coefficient both responses are properly in agreement within the limit of the functional physicochemical independent variables.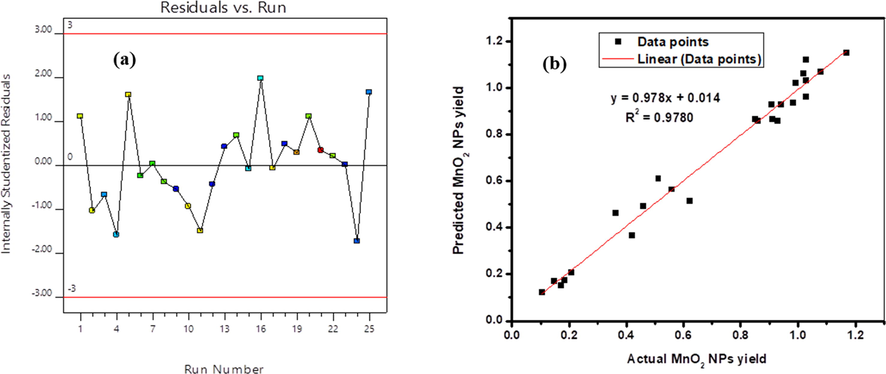
(a) Plot of residuals versus observation order and (b) Relationship between predicted and experimental values of MnO2 NPs yield.
The independence verification of the errors that clarified some plots of the residuals versus predicted values are illustrated in (Fig. 2a). From these graph it is been able to visualize the detecting possibility of an absorption response variables at a given run. Such randomly distributed experimental runs showed that there are no violations of any independent variables that affect an internally studentaized Residuals and these suggest that the designed model is tolerable. Perturbation plot which shows in (Fig. 2b) the initial permanganate ion concentration has the sharp positive effect to increase the synthesis rate followed by reaction time and extraction while effect pH has a small contribution to the synthesized materials. All the effects were also supported from their F-values. The reference point at X = 0, shows the interaction of the line while the side positions are actual conditions. It can be seen that the initial permanganate ion concentration is the most prominent independent variable of the model obtained from equation Eq. (2) and Eq. (3). The straight line in (Fig. 2c) indicates that the Studentized residuals follow a normal distribution. If the data pint fits the line, the model is not noisy and the proposed model is reliable. The developed model is in a very good agreement with an experimental data. According to Liu et al. (2018a) report, if the residuals do not follow a normal distribution, S-shape significant curve is usually formed. This type of curve is often formed due to the use of an inappropriate model. So, in such a case the model needs an additional transformation of the response. Provided that, our model is transformed to square root to avoid such limitations.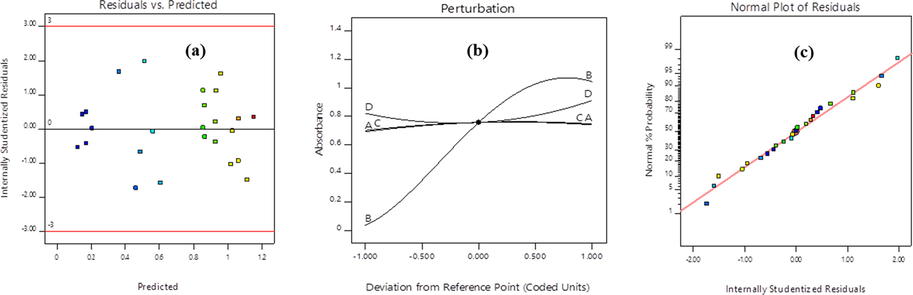
(a) Normal probability plots of residuals versus predicted; (b) Perturbation plot of MnO2 NPs yield optimization, and (c) Normal plot of residuals.
3.3 Effect of four variables on MnO2 NPs yield
To get the best insight about the two mutual effects of physicochemical parameters for their responses while keeping the other two variables constant to determine their effect on the response as shown in the 2D contour plots and 3D graphs. The percentage contribution of each term can be obtained by adding up the total sum of squares in each term per total sum which is shown in Table 4. So, in order to analysis the degree of sensitivity behind each physicochemical parameter, F-values of the model helps to prioritize the dominancy of the factor that affects the experimental run. From an experimental planning, the orders of influences on the biosynthesis of MnO2 NPs are: B-Permanganate ion initial concentration > D-Reaction time > A-Extraction ratio > C-pH. From these order, the initial concentration of the precursor (potassium permanganate, KMnO4) has the most positive significant effect while pH has the least effect on the biosynthesis of MnO2 NPs yield which was clearly supported from the perturbation plot.
The 3D absorption response surface and its 2D contour plots are shown in (Fig. 3a–c). All the figures exactly described the physicochemical variable interactions and their effects on the biosynthesis of MnO2 NPs. Fig. 3a indicated that an increase in initial potassium permanganate concentration plays a more significant role for MnO2 NPs yield increment. The yield of MnO2 NPs increases as the precursor concentration increase within the given plant leaf extraction ratios. With increase of permanganate initial concentration, the maximum absorbance by the biosynthesized MnO2 NPs reaches at 1.5 < Absorbance < 2, which is clearly shown on the contour plot. Fig. 3b illustrates the relationship between permanganate initial concentration and pH. At a higher precursor initial concentration with 5 < pH < 7 results the possibility of higher yield MnO2 NPs formation. Fig. 3c revealed that UV–Vis absorption by the biosynthesized MnO2 NPs yield was better at medium pH and higher reaction time. From these two interactions we suggest that when we increase pH and reaction time the formed yield is not much effective due to the relative lower electronic absorbance response. The whole analysis indicated that the optimized methodology can help to determine optimized physicochemical parameters that responsible for stabilized MnO2 NPs formation. Especially, the analysis from such sensitivity revealed that, the initial concentration of potassium permanganate precursor has the most significant factor on absorbances. The enhancement of initial permanganate ion concentration and reaction time is a key issue to obtain a maximum yield of MnO2 NPs. Generally, the visualization of variation in the physicochemical parameters of bioreduction might be due to the differences in the activities and presence of bioactive biomolecules present in the leaf extract. The presence of such bioactive molecule promotes the crystallization process of metal oxides (Hashem et al., 2018).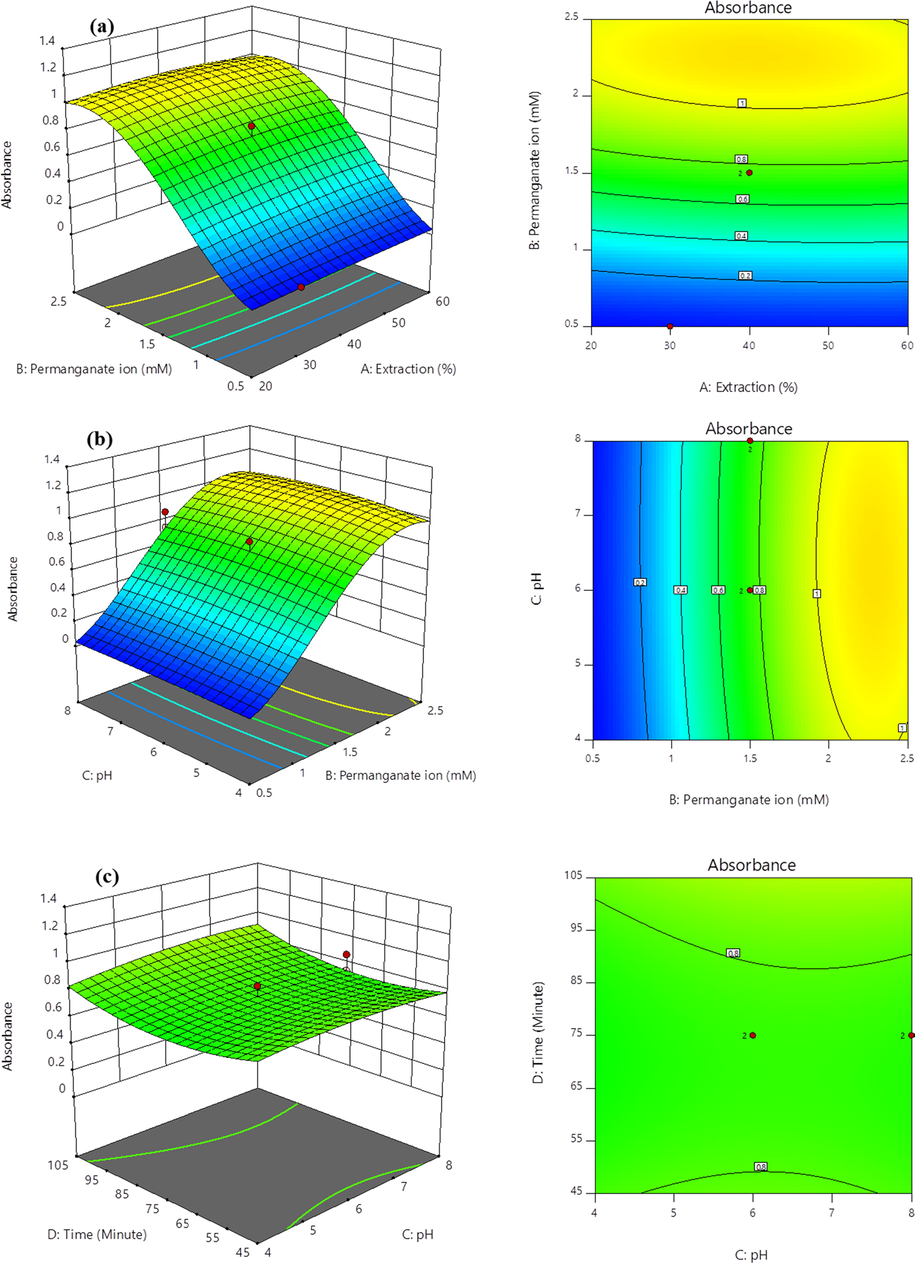
3D response surface and 2D contour plot for interaction effect of two-parameter on absorption response at fixed values of other parameters ((a) Influence of extraction ratio and initial concentration of permanganate ion on absorbance, (b) Influence of initial concentration of permanganate ion and pH on absorbance, and (c) Influence of pH and reaction time on absorbance.
3.4 Experimental validation of the designed model
In Fig. 1b, it is clearly suggested that the predicted value is clearly closer to that of the actual experimental value of the MnO2 NPs yield with a correlation coefficient, R2, of 0.9780; this suggests that the proposed model is effectively developed with correlations between the independent variables of MnO2 NPs yield production. To check the validation of model predictions, a set of four experimental runs was conducted at optimum conditions (see Table 5 and Fig. S6), and the experimental and predicted MnO2 NPs yield were compared. The validation experimental run was performed according to the optimum production conditions of MnO2 NPs synthesis. An aqueous solution of initial potassium permanganate concentrations (1.81 mM) was prepared in pH of 6.02. To synthesis the required MnO2 NPs, a volumetric ratio with 43.72% of V. amygdalina crude extract was added to the above solution and stirred at room temperature for 103.42 min reaction time. The precipitate was obtained by centrifuging at 4000 rpm for 15 min. Then, the obtained NPs were washed with distilled water and ethanol several times. Some of the washed samples were suspended in 10 mL distilled water for UV–Vis spectrophotometric measurements while the rest of the collected precipitate was dried overnight at 80 °C and calcined at 450 °C for 2 and 3 h. The model predicted that the synthesis of MnO2 NPs yield was 1.095, while, experimental verification was accomplished using the same optimal value and 0.9678 MnO2 NPs yield was obtained at 320 nm maximum wavelengths from four experimental run with a difference of 0.1272 (12.72% error), which was lower than 0.2 or 20% error values. Since 0.2 numerical value is a standard value in Design-Expert 11 (version 11.0.5.0) software. Therefore, the difference value is lower than the standard value and this approved that the model is adequate for the optimization of physicochemical parameter. Our work optimized process variables are compared with other green based synthesis work is shown in Table 7.
Experiments
Maximum absorbance (at 320 nm)
1
0.8706
2
0.9766
3
1.0649
4
0.9589
Average
0.9678
3.5 Optimized result characterization and its confirmation test
Optimization of experimental conditions is essential in order to achieve the optimum conditions for MnO2 NPs formation. The optimizing factors involved in this study were V. amygdalina leaf extract concentration, potassium permanganate concentration, pH, and reaction time. The result of absorbance reflects the overall response of the biosynthesized yield for MnO2 NPs. According to Beer-Lambert law, the light absorbance of the synthesized NPs has a direct relation with its concentration (yield) (i.e., A = ɛbc, where A is absorbance, ɛ is the molar extinction coefficient with a unit of M−1cm−1, b is the path length of the sample (cm), c is the concentration of NPs in solution (M) (Paramelle et al., 2014; Shang and Gao, 2014). Based on these core reasons, the larger absorbance formation implies that the more efficient in MnO2 NPs yield. From the surface response numerical optimization results, the response surface method is conducted to select the best set of physicochemical variables which is fit for the best desirability to maximize the biosynthesized yield that shown from the ramps graph (see Fig. S4). After numerical optimization, a total of 100 optimal projects were generated using quadratic polynomial model. So, the desirability of all graphical optimization results in terms of all factor (Fig.S5) and their contour plots (Fig. 4a–c) supporting that the optimized variables are within the absorbance range between 0 and 1.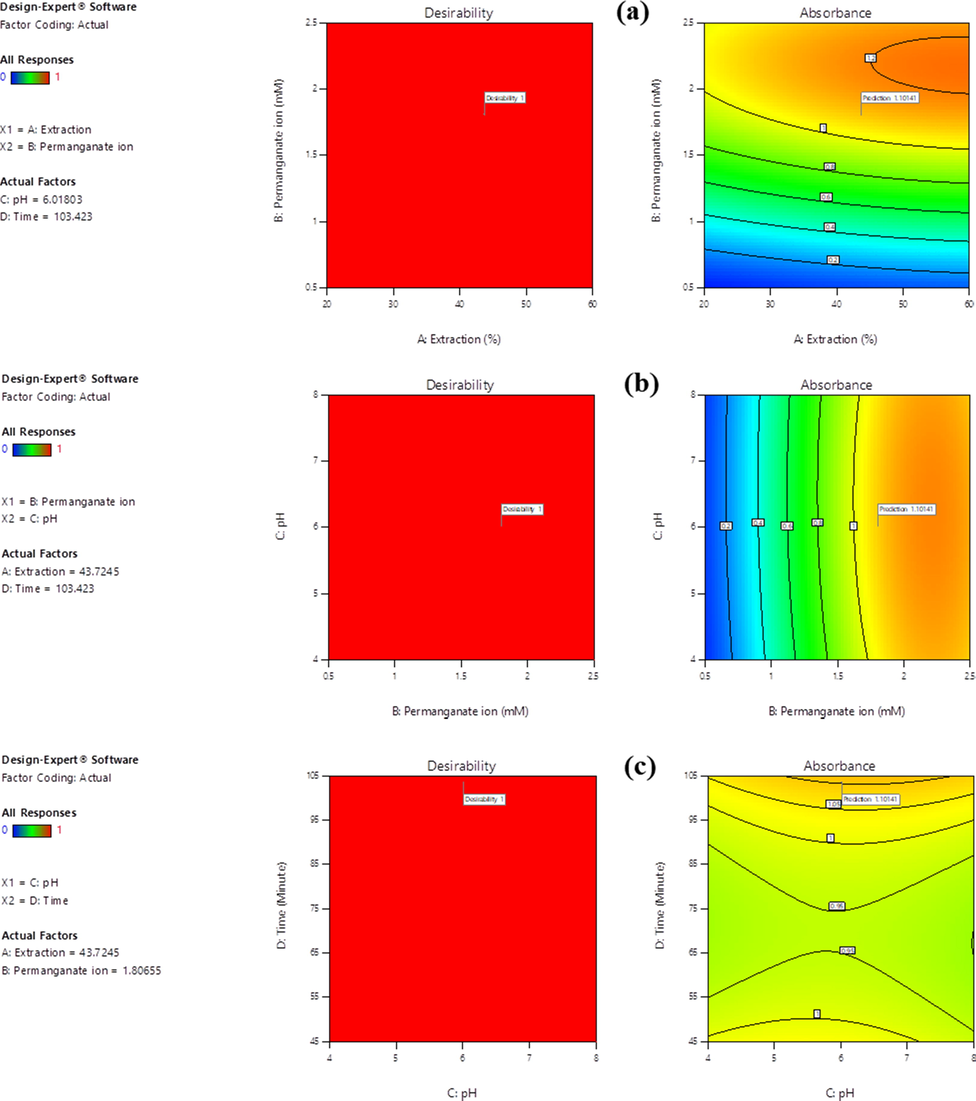
Numerical optimized contour response surface plot for interaction effect of two-parameter on absorption response at fixed values of other parameters ((a) Influence of extraction ratio and initial concentration of permanganate ion on desirability, (b) Influence of initial concentration of permanganate ion and pH on desirability, (c) Influence of pH and reaction time on desirability).
3.5.1 UV–Vis spectral analysis
The validity of the selected models was verified by conducting 25 experimental runs under the predicted optimal levels from the analyzed quadratic model (Fig. S3). The presence of different absorption spectra shape shows the prescience different morphology and size variations (Souri et al., 2018). Interesting that throughout the run an instant color change from yellow to dark brown was observed with varied in peak intensity and peak broadening. Sharma et al. (Sharma et al., 2018) have described that the full width at half maxima (FWHM) of the corresponding absorption peaks from the UV–Vis spectra determines the dispersion of the synthesized NPS, where a large FWHM was attributed to peak broadening due to increased polydispersity of NPs. After RSM test, the optimum experimental variables were selected by setting a prediction at 1.095 absorbance response. At these optimal responses, 43.72%, 1.81 mM, 6.02, and 103.42 min were selected as an optimum variables for V. amygdalina leaf extract ratio, initial permanganate ion concentration (MnO4-), pH, and reaction time, respectively. Based on these optimal conditions and follow an optimized synthesis procedure (see the supporting information), four parallel experiments were carried out (see Fig. S6). The broadening peak and unsymmetrical spectra for an optimized run indicating the polydisperse nature of MnO2 NPs. The value of average absorbance at 320 nm is determined to be 0.9678 (Table 5). This indicates there is a high agreement between the experimental results and the predicted values, as well as conformity of the validity of the selected models. After wards comparative investigations of optimized MnO2 NPs with precursor (KMnO4) absorbance and leaf extracts of V. amygdalina was studied. Further, MnO2 NPs synthesized under optimum conditions were analyzed using different analytical instruments.
In aqueous medium MnO2 NPs appears dark brown in color is due to surface plasmon vibrations (Zhu et al., 2019). The biosynthesized NPs show two broad absorption bands ranging between 280 and 350 nm with peak positions at about ∼285 and ∼320 nm is the characterstic nature of alkene (double bond) and electron transition from unpared “n” electron to antibonding “π*” one (i.e., π → π* and n → π* or d → d (triply degenerate, t2g to doubly degenerate,eg if the shape is tetrahedral) transitions) each of which might be the bandgap absorption and transmission spectra of indol adsorption MnO2 NPs. It should be noted that the absorbance peak of MnO2 NPs sol might be also changed (Moon et al., 2015). The MnO2 NPs showed absorption maxima at 285 nm which is in good agreement with the literature (Souri et al., 2019). Ede et al. (Ede et al., 2014) have reported the occurrence of maximum absorption peak at ∼275 ± 25 nm due to dimensional structure difference of the formed NPs and for extra comparison (see Table 6). When the aqueous plant (light yellow inset Fig. 5m) extract was mixed with 1.81 mM KMnO4 solution (purple in color absorption maxima at 310 nm and 530 nm, inset Fig. 5k), formation of dark brown color that confirms the formation of MnO2 NPs (Inset Fig. 5n). Reports done by Sathiyamoorthi et al. (Moon et al., 2015) showed that such behavior in color changes were observed between Kalopanax pictus leaf extract and KMnO4 solution. Other studies by Chatterjee et al. (Chatterjee et al., 2017) supports the occurrence of similar color changes between Brassica oleracea (cabbage) leaves extract with KMnO4 by controlling an experimental parameters. In this study, the absence of peak at 530 nm from KMnO4 spectra after dispersing V. amygdalina extract indicates the complete reduction of Mn(VII) to Mn(IV) and blue shift of the spectra indicating the presence of small sized MnO2 NPs with in the suspension which is in good agreement with the previous study (Moon et al., 2015). NPs have optical properties that are very sensitive on size, shape, agglomeration, and concentration changes. The unique optical properties of nanoparticles prepared from metal precursor are a consequence of the collective oscillations of conduction electrons, which excited by electromagnetic radiation are called surface plasmon polariton resonances (Tomaszewska et al., 2013). So, change in color was mainly due to the excitation of surface plasmon resonance in metal based NPs (Jana et al., 2016). Therefore, such change in color confirms that the significant evidence for MnO2 NPs formation. Our results were also corroborated with some previous research studies (Manjula et al., 2019; Sanchez-Botero et al., 2017; Souri et al., 2019). The spectra underwent a shift from the plant extract spectra (320 nm) to blue shift at around edge absorption which extended to observe an additional broad peak at 285 nm indicating the formation of a new molecular structure, which was signed by the color change from light yellow to brown.
Type of plant
Plant part
UV–Vis λmax (nm)
Size (nm)
References
Chamomile (Matricaria chamomilla L.)
Flower
230
16.5
(Ogunyemi et al., 2019)
Kalopanax pictus
Leaf
404
19.2
(Moon et al., 2015)
Sapindus mukorossi (raw reetha)
Fruits
–
<10
(Jassal et al., 2016)
Malus domestica & Vitis vinifera
apple peel & stems
–
28–80 in diameter
(Sanchez-Botero et al., 2017)
Aegle marmelos
Fruit
355
23.7
(Sivanesan et al., 2017)
Brassica oleracea (cabbage)
Leaves
340
10000–20000
(Chatterjee et al., 2017)
Phyllanthus amarus
–
360
40–50
(Prasad and Patra, 2017)
Lemon
Juice & peel
–
10–17
(Hashem et al., 2018)
Yucca gloriosa
Leaf
410
80
(Hoseinpour et al., 2018)
Gardenia resinifera
Leaves
362
10–50
(Manjula et al., 2019)
Yucca gloriosa
Leaf
284 & 354
35
(Souri et al., 2019)
Bitter Leaf (Vernonia amygdalina)
Leaf
∼285 & ∼320
20–22
This work
Precursor
Precursor concentration (mM)
Extract ratio (%)
pH
Temperature (oC)
Time (Minute)
References
KMnO4
1
5
–
Room
90
(Moon et al., 2015)
MnCl2, &KMnO4
300 & 200
0.4
–
Room
1440
(Jassal et al., 2016)
KMnO4
100
0.8
3.7–4.0
Room
120
(Sanchez-Botero et al., 2017)
KMnO4
1000
0.1
–
–
720
(Sivanesan et al., 2017)
KMnO4
200
12
6
–
240
(Chatterjee et al., 2017)
Mn(CH3COO)2·4H2O
1
13.9
6.8
Room
60
(Prasad and Patra, 2017)
KMnO4
0.3
40
2–3
Room
60
(Hashem et al., 2018)
CH3COO)2 Mn·6H2O
0.01
90
8
Room
60
(Hoseinpour et al., 2018)
CH3COO)2 Mn·6H2O
–
4
–
–
60
(Manjula et al., 2019)
CH3COO)2 Mn·6H2O
0.01
90
6
Room
120
(Souri et al., 2019)
KMnO4
1.81
43.72
6.02
Room
103.42
This work
![(a) UV–Visible spectrum of synthesized MnO2 NPs [inset: change in color of the solution confirming the formation of MnO2 NPs]. (k) 1.81 mM potassium permanganate solution, (m) Plant extract, and (n) synthesized MnO2 NPs. Tauc plot of MnO2 (b) indirect transition and (c) direct transition.](/content/184/2020/13/8/img/10.1016_j.arabjc.2020.06.006-fig7.png)
(a) UV–Visible spectrum of synthesized MnO2 NPs [inset: change in color of the solution confirming the formation of MnO2 NPs]. (k) 1.81 mM potassium permanganate solution, (m) Plant extract, and (n) synthesized MnO2 NPs. Tauc plot of MnO2 (b) indirect transition and (c) direct transition.
Furthermore, the crude extract of V. amygdalina leaf extract spectra shown a sharp peak near 320 nm (Fig. 5a blue curve, n → π* transitions), confirmed the presence and characteristics of alkaloid indole spectra (Widyaningtyas et al., 2019). Indoles are amongst the most important class of heteroaromatics (heterocyclic compound) in organic chemistry, being commonly found in biologically active natural products that easily participates in chemical reactions with its bonding sites are analogous to pyrrole (Clarke et al., 2019; Mohammadi Ziarani et al., 2018). We see that there is no difference in the absorption peaks except peak shape, this happening might have two reasons: i) due adsorption of indol moiety on synthesized MnO2 NPs ii) the chemical structure difference in V. amygdalina leaf extract resulting in a stronger steric hindrance for indole to form bond with oxide surface (Mancuso and Dalpozzo, 2018). A similar mechanism was happened between V. amygdalina leaf extract and TiO2 (i.e., there maximum absorption was occurred at 400 nm) (Boyo et al., 2012).
In terms of the optical band gap energy from direct and indirect band gap using Tauc’s relation (Liu et al., 2018b), (αhv)n = A (hv - Eg), where A is the constant, hν is the photon energy, and α is the absorption coefficient, while n = 2 for direct and n = 1/2 for indirect transition. The optical band gap energy (Eg, eV) of green synthesized MnO2 NPs was achieved at 2.71 eV (Fig. 5b) and 4.65 eV (Fig. 5c) for indirect and direct transitions, respectively. Which was higher value than the corresponding bulk MnO2 with allowed indirect band gap of 2.1 eV and an allowed direct band gap of 2.7 eV (Pinaud et al., 2011). The increasing Eg is attributed to decreasing in particle size, such small particle size helps to improve their electrochemical properties, decrease the cost of energy conversion devices, and increase efficiency in electrochemical performance for an effective remediation applications (Buazar et al., 2019; Chen et al., 2019).
3.5.2 Colloidal characterization of MnO2 NPs by the oxidation of V. amygdalina leaf extract
In order to elucidate the brown color, the spectrum of optimized reaction mixture was recorded in the 400–600 nm absorption band regions. Due to the formation of water-soluble colloidal MnO2 sol, one step three electron redox reaction was takes place between Mn(VII) and V. amygdalina leaf extract as a reducing agent (see Scheme 2). Report by (Zaheer and Rafiuddin, 2012), suggested that the ligand/or reductant to metal charge transfer transitions observable in the half ultraviolet and near visible regions is the most characteristic behavior for Mn(IV) ion. Band gap coverage with in these regions of the spectrum confirms the formation of colloidal nature of MnO2 NPs (Fig. 6). To support such insight mostly a law described by Rayleigh’s was also used for manipulating such sol formation due to the scattering of light. Hence, from his studies by redrawing the plot of log(absorbance) as a function of log(wavelength) must be linear to support the formation colloidal MnO2 NPs. Hence, from the plot, a straight line with a regression coefficient of R2 = 0.9855 followed by negative slope with −4.15 (inset Fig. 6) between log(absorbance) and log(wavelength) derived from absorbance = concentration/wavelength of MnO2 NPs indicated the conformity to Beer’s law. Such findings are in good agreement with a research done by other investigators (Zaheer and Rafiuddin, 2012). Therefore, we may clearly conclude that the recommended data are consistent with the formation of colloidal MnO2 NPs during the reduction of KMnO4 by V. amygdalina leaf extract under the optimized experimental conditions.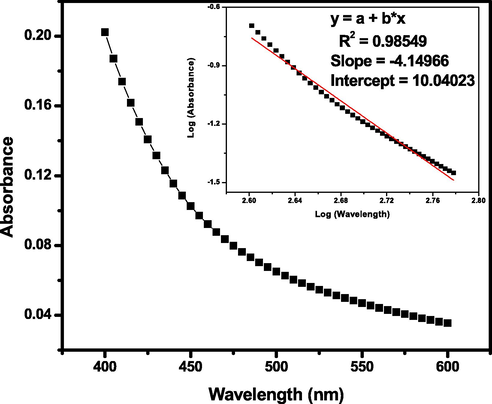
Absorption spectra of brown colored MnO2 NPs as a function of wavelength obtained at a reaction conditions of V. amygdalina leaf extract ratio = 43.72%, initial KMnO4 concentration = 1.81 mM, pH = 6.02, reaction temperature = 26 ± 2 °C, and reaction time = 103.42 min. Inset-plots of log (absorbance) versus log (wavelength).
3.5.3 Differential scanning calorimeter analysis
The DSC thermogram of the biosynthesized MnO2 NPs is given in Fig. 7. For the DSC curve, an endothermic peak can be observed in the temperature range beteween 50 °C and 100 °C which corresponding to the loss of surface absorbed water. In the temperature range of 200–325 °C, two intensive exothermic peaks can be observed at 255.24 °C and 289.32 °C, due to the fast conversion of hydrooxides from MnOOH to two possible manganese oxides, such as MnO2 and Mn2O3, respectively, and further lower heat flow intensities from the thermogram above 325 °C might be the removal of organic moieties from the V. amygdalina leaf extracts. Correspondingly, a similar and two exothermic peaks based research were investigated using thermogravimetric-Differential scanning calorimetry (TG-DSC) analysis from Mn(CH3COO)2·4H2O and (NH4)2C2O4·H2O mixtures using air-calcination (oxidation decomposition method) of the MnC2O4 precursor at different temperatures followed by acid-treatment in 2 M H2SO4 solution (Yuan et al., 2009). Aghazadeh et al. (Aghazadeh et al., 2018) have also reported the three step weight losses from the conversion of hydroxide into the oxide products using TG analysis. In detail, the TG curve exhibited as the temperature ranges of 25–150 °C, 150–300 °C, and 300–500 °C. The first weight loss (about 2.1 wt%) in the TG profile can be the removal of the H2O molecules adsorbed on the hydroxide deposited or intercalated in its structure. The second weight loss (about 14.5 wt%) can be assigned at temperature range 150–300 °C can be attributed to the decomposition and removal of cetyl trimethylammonium bromide (CTAB) along with the conversion from MnOOH to MnO2. The last weight loss is generally corresponding to conversion from MnO2 to Mn2O3. Furthermore, this last weight loss (about 2.8 wt%) on the TG curve at the temperature range of 300–500 °C can be also related to the removal of intercalated anions i.e. chloride ions coming from MnCl2 precursor (Aghazadeh et al., 2018).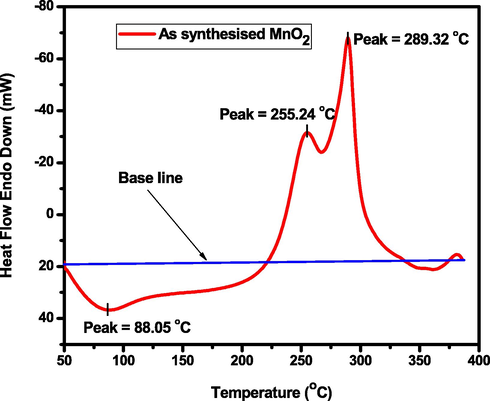
DSC curves of biosynthesized MnO2 NPs in N2 atmosphere (heating rate: 10 °C min−1, flow rate: 20 mL min−1).
The biosynthesized MnO2 NPs was calcined at temperature of 450 °C for 2 and 3 h. The structural and crystallinity changes during the heating process were studied by DSC analysis and the results are presented in Fig. 8. From the thermogram MnO2 precursor after 3 h calcination time (Fig. 8b) has better crystalline structure than 2 h calcination temperature (Fig. 8a), due to having lower endothermic heat flow (i.e., sample only needs small absorption energy to melt the precursor). This statement is exactly supported from XRD spectral analysis (see Fig. 9c). The presence of endothermic peaks from both curve indicates the change of phase (Athar et al., 2012). The phase change of material is happens after calcination of as synthesized NPs from V. amygdalina leaf extract at about 450 ⁰C for 2 and 3 h. Since reports using thermo gravimetric analysis (TGA) supported that stabilized MnO2 NPs could be obtained at about 450 ⁰C calcination temperature (Aghazadeh et al., 2018; Jian et al., 2014; Mable and Agnihotri, 2019; Muthuchudarkodi and Vedhi, 2015). Occurrence of endothermic peak at a temperature of 181.13 °C and 186.09 °C corresponds to the formation of Mn2O3 nanomaterials. Because the literature justified that the melting temperature (glass transition (Tg) = 250 °C) was occurred in the temperature range of 150 °C to 300 °C during the thermal decomposition of MnO2 to Mn2O3 under N2 atmosphere (Mable and Agnihotri, 2019).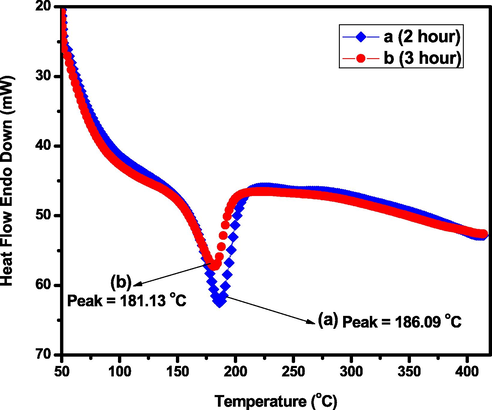
DSC curves of calcined MnO2 precursor in N2 atmosphere (a) 2 h calcination and (b) 3 h calcination (heating rate: 10 °C min−1, flow rate: 20 mL min−1).
![(a) X-ray diffraction (XRD) patterns of the as synthesized sample (γ-MnOOH), [(b) α-MnO2 NPs at 2 h calcination, and (c) α-MnO2 NPs at 3 h calcination under calcination temperatures of 450 °C].](/content/184/2020/13/8/img/10.1016_j.arabjc.2020.06.006-fig11.png)
(a) X-ray diffraction (XRD) patterns of the as synthesized sample (γ-MnOOH), [(b) α-MnO2 NPs at 2 h calcination, and (c) α-MnO2 NPs at 3 h calcination under calcination temperatures of 450 °C].
3.5.4 Powder X-ray diffraction analysis
Fig. 9 shows the XRD patterns of the optimized samples synthesized using V. amygdalina leaf extract. Since after optimization, the collected precipitate was dried overnight at 80 °C. According to the XRD patterns, the crystallinity of the synthesized product was further improved by calcination at 450 °C by extending calcined time from 2 h to 3 h, and this behavior is consistent and in good agreement for the synthesis of γ-MnOOH and its conversion to α-MnO2 (Lan et al., 2015) and β-MnO2 (Zhang et al., 2013). Since calcination at higher temperature can increase the active surface sites of the synthesized NPs, i.e., increment in degree of porosity on the material (Sivanesan et al., 2017). For the as synthesized powders made with the V. amygdalina leaf extract which was dried overnight at 80 °C with average crystalline size of 18.47 nm (Fig. 9a) exhibit peaks that can be easily indexed to γ-MnOOH (manganite) of monoclinic phase with cell parameters contains: a = 5.30400 Å, b = 5.27700 Å, c = 5.30400 Å, and β = 114.380° (Crystallography Open Database-COD, Entry # 96–900-9775 [space group: P121/c1 (14)]).
After 450 °C thermal treatment with varied calcined time, the crystalline structure of the sample progressively evolves towards α-MnO2 with pure tetragonal phase and lattice constants (cell parameters) a = 9.78760 and Å c = 2.86500 Å (COD, Entry # 96-151-4117 [space group: I4/m (87)]). XRD patterns synthesized using the V. amygdalina leaf extract exhibit a high intensity peak at 12.479° (Fig. 9c), which can be indexed as the (1 1 0) plane followed in intensity by the peaks for the plane at 400 (Fig. 9b). It is important to note that regardless of the natural extract used for the synthesis, the sample calcined at 450 °C for 3 h exhibit an increase in the peak intensity and a decrease in peak broadening when compared to the same samples calcined at 450 °C for 2 h. Careful comparison of the relative intensities in Fig. 9c shows that a highly crystalline structures as evident from the dominant and sharp diffraction peaks of XRD patterns of the α-MnO2 phase which are indexed at (1 1 0), (2 2 0), and (2 1 1) plane.
From other report, the presence of well-defined XRD peaks indicated the absence of amorphous nature of the synthesized materials (Mahmudi et al., 2018). Thus, an equation from Debye-Scherrer d = (kλ/βcos θ) can be used to determine the individual and average crystallite size of as synthesized γ-MnOOH and calcined α-MnO2 NPs are listed from the supplementary material (see Table S2), where d is the thickness of the crystal, k is the Debye-Scherrer constant (0.89), λ is the X-ray wavelength (0.15418 nm), β is the width of the peak with the maximum intensity at half height (FWHM) and θ is the diffraction angle (Hoseinpour et al., 2018). So, for our work, the total average crystallite size of calcined sample (α-MnO2 NPs) is lies in the range between 20 nm and 22 nm (see Table 6).
3.5.5 Fourier transforms infrared spectral analysis
FTIR is a spectroscopy that used to detect both inorganic and organic species containing a sample with low content due to its high sensitivity (Jaganyi et al., 2013). Fig. 10a shows the FTIR spectra corresponding to the as synthesized sample prepared with V. amygdalina leaf extract, while the spectra shown in Fig. 10b and Fig. 10c corresponding to MnO2 NPs calcind at 450 °C for 2 and 3 h, respectively. The occurrence of broad and low in intensity peak from the as synthesized sample at about 3422 cm−1 and 3304 cm−1 might be assigned as —OH stretching and H—O—H bending vibrations of bounded water molecules that are adsorbed on the sample (Sanchez-Botero et al., 2017). The peak at about 2925 cm−1 and 2845 cm−1 characterized the C—H stretching absorption band due to the presence of alkene/alkyl groups from secondary phytochemicals organic compounds found in V. amygdalina (Alara et al., 2019; Widyaningtyas et al., 2019). The peak observed around 1643 cm−1 showed water molecule bending vibration mode (Sen et al., 2013). An intense and sharp peak observed at about 1563 cm−1 indicated C⚌O stretching (Hoseinpour et al., 2018). The absorption band formed at about 1401 cm−1 and 1079 cm−1 indicated C⚌C unsaturation and C—O stretching, respectively (Prasad and Patra, 2017). Finally, the peak observed at about 910 cm−1 is the indicated the surface —OH groups of Mn—OH for colloidal MnO2 NPs while the band between 600 cm−1 and 475 cm−1, especially at about 596 cm−1 and 495 cm−1 corresponding to the stretching collision of O—Mn—O (Moon et al., 2015) and Mn—O bond stretching vibration which clearly indicating the formation of MnO2 NPs (Kareem Jassem et al., 2019).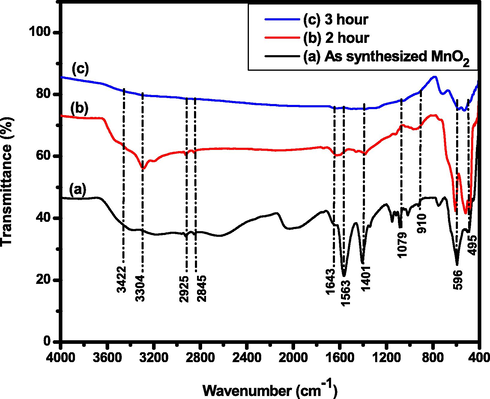
FTIR spectra of (a) as synthesized MnO2 NPs using Vernonia amygdalina leaf, (b) calcined at 450 °C for 2 h, and (c) calcined at 450 °C for 3 h in the range from 4000 to 400 cm−1 with KBr pellet sampling.
3.5.6 Scanning electron microscope analysis
SEM was carried out to characterize the morphology of as prepared α-MnO2 NPs. The compressed packed with more aggregated surface topography was observed from the as synthesized NPs before calcination due to the over growth of organic compounds over it, such existence clearly supported from FTIR and DSC data. Fig. 11a&b shows the SEM micrograph with low aggregated and ball shaped flower like architecture with an average crystallite particle size of ∼22.57 nm and ∼20.74 nm for α-MnO2 NPs synthesized using V. amygdalina leaf extract as a reducing and capping agent after 2 and 3 h calcination time, respectively. This image show the distribution of small and wider in particle size together due to the poly-disperse nature of the prepared NPs which was supported from UV–Vis spectral results. Fig. 11b, when the as prepared sample was calcined at 450 °C for 3 h calcination time, a non-uniformly distributed (poly-dispersed) nanospherical flower like structure were clearly obtained with better in porosity surface than sample calcination after 2 h. Even from Gwyddion multiplatform software roughness measurement analysis, the number of masked grain structure arrangement (see Fig. S7 and Table S3) and porosity surface are from inverted height as a function of position data (Fig. S8 and Table S4) in the sample after 3 h calcination time has better efficiency in surface roughness than calcination after 2 h. So, this is happened due to the surface functional stabilizing ability of plant extract active functional groups (Dare et al., 2015). Therefore, from the above investigations and other related works, it is clearly showed that aggregation and agglomeration nature caused by the type of a reducing reagent has a strong effect on the surface morphology of MnO2 NPs, i.e., which highly affects the surface area and particle size of the synthesized NPs (Hashem et al., 2018; Manjula et al., 2019; Sanchez-Botero et al., 2017).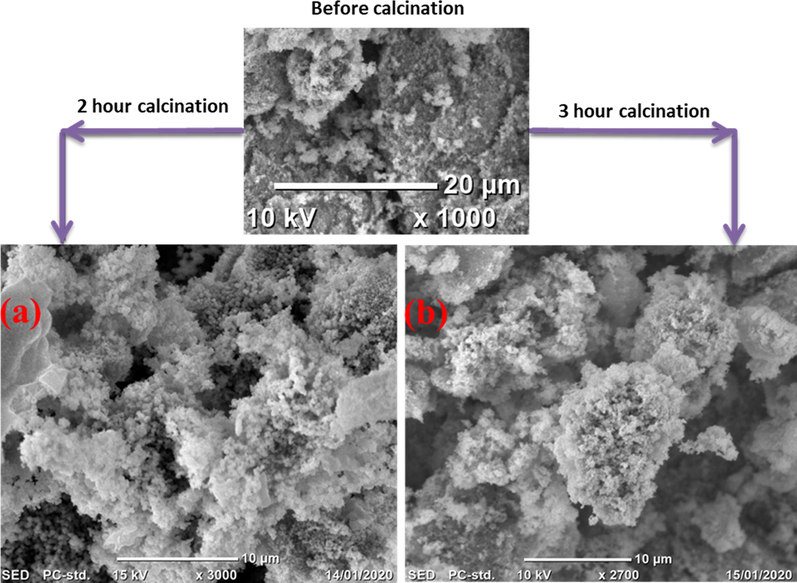
Scanning electron microscopy (SEM) image of nanospherical flower like α-MnO2 NPs calcined at 450 °C (a) for 2 h, and (b) for 3 h.
3.5.7 Surface roughness
Gwyddion is the multiplatform and more user friendly software available for analyzing Scanning Probe Microscopy (SPM) data e.g. SEM (Yadhuraj et al., 2016). To analyze surface roughness, Gwyddion provides four parameters for evaluating the surface characteristics: the mean roughness (Ra) it represents the mean value of the surface roughness of the sample; the mean square roughness (Rq) it defines the degree of change in the surface roughness of the sample; the surface skewness (Rsk) it used to represent the symmetry of the surface height distribution of the sample; and the kurtosis coefficient (Rku) it represents the waveform characteristics of the surface height distribution of the sample. For more mathematical equations and their justifications refer the paper (Zhao et al., 2019).
For this study, the SEM data obtained using a JEOL Ltd. instrument with a model of JCM-6000Plus is loaded to the software and the loaded images are shown in Fig. 12. According to the ISO 4287 standard the pre-selected cutoff frequency (in the units of Nyquist frequency) and profile thickness was specified at 0.02 and 3px, respectively (Pavlović et al., 2012). The loaded 2D images which represent the height of the surfaces are shown in Fig. 12-a1&b1. The 3D image of the data which was obtained by selecting display a 3D view data that display the surface arrangement on the plane is given in Fig. 12-a2&b2. The crest and trough surface morphology of the section curve that represent the occurrence of pore is displayed in Fig. 12-a3&b3. All the surface roughness parameters such as; Ra, Rq, Rsk, and Rku are obtained by Gwyddion software (see Table 8). The average Ra value after 3 h calcination sample is 6.8 nm which is higher than 2 h calcination sample 4.6 nm. This shows that MnO2 NPs surface calcined at 450 °C for 3 h is rougher than those after 2 h calcination time. Other studies also supported that, several calcination time might increase the relative surface roughness by increasing the relative height of the synthesized sample particles (Sigaeva et al., 2009). The average Rq values of sample calcined for 3 h is 8.5 nm which is higher than calcined for 2 h sample with a value of 6.3 nm. This, confirming that the degree of surface roughness variation in MnO2 NPs after 3 h calcination time is much better than calcination for 2 h. The surface skewness (Rsk) after 3 h calcination time sample is more positive (-0.03) than sample calcination after 2 h (-0.12). This shows that more area (troughs) than peaks in the surface (crest) for 3 h calcined time, while more negative values for sample calcined at 2 h shows fewer surface area (troughs) than peaks (i.e., there is more area where the sample surface height is above the mean value). Finally, to represent the wave characteristics of the surface height distribution, the Rku value of sample calcined after 3 h is 2.79, and the Rku value of sample calcined after 2 h is 5.52. The result shows that the shape of pore size and grain size distribution is scattered in 3 h calcination sample while concentrated in 2 h calcination sample. To support these analyses further results which were done by surface mask using threshold and Watershed as well as inverted height distribution to show marked pores height are shown in the supplementary materials (Fig. S7, Fig. S8, Table S3, and Table S4). Generally, the high roughness could increase the contact area and then used to increase interactions between liquid and solid (Pizarro et al., 2019). Roughness average (Ra); Root mean square roughness (Rq); Surface skewness (Rsk); Kurtosis coefficient (Rku).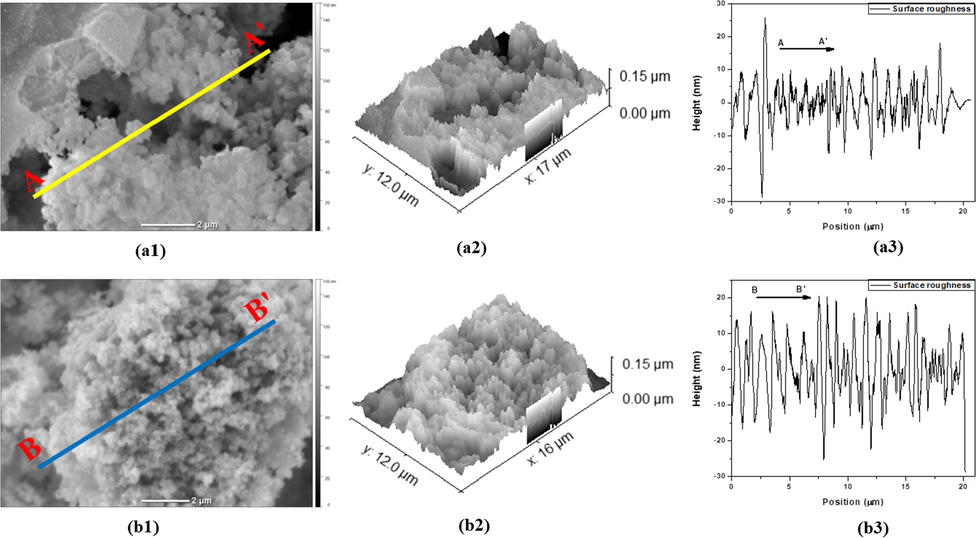
2-D, 3-D SEM images of two MnO2 NPs and diagonal section analysis of 2-D images calcined at 450 °C: (a1), (a2), (a3) after 2 h calcination time and (b1), (b2), (b3) after 3 h calcination time.
Sample
Calcination time (hour)
Ra (nm)
Rq (nm)
Rsk
Rku
MnO2 NPs
2
4.6
6.3
−0.12
5.52
3
6.8
8.5
−0.03
2.79
4 Conclusions
Manganese dioxide nanoparticles were prepared based on biosynthesis method under 25 conditions from different physicochemical variable combination of V. amygdalina leaf extract ratio, initial permanganate ion concentration (MnO4-), pH, and reaction time. The non-linear regression equation for absorbance dependent variable of the quadratic model using best D-optimal algorithm were investigated effectively with P-values less than 0.0500 (P < 0.0001). The experimental correlation between all the four independent variables and their optimizations were well examined with 3D surface and 2D contour plots. So, the targeted absorbance that determines MnO2 yield (absorbance at 320 nm was 1.095) under the optimal conditions with V. amygdalina leaf extract ratio = 43.72%, initial permanganate ion concentration (MnO4-) = 1.81 mM, pH = 6.02, and reaction time = 103.42 min which was agrees and validated with the actual average experimental results (absorbance at 320 nm was 0.9678). It was found that the predicted and actual (experimental) results have a good agreement in the dependent (response) variables. So, this agreement are very suitable to synthesis a stable and high efficiency MnO2 NPs through simple, ecofriendly, and non-toxic plant mediated approach for the necessary applications. It was found by UV–Vis analysis the optimized NPs has a colloidal with polydispersed property and has higher in energy band gap (both direct and indirect transition) suggested the diminishing of its bulk property (formation of nanosize) with a crystallite size value between 20 nm − 22 nm. The glass transition temperature which helps to examine the phase change evaluation and FTIR spectra investigation in which that the stretching of O-Mn-O occurred with a vibrational mode at about 596 cm−1 and 495 cm−1 indicated the presence of pure MnO2 NPs after 3 h calcination at 450 °C. As reveled by SEM analysis, the MnO2 NPs produced using plant extract as a reducing agent under optimal conditions produced better in porosity image with nanospherical flower like topography. The surface roughness in terms of parameters like mean roughness, mean square roughness, surface skewness, and kurtosis coefficient for MnO2 NPs after loading SEM data and reconstructed to 2D and 3D with the help of an open source Gwyddion software was evaluated.
Acknowledgments
We acknowledge Adama Science and Technology University for funding support.
Declaration of Competing Interest
The authors declare that they have no known competing financial interests or personal relationships that could have appeared to influence the work reported in this paper.
References
- Ultraviolet spectroscopic evaluation of bioactive saponin fraction from the aqueous extract of Vernonia amygdalina [Esteraeceae] leaf. Int. J. Biol. Chem. Sci.. 2017;11:1893.
- [CrossRef] [Google Scholar]
- CTAB-assisted cathodic electrosynthesis of MnO2 ultra-fine nanoparticles and investigation of their charge storage performance. Int. J. Electrochem. Sci.. 2018;13:1161-1172.
- [CrossRef] [Google Scholar]
- Extraction and characterization of bioactive compounds in Vernonia amygdalina leaf ethanolic extract comparing Soxhlet and microwave-assisted extraction techniques. J. Taibah Univ. Sci.. 2019;13:414-422.
- [CrossRef] [Google Scholar]
- Synthesis and characterization of MnO 2 and CdO nanoparticles. Adv. Sci. Lett.. 2012;7:39-42.
- [CrossRef] [Google Scholar]
- Modelling and optimization of Ag-nanoparticle biosynthesis mediated by walnut green husk extract using response surface methodology. Mater. Lett.. 2016;171:166-170.
- [CrossRef] [Google Scholar]
- Hydrothermal synthesis, characterization and electrochemical properties of γ-MnOOH nanobelts. Ceram. Int.. 2015;41:12273-12279.
- [CrossRef] [Google Scholar]
- Bitter Leaf (Vernonia amygdalin) for Dye Sensitized Solar Cell. Trends Appl. Sci. Res.. 2012;7:558-564.
- [CrossRef] [Google Scholar]
- Biofabrication of highly pure copper oxide nanoparticles using wheat seed extract and their catalytic activity: A mechanistic approach. Green Process. Synth.. 2019;8:691-702.
- [CrossRef] [Google Scholar]
- Synthesis and characterization of manganese dioxide using brassica oleracea (cabbage) J. Ind. Pollut. Control. 2017;33:1627-1632.
- [Google Scholar]
- Understanding crystallization pathways leading to manganese oxide polymorph formation. Nat. Commun.. 2018;9:2553.
- [CrossRef] [Google Scholar]
- Effects of Particle Size on Mg2+ Ion Intercalation into λ-MnO2 Cathode Materials. Nano Lett.. 2019;19:4712-4720.
- [CrossRef] [Google Scholar]
- Green synthesis of gold nanoparticles using carrageenan oligosaccharide and their in vitro antitumor activity. Mar. Drugs. 2018;16:277.
- [CrossRef] [Google Scholar]
- Indole synthesis using silver catalysis. Chem. - An Asian J.. 2019;14:1900-1911.
- [CrossRef] [Google Scholar]
- Green synthesis and growth kinetics of nanosilver under bio-diversified plant extracts influence. J. Nanostruct. Chem.. 2015;5:85-94.
- [CrossRef] [Google Scholar]
- Review on manganese oxide based biocatalyst in microbial fuel cell: Nanocomposite approach. Mater. Sci. Energy Technol.. 2020;3:136-149.
- [CrossRef] [Google Scholar]
- Recent developments in manganese oxide based nanomaterials with oxygen reduction reaction functionalities for energy conversion and storage applications: A review. J. Sci. Adv. Mater. Devices. 2019;4:353-369.
- [CrossRef] [Google Scholar]
- Enhanced catalytic and supercapacitor activities of DNA encapsulated β-MnO2 nanomaterials. Phys. Chem. Chem. Phys.. 2014;16:21846-21859.
- [CrossRef] [Google Scholar]
- Antibacterial and Antioxidant Compounds from the Flower Extracts of Vernonia amygdalina. Adv. Pharmacol. Sci.. 2018;2018:1-6.
- [CrossRef] [Google Scholar]
- Green synthesis of nanosized manganese dioxide as positive electrode for lithium-ion batteries using lemon juice and citrus peel. Electrochim. Acta. 2018;262:74-81.
- [CrossRef] [Google Scholar]
- Green synthesis, characterisation, and photocatalytic activity of manganese dioxide nanoparticles. Micro Nano Lett.. 2018;13:1560-1563.
- [CrossRef] [Google Scholar]
- Synthesis and application of MnO2/PANI/MWCNT ternary nanocomposite as an electrode material for supercapacitors. Int. J. Electrochem. Sci.. 2019;14:9298-9310.
- [CrossRef] [Google Scholar]
- Synthesis and characterization of whisker-shaped MnO2 nanostructure at room temperature. Appl. Nanosci.. 2013;3:329-333.
- [CrossRef] [Google Scholar]
- Enlightening surface plasmon resonance effect of metal nanoparticles for practical spectroscopic application. RSC Adv.. 2016;6:86174-86211.
- [CrossRef] [Google Scholar]
- Sapindus mukorossi mediated green synthesis of some manganese oxide nanoparticles interaction with aromatic amines. Appl. Phys. A Mater. Sci. Process.. 2016;122:1-12.
- [CrossRef] [Google Scholar]
- Mn3O4 hollow spheres for lithium-ion batteries with high rate and capacity. J. Mater. Chem. A. 2014;2:4627-4632.
- [CrossRef] [Google Scholar]
- The Effect of Temperature on Structural and optical properties of Manganese Oxide Nanoparticles. J. Phys. Conf. Ser.. 2019;1279:012004
- [CrossRef] [Google Scholar]
- Hydrothermal synthesis of γ-MnOOH nanorods and their conversion to MnO2, Mn2O3, and Mn3O4 nanorods. J. Alloys Compd.. 2015;644:430-437.
- [CrossRef] [Google Scholar]
- Preparation of Manganese Dioxide Nanoparticles on Laterite for Methylene Blue Degradation. J. Chem.. 2019;2019:1-9.
- [CrossRef] [Google Scholar]
- Assembling a double shell on a diatomite skeleton ternary complex with conductive polypyrrole for the enhancement of supercapacitors. Chem. Commun.. 2019;55:13773-13776.
- [CrossRef] [Google Scholar]
- Tuning MnO2 to FeOOH replicas with bio-template 3D morphology as electrodes for high performance asymmetric supercapacitors. Chem. Eng. J.. 2019;370:136-147.
- [CrossRef] [Google Scholar]
- A multi-parameter optimization model for the evaluation of shale gas recovery enhancement. Energies. 2018;11:654.
- [CrossRef] [Google Scholar]
- Near-infrared-driven selective photocatalytic removal of ammonia based on valence band recognition of an α-MnO2/N-doped graphene hybrid catalyst. ACS Omega. 2018;3:5537-5546.
- [CrossRef] [Google Scholar]
- Synthesis, characterization and study of antimicrobial activity of amino functionalized manganese oxide nanoparticles. J. Appl. Chem.. 2019;8:598-605.
- [Google Scholar]
- Biosynthesis of Ag and Fe nanoparticles using Erodium cicutarium; study, optimization, and modeling of the antibacterial properties using response surface methodology. J. Nanostruct. Chem.. 2019;9:203-216.
- [CrossRef] [Google Scholar]
- Manganese dioxide nanoparticles synthesized by electrochemical method and its catalytic activity towards oxygen reduction reaction. J. Ceram. Soc. Japan. 2018;126:906-913.
- [CrossRef] [Google Scholar]
- Recent progress in the transition metal catalyzed synthesis of indoles. Catalysts. 2018;8:458.
- [CrossRef] [Google Scholar]
- Green synthesis and characterization of manganese oxide nanoparticles from Gardenia resinifera leaves. Mater. Today Proc.. 2019;7–11
- [CrossRef] [Google Scholar]
- Recent advances in the application of indoles in multicomponent reactions. RSC Adv.. 2018;8:12069-12103.
- [CrossRef] [Google Scholar]
- Green synthesized iron nanoparticle-embedded pH-responsive PVDF-co-HFP membranes: Optimization study for NPs preparation and nitrobenzene reduction. Sep. Sci. Technol.. 2017;52:2338-2355.
- [CrossRef] [Google Scholar]
- Biological synthesis of manganese dioxide nanoparticles by Kalopanax pictus plant extract. IET Nanobiotechnol.. 2015;9:220-225.
- [CrossRef] [Google Scholar]
- Preparation and electrochemical characterization of manganese dioxide-zirconia nanorods. Appl. Nanosci.. 2015;5:481-491.
- [CrossRef] [Google Scholar]
- Green synthesis of a Cu/MgO nanocomposite by: Cassytha filiformis L. extract and investigation of its catalytic activity in the reduction of methylene blue, congo red and nitro compounds in aqueous media. RSC Adv.. 2018;8:3723-3735.
- [CrossRef] [Google Scholar]
- Biosynthesis and characterization of magnesium oxide and manganese dioxide nanoparticles using Matricaria chamomilla L. extract and its inhibitory effect on Acidovorax oryzae strain RS-2. Artif. Cells, Nanomedicine Biotechnol.. 2019;47:2230-2239.
- [CrossRef] [Google Scholar]
- Application of response surface methodology to optimize the extracellular fungal mediated nanosilver green synthesis. J. Genet. Eng. Biotechnol.. 2017;15:497-504.
- [CrossRef] [Google Scholar]
- A rapid method to estimate the concentration of citrate capped silver nanoparticles from UV-visible light spectra. Analyst. 2014;139:4855-4861.
- [CrossRef] [Google Scholar]
- Comparative study of direct and indirect image-based profilometry in characterization of surface roughness. Surf. Interface Anal.. 2012;44:825-830.
- [CrossRef] [Google Scholar]
- Potential application of Response Surface Methodology (RSM) for the prediction and optimization of thermal conductivity of aqueous CuO (II) nanofluid: A statistical approach and experimental validation. Phys. A Stat. Mech. its Appl.. 2020;95:124353
- [CrossRef] [Google Scholar]
- Thin films of sodium birnessite-type MnO2: Optical properties, electronic band structure, and solar photoelectrochemistry. J. Phys. Chem. C. 2011;115:11830-11838.
- [CrossRef] [Google Scholar]
- Porous surface films with tunable morphologies and hydrophobic properties based on block copolymer under the effects of thermal annealing. Front. Chem.. 2019;7:1-9.
- [CrossRef] [Google Scholar]
- Green synthesis of MnO2 nanorods using Phyllanthus amarus plant extract and their fluorescence studies. Green Process. Synth.. 2017;6:549-554.
- [CrossRef] [Google Scholar]
- Oriented growth of α-MnO2 nanorods using natural extracts from grape stems and apple peels. Nanomaterials. 2017;7:117.
- [CrossRef] [Google Scholar]
- Conducting polymer based manganese dioxide nanocomposite as supercapacitor. Electrochim. Acta. 2013;108:265-273.
- [CrossRef] [Google Scholar]
- Nanoparticle counting: Towards accurate determination of the molar concentration. Chem. Soc. Rev.. 2014;43:7267-7278.
- [CrossRef] [Google Scholar]
- Mentha-Stabilized Silver Nanoparticles for High-Performance Colorimetric Detection of Al(III) in Aqueous Systems. Sci. Rep.. 2018;8:1893.
- [CrossRef] [Google Scholar]
- Catalysts of methane pyrolysis: Pretreatment and study of Fechral support. Russ. J. Appl. Chem.. 2009;82:307-311.
- [CrossRef] [Google Scholar]
- Biosynthesis of Silver Nanoparticles from Eucalyptus corymbia Leaf Extract at Optimized Conditions. Nano Hybrids Compos.. 2019;25:32-45.
- [CrossRef] [Google Scholar]
- Biological Synthesis of Nanoparticles from Plants and Microorganisms. Trends Biotechnol.. 2016;34:588-599.
- [CrossRef] [Google Scholar]
- Biofabrication of manganese nanoparticle using Aegle marmelos fruit extract and assessment of its biological activities. Nanomedicine Res. J.. 2017;2:171-178.
- [CrossRef] [Google Scholar]
- Procedure optimization for green synthesis of manganese dioxide nanoparticles by Yucca gloriosa leaf extract. Int. Nano Lett.. 2019;9:73-81.
- [CrossRef] [Google Scholar]
- Optimisation of green synthesis of MnO nanoparticles via utilising response surface methodology. IET Nanobiotechnol. 2018;12:822-827.
- [CrossRef] [Google Scholar]
- Detection limits of DLS and UV-Vis spectroscopy in characterization of polydisperse nanoparticles colloids. J. Nanomater.. 2013;2013:1-10.
- [CrossRef] [Google Scholar]
- Influence of the preparation method of MnO2-based cathodes on the performance of single-chamber MFCs using wastewater. Sep. Purif. Technol.. 2016;171:174-181.
- [CrossRef] [Google Scholar]
- Ag2O nanoparticles fabrication by Vernonia amygdalina Del. leaf extract: Synthesis, characterization, and its photocatalytic activities. IOP Conf. Ser. Mater. Sci. Eng.. 2019;509
- [CrossRef] [Google Scholar]
- Yadhuraj, S.R., Satheesh Babu, G., Uttara Kumari, M., 2016. Measurement of thickness and roughness using gwyddion. ICACCS 2016 - 3rd Int. Conf. Adv. Comput. Commun. Syst. Bringing to Table, Futur. Technol. from Arround Globe. https://doi.org/10.1109/ICACCS.2016.7586314
- MnO 2 -assisted fabrication of PANI/MWCNT composite and its application as a supercapacitor. RSC Adv.. 2014;4:33569-33573.
- [CrossRef] [Google Scholar]
- I-Optimal Design of Hierarchical 3D Scaffolds Produced by Combining Additive Manufacturing and Thermally Induced Phase Separation. ACS Appl. Bio Mater.. 2019;2:685-696.
- [CrossRef] [Google Scholar]
- Textural and capacitive characteristics of MnO2 nanocrystals derived from a novel solid-reaction route. Electrochim. Acta. 2009;54:1021-1026.
- [CrossRef] [Google Scholar]
- Morphology-dependent performance of nanostructured MnO2 as an oxygen reduction catalyst in microbial fuel cells. Int. J. Electrochem. Sci.. 2014;10:3693-3706.
- [Google Scholar]
- Formation, characterisation and redox behaviour of water-soluble colloidal manganese dioxide. J. Exp. Nanosci.. 2012;7:74-84.
- [CrossRef] [Google Scholar]
- Fabrication and characterisation of MnOOH and β-MnO2 nanorods with rectangular cross-sections. J. Exp. Nanosci.. 2013;8:77-83.
- [CrossRef] [Google Scholar]
- Quantitative study on coal and shale pore structure and surface roughness based on atomic force microscopy and image processing. Fuel. 2019;244:78-90.
- [CrossRef] [Google Scholar]
- Investigating the effect of MnO 2 band gap in hybrid MnO 2 -Au materials over the SPR-mediated activities under visible light. J. Mater. Chem. A. 2019;7:925-931.
- [CrossRef] [Google Scholar]
Appendix A
Supplementary material
Supplementary data to this article can be found online at https://doi.org/10.1016/j.arabjc.2020.06.006.
Appendix A
Supplementary material
The following are the Supplementary data to this article:Supplementary data 1
Supplementary data 1
Supplementary data 2
Supplementary data 2


