

Translate this page into:
Quantitative analysis of binary mixtures of entecavir using solid-state analytical techniques with chemometric methods
⁎Corresponding author at: School of Chemical Engineering and Technology, Tianjin University, PR China. wusonggu@tju.edu.cn (Songgu Wu)
-
Received: ,
Accepted: ,
This article was originally published by Elsevier and was migrated to Scientific Scholar after the change of Publisher.
Abstract
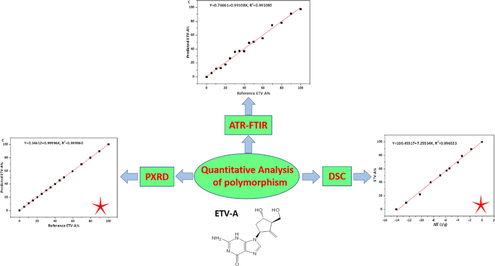
Different ratios of form ETV-A in ETV binary mixtures were quantified by Differential Scanning Calorimetry (DSC), Powder X-Ray Diffraction (PXRD) and Attenuated Total Reflectance Fourier Transform Infrared (ATR-FTIR) analytical techniques. The integral enthalpy value of the phase transformation in the DSC thermogram was selected to establish the standard curve for quantify the content of ETV-A. At the same time, ETV-A content PLS calibration curves with different pretreatment methods and different ranges of PXRD and ATR-FTIR data were also established to quantify the content of ETV-A.
Abstract
Different ratios of ETV-A in ETV binary mixtures were quantified. The DSC thermo-gram was selected to establish the standard curve for quantify the content of ETV-A in binary mixtures. ETV-A content PLS calibration curves of PXRD and ATR-FTIR data were established to quantify the content of ETV-A. The optimal preprocessing method was established.
Abstract
Entecavir (ETV), a guanosine analogue, can be rapidly phosphorylated to the active intracellular triphosphate form that inhibits replication of the hepatitis B virus (HBV). This work aims to develop useful methods to quantify the content of ETV-A in ETV-H and ETV-A binary mixtures. The integral enthalpy value of the phase transformation in the DSC thermogram was selected to quantify the content of ETV-A in binary mixture. Different ranges (full spectrum and partial spectrum) of the PXRD and ATR-FTIR data versus ETV-A content were used to develop partial least squares (PLS) calibration curves with different pre-processing algorithms including multiplicative scatter correction (MSC), standard normal variate (SNV), wavelet transform (WT) or their combinations. The standard curve obtained for the DSC technique is Y = 100.455 + 7.255X, R2 = 0.997, in the ETV-A contents range of 0–100% w/w% in binary mixtures. Limit of detection (LOD) of ETV-A was 0.909% and limit of quantitation (LOQ) is 2.755%. The best correction models for PXRD and ATR-FTIR techniques, in the ETV-A contents range of 0–100% w/w% in binary mixtures, were Y = 0.346 + 0.999X, R2 = 0.999 in the 2θ range of 4-6° with 14-34° and Y = 0.767 + 0.991X, R2 = 0.991 in the range of 3500–2500 cm−1 with 2000–400 cm−1 pretreated by MSC + WT, respectively. Limit of detection (LOD) of ETV-A was 1.394% and limit of quantitation (LOQ) was 4.224% for PXRD technique. LOD and LOQ for ATR-FTIR technique were 9.124% and 27.648%. The results show that DSC, PXRD and ATR-FTIR techniques are precise and accurate, and could be used for the measurement of ETV-A content in the binary mixtures.
Keywords
Entecavir
Anhydride impurity
Quantification
DSC
PXRD
ATR-FTIR

1 Introduction
Solid drugs generally have many crystal forms, such as polymorphs, solvates, salts, co-crystals and so on (Hilfiker, 2006). Polymorphism refers to the ability of a solid material to crystallize into two or more crystalline phases with different micro-structures (Brittain, 2009), distinct from solvates. Polymorphism/solvates exist in many active pharmaceutical ingredients (APIs) (Kamada et al., 2009). Polymorphic/solvates transformation may occur during various pharmaceutical unit operations (Zhang et al., 2004; Chan and Doelker, 1985; Miyamae et al., 1994; POLAT and SAYAN, 2018; Kim et al., 2020), and as we all known that different polymorphs/solvates have different physical, chemical and mechanical properties. These properties not only affect the processing properties of pharmaceutical products such as fluidity, compressibility and coagulation performance, but more importantly, it may also cause quality differences in drug dissolution rate, dissolution degree and stability, so as to affect the biological activity and bioavailability of drugs and lead to differences in clinical efficacy (Shefter and Higuchi, 1963; Räsänen et al., 2001). Hence, the U. S. Food and Drug Administration (FDA) recommends monitoring and controlling of polymorphs/solvates in drug substances and/or drug products to ensure reproducible manufacturing and quality of the pharmaceutical products in its draft guideline (Brittain, 2009; Strachan et al., 2004). It is necessary to detect and quantify polymorph/solvates of pharmaceuticals to ensure that physiochemical properties are not compromised by the presence of polymorphic/solvates impurities (Martin-Sabroso et al., 2013; Qiu et al., 2015). Entecavir (ETV) (Fig. 1), a guanosine analogue, can be rapidly phosphorylated to the active intracellular triphosphate form that inhibits replication of the hepatitis B virus (HBV). It has the characteristics of stronger antiviral activity, less drug resistance, less cross-internal drug resistance, less genetic and reproductive toxicity (Papatheodoridis et al., 2018; Pol and Lampertico, 2012; Sims and Woodland, 2006) than other antiviral drugs and has been approved in the US, EU and several countries worldwide for the treatment of chronic HBV infection in adults (Pol and Lampertico, 2012; Sims and Woodland, 2006; Ke et al., 2014; Manns et al., 2012; Rivkin, 2007; Scott and Keating, 2009; Sheng et al., 2011). The monohydrate form of ETV (ETV-H) and the anhydrous form of ETV (ETV-A) have been reported in scientific literatures, ETV-H is synthetized from the ethanol–water solution (Jiang and Liu, 2009) and ETV-A is obtained from the methanol solution through slow crystallization (Wang et al., 2018), respectively. ETV-H was used as the drug substance in pharmaceutical industry due to its higher solubility (Yi et al., 2014). In the production processing (granulation process, compression and drying) and transportation storage process, affected by temperature, pressure, humidity and other factors, ETV-H would be gradually converted into the anhydride impurity ETV-A affecting bioavailability and therapeutic effects of API (Ye et al., 2008). So, it would be of great significance to quantify the anhydride impurity during the industrial preparation of ETV-H.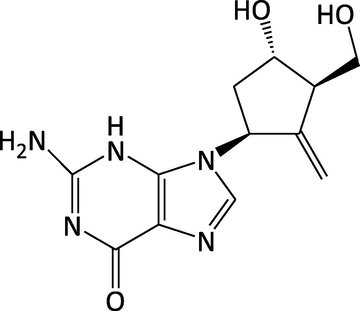
Chemical structure of entecavir.
A large number of analytical techniques have been used to quantify polymorphic/solvates mixtures, such as powder X-ray diffraction (PXRD) (Zappi et al., 2019; Kang et al., 2018; Sun et al., 2017; Zhao et al., 2016; Croker et al., 2012; Li et al., 2011; Tiwari et al., 2007; Sundaram et al., 2020; Skořepová et al., 2021; Polat and Eral, 2021), differential scanning calorimetry (DSC) (Li et al., 2011; Atici and Karlığa, 2015) and vibrational spectroscopy, which encompasses five complementary analytical techniques, such as Near Infrared Spectroscopy (NIRS) (Bhavana et al., 2019; Silva et al., 2015), Fourier transform infrared (FTIR) spectroscopy (Polat and Eral, 2021; Bhavana et al., 2019; Agatonovic-Kustrin et al., 2008; Hennigan and Ryder, 2013; Hu et al., 2010), Raman spectroscopy (Raman) (Bhavana et al., 2019; Farias and Carneiro, 2014; Farias et al., 2016; Nagy et al., 2016; Pazesh et al., 2016), solid-state nuclear magnetic resonance spectroscopy (SS-NMR) (Tinmanee et al., 2017; Virtanen and Maunu, 2010) and THz spectroscopy (TPS) (Darkwah et al., 2013). Powder X-ray diffraction (PXRD) and differential scanning calorimetry (DSC) are extensively used to quantify drug polymorphs/solvates impurities because the technologies are mature and easy to operation. However, PXRD’s application in the quantitative analysis of polymorphism/solvates is easy influenced by multi-factors, including preferred orientation, packing and sample thickness (Stephenson et al., 2001; Campbell-Roberts et al., 2002). Inter-conversion of the polymorphic/solvates forms during the thermo-gram collection in DSC is the main obstacle to its extensive use as a quantitative tool (Atef et al., 2012). Currently, more and more researchers have focused on the quantitative analysis of drug polymorphs/solvates using fast, simple and reliable analytical techniques based on NIRS, FTIR and Raman in combination with chemometric methods. Different polymorphs/solvates have different crystal packing forms and different molecular vibrations mode, which provided a theoretical basis for the quantitative analysis of drug polymorphs/solvate by NIRS, FTIR and Raman. However, simultaneous quantification of several solid-state forms using spectroscopic techniques was still a great challenge, as characteristic peaks used for quantification often overlap or spectral differences are relatively vague (Heinz et al., 2007). Additionally, non-linearities between spectral characteristics and concentration of analytes made it more difficult to quantitative analysis. With the continuous development of analytical techniques, multivariate analysis models such as partial least-squares (PLS) regression and principal component regression (PCR) have been used to overcome these difficulties, mainly because they can screen out effective qualitative and quantitative information from the whole raw data (Wold et al., 2001; Li et al., 2020). However, the original spectra contain noise information, so it is often necessary to preprocess the original spectra in a variety of pretreatment algorithms to reduce the impact of noise on the accuracy, such as multiplicative scatter correction (MSC), standard normal variate (SNV), wavelet transform (WT) were applied, etc.
As we all know, the content control of polymorphic/solvates impurities is still an important problem in the pharmaceutical industry. The aim of this work was to develop quantification methods for the analysis of the impurity (ETV-A) in ETV-H. To our knowledge, there was very few publications on the quantification of ENT pleomorphism. In the present study, DSC, PXRD and ATR-FTIR were used to quantify the ETV-A in binary mixtures. The integral enthalpy value of the phase transformation in the DSC thermogram was selected to quantify the content of ETV-A in binary mixture. Different ranges (full spectrum and partial spectrum) of the PXRD and ATR-FTIR data versus ETV-A content were used to develop partial least squares (PLS) calibration curves with different pre-processing algorithms including multiplicative scatter correction (MSC), standard normal variate (SNV), wavelet transform (WT) or their combinations. The performance of calibration models established by different methods are compared to find the suitable method to quantitative the ETV-A content in ETV binary mixtures. Both the DSC, PXRD and FTIR methods were used to determine the content of ENT-A in ENT binary mixture have achieved good results. Therefore, this work can provide a reference method for the quantitative study of drug polymorphic/solvates impurities, so as to control the quality of drugs.
2 Materials and methods
2.1 Materials and sample preparation
2.1.1 Materials
Pure ETV monohydrate was obtained from Baoji Guokang Biological Technology Co., Ltd. Shaanxi China (purity > 99.9%), and pure ETV anhydrous form was obtained by suspension crystallization of ETV-H in acetone (GR, Tianjin Fengchuan Chemical Reagent Technology Co., Ltd. Tianjin China). Two solid forms of pure ETV all have been characterized by Thermal Gravimetric Analyzer (TGA) and PXRD to ensure their purity of crystal form. These two solid forms were used as standards for the quantitative determination.
2.1.2 Solvate mixtures sample preparation
Two pure solid forms were grinded in mortar and passed through 100 mesh sieves for uniformity of the particle size before mixing, respectively. In order to ensure the uniformity of mixing and the consistency of powder particles, each sample was ground in a mortar for 5 min, and then mixed on a standard laboratory vortex mixer for 20 min before collecting the DSC, PXRD and ATR-FTIR data. ATR-FTIR was used to monitor the grinding and mixing experiments to ensure that phase transitions do not occur. The samples in Table 1 were used to establish and verify DSC quantitative model, and the samples of Table 2 were used to establish and verify PXRD and MIR quantitative models. All weighing works were carried out on a Mettler Toledo electronic balance (ME204T/02, Mettler Toledo Instrument (Shanghai) Co., Ltd).
Number of samples
Set name
Weight of ETV-A (mg)
Weight of ETV-H (mg)
Mixture weight (mg)
Content of ETV-A (%)
1
Calibration set
0.00
10.08
10.08
0.00
2
1.11
10.19
11.30
9.82
3
2.26
7.94
10.20
22.16
4
4.02
5.99
10.01
40.16
5
5.04
4.97
10.01
50.35
6
5.76
4.25
10.01
57.54
7
6.12
3.95
10.07
60.77
8
7.02
3.08
10.10
69.50
9
7.94
2.09
10.03
79.16
10
9.03
1.09
10.12
89.23
11
10.56
0.00
10.56
100.00
12
Validation set
5.15
7.50
12.65
40.711
13
4.80
5.35
10.15
47.29
14
5.25
5.69
10.94
47.99
Number of samples
Set name
Weight of ETV-A (mg)
Weight of ETV-H (mg)
Mixture weight (mg)
Content of ETV-A (%)
1
Calibration set
0.00
100.00
100.00
0.00
2
5.30
95.51
100.81
5.26
3
10.30
90.42
100.72
10.23
4
15.10
85.31
100.41
15.04
5
20.10
80.32
100.42
20.02
6
25.00
75.22
100.22
24.95
7
30.11
69.91
100.02
30.10
8
35.00
65.31
100.31
34.90
9
40.21
60.51
100.72
39.92
10
45.31
55.01
100.32
45.16
11
50.22
50.21
100.44
50.00
12
60.01
40.71
100.72
59.58
13
70.11
30.60
100.71
69.61
14
80.32
20.60
100.92
79.58
15
90.52
10.30
100.82
89.78
16
100.31
0.00
100.31
100.00
17
Validation set
55.61
46.01
101.62
54.72
18
66.11
34.70
100.81
65.58
19
75.21
24.90
100.11
75.12
20
85.32
15.10
100.42
84.96
21
95.11
5.30
100.41
94.72
2.2 Methods
2.2.1 Powder X-ray diffraction
The powder X-ray diffraction pattern were obtained on a Rigaku R-AXIS-RAPID powder diffractometer (Rigaku Co., Japan), with a Cu Kα radiation, λ = 1.5405 Å, and operated at 40 kV and 100 mA. All the measurements were conducted at ambient conditions over a 2θ range of 2–40° using a 0.02° step at a scan rate of 8° min−1. All samples were analyzed by PXRD for three times.
2.2.2 Thermo-gravimetric analysis
TGA measurements for two pure solid forms of entecavir were achieved with a Mettler TGA/DSC system (TGA/DSC, TGA/DSC1/SF, Mettler-Toledo, Switzerland) in the temperature range of 30–400 ℃. Samples (6–7 mg) were placed in open alumina crucibles and heated at a rate of 10 ℃ min−1 under a nitrogen purge protection(20 mL min−1).
2.2.3 Differential scanning calorimetry
DSC measurements were performed under the nitrogen flow of 50 mL min−1 with a Mettler DSC system (DSC, DSC 1/500, Mettler-Toledo, Switzerland). Each sample (about 10 mg) in Table 1 was heated from 30 ℃ to 200 ℃ at 5 ℃ min−1, and keep at 200 ℃ for 5 min. Then drop the temperature to 80 ℃ at 5 ℃ min−1 and keep it for 5 min, after that continue heating the sample to 200 ℃.
2.2.4 ATR-FTIR spectroscopy
All FTIR spectra were recorded using a Bruker Alpha Attenuated Total Reflectance Fourier Transform Infrared Spectroscopy (ATR-FTIR) instrument with 4 cm−1 resolution and 16 scans per spectrum at 4000–400 cm−1 range. Each sample was scanned seven times and these spectral data were averaged for using.
2.3 Data analysis
In the preliminary work, 21 average ATR-FTIR spectra (average spectrum was obtained by scanning each sample for 7 times) and 21 average PXRD patterns (average pattern was obtained by scanning each sample for 3 times) were collected to develop and validate the quantitative model of anhydrous form in the binary mixtures, respectively. And 11 DSC data were also collected to develop the standard curve of anhydrous form in the binary mixture.
At present, there are many pretreatment algorithms, and each one has its own advantages and disadvantages. MSC was used to eliminate the influence of the scattering on the spectrum caused by the uneven distribution and different particle size of the sample (Li et al., 2020). SNV was used to eliminate the influence of particle size, surface scattering and optical path change on diffuse reflection spectrum (Li et al., 2020). WT can provide a change with the frequency of the time–frequency window, used to preprocessing of spectroscopy original data. Noise and other unwanted information in the raw data can be more easily isolated, thus, the processed spectral data was closer to the sample data (Cheng et al., 2010). So, MSC, SNV and WT were used to preprocess all the raw spectral data to enhance the calibration model performance by improving signal to noise ratios and/or removing interference effects which were not correlated to analyte changes (Bhavana et al., 2019). All these pre-process algorithms to pretreat the PXRD and ATR-FTIR raw data and PLS regression to establish the correction models of PXRD and ATR-FTIR were carried out by Matlab paltform. Origin software were used for data processing of linear regression. The quality of the model was evaluated based on the correlation coefficient (
), root mean square error of calibration (RMSEC), cross-validation (RMSECV) and prediction (RMSEP) values. These are calculated by the Eqs. (1) and (2):
2.4 Method validation of the developed models
Accuracy, precision, limit of detection (LOD) and limit of quantification (LOQ) were used to validate correction models. To check the accuracy of the correction models, several samples of known ETV-A concentration were scanned by DSC (40.711%, 47.291%, 47.989%), PXRD (64.583%, 74.800%, 87.289%) and ATR-FTIR (55.268%, 74.800%, 92.871%), respectively. Precision of the DSC technique was ascertained by ETV-A content of 47.989%, all PXRD and ATR-FTIR techniques were confirmed by using ETV-A content of 74.800% in the binary mixture to describe precision. These two samples were also tested six times in two different days reporting the repeatability of the techniques. All the relative standard deviation (% RSD) were calculated according to Eq. (3). LOD and LOQ for each correlation were calculated using Eq. (4) and (5).
3 Results and discussion
3.1 Characterization of ETV-H and ETV-A
The experimental PXRD diffractograms of ETV-H and ETV-A were consistent with the literature results (Scott and Keating, 2009; Sheng et al., 2011). As shown in Fig 2, 2θ = 5.2°, 10.5°, 15.6°, 21.1°, 24.9°, 25.5°and 2θ = 11.8°, 16.0°, 16.9°, 19.9°, 23.6°, 23.8°were considered as the characteristic peaks of ETV-H and ETV-A, respectively. ETV-H and ETV-A could be distinguished by these of the unique PXRD peaks. PXRD average spectra of 16 different ETV binary mixtures were collected and exhibited in Fig. 3 for quantification of ETV-A. In Fig. 3, several characteristic peaks strength changes with the content of ETV-A from 0% to 100% in binary mixtures were marked with orange boxes. It can be seen from the figure that the change of characteristic peak strength is closely correlative with ETV-A content. This provided a theoretical support for quantifying the content of ETV-A in binary mixtures with different contents of ETV-A by using the change of PXRD peak strength of binary mixtures.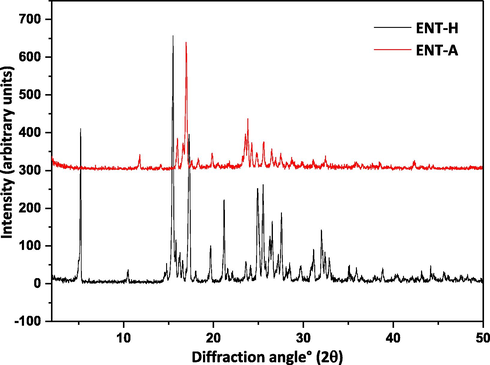
PXRD overlay of the two ETV solid forms.
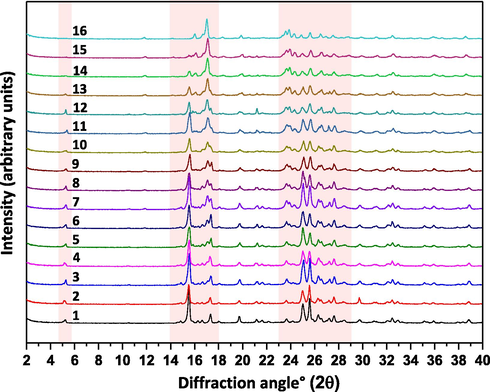
PXRD overlay of 16 ETV solid forms binary mixture samples.
In this article, the ATR-FTIR spectra of the ETV-H and ETV-A solid powder samples were reported for the first time. ETV-A and ENT-H could be differentiated from each other by some characteristic peaks, as shown in Fig. 4. The characteristic peaks of ETV-H and ETV-A in ATR-FTIR spectra were 3445 cm−1, 1721 cm−1, 1631 cm−1, 1540 cm−1, 1398 cm−1, 1014 cm−1 and 3424 cm−1, 1674 cm−1, 1591 cm−1, 1554 cm−1, 1356 cm−1, 1072 cm−1, 658 cm−1, respectively. The characteristic peaks of ETV-H in ATR-FTIR spectra were characterized as the —OH stretching vibration of crystalline water, C = O stretching vibration of secondary amide, C⚌C stretching vibration, —NH plane bending vibration of the secondary amide, C-H bending vibration of methylene and methylidyne groups, C-O stretching vibration of the hydroxyl group, respectively. The ATR-FTIR average spectra of 16 different ETV binary mixtures were also shown in Fig. S1 for quantification of ETV-A. Similarly, in Fig. 5A, the variation trend of ATR-FTIR characteristic peaks strength with the increase/decrease of ETV-A content was also marked with orange. Fig. 5B was the enlarged ATR-FTIR spectrum at 1750–1450 cm−1 of 16 binary mixture samples, and it can be clearly seen that the change of endothermic peaks strength is positively/negatively related to the content of ETV-A.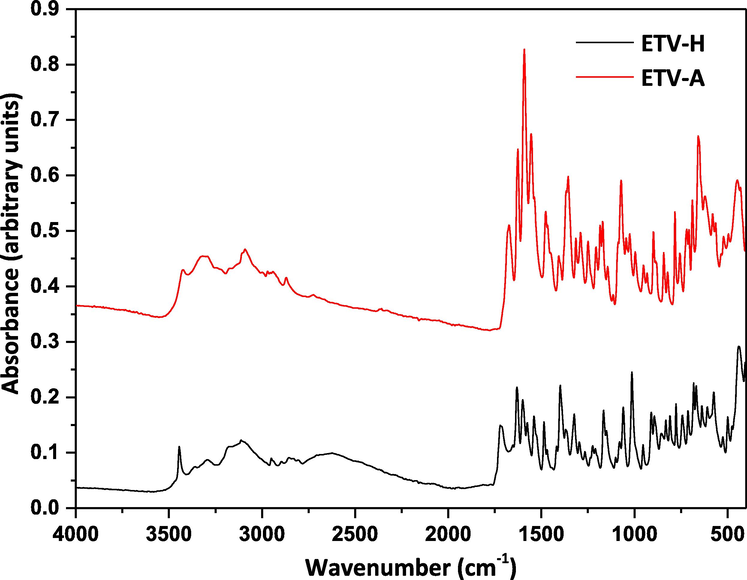
ATR-FTIR spectra of the two ETV solid forms.
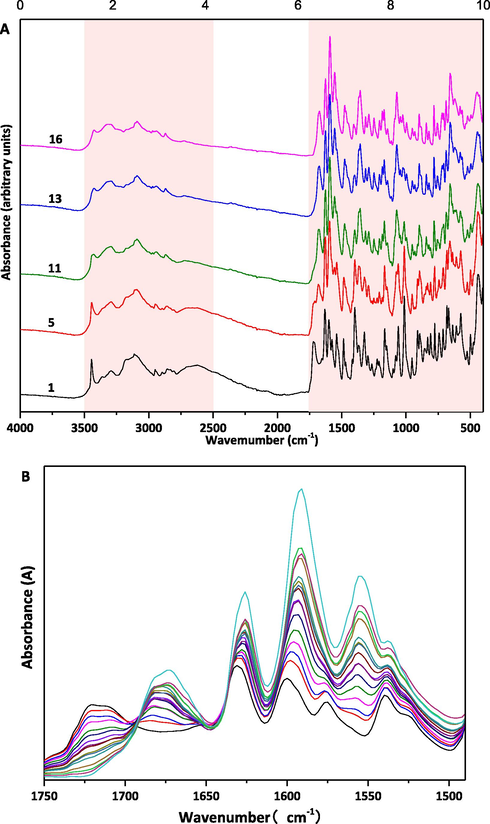
(A) Total ATR-FTIR spectra of 5/16 ETV solid forms binary mixture samples and (B) partial ATR-FTIR spectra of 16 ETV solid forms binary mixture samples.
TGA-DSC curves of ETV two forms had been reported in the previous studies (Kang et al., 2018). TGA-DSC curves of ETV-A and ETV-H were shown in Fig. 6. DSC curve of ETV-A (Fig. 6A) showed two endothermic peaks, the endothermic peak at 231℃ is corresponding to the transformation into the other phase, which has been reported in the previous literature (Kang et al., 2018). The melting happens at 294 ℃. For the ETV-H curve (Fig. 6B), there is an endothermic peak at 92 ℃ corresponding to the dehydration. The weight loss in TGA is 6.10%, which is the same as the theoretical value of water content in ETV-H. The peaks at 136℃ and 243℃ were endothermic phase transition peaks. The endothermic peak at 296℃ was the melting peak of ETV-H before decomposition. ETV-H lose water and transformed to a new anhydrous crystal form at 92℃, we named it as ETV-AⅠ. ETV-AⅠcould transformed to another form at 137℃, we named it as ETV-AⅡ, and previous studies have been found that ETV-AⅠwas converted to ETV-AⅡ at 137℃, but it quickly converted to ETV-AⅠwhen the temperature was lower than 137℃, it has been proved by DSC diagram was shown in Fig. 7 ETV-H was heated from 30℃ to 200℃, then cooled from 200℃ to 80℃, and then heated from 80℃ to 200℃ again. From the DSC map, there were three endothermic peaks and one exothermic peak, first one was the dehydration peak, second and third were the ETV-AⅠconversion to ETV-AⅡpeak, the exothermic peak was ETV-AⅡconversion to ETV-AⅠ. These two forms are reported for the first time. Theoretically, in the binary mixture, the enthalpy value of ETV-H loss water is inversely proportional to the mass/content of ETV-A, which could be used to establish a linear relationship to quantify the content of ETV-A. However, as shown in Fig. 6B, the thermal behavior of ETV-H at 30–400 ℃ is very complex. Furthermore, in the DSC curve of binary mixtures, it is difficult to calculate the enthalpy values of ETV-H loss water because the two endothermic peaks of water loss and phase transition are overlapped with each other. Fortunately, in the thermal cycle DSC diagram of ETV-H as shown in Fig. 7, we found that ETV-AⅠwas converted to ETV-AⅡ at 137 ℃ during the heating process, and it could be quickly converted to ETV-AⅠwhen the temperature was lower than 137 ℃ during the cooling process. ETV-AⅠcould be convert to ETV-AⅡwhen heated again and this phase transition absorption peak is an independent peak. This phenomenon has not appeared in the ETV-A thermal cycle DSC diagram. Thus, its enthalpy value can be calculated easily and has linear relation with the content of ETV-A. So, DSC diagrams of 11 different ETV binary mixtures were also been collected and the enthalpy values of the third endothermic peaks were calculated with Origin software for quantification of ETV-A.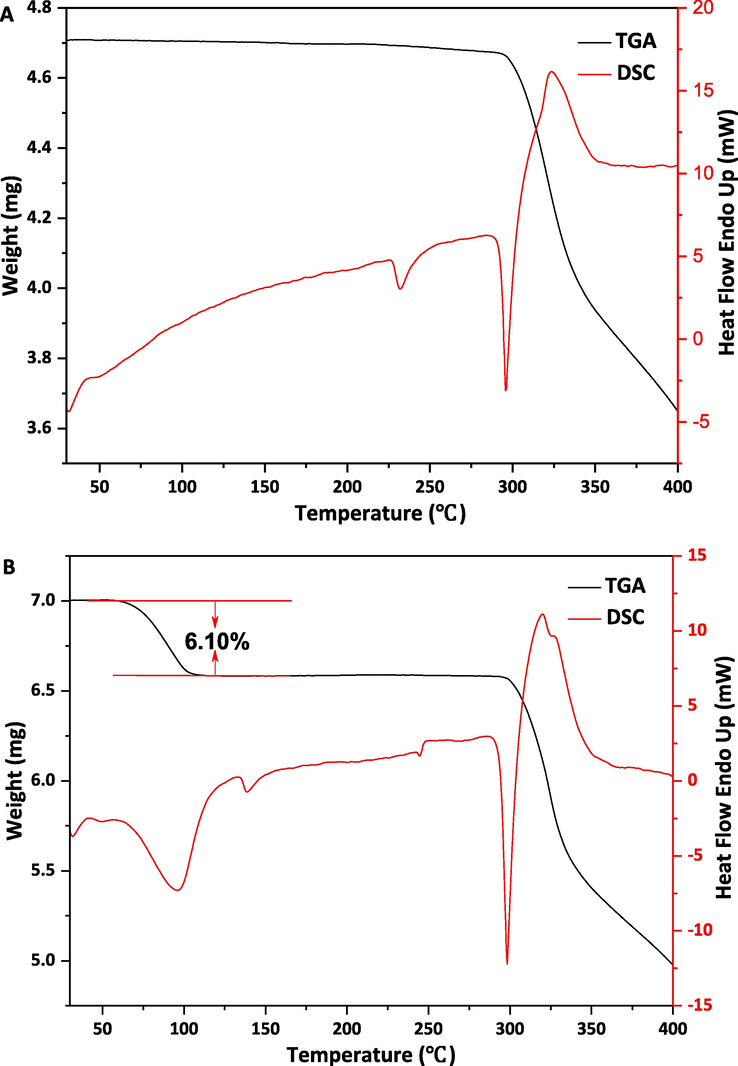
DSC and TGA curves of ETV-A (A) and ETV-H (B).
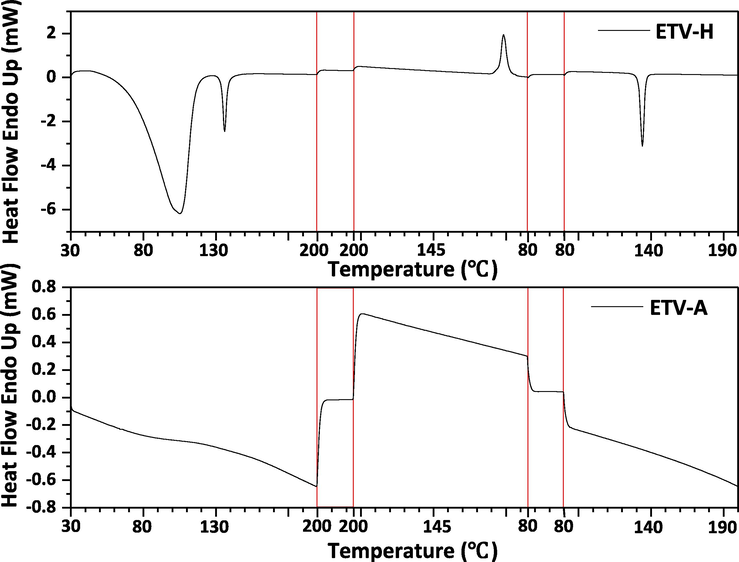
ETV-H and ETV-A was heated in one cycle by DSC. ETV-H and ETV-A were heated from 30 ℃ to 200 ℃, kept constant temperature for 5 min, then cooled from 200℃ to 80 ℃, kept constant temperature for 5 min, and then heated from 80 ℃ to 200 ℃ again.
3.2 Development of DSC quantification model
As described above, a unique endothermic peak of ETV-H appeared in DSC one cycle maps, this phenomenon did not exist in the DSC one cycle map of ETV-A. The thermal cycle DSC curves of 11 different ETV binary mixtures are shown in Fig. 8 for quantification of ETV-A. It can be clearly seen that the heat of the unique endothermic peak decreases with the increase of the content of ETV-A. The heat of the unique endothermic peak divided by the weight of the sample was the enthalpy value of the crystalline transformation. Therefore, the enthalpy values of this endothermic peak were selected to quantify the content of ETV-A in binary mixtures. Enthalpy value of unique endothermic peaks of 14 different ETV binary mixtures were calculated with Origin software listed as Table 3. The actual and predicted ETV-A weight percentage values based on quantification model are listed in Table 6 and the calibration curve is shown in Fig. 9.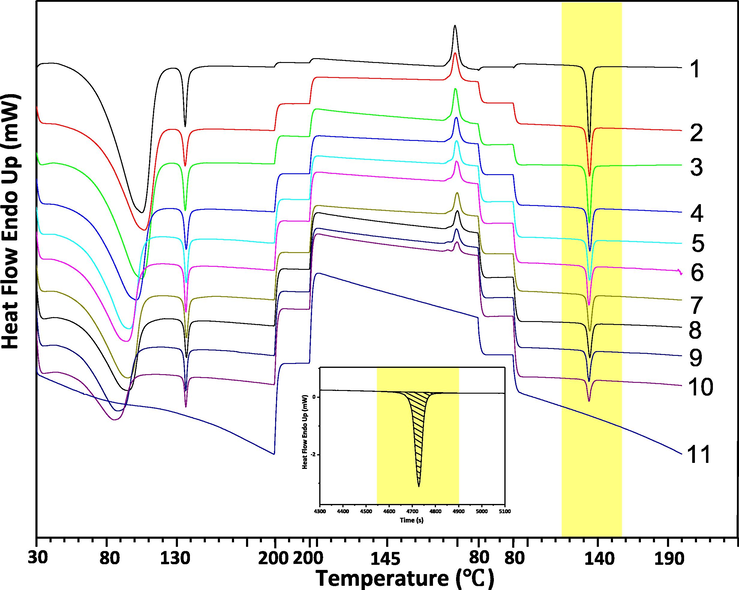
Thermal cycle DSC of 11 ETV solid forms binary mixture samples. The embedded figure was a schematic diagram of the integration of the heat of unique endothermic peak when ETV-A content of was 0%.
Number of samples
Mixture weight (mg) a
Heat of the endothermic peak (mJ) b
Enthalpy value (J/g) c
1
10.08
−142.64
−14.15
2
11.30
−141.51
−12.52
3
10.20
−104.58
−10.25
4
10.01
−84.80
−8.47
5
10.01
−69.09
−6.90
6
10.01
−58.52
−5.85
7
10.07
−54.08
−5.37
8
10.10
−40.19
−3.98
9
10.03
33.09
−3.30
10
10.12
−17.65
−1.74
11
10.56
0.00
0.00
12
12.65
−101.87
−8.05
13
10.15
−74.65
−7.36
14
10.94
−79.84
−7.30
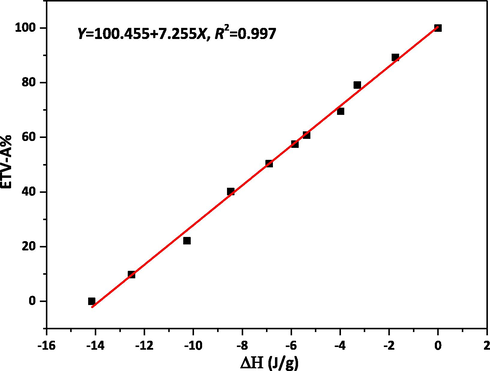
Calibration curve of
VS. ETV-A content.
3.3 Development of PXRD quantification models
PXRD patterns of 16 different ETV binary mixtures were scanned to develop the calibration curve. MSC, SNV, WT and their combinations were used to preprocess the original PXRD data, respectively, and the graphs after pretreatment were shown in Fig.S2. After pretreatment, 2-40°, 14-34°, 4-6° with 14-34° 2θ of 16 pieces of PXRD data were used to build correction models by PLS model to quantify the content of ETV-A and the results are listed in Table 4. Based on the R2 values in Table 4, it was better to establish the PLS models with three different 2θ ranges of MSC, SNV and MSC, SNV with WT pretreated. However, combined with RMSEC, RMSECP, RMSECV, PLS factors and LOD, LOQ in Table 4 20–40° 2θ with SNV + WT pretreated algorithm, 14-34° 2θ with MSC pretreated algorithm and 4–6 and 14-34° 2θ with MSC + WT pretreatment were found to be the most suitable regression models compared to other spectral regions and pretreated algorithms. The calibration curve is shown in Fig. 10. The actual (64.583%, 74.800%, 84.289%) and predicted ETV-A weight percentage values based on quantification models are listed in Table 6. The correction model with the best performance was established by using PLS preprocessed by MSC + WT at 4-6° with 14-34° 2θ.
Region (o 2θ)
Pre-processing
PLS factors
RMSECV%
RMSECP%
RMSEC%
R2
2–40
original data
16
0.000
1.684
0.000
1.000
MSC
12
0.000
3.767
0.000
1.000
SNV
14
0.000
9.930
0.000
1.000
MSC + WT
9
0.000
3.829
0.000
1.000
SNV + WT
3
0.100
7.880
2.920
0.992
WT
16
0.000
1.666
0.000
1.000
14–34
original data
15
0.010
2.322
0.000
1.000
MSC
2
0.000
3.366
0.000
0.993
SNV
10
0.080
7.980
2.740
1.000
MSC + WT
2
0.000
3.425
0.000
0.993
SNV + WT
3
0.080
9.330
2.790
0.994
WT
14
0.070
2.335
2.450
1.000
4–6, 14–34
original data
16
0.000
2.150
0.000
1.000
MSC
12
0.000
2.659
0.000
1.000
SNV
10
0.000
8.033
0.000
1.000
MSC + WT
5
0.000
2.340
0.000
0.999
SNV + WT
2
0.000
7.102
0.000
0.986
WT
14
0.020
2.131
0.400
1.000
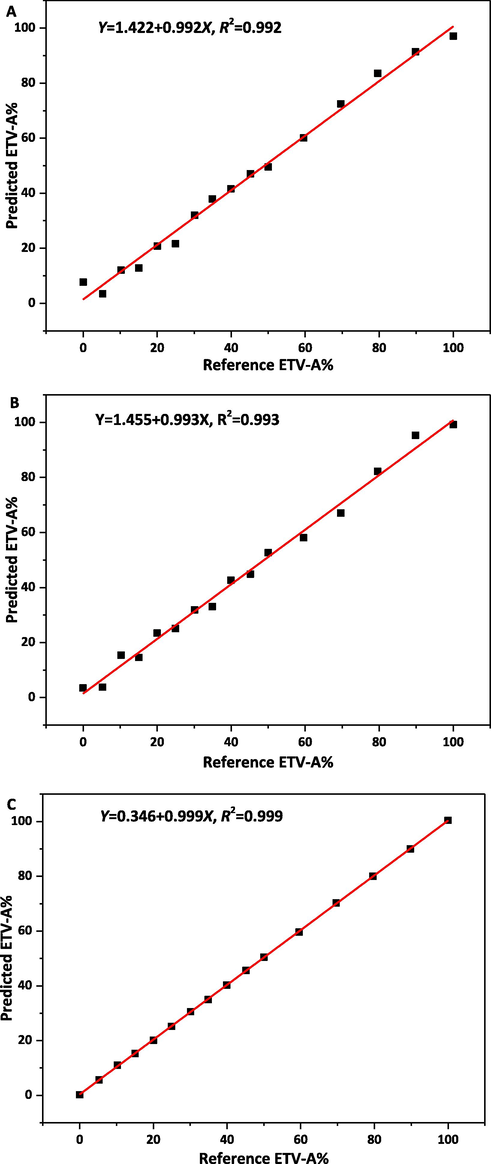
Calibration curve of reference vs. predicted content of ETV-A in ETV binary mixture by using PXRD by PLS analysis. A, B, C was the calibration model pretreated by SNV + WT, MSC, MSC + WT in 2θ range of 2-40°, 14-34°, 4-6°with 14-34°, respectively.
3.4 Development of ATR-FTIR quantification models
The ATR-FTIR spectra of 16 different ETV binary mixtures have been collected to establish the correction models. Before modeling, MSC, SNV, WT and their combinations pretreatment algorithms were used to preprocess the original ATR-FTIR data, respectively, and the graphs after pretreatment were shown in Fig. S3. After pretreatment, 4000–400 cm−1, 2000–400 cm−1, 3500–2500 cm−1 with 2000–400 cm−1 of 16 pieces ATR-FTIR data were used to establish correction models by PLS model to quantify the content of ETV-A, and the results are listed in Table 4. Based on the R2 values, PLS factors, RMSEC, RMSECP, RMSECV in Table 5, it was better to establish the PLS models with three different spectrum ranges of MSC, SNV, MSC + WT and SNV + WT pretreated, because they have almost similar correction effects. Whereas, combined with LOD, LOQ in Table 6, all the 4000–400 cm−1, 2000–400 cm−1 and 3500–2500 with 1750–400 cm−1 pretreated by MSC + WT were found to be the most suitable regression model compared to other spectral regions and pretreated algorithms. The calibration curve is shown in Fig. 11. The actual (55.268%, 74.800%, 92.871%) and predicted ETV-A weight percentage values based on quantification models are listed in Table 5. The correction model with the best performance was established through the PLS model preprocessed by MSC + WT at 3500–2500 cm−1 with 1750–400 cm−1.
Region (cm−1)
Pre-processing
PLS factors
RMSECV%
RMSECP%
RMSEC%
R2
4000–400
original data
2
0.010
8.697
4.390
0.982
MSC
4
0.100
0.392
3.020
0.990
SNV
4
0.130
6.919
2.650
0.994
MSC + WT
4
0.160
0.837
3.190
0.989
SNV + WT
4
0.080
7.867
2.940
0.993
WT
2
0.000
9.588
4.870
0.976
1750–400
original data
4
0.024
4.165
2.215
0.996
MSC
3
0.081
0.523
3.068
0.989
SNV
4
0.156
4.736
2.337
0.995
MSC + WT
3
0.106
1.820
2.567
0.992
SNV + WT
3
0.049
7.786
3.295
0.991
WT
4
0.058
4.040
2.461
0.995
3500–2500, 1750–400
original data
2
0.020
9.313
4.500
0.980
MSC
4
0.150
1.193
2.980
0.990
SNV
4
0.010
7.106
2.270
0.997
MSC + WT
4
0.180
2.009
2.820
0.991
SNV + WT
3
0.070
8.459
3.240
0.990
WT
4
0.030
3.346
2.430
0.994
Analytical techniques
Pre-processing
LOD
LOQ
Verification sample 1
Verification sample 2
Verification sample 3
Precision
Repeatability
40.711 (R)
47.291 (R)
47.989 (R)
DSC
original data
0.909
2.755
42.032 (P)
47.097 (P)
47.508 (P)
0.274
0.277 (Intra)0.249
(Inter)
PXRD
64.583 (R)
74.800 (R)
84.289 (R)
SNV + WT
(2–40° 2θ)10.383
31.464
64.743 (P)
61.169 (P)
83.606 (P)
2.371
2.692 (Intra)2.590
(Inter)
MSC
(14–34° 2θ)9.750
29.544
61.248 (P)
70.150 (P)
83.176 (P)
1.136
1.268 (Intra)1.240
(Inter)
MSC + WT
(4–6,14–34° 2θ)1.394
4.224
64.860 (P)
72.118 (P)
87.315 (P)
1.261
1.144 (Intra)1.085
(Inter)
ATR-FTIR
55.268 (R)
74.800 (R)
92.871 (R)
MSC + WT (4000–400 cm−1)
11.394
34.527
56.703 (P)
74.655 (P)
92.728 (P)
0.922
0.749 (Intra)0.868
(Inter)
MSC + WT (1750–400 cm−1)
10.048
30.448
57.366 (P)
72.025 (P)
94.109 (P)
0.661
0.534 (Intra)0.477
(Inter)
MSC + WT (3500–2500,
1750–400 cm−1)9.124
27.648
58.205 (P)
72.942 (P)
92.703 (P)
0.574
0.225 (Intra)0.358
(Inter)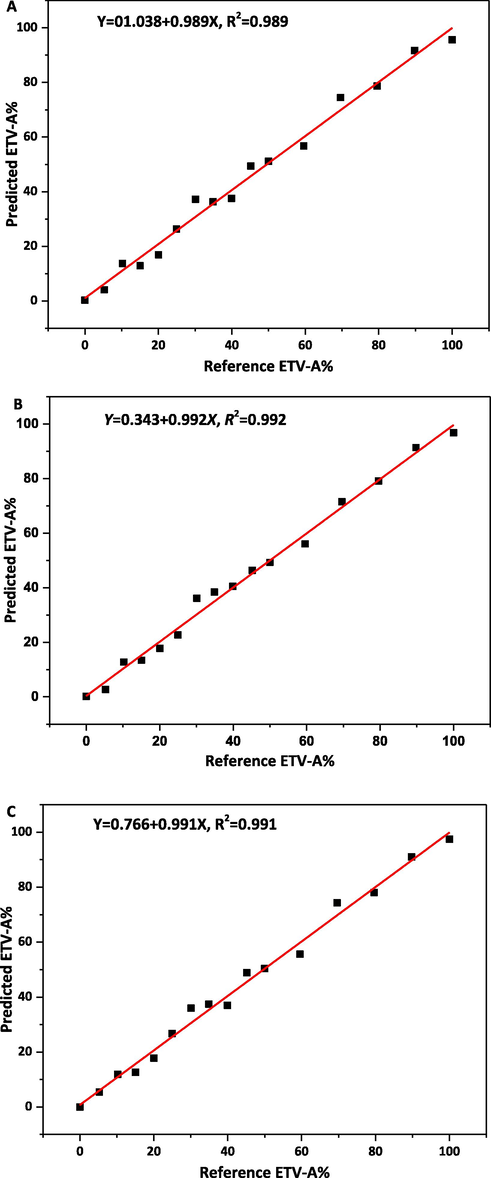
Calibration curve of reference vs. predicted content of ETV-A in ETV binary mixture using ATR-FTIR by PLS analysis. A, B, C was the calibration model pretreated by MSC + WT in range of 4000–400 cm−1, 2000–400 cm−1, 3500–2500 cm−1 with 2000–400 cm−1, respectively.
3.5 Comparison of the three techniques
The aim of this study was to look for the most suitable method to quantify the content of ETV-A in binary mixtures. PXRD and DSC have been widely used in the quantitative analysis of polymorphic/solvates mixtures. PXRD relied on the proportional relationship between the strength of the diffraction peaks of different polymorphs/solvates at different 2θ diffraction angles and the content of the corresponding crystal forms for quantitative analysis, while DSC relied on the thermal effect that occurs during the transformation or melting of crystal forms, and the proportional relationship between the corresponding thermal change and the content of crystal forms for quantitative analysis. Although PXRD was a non-destructive and non-contactless analytical technique, it was easily affected by the preferred orientation which caused by the mixing uniformity and particle size of the analytical samples. In comparison, DSC technique was simple and effective, but it was a sample destructive and time-consuming testing. Similarly, ATR-FTIR was a non-destructive, non-contactless, and rapidly analysis technique, but it was susceptible to scattering caused by particle size and mixing uniformity, and the overlapping of multiple endothermic peaks. Each technique has its own pros and cons. Sometimes it is necessary to combine two or three techniques to carry out effectively quantitative analysis.
Generally speaking, these three analytical techniques were suitable for quantitative analysis of the content of ETV-A in the ETV binary mixtures, with good linear range, low prediction error, high accuracy precision and repeatability. The RMSECV%, RMSECP%, RMSEC%, R2, precision and repeatability of the best correction model of ATR-FTIR are 0.180, 2.009, 2.820, 0.991, 0.574, 0.225 (Intra) and 0.358 (Inter), respectively. That is in line with the requirements of quantitative determination. But it is not difficult to find that the LOD and LOQ of the best correction model of ATR-FTIR are 9.124 % and 27.648 %, respectively. This means that the low-content ETV-A in binary mixtures cannot be quantified through the ATR-FTIR correction model. The DSC and PXRD best correction models have lower LOD (0.909, 1.394) and LOQ (2.755, 4.224), with lower RMSECV%, RMSECP%, RMSEC% and higher R2 (0.997, 0.999), which can fully meet the quantitative requirements of ETV-A content in binary mixtures. PXRD has the highest accuracy of quantitative analysis, but the calibration curve needs to be established by PLS. DSC analysis technique was simple. The content of ETV-A of unknown samples can be quantitatively only by establishing the standard curve of trans-crystal enthalpy values and contents, with wide linear range and accurate results.
4 Conclusion
In this study, we developed useful analytical methods for quantification of ETV-A in binary mixtures of ETV by: (a) using two solid-state analytical techniques, PXRD and ATR-FTIR spectroscopy in combination with partial least-squares (PLS) with previous pre-processing algorithms including MSC, SNV, WT or their combinations to preprocess different ranges relevant data for reduce the noise in scanning data and (b) employing a classical univariate calibration based on the integral enthalpy value of the phase transformation in the DSC. The standard curve obtained for the DSC technique is Y = 100.455 + 7.255X, R2 = 0.997, in the ETV-A contents range of 0–100% w/w% in binary mixtures. Limit of detection (LOD) of ETV-A was 0.909% and limit of quantitation (LOQ) is 2.755%. The best correction models for PXRD and ATR-FTIR techniques, in the ETV-A contents range of 0–100% w/w% in binary mixtures, were Y = 0.346 + 0.999X, R2 = 0.999 in the 2θ range of 4-6° with 14-34° and Y = 0.767 + 0.991X, R2 = 0.991 in the range of 3500–2500 cm−1 with 2000–400 cm−1 pretreated by MSC + WT, respectively. Limit of detection (LOD) of ETV-A was 1.394% and limit of quantitation (LOQ) was 4.224% for PXRD technique. LOD and LOQ for ATR-FTIR technique were 9.124% and 27.648%. The results show that DSC, PXRD and ATR-FTIR techniques are precise and accurate, and could be used for the measurement of ETV-A content in binary mixtures. Finally, the quantification results of entecavir two forms herein obtained, made it possible to detect the recommended medicinal form and provided useful information, which can be used for quality control during drug production process and routine testing.
Acknowledgements
The authors are grateful to the Natural Science Foundation of Qinghai Province, China, Grant No. 2018-HZ-818, 2019-ZJ-901, 2020-HZ-802, 2018-ZJ-905Q and 2018-HZ-810.
Declaration of Competing Interest
The authors declare that they have no known competing financial interests or personal relationships that could have appeared to influence the work reported in this paper.
References
- Polymorphism in the Pharmaceutical Industry. Weinheim: WILEY- VCH Verlag Gmb H&Co. KGa A; 2006. p. :218.
- Characterization and monitoring of pseudo-polymorphs in manufacturing process by NIR. Int. J. Pharm.. 2009;368:103-108.
- [Google Scholar]
- Phase transformation considerations during process development and manufacture of solid oral dosage forms. Adv. Drug Deliv. Rev.. 2004;56:371-390.
- [Google Scholar]
- Polymorphic transformation of some drugs under compression. Drug Dev. Ind. Pharm.. 1985;11:315-332.
- [Google Scholar]
- X-ray powder diffraction study on the grinding effect of the polymorphs of a novel andorally effective uricosuric agent: FR76505. Drug Dev. Ind. Pharm.. 1994;20(18):2881-2897.
- [Google Scholar]
- Kinetic analysis and polymorphic phase transformation of glycine in the presence of lauric acid. J. Cryst. Growth. 2018;481:71-79.
- [Google Scholar]
- Manufacture and characterization of two distinct quasi-polymorphs of empagliflozin. J. Cryst. Growth. 2020;534:125489.
- [CrossRef] [Google Scholar]
- Dissolution behavior of crystalline solvated and nonsolvatedforms of some pharmaceuticals. J. Pharm. Sci.. 1963;52:781-791.
- [Google Scholar]
- Novel identifcation of pseudopolymorphic changes of theophylline during wet granulation using near infrared spectroscopy. J. Pharm. Sci.. 2001;90:389-396.
- [Google Scholar]
- Quantitative analysis of polymorphic mixtures of carbamazepine by Raman spectroscopy and principal components analysis. J. Raman Spectrosc.. 2004;35:347-352.
- [Google Scholar]
- Validation protocol of analytical procedures for quantification of drugs in polymeric systems for parenteral administration: dexamethasone phosphate disodium microparticles. Int. J. Pharm.. 2013;458:188-196.
- [Google Scholar]
- Quantification of febuxostat polymorphs using powder X-ray diffraction technique. J. Pharm. Biomed. Anal.. 2015;107:298-303.
- [Google Scholar]
- Eight-year survival in chronic hepatitis B patients under long-term entecavir or tenofovir therapy is similar to the general population. J. Hepatol.. 2018;68:1129-1136.
- [Google Scholar]
- First-line treatment of chronic hepatitis B with entecavir or tenofovir in ‘real-life’ settings: from clinical trials to clinical practice. J. Viral Hepatitis. 2012;19:377-386.
- [Google Scholar]
- Entecavir: A New Nucleoside Analog for the Treatment of Chronic Hepatitis B Infection. Pharmacotherapy. 2006;26:1745-1757.
- [Google Scholar]
- Comparison of Efficacy and Safety of Tenofovir and Entecavir in Chronic Hepatitis B Virus Infection: A Systematic Review and Meta-Analysis. Plos One. 2014;9(6):e98865.
- [Google Scholar]
- Long-term safety and tolerability of entecavir in patients with chronic hepatitis B in the rollover study ETV-901. Expert Opin. Drug Saf.. 2012;11:361-368.
- [Google Scholar]
- Entecavir: A new nucleoside analogue for the treatment of chronic hepatitis B. Drugs Today. 2007;4:201-220.
- [Google Scholar]
- Lamivudine plus adefovir combination therapy versus entecavir monotherapy for lamivudine-resistant chronic hepatitis B: a systematic review and meta-analysis. Virology J.. 2011;8:393.
- [Google Scholar]
- 2-Amino-9-[(1S,3R,4S)-4-hydroxy-3-hydroxymethyl-2-methyle necyclopentyl]-1,9-dihydro-6H-purin-6-one monohydrate. Acta Cryst.. 2009;65(9) o2232 o2232
- [Google Scholar]
- Crystal structure and Hirshfeld surface analysis of the anhydrous form of the nucleoside analogue entecavir. Acta Cryst.. 2018;74(3):381-385.
- [Google Scholar]
- D. Yi, Z. Tian, W. Ye, Crystal entecavir, crystal entecavir formulation and methods for the preparation thereof, US patent 0220120 A1 (2014).
- W. Ye, D. Xu, J. Yuan, C. Chen, J. Nie, Crystallization type entecavir, method of producing the same, pharmaceutical composition and uses thereof, CN patent 101245068 A (2008).
- Quantifying API polymorphs in formulations using X-ray powder diffraction and multivariate standard addition method combined with net analyte signal analysis. Eur. J. Pharm. Sci.. 2019;130:36-43.
- [Google Scholar]
- Quantitation of polymorphic impurity in entecavir polymorphic mixtures using powder X-ray diffractometry and Raman spectroscopy. J. Pharm. Biomed. Anal.. 2018;158:28-37.
- [Google Scholar]
- Determination of minor quantities of linezolid polymorphs in a drug substance and tablet formulation by powder X-ray diffraction technique. Powder Diffr.. 2017;32:78-85.
- [Google Scholar]
- Quantification of flupirtine maleate polymorphs using X-ray powder diffraction. Chinese Chem. Lett.. 2016;27:1666-1672.
- [Google Scholar]
- A comparative study of the use of powder X-ray diffraction, Raman and near infrared spectroscopy for quantification of binary polymorphic mixtures of piracetam. J. Pharm. Biomed. Anal.. 2012;63:80-86.
- [Google Scholar]
- Quantification of polymorphic impurity in an enantiotropic polymorph system using differential scanning calorimetry, X-ray powder diffraction and Raman spectroscopy. Int. J. Pharm.. 2011;415:110-118.
- [Google Scholar]
- Quantification of olanzapine polymorphs using powder X-ray diffraction technique. J. Pharm. Biomed. Anal.. 2007;43:865-872.
- [Google Scholar]
- Quantification of solid-state impurity with powder X-ray diffraction using laboratory source. Powder Diffr.. 2020;35:226-232.
- [Google Scholar]
- Low-temperature polymorphs of lacosamide. J. Cryst. Growth. 2021;562:126085.
- [CrossRef] [Google Scholar]
- Effect of L-alanyl-glycine dipeptide on calcium oxalate crystallization in artificial urine. J. Cryst. Growth. 2021;126176:566-567.
- [Google Scholar]
- Quantitative determination of two polymorphic forms of imatinib mesylate in a drug substance and tablet formulation by X-ray powder diffraction, differential scanning calorimetry and attenuated total reflectance Fourier transform infrared spectroscopy. J. Pharm. Biomed. Anal.. 2015;114:330-340.
- [Google Scholar]
- Quantification of niclosamide polymorphic forms-A comparative study by Raman, NIR and MIR using chemometric techniques. Talanta. 2019;199:679-688.
- [Google Scholar]
- Quantitative analysis of mebendazole polymorphs in pharmaceutical raw materials using near-infrared spectroscopy. J. Pharm. Biomed. Anal.. 2015;115:587-593.
- [Google Scholar]
- Analysing the crystal purity of mebendazole raw material and its stability in a suspension formulation. Int. J. Pharm.. 2008;361:245-250.
- [Google Scholar]
- Quantitative polymorph contaminant analysis in tablets using Raman and near infra-red spectroscopies. J. Pharm. Biomed. Anal.. 2013;72:163-171.
- [Google Scholar]
- Quantitative analysis of sulfathiazole polymorphs in ternary mixtures by attenuated total reflectance infrared, near-infrared and Raman spectroscopy. J. Pharm. Biomed. Anal.. 2010;53:412-420.
- [Google Scholar]
- Simultaneous quantification of three polymorphic forms of carbamazepine in the presence of excipients using Raman spectroscopy. Molecules. 2014;19(9):14128-14138.
- [Google Scholar]
- Crystalline phase transition of ezetimibe in final product, after packing, promoted by the humidity of excipients:monitoring and quantification by Raman spectroscopy. J. Pharm. Biomed. Anal.. 2016;121:209-214.
- [Google Scholar]
- Quantification and handling of nonlinearity in Raman micro-spectrometry of pharmaceuticals. J. Pharm. Biomed. Anal.. 2016;128:236-246.
- [Google Scholar]
- Considerations on the quantitative analysis of apparent amorphicity of milled lactose by Raman spectroscopy. Int. J. Pharm.. 2016;511:488-504.
- [Google Scholar]
- Quantification of gabapentin polymorphs in gabapentin/excipient mixtures using solid state 13C NMR spectroscopy and X-ray powder diffraction. J. Pharm. Biomed. Anal.. 2017;146:29-36.
- [Google Scholar]
- Quantitation of a polymorphic mixture of an active pharmaceutical ingredient with solid state (13)C CPMAS NMR spectroscopy. Int. J. Pharm.. 2010;394:18-25.
- [Google Scholar]
- A THz spectroscopy method for quantifying the degree of crystallinity in freeze-dried gelatin/amino acid mixtures: an application for the development of rapidly disintegrating tablets. Int. J. Pharm.. 2013;455:357-364.
- [Google Scholar]
- Characterization of the solid state: quantitative issues. Adv. Drug Deliv. Rev.. 2001;48(1):67-90.
- [Google Scholar]
- S.N. Campbell-Roberts, A.C. Williams, I.M. Grimsey, S.W. Booth, Quantitative analysis of mannitol polymorphs. X-ray powder diffractometry—exploring preferred orientation effects, J. Pharm. Biomed. Anal. 28(2002)1149-1159.
- Quantifying solid-statemixtures of crystalline indomethacin by raman spectroscopy comparison with thermal analysis. Isrn Chromatography. 2012;2012:1-6.
- [Google Scholar]
- Quantifying ternary mixtures of different solid-state forms of indomethacin by Raman and near-infrared spectroscopy. Eur. J. Pharm. Sci.. 2007;32:182-192.
- [Google Scholar]
- PLS-regression: a basic tool of chemometrics. Chemom. Intell. Lab. Syst.. 2001;58(2):109-130.
- [Google Scholar]
- Calculating amphibole formula from electron microprobe analysis data using a machine learning method based on principal components regression. Lithos. 2020;362-363:105469.
- [CrossRef] [Google Scholar]
- Determination and quantification of kerosene in gasoline by mid-infrared and Raman spectroscopy. J. Mo. Struct.. 2020;1210:127760.
- [CrossRef] [Google Scholar]
- An Overview of Infrared Spectroscopy Based on Continuous Wavelet Transform Combined with Machine Learning Algorithms: Application to Chinese Medicines, Plant Classification, and Cancer Diagnosis. App. Spectrosc. Rev.. 2010;45:148-164.
- [Google Scholar]
Appendix A
Supplementary material
Supplementary data to this article can be found online at https://doi.org/10.1016/j.arabjc.2021.103360.
Appendix A
Supplementary material
The following are the Supplementary data to this article:


