

Translate this page into:
Radiological baseline around the Barakah Nuclear Power Plant, UAE
⁎Corresponding author. alya.arabi@uaeu.ac.ae (Alya A. Arabi)
-
Received: ,
Accepted: ,
This article was originally published by Elsevier and was migrated to Scientific Scholar after the change of Publisher.
Abstract
Destructive and non-destructive analysis techniques were used to establish a radiological baseline around the Barakah Nuclear Power Plant area in Abu Dhabi, United Arab Emirates. The natural radioactivity concentrations of 238U (226Ra), 232Th and 40K were measured for shore, soil and bottom sediment samples, using gamma spectrometry with a high-purity germanium (HPGe) detector. Alpha spectrometry was used to measure the 234U/238U ratio for some selected samples using a silicon surface-barrier detector. The measured gamma activity concentrations in shore samples are much lower compared to those in soil and bottom samples. The average activity concentrations of 238U (226Ra) are 4.43 ± 1.12, 13.54 ± 4.16 and 4.73 ± 3.01 Bq/kg in shore, soil and bottom sediment samples, respectively. The corresponding values for 232Th are 1.68 ± 0.49, 8.31 ± 3.87 and 1.83 ± 1.67 Bq/kg, and those for 40K, are 106.30 ± 50.68, 349.72 ± 107.16 and 105.23 ± 130.14 Bq/kg. The 234U/238U activity ratios span a wide range from 0.59 to 2.24, indicating a system where the daughter/parent is out of secular radioactive equilibrium. The hazard parameters, radium equivalent and absorbed dose rates, showed low levels compared to the world average level reported by the UNSCEAR in 2000. The estimated activity concentrations in this study were lower than the world average values and lower than the levels reported in nearby countries.
Keywords
Radioactivity
Barakah Nuclear Power Plant
Alpha spectroscopy
Gamma spectroscopy
Radium equivalent dose and absorbed dose rates

1 Introduction
The United Arab Emirates (UAE) is constructing a nuclear power plant (with four units to it) at the Barakah site to provide electricity. The UAE’s target is to run the Barakah Nuclear Power Plant (Barakah NPP) with the highest standards of safety, quality and performance. Therefore, establishing a radiological baseline database is mandatory to monitor the variations in the levels of radionuclide activity concentration in the surrounding environment and in the Gulf water.
The Barakah NPP is in the Barakah area, west of the capital, Abu Dhabi. The Barakah NPP is in the western region of the Arabian Gulf (Fig. 1). This is the first nuclear power plant in the MENA region. The first unit, out of the plant’s four units, started operating in 2020. Kuwait and Saudi Arabia are also considering having nuclear aspirations (Uddin et al., 2012) which is expected to impact the radionuclide levels especially in the Arabian Gulf water. During the routine operation of the nuclear facilities, radioactive materials will be released to the environment in different quantities depending on the release points, the integrity of the fuel, the waste management systems, the maintenance and the procedures of operations (UNSCEAR, 2000).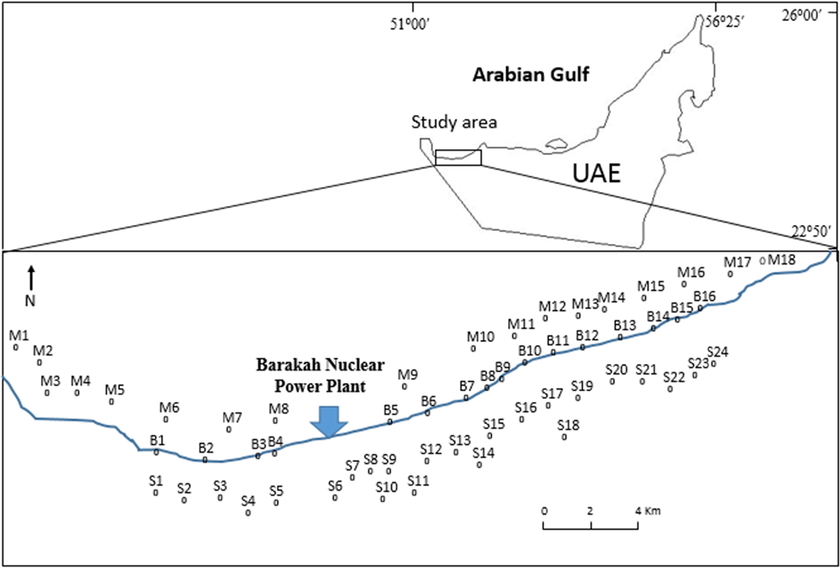
Sampling locations from the Barakah area.
The evaluation of the activity concentrations of radionuclides at the site of any planned nuclear power plant is essential to control both public exposures to radioactive materials and environmental impacts. The global average human exposure to natural sources (cosmic ray, terrestrial gamma-ray, inhalation and ingestion) is 2.4 mSv/yr (UNSCEAR, 2000). It is important to assess the exposure of humans to ionizing radiation which may lead to serious health risks such as acute radiation syndrome and lung diseases (Rowland, 1993). Radioactive contaminations from anthropogenic activities are known to adversely affect human health (Clark, 2002). For instance, some of the 238U daughters namely 226Ra, 214Pb, 214Bi and 210Pb are categorized in class A according to the International Atomic Energy Agency (IAEA), meaning they are radioisotopes associated with the highest risk of toxicity (IAEA, 1963). According to IAEA, the water withdrawal for nuclear facilities operations such as cooling and service will affect socio-economic activities (IAEA, 2012). Nuclear facilities can also be harmful to the environment. Thermal discharges may affect the reproduction, growth and survival of the aquatic life (Abubakar et al., 2015; Paschoa, 2004).
The radioactivity is not limited to anthropogenic activities. According to the World Health Organization (WHO), the naturally existing elements 238U and 232Th as parent series and 40K (Akhtar et al., 2005) have a non-negligible radioactivity (WHO, 1993). The specific levels of natural radioactivity in soil are related to geological and geographical conditions (Dragić and Onjia, 2006). Their distributions in soil is governed by some factors such as weathering, sedimentation and leaching/sorption, which lead to variability in their activity concentrations (Dowdall and O’Dea, 2002). Uranium has three naturally occurring isotopes: 234U, 235U and 238U). The 234U, which has a shorter half-life of 2.45x10⁵ years, is in secular equilibrium in closed systems with the 238U which has a long half-life of 4.47x10⁹ years (Beretka and Mathew, 1985). However, any closed system is disturbed by physico-chemical weathering processes. When rocks become exposed at the Earth's surface, they affect the 234U/238U equilibrium (Aj et al., 1992). Monitoring the 234U/238U activity ratio is an indicator of the origin of uranium, i.e. whether it is natural (from weathering of igneous rocks and ore bodies) or anthropogenic (from industrial activities) (Dresel et al., 2002; Minteer et al., 2007). Differences in 234U/238U ratio can be also used to study the pathway of U applied with fertilizers in agriculture (Zielinski et al., 2000).
The aim of this study is (1) to determine the activity concentrations of gamma-emitting natural radionuclides in shore, soil and bottom sediments around the Barakah NPP, and (2) to determine the 234U and 238U activity ratio, by alpha spectrometry. These measurements, along with the radiological spatial distribution maps of the studied area, will serve as a documented radiological reference for the Barakah area pre-operation of Barakah NPP. This will, in turn, enable the assessment of revealing post-operational radioactive contamination and the evaluation of any associated environmental impact. The radium equivalent and absorbed dose rates have been estimated and compared to the world average values.
2 Sampling and analysis
2.1 Sampling
A total of 58 soil and sediment samples were collected in November 2014. The samples were collected using 25 × 25 × 5 cm3 stainless steel boxes. The samples were collected from various locations around the Barakah area. They were categorized into three subgroups: bottom sediment, shore and soil samples. Eighteen marine sediment samples (M1–M18), referred to as “bottom sediments”, were sampled from three areas: Sila, Barakah and Jebel Dhanna. These samples were collected by grab sampling from the water at a depth of 4–7 m. Sixteen shore samples (B1–B16) were collected along the shoreline, nearby the Barakah NPP. Twenty-four soil samples (S1–S24) were collected from sand dunes to the south of the Barakah NPP. Both shore and soil samples were taken at a depth of 0–0.5 m from the surface. Fig. 1 depicts the locations of the collected samples. The coordinates of all collected samples are provided in Table S1 of the supplementary material. The samples are collected from various zones depending on the distance of sampling points from the Barakah NPP: the restricted zone (radius: 5 km), emergency planning zone (radius: 16 km) and safety zone (radius: 30 km).
2.2 Gamma spectrometry
For low-background radio-analysis, gamma-ray spectrometry (model no. GMX40P4-76) was used. This method is simple, non-destructive and fast, which makes it suitable for collecting data for many radionuclides simultaneously (Ebaid, 2010). Prior to the gamma analysis, all of the samples were placed in a drying oven at 60 °C for 24 h. The samples were then homogenized and sieved using a 2 mm sieve (IAEA, 1989). Samples were weighted (exact masses are available in Table S2 of the supplementary material) and transferred to sealed Marinilli beakers (1L) and left for at least 4 weeks to achieve secular equilibrium between 226Ra and its daughters (NEA-OECD, 1979). Samples were analyzed using HPGe detector (Nuclear lead company, INC) with a relative efficiency of 40%. The detector was calibrated for energy and efficiency using a standard mixture of twelve gamma-emitting radionuclides certified by the National Institute of Science and Technology (NIST). The period of each run, for each of the 58 samples, in the gamma spectrometer is 24 h. The spectrometer was recalibrated after each measurement, where the energetic lines of the 137Cs were confirmed to show at 661.6 keV and those of 60Co show at 1173 and 1332 keV (IAEA, 2007). Background gamma-ray were measured by using empty Marinilli beaker and by acquiring spectra for 24 h.
Estimation of radionuclides activity concentrations and analysis of hazard parameters
The activity of radionuclides (A) was estimated, in Bq/kg, using the following equation: (Beretka and Mathew, 1985; El Assaly, 1981)
Both 238U (226Ra) and 232Th do not have intensive gamma-rays (energy lines). However, they have several daughters which have more intensive lines and activities equal to those of their parents in the state of secular equilibrium (NEA-OECD, 1979). 226Ra values were measured through the emission of the daughters along with their energy line and emission probability (IAEA, 2007): 214Pb (351.9 keV, 35.3%) and 214Bi (609.3 keV, 45.2%, 1120.2 keV, 14.8%, and 1764.5 keV, 15.2%). 232Th was measured through 212Pb (238.6 keV, 43.6%), 208Ti (583.1 keV, 30.6%) and 228Ac (911.2 keV, 29%), while, 40K was measured directly through its emission at 1460.8 keV, 10.7%. 137Cs energy line (661.6 kev) was too weak to be detected in all spectra of all samples, it was thus not considered in the analysis.
The determination of the efficiency, ɛ, for the measured radionuclides involved three steps (IAEA, 2007; Gudelis et al., 2000; Knoll, 2010). First, the experimental efficiency was evaluated using standard radionuclide source with standardized activity concentrations using Eq. (1). The second step entailed constructing the efficiency-fitting curve for the given set of experimental data (energy, efficiency). Finally, the efficiency, ɛ, was determined for the different radionuclides from fit curve equations.
Radium equivalent activity (Raeq), in Bq/kg, is used for the assessment of radiological hazards in the environment. It is used to compare the specific activity of material containing different amounts of 238U, 232Th and 40K. This radium equivalent activity represents a weighted sum of the activities of 238U, 232Th and 40K radionuclides. It is based on the estimation that 1 Bq/kg of 226Ra, 0.7 Bq/kg of 232Th and 13 Bq/kg of 40K produce the same radiation dose rates. It is evaluated using the following equation (Beretka and Mathew, 1985; Tufail, 2012; Ramadan et al., 2018; Mujahid et al., 2008).
UNSCEAR (UNSCEAR, 2000; UNSCEAR, 1988) provided guidelines to measure the absorbed dose rates (abs. dose) (in nGy/h) from gamma radiations in the air at 1 m above the ground surface. This is for the uniform distribution of the naturally occurring radionuclides 238U (226Ra), 232Th and 40K. These UNSCEAR 1988 and 2000 guidelines were used to estimate the absorbed dose rates (UNSCEAR, 2000; UNSCEAR, 1988).
The uncertainties contributing to the results were propagated throughout by adding them all in quadrature combinations. The uncertainties in the readings could be due to sample weights, detector efficiency, geometries, gamma-ray emission probabilities and half-lives.
2.3 Alpha spectrometry
In order to determine the isotopic composition of uranium, alpha spectrometry (model no. 7401VR) was used. Alpha spectrometry is a destructive method for measuring alpha particle emitting radionuclides (Alamelu and Kumar, 2016). Based on the gamma radiation results, the ten samples that had the highest activity concentration of 238U were analyzed using alpha spectrometry in the Egyptian Nuclear and Radiological Regulatory Authority in Cairo, Egypt. Generally, alpha spectrometry is used to measure the concentration of isotopes of Am, Pu and U. It is based on the response of an electronic counting system to an incident alpha particle (Ide et al., 1989). The nuclide of interest was separated from the sample matrix by anion exchange and electroplated on a stainless-steel disc (Gautier et al., 1986). Uranium was separated by Eichrom UTEVA resin (Maxwell III, 2006; Pimble et al., 1992) then electrodeposited on stainless steel disc to complete the measurements by alpha spectrometry. The detailed analytical procedure is provided by Eichrom (https://www.eichrom.com/wp-content/uploads/2018/02/09-mcalister-eichrom-method-and-application-note-updates-rrmc2014-final.pdf). Fig. 2 is a schematic diagram of the procedure followed by Eichrom for the radiochemical separation of uranium in soil. Uranium isotopes (234U, 235U and 238U) were extracted from the soil digestion solution by coprecipitation with calcium phosphate. They were then separated from other actinides and purified using extraction chromatography (Horwitz et al., 1992). To minimize the experimental error, quality assurance was achieved by analyzing samples of known concentration activity from the IAEA and doubly deionized water (DDW) spiked with known activity of 232U.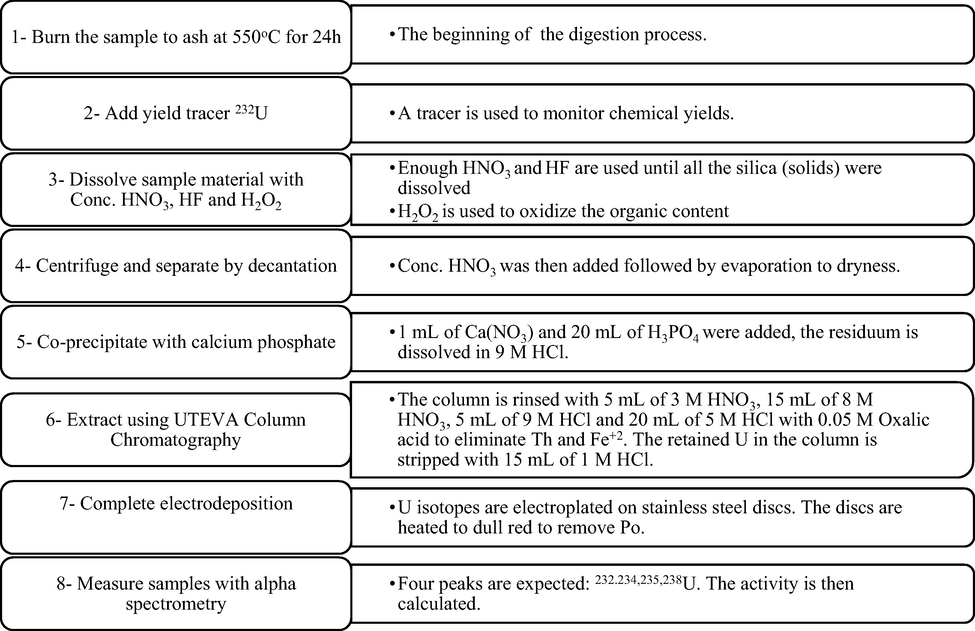
Schematic procedure of soil digestion, uranium separation and alpha spectrometry measurements.
3 Results and discussion
Only one outlier (S11) was detected according to the interquartile range with a multiplier of 3 (3IQR) criteria in SPSS 24.0.0.0. The measured 238U activity concentration in S11 was thus excluded from the rest of the analyses.
3.1 Radionuclide activity concentrations
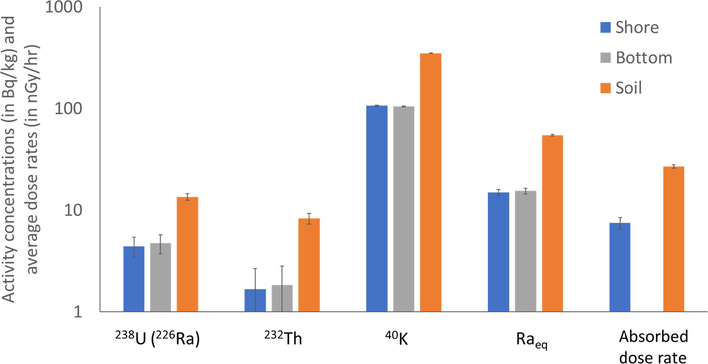
The activity concentrations of radionuclides (in Bq/kg), radium equivalent (in Bq/kg) and absorbed dose rates (in nGy/hr) in the shore, soil and bottom sediment samples are provided in Table S3 of the supplementary material. The statistical analysis of the measured radionuclides is summarized in Table 1 and illustrated in Fig. 3. The average activity concentrations of 238U (226Ra) are 4.43 ± 1.12, 13.54 ± 4.16 and 4.73 ± 3.01 Bq/kg in shore, soil and bottom sediment samples, respectively. The radioactive activity ranking is as follows: shore samples < bottom sediments < soil samples. The activity in the shore samples is much lower than that in soil (see Fig. 3) due to tidal fluctuations and wave currents (Buesseler et al., 2011). All radioactive activities reported lie below the world average threshold (33 Bq/kg) set by UNSCEAR (UNSCEAR, 2000), except in S11 (64.82 Bq/kg) which is already excluded as an outlier. The high activity concentration of 226Ra in S11 is high enough not to be correlated to 238U but rather to the transport of 226Ra from depositional systems to the surface soil (Lidman, 2005; Faure and Mensing, 2005).
238U (226Ra)
232Th
40K
Raeq
abs. dose
Shore
min
3.04 ± 0.58
0.87 ± 0.18
40.71 ± 5.59
7.53 ± 0.97
3.68 ± 0.24
max
6.20 ± 0.51
2.46 ± 0.26
240.91 ± 9.70
27.09 ± 1.29
13.87 ± 0.28
Average
4.43 ± 0.39
1.68 ± 0.17
106.30 ± 7.27
15.01 ± 1.19
7.49 ± 0.31
st. dev
1.12
0.49
50.68
5.19
2.68
Soil
min
5.33 ± 0.25
2.23 ± 0.10
141.35 ± 8.6
19.41 ± 1.05
9.71 ± 0.21
max
22.02 ± 0.52
18.15 ± 0.43
611.16 ± 14.9
110.03 ± 1.98
53.22 ± 0.51
Average
13.54 ± 0.55
8.31 ± 0.23
349.72 ± 11.7
54.50 ± 1.79
26.85 ± 0.44
st. dev
4.16
3.87
107.16
18.31
8.84
Bottom
min
1.24 ± 0.15
0.36 ± 0.05
7.81 ± 2.70
2.60 ± 0.42
NA
max
10.63 ± 0.46
7.29 ± 0.34
544.12 ± 14.8
61.79 ± 2.49
NA
Average
4.73 ± 0.47
1.83 ± 0.24
105.23 ± 10.0
15.44 ± 1.58
NA
st. dev
3.01
1.67
130.14
14.58
NA
Average values of the radiological activities (in Bq/kg) and radium equivalent (in Bq/kg) and absorbed dose rates (in nGy/hr).
The estimated average activity concentrations of 232Th are 1.68 ± 0.49, 8.31 ± 3.87 and 1.83 ± 1.67 Bq/kg in shore, soil and bottom sediment samples, respectively. The activity concentrations of 232Th for all samples are lower than the world average activity concentration (45 Bq/kg, UNSCEAR (2000)). The activity concentrations of 40K show wide variations (high standard deviation values): they range from 40.71 to 240.91 Bq/kg, with an average of 106.30 ± 50.68 Bq/kg in shore; from 141.35 to 611.16 Bq/kg with an average of 349.72 ± 107.16 Bq/kg in soil; and from 7.81 to 544.12 Bq/kg with an average of 105.23 ± 130.14 Bq/kg in bottom sediment samples. The maximum value measured in the bottom sediments is in M17, which is located to the east where Jebel AlDhannah port is located. Apart from the anthropologic factor (harbor activities in this case), the muddy texture of M17 sample could lead to the adsorption of radionuclides in lattice defects or onto crystal and grain boundaries (Baeza et al., 1995).
Activity concentrations are in the following order: 40K > 238U (226Ra) > 232Th in all sampling sites, except for soil samples S19 and S21 where 232Th activity is slightly higher than 238U (226Ra). High 40K activity concentrations in all samples, compared to other radionuclides considered in this study, indicate high percentage of potassium levels that correlate to the high levels of natural K-feldspar which are found in many types of sedimentary rocks (Harvey and Robert, 1996). Despite the wide variations in the activity concentrations of 40K in the studied area, all averages are below the world average value (420 Bq/kg). As shown in Fig. 3, soil samples show the highest activity concentrations. The relatively higher activity concentrations measured in soil samples are likely related to geological factors such as weathering and erosion of the older rocks near the study area (Beretka and Mathew, 1985; Montes et al., 2012). These older rocks are dominated by cross-bedded quartz sandstones, fossiliferous mudstones, cross-bedded carbonate eolianites and evaporites of Late Miocene to Holocene Epoch (Whybrow et al., 1999; Alsharhan and Kendall, 2003). The activity concentrations can also vary with the grain size. In the studied area, the classification was determined as follows: moderately sorted medium sand in shore and soil samples and poorly sorted coarse sand in bottom samples (Al Rashdi et al., 2017). The gamma spectroscopic data from this study do not show 137Cs peaks in the runs of all samples. This result is in good agreement with the insignificant 137Cs activity in the UAE soils according to the global distribution of 137Cs atmospheric nuclear tests fallout (UNSCEAR, 1993).:
The estimated average values of radium equivalent (Raeq) and absorbed dose rates are shown in Table 1 and Fig. 4. The calculated average value of radium equivalent activities in shore, soil and bottom sediment samples are 15.01 ± 5.19, 54.50 ± 18.31 and 15.44 ± 14.58 Bq/kg, respectively. All the values are below the permissible maximum value of 370 Bq/kg reported by the UNSCEAR (2000). As shown in Table 1, the average values of the estimated absorbed dose rates in the shore and soil samples are 7.49 ± 2.68 and 26.85 ± 8.84 nGy/hr, respectively. They are found to be much less than the world average of 57 nGy/hr, as set by the UNSCEAR (2000). The 40K is the major natural radioactivity contributor to the absorbed dose rates.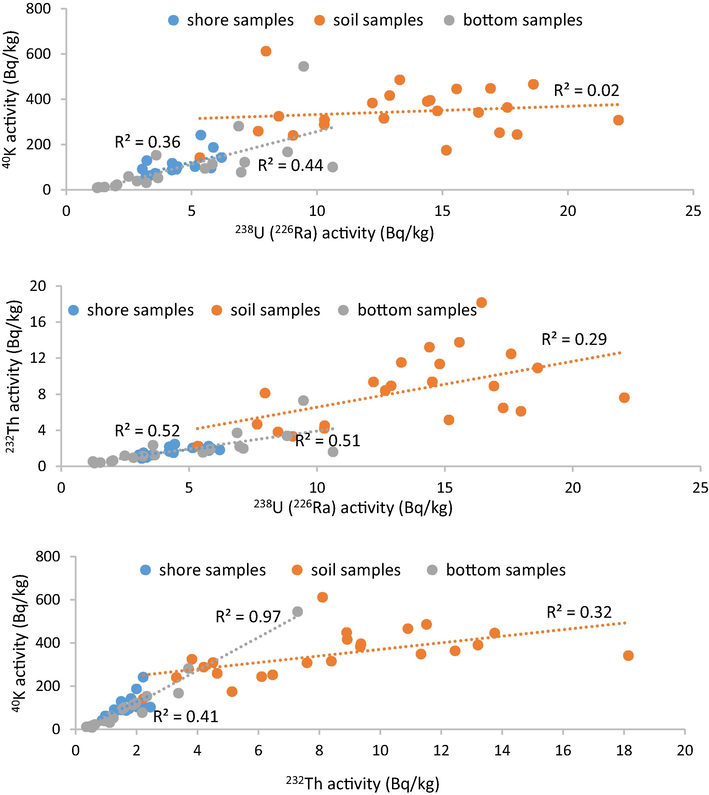
Correlations between 238U (226Ra), 232Th and 40K activities in different environments (shore, soil and bottom).
3.2 234U/238U ratio
Table 2 shows the 234U/238U ratio for ten soil samples, which were selected based on having the highest gamma activity concentrations. The 235U peak was neglected as it was relatively weak compared to the peaks of 234U and 238U. This is because both 234U and 238U emit distinct alpha particles at specific energy levels (4.75 and 4.2 Mev, respectively) while 235U emits mixed energy particles. In addition, the crustal uranium distribution, based on the half-lives of the isotopes, is 48.7% for 234U, 2.27% for 235U and 49.0% for 238U (NNDC, 2011). The small radioactive percentage of 235U resulted in very small peaks, which were not detected by the alpha spectrometer. The 234U/238U activity ratios range from 0.59 to 2.24. In closed systems older than 106 years, 238U decay chain should be at equilibrium where 234U/238U is approximately equal 1 in activity ratio (Holden, 1990; Cheng et al., 2000). The current study is for open systems where the daughter to parent (234U/238U) activity ratio is out of the secular radioactive equilibrium. The depletion of 238U in natural objects is a well-known phenomenon (Rosholt, 1959; Thurber, 1962). Two main factors affect the disequilibrium: (1) the direct recoil of 234Th and its fast decay to 234U near mineral grain boundaries which lead to higher (234U/238U) activity ratios, and (2) the leaching processes of 234U from crystal lattices that are damaged by energetic alpha decay which lead to lower (234U/238U) activity ratios (Andersen et al., 2009; Tokarev et al., 2005). Thus, the observed disequilibrium in the current data can be attributed to chemical and physical geological processes in the area (Peate and Hawkesworth, 2005). The presence of evaporates and carbonates can also cause high 234U/238U ratio disequilibrium due to fractionation from water-rock interactions (Riotte and Chabaux, 1999). Faure and Mensing (Faure and Mensing, 2005) illustrated how uranyl ions (UO22+) tend to form carbonate complexes, thus observable concentrations of 234U would be found in Ca carbonate minerals.
Sample
234U Bq/kg
238U Bq/kg
234U/238U ratio
S7
0.7 ± 0.04
0.5 ± 0.03
1.40 ± 0.12
S9
12.0 ± 0.72
13.0 ± 0.78
0.92 ± 0.08
S5
15.9 ± 0.95
13.4 ± 0.80
1.19 ± 0.10
S11
3.9 ± 0.24
2.2 ± 0.13
1.77 ± 0.15
S16
5.6 ± 0.34
2.5 ± 0.15
2.24 ± 0.19
S17
6.9 ± 0.42
7.0 ± 0.42
0.99 ± 0.08
S20
18.7 ± 1.30
31.5 ± 1.10
0.59 ± 0.05
S23
26.3 ± 1.58
28.0 ± 1.68
0.94 ± 0.08
B12
56.8 ± 3.51
50.7 ± 3.04
1.12 ± 0.10
M11
14.0 ± 0.84
11.3 ± 0.68
1.24 ± 0.11
The correlations between the activities of 238U (226Ra) and 232Th, between 238U (226Ra) and 40K and between 232Th and 40K are depicted in Fig. 4. The degree of correlation between the different radionuclides varies: it is practically non-existent in the soil samples (R2 for the correlation between 238U (226Ra) and 40K is as small as 0.02), there is better correlation in the shore samples (R2 for the correlation between 238U (226Ra) and 232Th is 0.52) and it is best (R2 is close to unity, 0.97, for the correlation between 232Th and 40K) in the bottom sediment samples. These correlations suggest different sources of the radionuclides in the studied samples. Generally, K-bearing minerals such as feldspars and K-salts can be the main supplier of 40K whereas much of 238U is related to carbonate minerals (Faure and Mensing, 2005). The relatively weak or non-existent correlation in the soil samples could be due to the fact that soil particles do not accumulates from a single source (because of the windblowing and diagenetic formation) so their composition is not particularly consistently homogeneous (Speight, 2012). Feldspars are common components of dust particles (sand dunes) (Magill, 2000) while K-salts accumulate in the soil as a result of evaporation (Gornitz, 2008). The rather good correlation between 238U (226Ra) and 232Th in the shore samples is in good agreement with correlations reported on similar deposits in Egypt (Eissa et al., 2010). The relatively good radionuclides correlation values in the shore and bottom samples may be a result of possibly consistent homogeneity of the sources that compose the material, i.e. carbonate from shells and K-salts from seawater evaporation. The coexistence of comparable marine sources for the radionuclides is better illustrated by the relatively strong correlation in the sea bottom sediments.
The values reported in this study are compared with those reported in other studies as shown in Table 3 and Fig. 5. The estimated activity concentrations in this study are close to the values reported by Alali on shore sediments in Abu Dhabi (Alali, 2003). The activity concentrations of radionuclides in shores of UAE (in the Barakah area), China, Oman, Jordan and the Gulf of Aqaba are very low, in fact they are below the world average. However, in Iran and Turkey, the activity concentrations for all radionuclides are elevated. In Iran, the distribution of activity concentrations along the southern coast of the Caspian Sea area exceeded the international limits (Abdi et al., 2009). The high-activity concentrations in Turkey is due to the presence of zircon, allanite, monazite, thorite, uranothorite and apatite (Orgun et al., 2007). The values reported in India are higher only in 234R. All radionuclides show higher activity concentrations in Yemen due to the geologic structure of the Juban area which is located near granite and gneiss rocks. The radionuclide activity concentrations of 238U of the Red Sea are higher than the world average.
References
Location
238U (226Ra)
232Th
40K
Shore
This study (shore samples)
UAE
4
2
106
(Alali, 2003)
UAE
26
5
219
(Lu and Zhang, 2008)
China
12
15
1079
(Abdi et al., 2009)
Iran
177
117
1085
(Al-Trabulsy et al., 2011)
Aqaba
11
23
641
(Orgun et al., 2007)
Turkey
290
532
1161
Soil
This study (soil samples)
UAE
14
8
350
(Kannan et al., 2002)
India
16
119
406
(Saleh, 2012)
Oman
14
10
158
(Abd El-mageed et al., 2011)
Yemen
44
58
823
(Ahmad et al., 1997)
Jordan
10
20
89
Bottom
This study (Bottom sediments)
UAE
5
2
105
(Ababneh et al., 2010)
Aqaba
3
1
3
(Al-Zahrany et al., 2012)
Red Sea
35
1
34
Worldwide average (UNSCEAR, 2000)
Worldwide
33
45
420
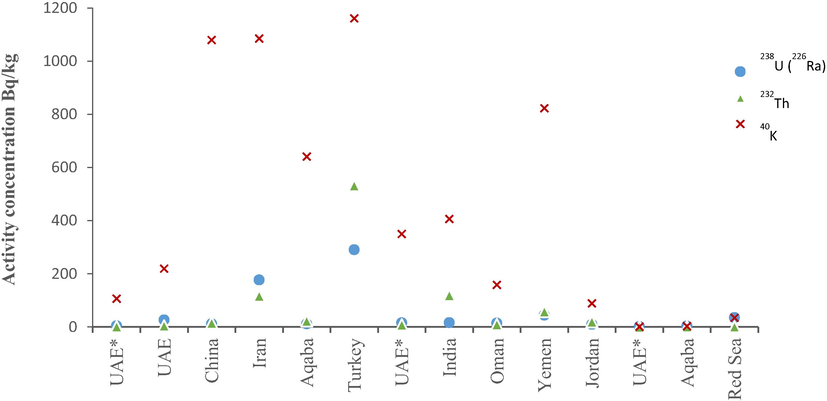
International and regional values of radionuclide activity concentrations (in Bq/kg). The UAE* label indicates average values from the shore, soil and bottom sediment samples collected in this study.
Fig. 6 depicts spatial distribution radiological maps of the measured radiological activities and radium equivalent in the studied area. The maps were plotted using Arcmap 10 with the kernel smoothing interpolation method. With the exception of the uranium map, higher activity concentrations are shown in the east and the south parts. The activity concentrations decrease from the south to the north. The highest activity concentrations of radionuclides are observed in the south towards the sampling area. The north and west areas of the maps show the lowest activity concentrations of both shore and bottom sediment samples. Tidal fluctuations and wave currents effectively lower the activity concentrations of radionuclides in shore sediments (Buesseler et al., 2011). That is indicated in the low measured values in the current study.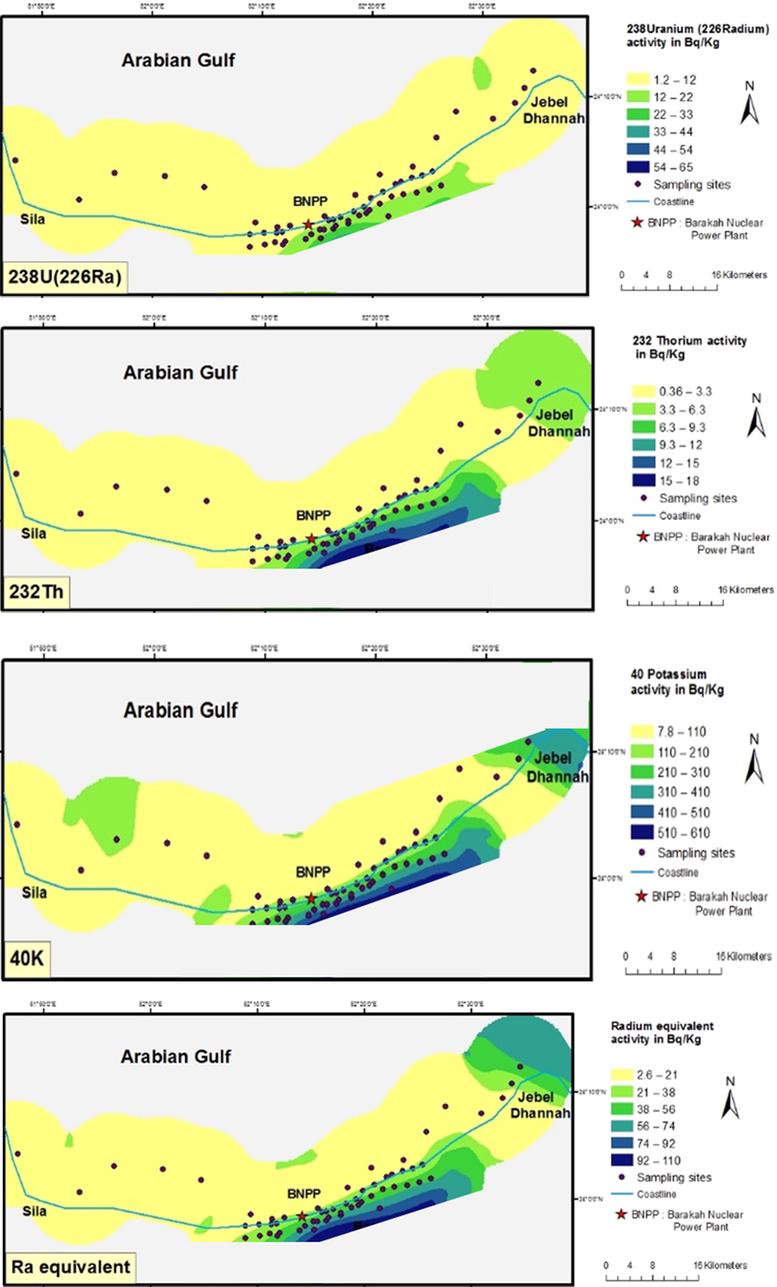
Spatial distribution maps of the radionuclide activities of 238U (226Ra), 232Th and 40K (in Bq/kg) and the Raeq (in Bq/kg) around the Barakah NPP.
4 Conclusions
A baseline study was conducted on shore, soil and bottom sediments around the Barakah Nuclear Power Plant in UAE. The natural radioactivity of 238U (226Ra), 232Th and 40K was measured using gamma spectrometry with an HPGe detector. The concentration activities in the Barakah NPP area are below the world average values, and so are the radium equivalent and absorbed dose rates. The existing concentration activities are attributed to natural levels as there was no evidence of anthropogenic influence. No anthropogenic radionuclides 137Cs have been detected in the studied area. The 234U/238U ratio measured by alpha spectrometry showed a wide range of values. This indicates that the area is not a closed system and there is disequilibrium between 234U and 238U attributed to geological factors.
Acknowledgements
The authors are grateful to the College of Graduate Studies at the United Arab Emirates University, UAEU, for covering all the costs associated with this research project.
Availability of data and materials
“All data generated or analysed during this study are included in this published article [and its supplementary information files]”.
Code availability
Not applicable.
Authors' contributions
MAR completed the measurements in the lab and participated in the data analysis and writing the paper. WEM contributed to data analysis and in reviewing the paper. SA and MET collected the samples, facilitated the work in the UAE lab and in Egypt, and reviewed the manuscript. AAA participated in the data analysis and in writing the paper. All authors read and approved the final manuscript.
Declaration of Competing Interest
The authors declare that they have no known competing financial interests or personal relationships that could have appeared to influence the work reported in this paper.
References
- Assessment of gamma-emitting radionuclides in sediment cores from the gulf of Aqaba, Red Sea. Radiat. Protect. Dosim.. 2010;141(3):289-298.
- [CrossRef] [Google Scholar]
- Assessment of natural and anthropogenic radioactivity levels in rocks and soils in the environments of Juban town in Yemen. Radiat. Phys. Chem.. 2011;80(6):710-715.
- [CrossRef] [Google Scholar]
- 238U, 232Th, 40K and 137Cs activity concentrations along the southern coast of the Caspian Sea, Iran. Mar. Pollut. Bull.. 2009;58(5):658-662.
- [CrossRef] [Google Scholar]
- Assessment of potential human health and environmental impacts of a nuclear power plant (NPP) based on atmospheric dispersion modeling. Atmósfera. 2015;28:13-26.
- [CrossRef] [Google Scholar]
- Measurement of natural radioactivity in Jordanian sand. Radiat. Meas.. 1997;28(1–6):341-344.
- [CrossRef] [Google Scholar]
- Uranium series disequilibrium in river sediments and waters: the significance of anomalous activity ratios. Appl. Geochem.. 1992;7:101-110. ISSN 0883-2927
- [CrossRef] [Google Scholar]
- Natural environmental radioactivity and estimation of radiation exposure from saline soils. Int. J. Environ. Sci. Technol.. 2005;1(4):279-285.
- [CrossRef] [Google Scholar]
- Distribution of heavy metals around the Barakah nuclear power plant in the United Arab Emirates. Environ. Sci. Pollut. Res.. 2017;24(24):19835-19851.
- [CrossRef] [Google Scholar]
- Natural radioactivity measurement in beach sand for UAE coastal areas. UAEU; 2003. Master thesis
- Determination of isotopic composition of uranium samples using alpha spectrometry. J. Radioanal. Nucl. Chem.. 2016;310(2):541-546.
- [CrossRef] [Google Scholar]
- Holocene coastal carbonates and evaporites of the southern Arabian Gulf and their ancient analogues. Earth Sci. Rev.. 2003;61(3-4):191-243.
- [CrossRef] [Google Scholar]
- Radioactivity levels and radiological hazard indices at the Saudi coastline of the Gulf of Aqaba. Radiat. Phys. Chem.. 2011;80(3):343-348.
- [CrossRef] [Google Scholar]
- Distribution of naturally occurring radioactivity and 137Cs in the marine sediment of Farasan Island, southern Red Sea, Saudi Arabia. Radiat. Protect. Dosim.. 2012;152(1–3):135-139.
- [CrossRef] [Google Scholar]
- Experimental evidence for 234U–238U fractionation during granite weathering with implications for 234U/238U in natural waters. Geochim. Cosmochim. Acta. 2009;73(14):4124-4141.
- [CrossRef] [Google Scholar]
- Influence of geology and soil particle size on the surface area/volume activity ratio for natural radionuclides. J. Radioanal. Nucl. Chem.. 1995;189(2):289-299.
- [CrossRef] [Google Scholar]
- Natural Radioactivity of Australian Building materials, industrial waste and by product. Health. Phys.. 1985;48:87-95.
- [CrossRef] [Google Scholar]
- Impacts of the Fukushima Nuclear Power Plants on Marine Radioactivity. Environ. Sci. Technol.. 2011;45(23):9931-9935.
- [CrossRef] [Google Scholar]
- The half-lives of uranium-234 and thorium-230. Chem. Geol.. 2000;169(1–2):17-33.
- [CrossRef] [Google Scholar]
- Marine Pollution (fifth ed.). Oxford University Press; 2002. ISBN 978-87-403-0540-1
- Ra226/U238 disequilibrium in an upland organic soil exhibiting elevated natural radioactivity. J. Environ. Radioact.. 2002;59(1):91-104.
- [CrossRef] [Google Scholar]
- Classification of soil samples according to their geographic origin using gamma-ray spectrometry and principal component analysis. J. Environ. Radioact.. 2006;89:150-158.
- [CrossRef] [Google Scholar]
- Dresel, E., Evans, J., Farmer, O., 2002. Investigation of Isotopic Signatures for Sources of water Contamination at the Hanford. Site Prepared for the U.S. Department of Energy under ContractDE-AC06-76RL01830. http://www.pnl.gov/main/publications/external/technical_reports/pnnl-13763.pdf.
- Use of Gamma ray spectrometry for uranium isotopic analysis in environmental samples. Rom. Journ. Phys.. 2010;55:69-74.
- [Google Scholar]
- Radiation dose estimation of sand samples collected from different Egyptian beaches. Radiat. Prot. Dosim.. 2010;147:533-540.
- [CrossRef] [Google Scholar]
- El Assaly, F.M., 1981 Methods of calibrating a gamma spectrometer for qualitative and quantitative analysis of low-level radioactivity in geological and environmental samples (IAEA-SM-252/44). In: Proceedings on an international symposium in methods of low level counting and spectrometry organized by IAEA, Berlin, pp. 41–58. ISBN 92-0-030081-2.
- Isotopes: Principles and Applications (third ed.). New Jersey: John Willy and Sons Inc, Hoboken; 2005. p. :503. ISBN: 978-0-471-38437-3
- Gautier, M.A., Gladney, E.S., 1986. Health and Environmental data management and quality assurance: Los Alamos, “Los Alamos National Laboratory report LA-10300-MS, vols. I and II.
- Encyclopedia of Paleoclimatology and Ancient Environments. Springer Science & Business Media; 2008. p. :322.
- Efficiency calibration of HPGe detectors for measuring environmental samples. Environ. Chem. Phys.. 2000;22(3/4):l:17-125.
- [Google Scholar]
- Petrology (second ed.). Freeman; 1996. p. :206-210. ISBN 0-7167-2438-3
- Total half-lives for selected nuclides. Pure Appl. Chem.. 1990;62(5):941-958.
- [CrossRef] [Google Scholar]
- Separation and preconcentration of uranium from acidic media by extraction chromatography. Anal. Chim. Acta. 1992;266(1):25-37.
- [CrossRef] [Google Scholar]
- A basic toxicity classification of radionuclides. In: IAEA Technical Report Series No.15. Vienna, Austria: International Atomic Energy; 1963.
- [Google Scholar]
- IAEA (International Atomic Energy Agency), 1989 Measurement of radionuclides in food and environmental samples. Vienna, Austria.
- IAEA (International Atomic Energy Agency), 2007. Update of X Ray ad Gamma Ray decay data standards for detector calibration and other applications. Volume (1), Vienna, Austria.
- IAEA (International Atomic Energy Agency), 2012. Efficient water management in water cooled reactors. Vienna, Austria
- Bioassay alpha spectrometry: energy resolution as a function of sample source preparation and counting geometry. Health Phys.. 1989;56(1):71-77.
- [Google Scholar]
- Distribution of natural and anthropogenic radionuclides in soil and beach sand samples of Kalpakkam (India) using hyper pure germanium (HPGe) gamma ray spectrometry. Appl. Radiat. Isot.. 2002;57(1):109-119.
- [CrossRef] [Google Scholar]
- Radiation Detection and Measurement (fourth ed.). USA: Wiley; 2010. p. :860. ISBN: 978-0-470-13148-0
- Lidman, F., 2005. Isotopic Disequilibrium for Assessment of Radionuclide Transport in Peat Lands. Department of Physics, Uppsala University. UPTEC W 05 019, ISSN 1401-5765.
- Measurement of natural radioactivity in beach sands from Rizhao bathing beach, China. Radiat. Protect. Dosim.. 2008;130(3):385-388.
- [CrossRef] [Google Scholar]
- Magill's Survey of Science: Physical properties of rocks. Salem Press; 2000. p. :2254.
- Rapid column extraction method for actinides and 89/90Sr in water samples. J. Radioanal. Nucl. Chem.. 2006;267
- [CrossRef] [Google Scholar]
- Reliability of using 235U/238U and 234U/238U ratios from alpha spectrometry as qualitative indicators of enriched uranium contamination. Health Phys.. 2007;92:488-495.
- [CrossRef] [Google Scholar]
- Assessment of natural radioactivity levels and their relationship with soil characteristics in undisturbed soils of the northeast of Buenos Aires province, Argentina. J. Environ. Radioact.. 2012;105:30-39.
- [CrossRef] [Google Scholar]
- Measurements of natural radioactivity and radon exhalation rates from different brands of cement used in Pakistan. Radiat. Prot. Dosim.. 2008;130:206-212.
- [CrossRef] [Google Scholar]
- NEA-OECD, 1979. Nuclear Energy Agency. Exposure to Radiation from Natural Radioactivity in Building Materials. Report by NEA Group of Experts. OECD, Paris.
- NNDC (National Nuclear Data Center), 2011. Brookhaven National Laboratory, “Nuclear Decay Data (NuDat)”. Decay Radiation Data, NuDat 2.5. http://www.nndc.bnl.gov/nudat2/.
- Natural and anthropogenic radionuclides in rocks and beach sands from Ezine region (Canakkale), Western Anatolia, Turkey. Appl. Radiat. Isot.. 2007;65(6):739-747.
- [CrossRef] [Google Scholar]
- Paschoa, A. 2004 Environmental effects of nuclear power generation, in Interactions:Energy/Environment. In: Goldemberg, Jose (Ed.), Encyclopedia of Life Support Systems (EOLSS), Developed under the Auspices of the UNESCO. Eolss Publishers, Oxford, UK. http://www.eolss.net.
- U series disequilibria: Insights into mantle melting and the timescales of magma differentiation. Rev. Geophys.. 2005;43(1):1-43.
- [CrossRef] [Google Scholar]
- Optimization of a radioanalytical procedure of the determination of uranium isotopes in environmental samples. J. Radioanal. Nucl. Chem. Art.. 1992;161:434-441.
- [CrossRef] [Google Scholar]
- Assessment of Natural Radioactivity and Some Heavy Metals Contamination along Aqaba Gulf, Egypt. J. Eng. Sci.. 2018;7
- [Google Scholar]
- 234U/238U) activity ratios in freshwaters as tracers of hydrological processes: the Strengbach watershed (Vosges, France. Geochim. Cosmochim. Acta. 1999;63(9):1263-1275.
- [CrossRef] [Google Scholar]
- Natural radioactive disequilibrium of the Uran serie. US Geol. Surv Bull; 1959. p. :1084-1089.
- Low-level radium retention by human body; a modification of ICRP publication 20 retention equation. Health Phys.. 1993;65:507-513.
- [CrossRef] [Google Scholar]
- Radioactivity of 238U, 232Th, 40K, and 137Cs and assessment of depleted uranium in soil of the Musandam Peninsula, Sultanate of Oman. Turk. J. Eng. Environ. Sci.. 2012;36(3):236-248.
- [CrossRef] [Google Scholar]
- The Chemistry and Technology of Coal (third ed.). James.CRC Press; 2012. p. :203.
- Origin of high 234U/238U ratio in post-permafrost aquifers. In: Merkel B.J., Hasche-Berger A., eds. Uranium in the Environment, mining impact and consequences. New York: Springer; 2005. p. :874-1856.
- [CrossRef] [Google Scholar]
- Radium equivalent activity in the light of UNSCEAR report. Environ. Monit. Assess.. 2012;184(9):5663-5667.
- [CrossRef] [Google Scholar]
- Concentration of selected radionuclides in seawater from Kuwait. Mar. Pollut. Bull.. 2012;64(6):1261-1264.
- [CrossRef] [Google Scholar]
- UNSCEAR (United Nations Scientific Committee on the Effect of Atomic Radiation), 1993. Report to the general assembly .Annex B: Exposures from man-made sources of radiation.
- UNSCEAR (United Nations Scientific Committee on the Effects of Atomic Radiation), 1988. Sources, effect and risk of ionising radiation. United Nations, New York.
- UNSCEAR (United Nations Scientific Committee on the Effects of Atomic Radiation), 2000. Effects of atomic radiation to the general assembly, United Nations, New York.
- Guidelines for drinking water quality. Geneva: Recommendation; 1993.
- Local stratigraphy of the Neogene Outcrops of the Western Coastal Region of the Emirate of Abu Dhabi. In: InProceedings of the International Conference on the Fossil Vertebrates of Arabia. 1999. p. :65-70.
- [Google Scholar]
- Use of 234U and 238U isotopes to identify fertiliser-derived U in the Florida Everglades. Appl. Geochem.. 2000;12:369-383.
- [Google Scholar]
Appendix A
Supplementary data
Supplementary data to this article can be found online at https://doi.org/10.1016/j.arabjc.2021.103125.
Appendix A
Supplementary data
The following are the Supplementary data to this article:


