

Translate this page into:
Screening for the extracorporeal coagulation activity quality markers (Q-markers) of dried and stir fried ginger
⁎Corresponding authors. 591940167@qq.com (Yanquan Han), hyquan2003@163.com (Yan Hong)
-
Received: ,
Accepted: ,
This article was originally published by Elsevier and was migrated to Scientific Scholar after the change of Publisher.
Abstract
Ginger is a common condiment that is widely used as Chinese medicine in China and Southeast Asia. Dried ginger and stir fried ginger are two common processed products of ginger, with distinct clinical uses. The aim of this study was to identify the chemical components (quality markers, Q-mark) responsible for the differences in in vitro hemostatic activity between dried and stir fried ginger and to provide a basis for the selection between the two types of ginger in clinical application. In this study, methanolic extracts of dried and stir fried ginger were characterized using UPLC-Q/TOF-MS and then evaluated for in vitro coagulation activity. Spectral effect correlation analysis was used to identify quality markers, while molecular docking simulation was used to evaluate the binding energy between potential active compounds and target proteins. A total of 49 chemical constituents of the ginger extracts were identified using UPLC-Q/TOF-MS, 27 of which were significantly different between the two extracts. A fingerprint of 18 batches of dried and stir fried ginger established that zingiberone, 6-gingerol, 8-gingerol, 6-shogaol, 10-gingerol, 8-shogaol, and 10-shogaol were common constituents of the two extracts. Results of coagulation assays revealed that dried ginger had anti-coagulation effects, while stir fried ginger had hemostatic effect. Zingiberone, 6-shogaol and 10-shogaol were identified as the active components responsible for the hemostatic effect of Stir fried ginger through multivariate statistical analysis. In addition, molecular docking simulations suggested that these three components bound to Src proteins on platelets. Consequently, 6-gingerol, zingiberone, 6-shogaol and 10-shogaol were selected as quality markers to distinguish between dried and stir fried ginger. These results provide scientific evidence for the establishment of a quality evaluation system for the integrity and specificity of dried and stir fried ginger.
Keywords
Dried ginger
Stir fried ginger
UPLC-Q/TOF-MS
Spectrum-effect correlation
Q-markers

1 Introduction
The processing of traditional Chinese medicine (TCM) is a common practice, and usually occurs before most of the herbs are prescribed. Depending on the desired therapeutic effect, Chinese herbs can be processed using various methods, such as stir-frying with sand or oil, baking and steaming with vinegar or rice wine. The main purpose of processing the herbs is to increase the potency, reduce the toxicity, and alter the therapeutic effects (Zhao et al., 2010, Ghasemzadeh et al., 2018). Most processed products of TCM have low levels of complex components that are difficult to detect accurately. In most cases, the composition of raw and processed products is similar, with the main difference being the amount of the individual components present (Ma et al., 2018; Wang et al., 2020a). It is important to determine the difference in composition between the raw products and the processed products, and investigate how these differences affect the therapeutic effects of the products. The chemical compounds that determine therapeutic effects can then be used as markers of drug quality. The identification of these markers can help improve the quality control assessment of Chinese medicine, a field that is currently underdeveloped (Kang et al., 2019, Feng et al., 2018).
Ginger (Zingiber officinale Rose.) is a perennial herb from the Zingiberaceae family and its dried rhizomes are known to have many medicinal properties. The chemical composition of dried ginger is complex and mainly includes volatile oils, gingerol, and diarylheptanoids (Liu et al., 2019; Semwal et al., 2015). Literature review shows that dried ginger has immunomodulatory, anti-tumor, analgesic and antioxidant effects (Mahluji et al., 2013, Kubra and Rao, 2021, Mashhadi et al., 2013, Saleh et al., 2018). Stir-fried ginger is prepared by stir-frying dried ginger with sand at high temperatures. Practitioners of Chinese medicine believe that stir-frying of dried ginger with sand at high temperature strengthens its gastrointestinal-warming and hemostatic activities. Ginger processed in this way is used in the treatment of deficiency cold bleeding syndrome. Studies have shown that the chemical composition of dried ginger changes after processing, with some chemical components decreasing or disappearing, while new components are produced (Li et al., 2016). The change in the chemical composition of stir fried ginger could be responsible for its hemostatic activity. The methods used to evaluate the quality of stir-fried ginger are not comprehensive since they largely depend on the detection of 6-gingerol (The State Pharmacopoeia Commision of PR China 2020). Dried ginger also contains 6-gingerol, yet it has different therapeutic effects compared to stir-fried ginger. As a result, 6-gingerol cannot be used to evaluate the quality of dried and stir-fried ginger effectively. Therefore, the analysis of the chemical composition of herbs as well as the discrimination between the crude and processed herbs, is still a challenge. The purpose of this study is to establish the correlation between these chemical components and the efficacy of dried ginger before and after processing. According to the differences of chemical components and different curative effects between dried ginger and processed products, identify the quality marker components that can be used to distinguish dried ginger and processed ginger, and hope that these identified quality marker components can help to improve the quality control evaluation of dried ginger and processed ginger. In addition, the methods used in this study can also provide a reference for quality markers of other raw products and processed products. We analyzed and determined the chemical composition of dried and stir-fried ginger using UPLC-Q/TOF-MS. We then used in vitro coagulation activity assays to assess the difference in hemostatic efficacy between dried and stir fried ginger obtained from different regions. Thereafter, we carried out correlation analysis between the chemical composition of the ginger extracts and their biological effects on hemostatic activity using OPLS-DA. The results of OPLS-DA were verified using Pearson correlation analysis and molecular docking simulations. The aim was to identify the main components associated with hemostatic activity that showed differences in composition between processed and unprocessed dried ginger, the schematic diagram is shown in Fig. 1. We believe that these components can be used as quality markers, to ensure safe and effective processing of TCM products.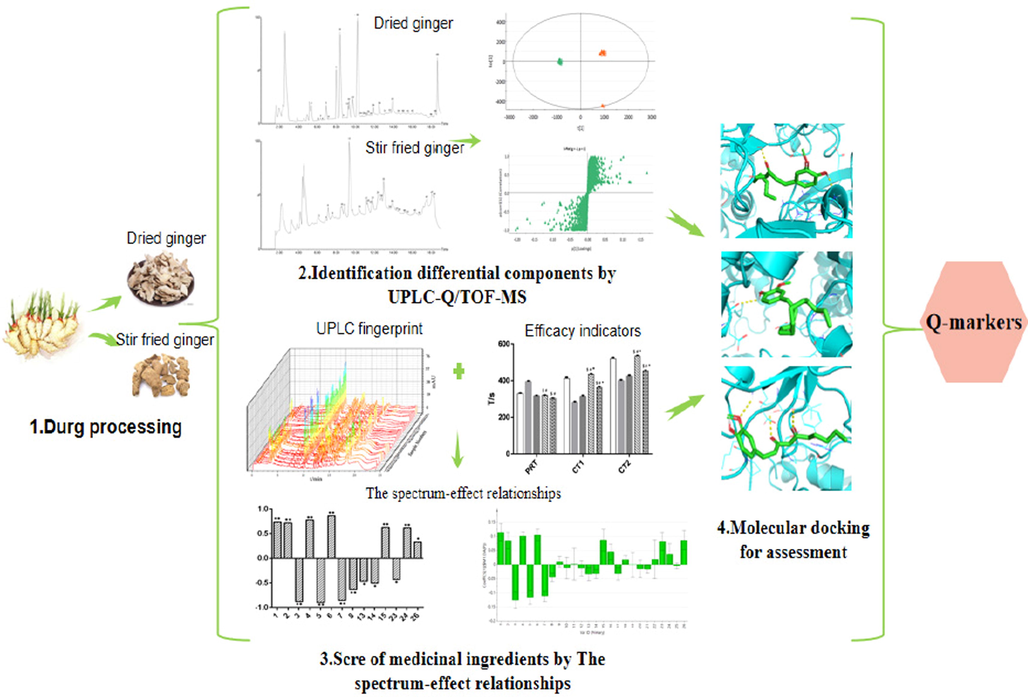
The schematic diagram of screening Q-markers of Dried and Stir fried ginger.
2 Materials and methods
2.1 Chemicals and materials
Eighteen batches of dried ginger samples (S1-S18) were collected from various production areas, and their origins are shown in Additional file 1 (Table S1). The materials were authenticated by Prof. Dong-mei Xie (Anhui University of Chinese Medicine, Hefei, Anhui, China). Reference standards of zingiberone, 6-Gingerol, 8-Gingerol, 10-Gingerol, 6-Shogaol, 8-Shogaol and 10-Shogaol with 98 % purity on the basis of UPLC analysis were supplied by Chengdu Desite Bio-Technology (Chengdu, China). HPLC-grade acetonitrile was obtained from TEDIA Co. (OH, USA), while HPLC-grade methanol was obtained from Sigma-Aldrich Co. (Shanghai, China).
2.2 Animal handing
Healthy male New Zealand rabbits weighing 2.5 ± 0.2 kg were housed at the Experimental Animal Center of The First Affiliated Hospital of Anhui University of Chinese Medicine. The animals were acclimatized to their environment for 7 days before the study begun. The temperature and humidity of the environment was controlled at 25 ± 2 °C and 35%-40%, respectively. All the experiments were approved by national legislation of China and the experimental procedure was approved by the Animal Ethics Committee of Anhui University of Chinese Medicine.
2.3 Preparation of sample and standard solution
Dried ginger is flat block, with finger-like branching, Solid texture, the surface is grayish yellow or light grayish brown, with longitudinal wrinkles and obvious rings. Stir fried ginger was prepared according to the processing method described in the Chinese Pharmacopeia Commission. Briefly, dried ginger was stir-fried with sand at a ratio of 1:10 at 208 °C for 7 min until it turned plump and brown. Stir fried ginger is irregularly inflated block with finger branches. Light texture, and brown-black or tan in surface.
Sample solutions were prepared by mixing 0.5 g of dried or stir fried ginger powder with 20 mL methanol. Methanolic extracts were prepared by subjecting the solutions to a 40 kHz ultrasonic wave for 30 min. Thereafter, the solutions were filtered and the filtrate retained for UPLC-Q/TOF-MS and UPLC.
The reference standards for zingiberone, 6-gingerol, 8-gingerol, 10-gingerol, 6-shogaol, 8-shogaol and 10-shogaol were weighed and dissolved in methanol to prepare stock solutions for UPLC fingerprint detection.
2.4 Conditions for UPLC-Q/TOF-MS
UPLC was performed using a Waters Acquity UPLC system (Waters Corp., MA, USA), equipped with Acquity quaternary solvent manager system, vacuum degases, quaternary pump autosampler, thermostatted column compartment and Waters Xevo G2 Q/TOF-MS. The column was Waters Acquity BEH C18 (2.1 mm × 100 mm, 1.7 μm). The mobile phases consisted of acetonitrile containing (phase A) and water (phase B) at a flow-rate of 0.2 mL/min. The UPLC gradient eluting condition was described as follows: 0–10 min, 25–75 % A; 10–15 min, 75 % A; 15–16.5 min, 75–100 % A; 16.5–19 min, 100 % A; 19–20 min, 100–25 % A. The column was maintained at 30 °C and the injection volume was 2 μL. The ESI source conditions were as follows: capillary voltage, 3.0 KV at ESI+ and 2.5 KV at ESI−; Sampling Cone was 30 V; Collision energy 30 eV;source temperature was 130 °C; cone gas glow was 50 L/h; desolvation gas flow was 500 L/h at 350 °C. All data in the centroid mode were acquired using Masslynx V4.1 software (Waters Corp., Milford, MA, USA).
2.5 Conditions for UPLC-PDA
UPLC fingerprints were recorded using a Waters Acquity UPLC H-Class liquid chromatography system (Waters, USA). Samples were separated on a Waters Acquity UPLC BEH C18 column (2.1 mm × 100 mm, 1.7 μm) at 30 °C using a mobile phase consisting of solvent A (acetonitrile) and solvent B (water). The UPLC gradient eluting conditions were as follows: 0–10 min, 3–85 % A; 10–15 min, 85–100 % A; 15–18 min, 100 % A; 18–20 min, 100–97 % A, and then maintained for 2 min. The flow rate was 0.25 mL/min. The effluent was monitored at a wavelength of 280 nm and the sample injection volume was 2 μL (Li et al., 2016).
2.6 In vitro assessment of hemostatic activity
2.6.1 Preparation of sample and positive control solutions
About 20 g of each batch of dried and stir-fried ginger was added separately to 200 mL of methanol. Methanolic extracts were then prepared by subjecting the solutions to a 40 kHz ultrasonic wave for 30 min, followed by filtration using gauzes. Thereafter, the residues were collected, and the extraction was repeated. After two rounds of extraction, the filtrates were combined and the solvent was removed by evaporation using a 90 °C water bath at room temperature until it became a dry paste. Each methanolic extract was mixed with deionized water (DI water) to make 10 mg/mL solution, and filtered using a disposable filter membrane to obtain a clear sample solution for hemostasis assay.
One positive control was prepared by mixing 0.1 g tranexamic acid with DI water to form a 10 mg/mL solution (Control 1). The other positive control was a methanolic extract of 20 g Panax notoginseng powder that was prepared in the same way as the sample solutions to give a 10 mg/mL solution (Control 2).
2.6.2 In vitro assay of plasma recalcification time
The in vitro assay of plasma recalcification time was carried out using a modified protocol of a previously described method (Zhou et al., 2019). Briefly, fresh rabbit blood was mixed with 3.8 % sodium citrate (citrate/blood: 1/9, v/v) and then centrifuged at 2500 rpm for 15 min. The supernatant obtained was used as platelet-rich plasma (PRP). Afterwards, 0.1 mL of each sample solution (10 mg/mL in DI water) was added to 0.1 mL PRP, and the mixture incubated for 1 min at 37 °C. DI water was used as the blank, while tranexamic acid solution (10 mg/mL in DI water) and Panax notoginseng solution (10 mg/mL in DI water) were used as the positive controls. The plasma recalcification time (PRT, the time taken for visible clot formation) was recorded once a clot was observed after the addition of 0.1 mL CaCl2 (2.775 g/L). Each experiment was repeated 6 times.
2.6.3 In vitro assay of clotting time (test tube method)
Mixtures of sample solutions and CaCl2 (2.775 g/L) (0.2 mL) were added to test tubes, and then 0.5 mL anticoagulant blood was added simultaneously to each tube. Panax notoginseng solution and tranexamic acid solution were used as positive controls. The tubes were gently tilted every 30 s to observe coagulation. Coagulation time (CT1) was the time taken for a clot to solidify at the bottom of the tube without flowing after the addition of anticoagulant blood. Each experiment was repeated 6 times.
2.6.4 In vitro assay of clotting time (Coagulation plate method)
The coagulation plate was placed in a water bath at a constant temperature of 37 °C. A mixture of sample solution and CaCl2 (2.775 g/L) (0.2 mL) was then added to each well, and the solution mixed with a needle. Panax notoginseng and tranexamic acid solutions were used as positive controls. Every 30 s with a needle through the blood gently pick, when the pin to push the clot and exposed the bottom of the clot count as complete coagulation of the blood. The coagulation time (CT2) was counted from the addition of anticoagulant blood to the complete coagulation of blood. Each experiment was repeated 6 times.
2.7 Statistical analysis and correlation analysis
The data were expressed as mean ± standard deviation. All statistical analysis was carried out using SPSS 20.0. Difference between means was assessed using one-way analysis of variance (ANOVA) followed by the LSD test for multiple group comparisons. Differences with p-values lower than 0.05 or 0.01 were considered statistically significant.
Correlation analysis is a statistical method used for quantification of linear relationships between two multidimensional variables. In this study, we carried out correlation analysis using peaks from chromatographic fingerprints and pharmacodynamic effects of TCM as variables (Li Y et al 2020). SPSS 20.0 software system and SIMCA 13.0.3 software were used for Pearson correlation analysis and PLSR correlation analysis, respectively. Shortening of clotting time (SCT) was used as an indicator of efficacy of hemostatic activity and was calculated from the following equation:
2.8 Establishment of molecular docking model
To determine the correlation between chemical composition and hemostasis, we analyzed the Swiss Target Prediction database (https://www.swisstargetprediction.ch/) and GeneCards database (https://www.genecards.org/) to obtain targets of the compounds and bleeding diseases. The intersection between component targets and the disease target was established using the Wayne diagram. In this way, the targets of chemicals acting on the disease were obtained. The identified protein targets were uploaded to the STRING database (https://string-db.org/). The core targets were selected based on the maximum values of Degree and Betweenness Centrality and the confidence score was set to high confidence “0.9″.
The docking simulation was carried out according to the following steps. First, the 3D structure of the ligand compound was downloaded using Explore Chemistry (https://pubchem.ncbi.nlm.nih.gov). Secondly, the structure file of the target protein was downloaded from the RCSB (https://www.rcsb.org/pdb/home/home.do) protein database. Third, Auto Dock Tools 1.5.6 software was used to remove water molecules and add hydrogen atoms to prepare target proteins and ligand molecules. Fourth, Autodock Vina1.1.2 was used for molecular docking simulations with docking being ran 50 times to give docked conformations. The different docking energy values of the corresponding compounds were obtained.
3 Results and discussion
3.1 Characterization of different constituents of dried and stir-fried ginger extracts
UPLC-Q/TOF-MS was used to identify the main compounds in dried and stir fried ginger. Unknown compounds were first analyzed using UNIFI software through the information of element compound and fragmentations of the different peaks matched with the information, including molecular weight, molecular formula, molecular structure, in the established chemical composition database. Afterwards, we analyzed the molecular ion and accurate molecular formula for candidates using Masslynx 4.1, and then identified them by comparing with data from literature. Take 6-gingerol (peak 18) as an example, in the negative ion mode, the excimer ion peak m/z 294.1833 [M−H]−,the secondary mass spectrum appeared m/z 274.1833 [M−H−H2O]−, m/z 262.1725[M−H−CH3O]−, m/z 190.0708 [M−H−C6H13O]− and other fragment ions, showing the loss of 1 water molecule, demethoxy group, combined with the literature (He L et al., 2018) speculated peak 18 is 6-gingerol, as shown in Fig. 2. The identities of the peaks associated with ginger samples were confirmed by comparing their retention time, mass spectra, molecular formula and accurate mass data of molecular ions with published literature (Table 1). Based on the above method, 49 chemical compounds were identified, all of which were present in dried and stir fried ginger. These compounds included gingerol, shogaol, zingiberone, and volatile oil. The base peak ion chromatogram of ginger extracts is shown in Fig. 3. “–” representative did not detect, “g” representative dried ginger and “p” representative stir fried ginger.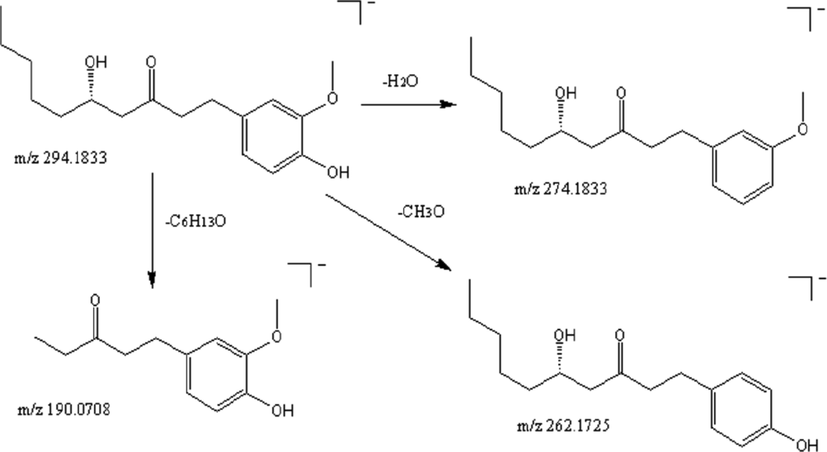
Fragmentation pathway of 6-gingerol in negative ion mode.
No.
tR/min
Formula
M(Da)
[M + H]+ (m/z)
[M−H]− (m/z)
Prominent MS2 fragmentation
Identification
Origin
Indicated
ppm
Indicated
ppm
1
5.67
C17H26O6S
358.1433
–
–
357.1360
−4.7
357;342;326;134
6-Gingesulfonic acid
g/p
2
6.32
C15H24O
220.1822
221.1897
−1.4
219.1749
−2.2
221;219;204;164;142
Shyobunone
g/p
3
6.36
C8H14O
126.1048
–
–
125.0975
2.4
125
Sulcatone
g/p
4
6.51
C7H6O2
122.0365
–
–
121.0292
−2.3
121;121;93;65;45
4-Hydroxybenzaldehyde
g/p
5
7.24
C21H24O5
356.1623
357.1694
−0.7
355.1548
−0.7
357;340;326;314
Gingerenone A
g/p
6
7.65
C15H24O
220.1825
221.1897
−1.2
219
−0.9
219;204;118;99
Diepicedrene-1-oxide
g/p
7
8.09
C21H26O6
374.1725
–
–
373.1652
−1.3
373;354;342;176;162
Hexahydrocurcumin
g/p
8
8.21
C10H16O
152.1198
–
–
151.1125
−2.1
151
Citral
g/p
9
8.43
C15H22O4
266.1508
267.1596
1.8
265.1436
−3.7
265;248;218;188;164
4-Gingerol
g/p
10
8.67
C15H24
204.1873
205.1946
−2.5
–
–
205;129;118;106
(-)-Alpha-cubebene
g/p
11
8.95
C17H28O4
296.1981
297.2054
−2.3
–
–
297;138
6-Gingerdiol
g/p
12
9.18
C16H24O4
280.1663
–
–
279.159
−4.1
279;234;184;178;208
5-Gingerol
g/p
13
9.47
C17H24O4
292.1673
293.1746
−0.5
-
-
293;152
6-Gingerdione
g/p
14
9.48
C17H24O3
276.1725
277.1803
1.8
275.1645
−2.8
277;260;218;190;174
6-Shogaol
g/p
15
9.98
C33H56O14
676.3550
–
–
675.3587
−1.5
675;513;396
Gingerglycolipid A
g/p
16
10.03
C10H16
136.1252
137.1323
−1.0
–
–
137;123;96
Sabinene
g/p
17
10.05
C19H28O6
352.1872
353.1945
−3.8
–
–
353;152
Diacetoxy-4-gingerdiol
g/p
18
10.22
C7H6O4
153.0189
–
–
154.0262
−0.5
152;107
3,4-Dihydroxybenzoic acid
g/p
19
10.25
C11H14O3
194.0939
–
–
193.0866
−2.1
193;178;164;160;148
Vanillylacetone
g/p
20
10.26
C35H60O6
576.4396
–
–
575.4323
1.1
575;512;330;312
Eleutheroside A
g/p
21
10.27
C17H26O4
294.1833
295.1909
1.6
293.1760
0.6
293;276;262;190;178
6-Gingerol
g/p
22
10.37
C6H10O
98.0731
99.0804
−0.7
–
–
99
1-Hydroxy-3-cyclohexene
g/p
23
10.91
C14H24O
208.1819
–
–
207.1746
−4
207;192
τ-Cadinol
g/p
24
10.96
C13H22O2
210.1610
–
–
209.1538
−4.5
209;152;148;138
Neryl propionate
g/p
25
12.10
C10H18O
154.1357
155.1432
1.1
–
–
155;128;122
Geraniol
g/p
26
12.21
C17H26O3
278.1882
–
–
277.181
0.1
277;260;230;220;218
1-(4-Hydroxy-3-methoxyphenyl)-5-one
g/p
27
12.50
C19H28O4
320.1987
321.2060
−0.3
–
–
321;138;164;178
8-Gingerdione
g/p
28
12.59
C19H28O3
304.2046
305.2113
0.5
303.1973
2.4
305;303;286;288;274
8-Shogaol
g/p
29
12.65
C15H22
202.1721
203.1792
−1.2
–
–
203;146;136;120
Alpha-curcumene
g/p
30
12.88
C17H22O4
290.1520
291.1593
0.6
–
–
291;192;178
1-Dehydro-6-gingerdione
g/p
31
13.11
C18H34O2
282.2556
–
–
281.2484
−0.9
281;252;194;162
Oleic acid
g/p
32
13.15
C10H16
136.1251
137.1323
−1.0
–
–
137;78
Terpilene
g/p
33
13.70
C12H20O2
196.1456
–
–
195.1384
−3.6
195;148;138
Fenchyl acetate
g/p
34
13.74
C21H32O3
332.2351
333.2422
−0.7
–
–
333;316;138;134;123
10-shogaol
g/p
35
14.03
C21H34O4
350.2456
–
349.2384
0
349;335;300
10-Gingerol
g/p
36
14.13
C16H22O4
278.1518
279.1591
0
–
–
278;178;150;122
DBP
g/p
37
14.27
C10H16
136.1247
137.132
−3.7
–
–
137;110
Ocimene
g/p
38
14.44
C15H24
204.1878
205.1954
1.4
–
–
205;122;108
α-Zingiberene
g
39
14.47
C10H20O
156.15142
–
–
155.1439
−1.3
155
Beta-rhodinol
g/p
40
14.74
C15H26O
222.1983
223.2063
2.9
223;161;122;108
(Z,Z)-farnesol
g/p
41
15.18
C15H22O
218.1669
219.1743
−0.1
217.1598
−1
217;204;188
Xanthorrhizol
g/p
42
15.44
C11H22O
170.1663
–
–
169.159
−4.7
169;152
2-Undecanone
g/p
43
16.90
C21H38O4
354.2770
355.2859
4.6
–
–
355;341;338;323;252
1-Monolinolein
g/p
44
17.74
C10H12O
148.0888
149.0957
−2.9
–
–
149;122;110
4-Allylanisole
g/p
45
17.96
C15H26O
222.1983
223.2062
2.3
–
–
223;190;160;120
Cubenol
g/p
46
18.01
C17H34O2
270.2556
–
–
269.2483
−1.2
269;224;170;156
Methyl palmitate
g/p
47
18.32
C8H16
112.1252
113.1320
−4.4
–
–
113;98;82
2-Methyl-2-heptene
g
48
18.47
C16H32O2
256.2403
–
–
255.2330
0.1
255;240;212;198
palmitic acid
g/p
49
18.74
C10H14
134.1095
135.1167
−1.2
–
–
135;120;108;94
O-cymol
g/p
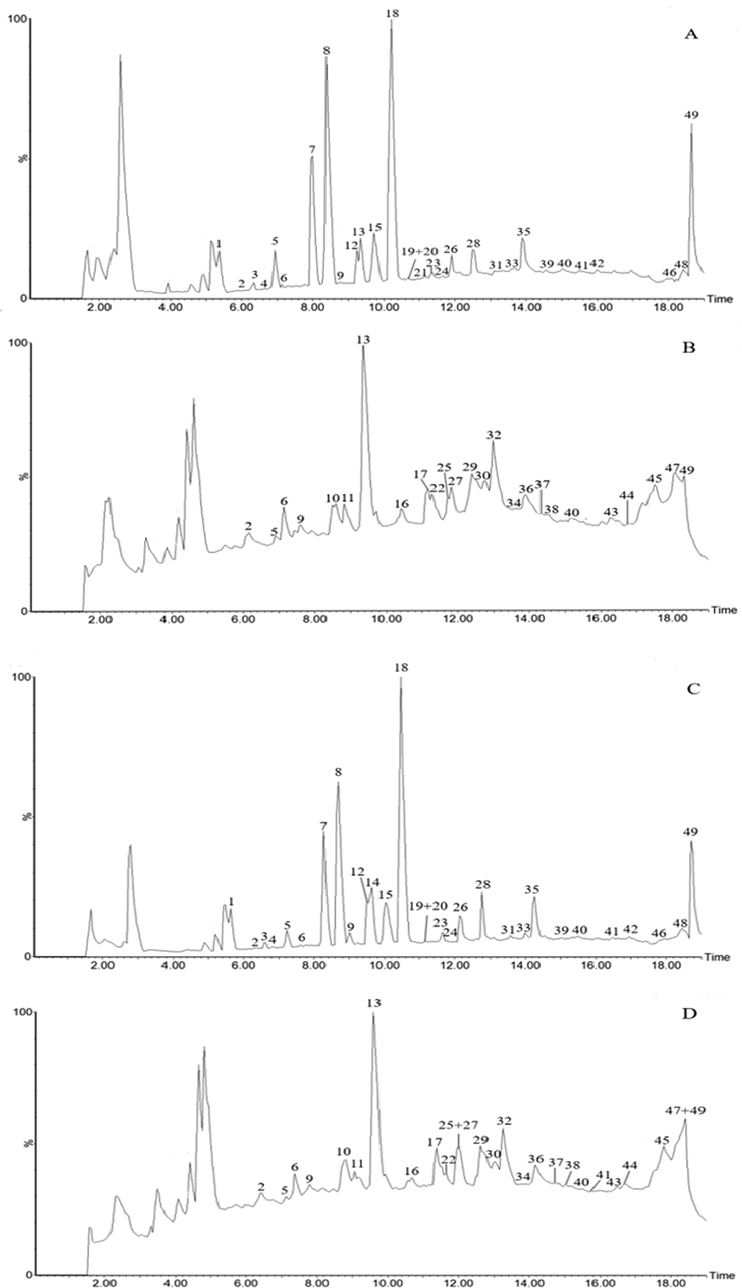
The typical total ion chromatograms. A: positive ions of dried ginger; B: negative ions of dried ginger; C: positive ions of stir fried ginger; D: negative ions of stir fried ginger.
Multivariate statistical analysis was used to identify differences in composition between dried and stir fried ginger samples. We introduced the mass spectrometry data into the Progenesis QI software, to obtain the dried and stir fried ginger in positive and negative ion mode OPLS-DA and S-Plot diagrams, as shown in Fig. 4A and B. The results of OPLS-DA show that the 12 batches of samples were divided into two distinct groups, indicating that there was a difference in the composition between dried and stir fried ginger. In the S‑plot, every point represented an ion m/z pair. Components in the third quadrant in the lower left corner of the “S” and the first quadrant in the upper right corner of the “S” contributed the most to the differences between dried and stir fried ginger. Variable importance in projection (VIP) was used as the index to describe the degree of contribution of each variable. When the VIP > 1.0, there is a difference in the given component between the samples under analysis. A total of 27 components with VIP > 1.0 were detected, as shown in Table S2. The results showed that these 27 differential components mainly include zingiberone, shogaol, volatile oils and gingerol. After the processing of dried ginger, there was a significant increase in the composition of zingiberone and shogaol, but a significant decrease in the composition of volatile oils and gingerol. These differences may have arisen by the high temperatures during processing where some components were decomposed or converted into other compounds. It has been shown that some bioactive compounds in ginger readily change with temperature, pH, and other external conditions (Jolad et al., 2005). For instance, volatile oils are heat sensitive, and can gradually decompose with increase in temperature. Thermal degradation of ginger phenol can generate zingiberone, shogaol and related compounds. Gingerol components are unstable under high temperatures due to the presence of a β-hy-droxy-one group, and are easily transformed into gingenols after dehydration (Jolad et al., 2004, Baliga et al., 2011). The increase in the composition of zingiberone and shogaol compounds after processing of dried ginger may account for the differences in the use of dried and stir-fried ginger for the clinical treatment of different diseases. This change in chemical composition explains the differences in therapeutic effects between dried and stir-fried ginger, which is of great significance to the selection of quality markers.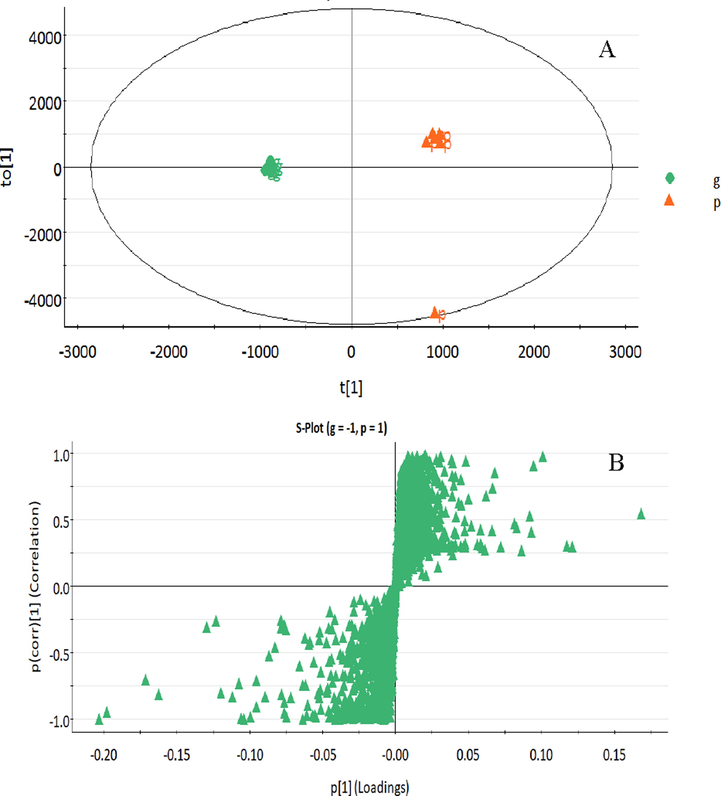
OPLS-DA (A) and S-Plot (B) of UPLC-Q/TOF-MS data of dried (g) and stir fried ginger (p).
3.2 Effect of dried and stir-fried ginger extracts on coagulation time
PRT and CT are important indicators to determine in vitro coagulation activity, with short times indicating strong coagulation activity (Hirsh et al., 1994, Winter et al., 2017). The PRT results showed that the use of stir-fried ginger significantly shortened PRT compared with the positive control groups, while dried ginger had no obvious effect. However, Control 1 significantly delayed PRT, which may be attributed to tranexamic acid-induced inhibition of proteolytic and fibrinolytic activation (Hunt, 2015). The results of in vitro CT (test tube method and coagulation plate method) showed that dried ginger prolonged CT, indicating that it had an anticoagulation effect, while stir fried ginger significantly shortened CT, indicating that it had a hemostatic effect (Fig. 5 and Table 3S). However, the coagulation effect of stir fried ginger was less than that of the two positive controls. These findings are similar to findings from our previous study (Han et al., 2016). It is worth noting that dried and stir-fried ginger showed different coagulation effects despite their chemical components being similar. This suggested that the chemical components of dried and stir fried ginger extracts do not determine their quality and hemostatic activity. It was therefore necessary to conduct spectrum-effect correlation analysis to determine the contribution of each component to the hemostatic activity.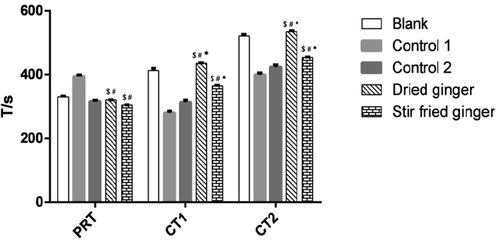
Effect of dried and stir fried ginger on Coagulation Time. $ represent p < 0.05, compared with Blank group; # represent p < 0.05, compared with Control 1 group (The tranexamic acid); * represent p < 0.05, compared with Control 2 group (Panax notoginseng powder).
3.3 Establishment of the UPLC fingerprint
Optimized conditions were used to generate chromatograms for all the ginger extracts as well as the reference samples (Fig. 6). A comparison of the ultraviolet spectra and UPLC retention times revealed 18 different origins with little ginger differences, but greatly between dried and stir fried ginger, and we labeled with the 26 peaks common between the extracts. The chromatograms for dried ginger lacked peaks 1, 2, 4, and 6, while the chromatograms for stir fried ginger lacked peaks 3, 5, and 7. These missing peaks areas were defined as 0 and may be the main reason for the quality difference between dried and stir fried ginger. Seven common peaks, namely, those of zingiberone (a), 6-gingerol (b), 8-gingerol (c), 6-shogaol (d), 10-gingerol (e), 8-shogaol (f), and 10-shogaol (g), were identified after comparison with the chromatograms of the standards.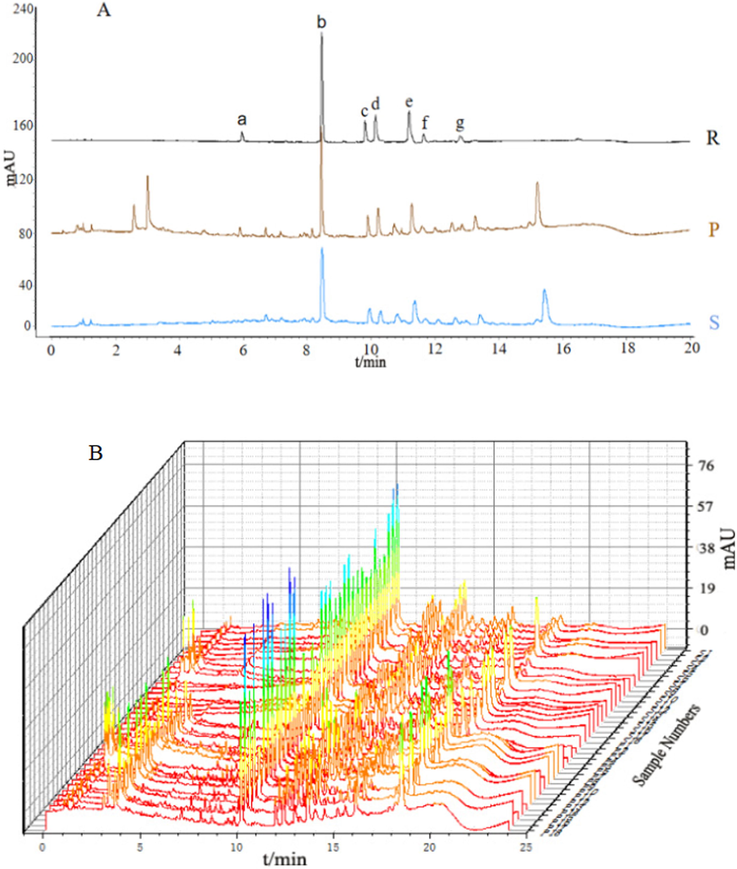
A: UPLC chromatogram of (S) dried ginger, (P)stir fried ginger, and (R) a mixture of reference substances. B: Eighteen batches of dried and stir fried ginger. Seven peaks were identified by comparison with chromatograms of standard substances: (a) zingiberone, (b) 6-gingerol, (c) 8-gingerol, (d) 6-shogaol, (e) 10-gingerol, (f) 8-shogaol, (g)10-shogaol.
In order to compare the differences between the dried and stir fried ginger, unsupervised principal component analysis (PCA), and supervised orthogonal partial squared discriminate analysis (OPLS-DA) were performed. Following a Pareto scaling with mean-centering, the data were displayed as a scores plot (Fig. 7 A). OPLS-DA revealed that the dried and baked ginger could be separated into distinct clusters according to differences in chemical composition. The R2Y and Q2 values for the OPLS-DA model were 0.950 and 0.922, respectively. A model is said to have good predictability when Q2 approaches 1 (Wang et al., 2020b). VIP is used to describe the explanatory ability of independent variables to dependent variables. When the VIP is greater than 1, the greater the VIP, the stronger the explanatory ability of independent variables. The OPLS VIP diagram (Fig. 7B) showed that peaks 3, 5, 6, and 7 had the highest VIP scores. This indicates that the compounds represented by peaks 3, 5, 6, and 7 are the most significant components in the methanol extracts of dried and stir fried ginger.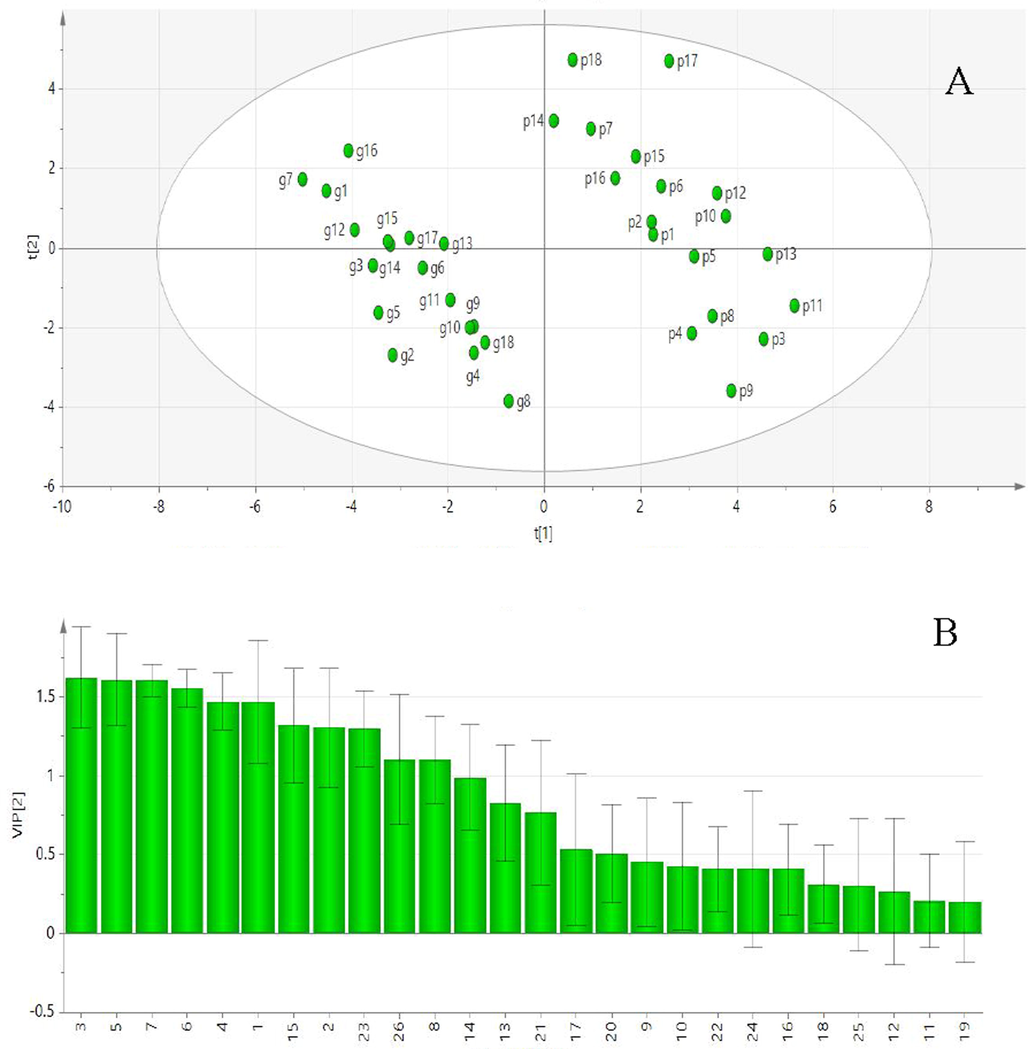
A:Score scatter plot of PCA. B:VIP of OPLS dried (g) and stir fried ginger (p).
3.4 The spectrum-effect relationships
Pearson correlation analysis was applied to study the spectrum-effect relationships between the Shortening of clotting time (SCT) and the area values of twenty-six common peaks in the UPLC data. The SCT, which refers to the coagulation of blood at the same concentration, was positively correlated to the bioactivity of the dried and stir fried ginger extracts. The correlation coefficients obtained (Fig. 8) showed that 15 peak areas were significantly correlated with coagulation, of which 8 peaks (1, 2, 4, 6, 15, 23, 24, and 26) were positively correlated means that these 8 peaks are related with promoting coagulation and 7 peaks (3, 5, 7, 8, 13, 14 and 21) were negatively correlated means that these seven peaks are related to anticoagulant effects.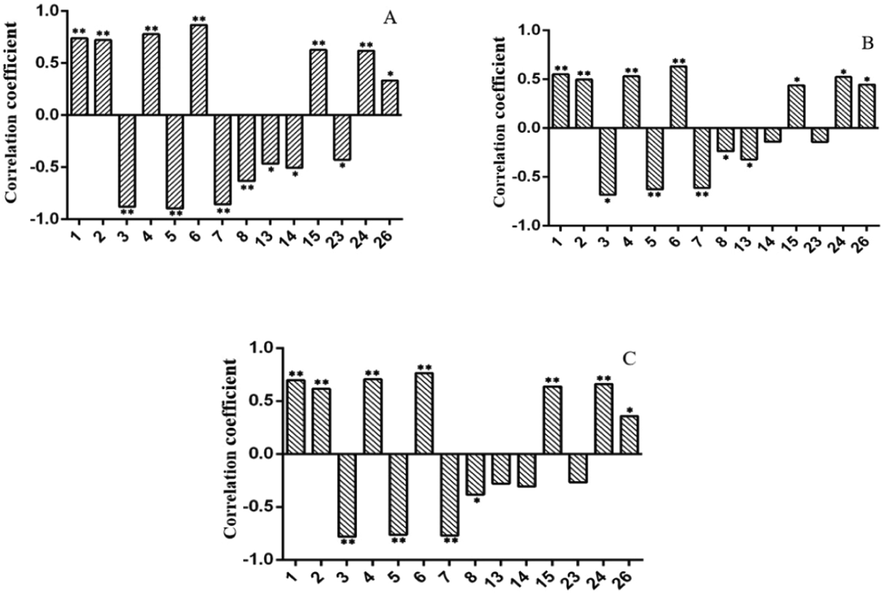
Thermograph of 15 peaks significantly correlated with coagulation activity. A: PRT; B: CT1; C: CT2.“*” stands for P < 0.05.“**” stands for P < 0.01. (A positive correlation coefficient indicates that the component has a hemostatic effect, while a negative correlation coefficient indicates that the component promotes blood circulation).
The spectral effect correlation analysis was carried out using PLSR analysis. and the OPLS-DA of the score scatter plot of 26 characteristic peaks and coagulation were calculated (Fig. 9A) and standardized regression coefficient (Fig. 9B). The Fig. 9B shows that 11 peaks had VIP values greater than 1, among which the regression coefficients of peak 1, 3, 4, 6,15, 23 and 26 were positively correlated with hemostatic activity. This was an indication that the compounds corresponding to these seven peaks have important effects on hemostasis.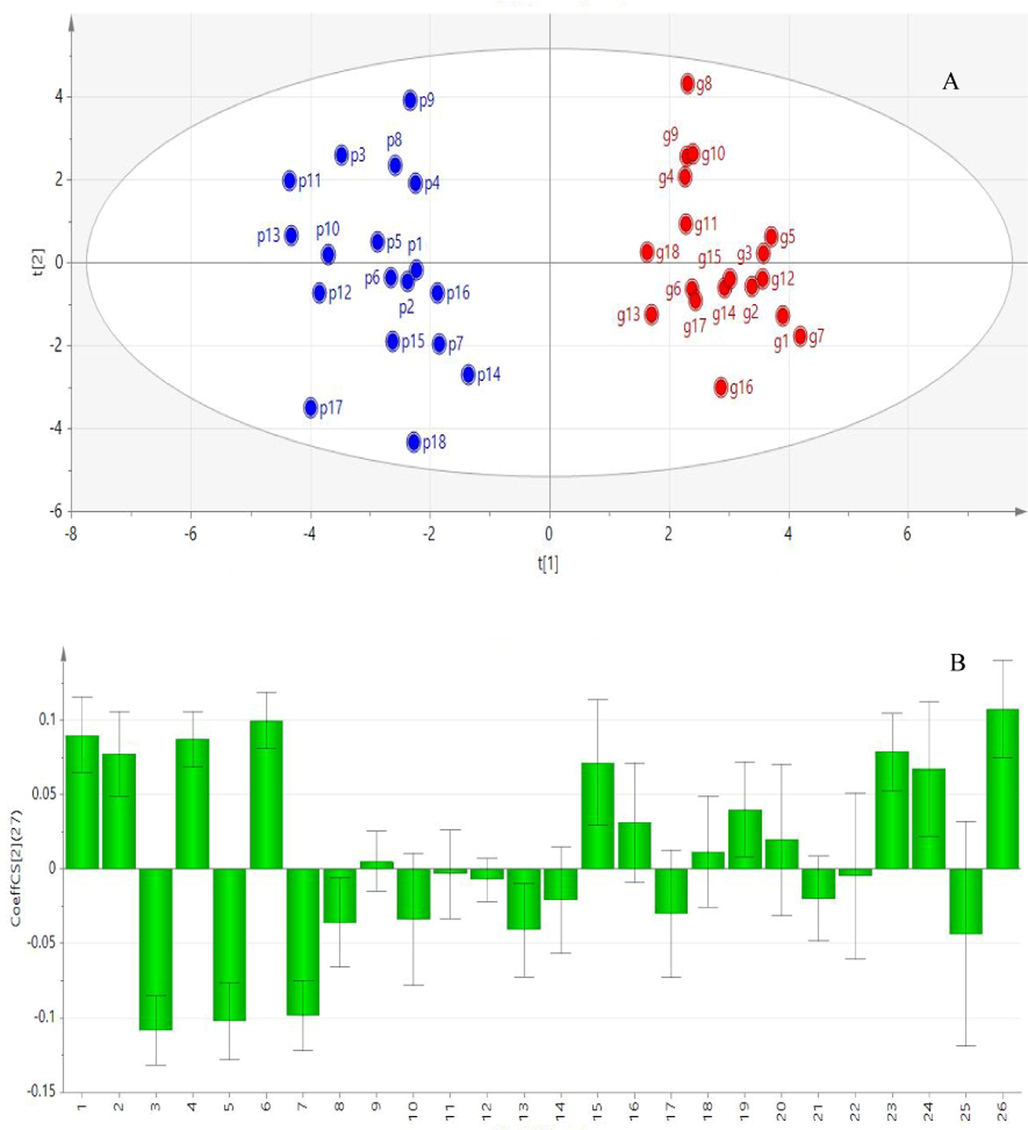
A: OPLS-DA score scatter plot of peak areas and coagulation effect of dried (g) and stir fried ginger (p). B: PLSR normalized regression coefficient graph.
The results of the two correlation analyses showed that 11 peaks were significantly correlated with coagulation, with peaks 1, 3, 4, 6, 15 and 23 being positively correlated and peaks 3, 5, 7 and 8 being negatively correlated. A comparison between the standard peaks and the sample peaks revealed that peak 4 was zingiberone, peak 15 was 6-shogaol and peak 23 was 10-shogaol. Therefore, these three known components were used as mass markers for hemostatic effect of stir fried ginger.
3.5 Assessment of molecular docking
To verify the correlation between chemical composition and hemostasis, 66 component targets and 4318 related targets of bleeding diseases were selected based on the swiss target prediction data and swiss target prediction database, respectively. The intersection has 147 of component and disease targets. The related protein targets were uploaded to the STRING database, and the confidence score was set to high confidence “0.9”. Src was selected as the core target based on the values of Degree and Betweenness Centrality. Src are essential for platelet activation as they are involved in megakaryocyte (MK) development and platelet production and play a central role in mediating the rapid response of platelets to vascular injury(Nagy et al., 2020, Senis et al., 2014). They transmit activation signals from a diverse repertoire of platelet surface receptors, including the integrin α IIbβ 3, the immunoreceptor tyrosine-based activation motif-containing collagen receptor complex GPVI-FcR γ-chain, and the von Willebrand factor receptor complex GPIb-IX-V (Séverin et al., 2012). Therefore, in this study, the SRC receptor was selected as the molecular docking target protein of the drug.
Binding energy (BE) refers to the binding ability and interaction between small ligands and biological macromolecules. A binding energy < 0 indicates that spontaneous binding can be carried out between receptor protein and ligand components, and the binding energy ≤ −5 kJ/mol indicates good binding ability (Abbasi et al., 2018). As shown in Fig. 10, The low root mean-square deviation (RMSD) of the re-docked and co-crystallized conformation of zingiberone, 6-shogaol, and 10-shogaol was calculated to be 1.73 Å, 2.60 Å and 1.65 Å and the binding energies were −6.4, −5.9, and −6.2 kJ/mol, respectively. Ligands bind to protein receptors through hydrogen bonding. The results of molecular docking proved that the three quality markers could be closely combined with the related pharmacodynamic targets, and validated their selection as quality markers. Consistent with these results, many reports have shown that zingiberone, 6-shogaol and 10-shogaol are related to the warm meridian hemostasis of stir fried ginger, the zingiberone, 6-shogaol and diacetyl-6-gingenol have the effect of warming meridian hemostasis, and contribute up to 73 % (Shen et al., 2020, Niu et al., 2020). An analysis of the chemical compositions of the ginger extracts before and after processing showed that zingiberone is newly produced after processing, while the amounts of 6-shogaol and 10-shogaol increase significantly after processing. This indicates that zingiberone, 6-shogaol and 10-shogaol, which enhance hemostatic effects, are produced and increased after processing. This situation could explain why stir fried ginger has remarkable hemostatic effects. May be the reason why stir fried ginger has remarkable hemostatic effect.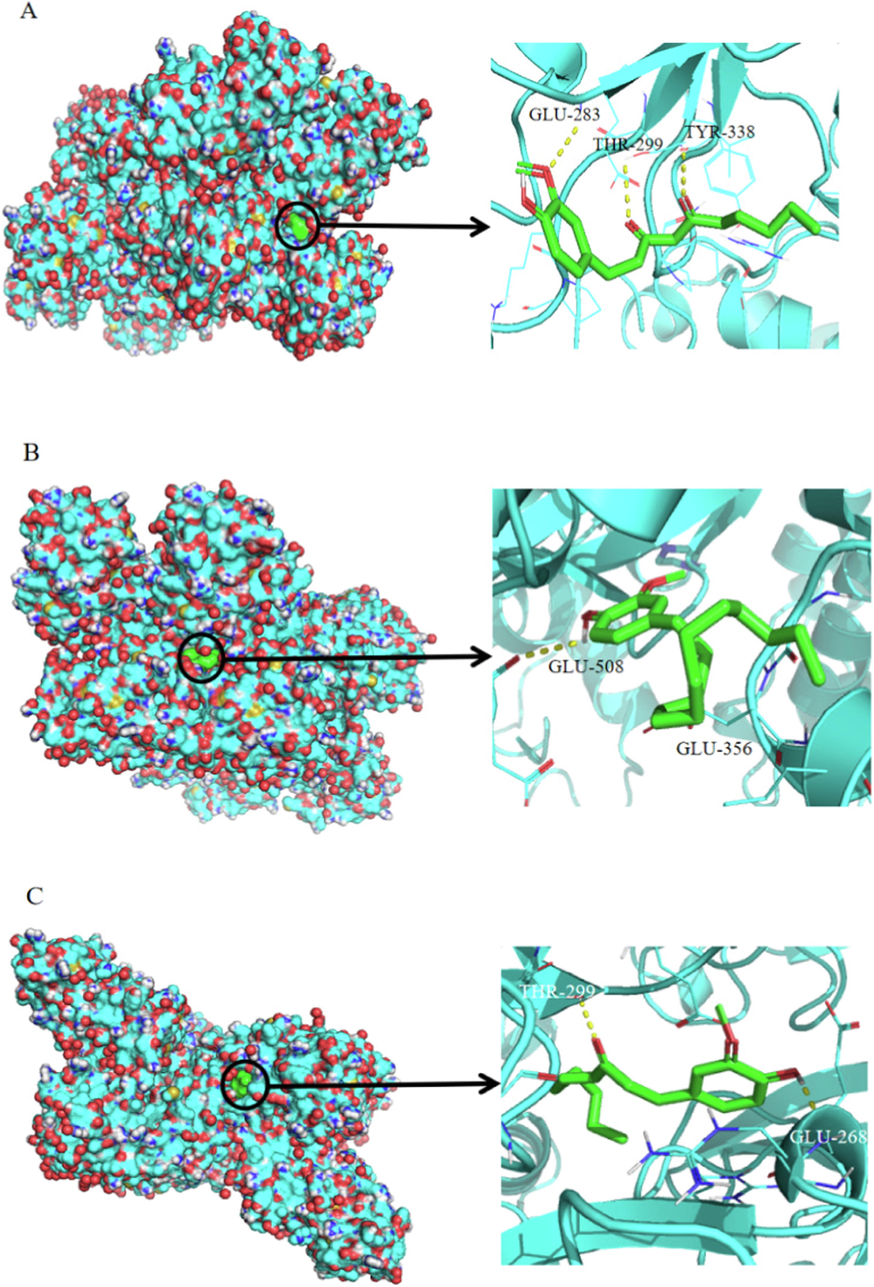
The detailed target-compound interactions of the docking simulation.A:Zingiberone; B:6-shogaol; C:10-shogaol. (The red circle indicates the docking state between small molecule compound and large molecule protein, and the detailed docking condition on the right side can be observed).
The basic conditions of TCM are specified in the definition of quality markers:(1) Secondary metabolites inherent in Chinese medicinal materials, or chemicals formed in the process of processing and preparation; (2) chemical substances unique to medicinal materials; (3) that have clear chemical structure and biological activities; and (4) substances that can be qualitatively identified and quantitatively determined (Zhang et al., 2022). The reasons for confirm Q-marker to 6-gingerol, zingiberone, 6-shogaol and 10-shogaol is as follows: Firstly, 6-gingerol, 6-shogaol and 10-shogaol are the original ingredients of ginger, which can be detected in fresh ginger, and zingiberone is a newly generated chemical substance after processing at high temperature. Second, in many of the current quality standards, the medicinal materials take chlorogenic acid and rutin as different content determination indicators, but the components of gingerol (6-gingerol, zingiberone, 6-shogaol and 10-shogaol) are unique to gingers, reflecting the “pertinence” and “specificity” of ginger. Thirdly, 6-gingerol, zingiberone, 6-shogaol, and 10-shogaol have a clear chemical structure and biological activity. (Mahluji et al., 2013, Kubra and Rao, 2021, Mashhadi et al., 2013, Saleh et al., 2018). Fourth, 6-gingerol, zingiberone, 6-shogaol and 10-shogaol phenol can be qualitatively identified and quantitatively determined. Our research group determined the contents of 6-gingerol, zingiberone, 6-shogaol and 10-shogaol in 18 different batches of ginger. Fifthly, the fundamental purpose of quality control is to control the effectiveness of traditional Chinese medicine. Therefore, “effectiveness” is the core element of quality markers. In this experiment, the three components of zingiberone, 6-shogaol and 10-shogaol which Ginger has the material basis of blood coagulation effect were selected by the correlation analysis with the efficacy test and fingerprint. Because 6-gingerol is the highest chemical component in ginger, and it is also the index component of the existing ginger quality evaluation criteria, so 6-gingerol is also included in the quality markers.
4 Conclusions
In this study, we used correlation analysis to explore the relationship between the chemical composition of ginger extracts and their pharmacological effects. We discovered that the components responsible for the hemostasis of stir fried ginger, can be used as the quality markers to distinguish between dried and stir fried ginger. The results highlighted the differences in composition between dried and stir fried ginger, and the basis of the efficacy of stir fried ginger. However, the therapeutic effect of ginger is not only hemostasis, 6-gingerol, 8-gingerol, 6-shogaol, 10-gingerol and other drugs also have the immunomodulatory, anti-tumor, analgesic and antioxidant effects, the effect of stir fried ginger is mainly hemostasis, In order to distinguish the quality difference of dried and stir fried ginger, the hemostasis was chosen to do the efficacy experiment. These findings could improve the quality standards of dried and stir fried ginger, and provide a reference for the research of other TCM quality markers.
CRediT authorship contribution statement
Yu Jiang: Conceptualization, Methodology. Chao Bu: Methodology. Lanlan Fan: Conceptualization. Gang Cao: Conceptualization. Li Sun: Conceptualization. Rodney J.Y. Ho: Methodology. Deling Wu: . Shuangying Gui: Conceptualization. Yanquan Han: Conceptualization. Yan Hong: Conceptualization.
Acknowledgements
This work was supported by Anhui Province Natural Science Foundation (2108085MH313), Zhejiang Provincial Preponderant and Characteristic Subject of Key University (Traditional Chinese Pharmacology), Zhejiang Chinese Medical University (No. ZYAOXZD2019005), National Key Research and Development Project (2018YFC1707004), Natural Research Fund of Anhui University of Chinese Medicine (2020zrzd05&2021yfylc03).
The authors declare that they have no known competing financial interests or personal relationships that could have appeared to influence the work reported in this paper.
References
- New insights into the efficiency of thymol synergistic effect with p-cymene in inhibiting advanced glycation end products: A multi-way analysis based on spectroscopic and electrochemical methods in combination with molecular docking study. J. Pharm. Biomed. Anal.. 2018;150:436-451.
- [CrossRef] [Google Scholar]
- Update on the chemopreventive effects of ginger and its phytochemicals. Crit. Rev. Food Sci. Nutr.. 2011;51(6):499-523.
- [CrossRef] [Google Scholar]
- Exploring the Q-marker of “sweat soaking method” processed radix Wikstroemia indica: Based on the “effect-toxicity-chemicals”study. Phytomedicine. 2018;45:49-58.
- [CrossRef] [Google Scholar]
- Formation of 6-, 8- and 10-shogaol in ginger through application of different drying methods: altered antioxidant and antimicrobial activity. Molecule. 2018;23:1646.
- [CrossRef] [Google Scholar]
- Comparison of fresh, dried and stir-frying gingers in decoction with blood stasis syndrome in rats based on a GC-TOF/MS metabolomics approach. J. Pharm. Biomed. Anal.. 2016;129:339-349.
- [CrossRef] [Google Scholar]
- Metabolic profiles of ginger, a functional food, and its representative pungent compounds in rats by ultraperformance liquid chromatography coupled with quadrupole time-of-flight tandem mass spectrometry. J. Agric. Food Chem.. 2018;66:9010-9033.
- [CrossRef] [Google Scholar]
- In vitro effect of hirudin on recalcification time. J. Natl Med. Assoc.. 1994;86:627-628.
- [Google Scholar]
- The current place of tranexamic acid in the management of bleeding. Anaesthesia. 2015;70:50-e18.
- [CrossRef] [Google Scholar]
- Fresh organically grown ginger (Zingiber officinale): composition and effects on LPS-induced PGE2 production. Phytochemistry. 2004;65:1937-1954.
- [CrossRef] [Google Scholar]
- Commercially processed dry ginger (Zingiber officinale): composition and effects on LPS-stimulated PGE2 production. Phytochemistry. 2005;66:1614-1625.
- [CrossRef] [Google Scholar]
- Establishment of a quality marker (Q-marker) system for Chinese herbal medicines using burdock as an example. Phytomedicine. 2019;54:339-346.
- [Google Scholar]
- An impression on current developments in the technology, chemistry, and biological activities of ginger (Zingiber officinale Roscoe) Crit. Rev. Food Sci. Nutr.. 2021;52:651-688.
- [CrossRef] [Google Scholar]
- Chemical characterization and antioxidant activities comparison in fresh, dried, stir-frying and carbonized ginger. J. Chromatogr. B Analyt. Technol. Biomed. Life Sci.. 2016;1011:223-232.
- [CrossRef] [Google Scholar]
- Screening for the antiplatelet aggregation quality markers of Salvia yunnanensis based on an integrated approach. J. Pharm. Biomed. Anal.. 2020;188:113383.
- [CrossRef] [Google Scholar]
- Research Progress on Chemical Constituents of Zingiber officinale Roscoe. Biomed Res Int. 2019:5370823.
- [CrossRef] [Google Scholar]
- Quality specifications forarticles of botanical origin from the United States Pharmacopeia. Phytomedicine. 2018;45:105-119.
- [CrossRef] [Google Scholar]
- Anti-inflammatory effectsof Zingiber officinale in type 2 diabetic patients. Adv. Pharm. Bull.. 2013;3:273-276.
- [CrossRef] [Google Scholar]
- Anti-oxidativeand anti-inflammatory effects of ginger in health and physical activity: review of current evidence. Int. J. Prev. Med.. 2013;4:36-42.
- [Google Scholar]
- Interplay between the tyrosine kinases Chk and Csk and phosphatase PTPRJ is critical for regulating platelets in mice. Blood. 2020;35:1574-1587.
- [CrossRef] [Google Scholar]
- Study on the related substances and channel tropism of baked ginger on warming meridian and hemostasis based on ‘syndrome-efficacy-analysis of biological samples. Chin. J. Tradit. Chin. Med. Pharm.. 2020;3:1454-1461. https://doi.org/CNKI:SUN:BXYY.0.2020-03-110
- [Google Scholar]
- Solid-state fermentation by Trichoderma viride for enhancing phenolic content, antioxidant and antimicrobial activities in ginger. Lett. Appl. Microbiol.. 2018;67:161-167.
- [CrossRef] [Google Scholar]
- Gingerols and shogaols: Important nutraceutical principles from ginger. Phytochemistry. 2015;117:554-568.
- [CrossRef] [Google Scholar]
- Src family kinases: at the forefront of platelet activation. Blood. 2014;124:2013-2024.
- [CrossRef] [Google Scholar]
- Distinct and overlapping functional roles of Src family kinases in mouse platelets. J. Thromb. Haemost.. 2012;10:1631-1645.
- [CrossRef] [Google Scholar]
- Alternative processing technology for the preparation of carbonized Zingiberis Rhizoma by stir-frying with sand. Pharm. Biol.. 2020;58:131-137.
- [CrossRef] [Google Scholar]
- Thrombin-based discovery strategy of bioactive-chemical quality marker combination for pollen of Typha orientalis by metabolomics coupled with chemometrics. Phytomedicine. 2020;75:153246.
- [CrossRef] [Google Scholar]
- Metabolomic approach for rapid differentiation of Fritillaria bulbs by matrix-assisted laser desorption/ionization mass spectrometry and multivariate statistical analysis. J. Pharm. Biomed. Anal.. 2020;185:113177.
- [CrossRef] [Google Scholar]
- Discrimination of quality markers of Shujin Huoxue Capsules based on five principles coupled with cobweb model. Chin. J. Chin. Mater. Med.. 2022;47:2440-2448.
- [CrossRef] [Google Scholar]
- A unique issue in the standardization of Chinese materia medica: processing. Planta Med.. 2010;76:1975-1986.
- [CrossRef] [Google Scholar]
- The antithrombotic activity of the active fractions from the fruits of Celastrus orbiculatus Thunb through the anti-coagulation, anti-platelet activation and anti-fibrinolysis pathways. J. Ethnopharmacol.. 2019;241111974
- [CrossRef] [Google Scholar]
Appendix A
Supplementary material
Supplementary data to this article can be found online at https://doi.org/10.1016/j.arabjc.2022.104151.
Appendix A
Supplementary material
The following are the Supplementary data to this article:Supplementary data 1
Supplementary data 1
Supplementary data 2
Supplementary data 2
Supplementary data 3
Supplementary data 3


