

Translate this page into:
Sudan-I dye and Fructose chemicals based photogalvanic cells for electrochemical solar energy conversion and storage at low and artificial sun intensity
-
Received: ,
Accepted: ,
This article was originally published by Elsevier and was migrated to Scientific Scholar after the change of Publisher.
Abstract
With the rapid commercialization of wind and solar power generation, the need of power storage capacity is gaining importance. The photogalvanic cells as described in the present manuscript are promising energy devices as they provide for a route for simultaneous solar power generation and its storage. The study of photogalvanics of Sudan-I dye (photo-sensitizer)-Fructose (reductant)-Sodium Lauryl Sulfate (surfactant) has been done in alkaline medium at low and artificial sun intensity with aim of finding relatively better combination of chemicals like photosensitizer, reductant and surfactant for further enhancing the efficiency of these cells. This combination of chemicals has shown very impressive and surprisingly very high improvement in cell performance. The optimum conditions for cell have also been observed for optimal cell performance. The power at power point, solar conversion efficiency, open circuit potential, equilibrium current, charging time, and power storage capacity (as half time) at 10.4 mWcm−2 (low and artificial illumination intensity) has been observed of the order of 367.8 μW, 11.49%, 1014 mV, 1350 μA, 21 min, and 30 min, respectively.
Keywords
Solar energy
Solar energy conversion
Solar power storage
Photogalvanic cells
Sudan-I

1 Introduction
The sustainable energy generation needs to focus mainly on exploitation of the renewable energy sources like wind energy, solar energy, etc. The solar energy is a peculiar renewable energy source as it is most abundant and mother of rest other energy resources (like wind, bio-mass, ocean currents, fossils fuels, etc.). It is only solar energy which can provide electricity as long as life exits on the planet earth. It is also an energy source which can supply power on all planets. It is because we don’t know whether life, water, wind, coal, etc. exist on the other planets, but it is certain that all planets have the solar radiations. Therefore, the development of solar energy harvesting techniques (like photovoltaic cell, photogalvanic cell (PG), etc.) for solar power production is of utmost importance for the future
The PG cells are relatively cheap, clean and potential source of Energy. The PG cells are light sensitive electrochemical devices capable of converting solar energy into solar power with its inherent storage in the form of photo-excited states of the sensitizer molecules. In this solar device, the solution consisting of photosensitizer, reductant and surfactant is a light absorbing phase, which is contacted by two dissimilar electrodes showing different selectivity to the redox processes (Gangotri et al., 1996). A dye sensitizer molecule present in liquid phase of electrolyte is photo-excited to an energy rich species capable of losing energy electrochemically to generate solar electricity. It is to be noted that three chemicals–sensitizer, reductant, NaOH-are compulsory for harnessing solar energy by photogalvanic cells. The use of surfactant chemical is not compulsory for harnessing solar energy but its use enhances the solar energy conversion efficiency.
The discovery of significance of electrochemistry as solar harvesting technique can be attributed to the Becquerel’s pioneering work. In year 1839, Becquerel reported that the illumination of two unsymmetrical metal electrodes causes the flow of electrons (current) from one electrode to other electrode (Becquerel, 1839). The photogalvanic effect was first time observed by Rideal and Williams in year 1925 (Rideal and Williams, 1925). Later on in year 1940, the Rabinowitch reported systematic studied on the photogalvanic effect in Fe (II)-Thionine chemical system with the suggestion that this effect may be exploited for converting solar energy into electricity (Rabinowitch, 1940). To exploit this idea, various PG cells based on various dyes and reductants have been studied. Early studies focused on Thionine photosensitizer- ferrous species reductant based PG cells (Potter and Thaller, 1959; Albery and Archer, 1977). Later on, the role of micelles and range of photosensitizers including and reductants for advancement of photogalvanic cells was studied (Pokhrel and Nagaraja, 2009; Koli and Sharma, 2016; Koli, 2016; Koli and Sharma, 2017; Gangotri and Koli, 2017; Madhwani et al., 2007; Genwa et al., 2009; Pramila and Gangotri, 2007; Koli, 2018; Koli, 2019; Koli et al., 2019; Meena et al., 2004; Gangotri and Gangotri, 2009; Sharma et al., 2011; Bhimwal and Gangotri, 2011). Recently, some studies on the photogalvanics have reported tremendous enhancement in the electrical output of the PG cell (Koli et al., 2012); and have reported conversion efficiency (CE), short-circuit current (isc), maximum power (Ppp), and power storage capacity (t0.5) respectively as 7.58%, 972 μA, 244.02 μW, and 216 min for Rhodamine B dye sensitizer-Fructose reductant- NaOH alkaline medium (Koli et al., 2012).
The photovoltaics may be considered as a reference solar technique to judge the state of development of other similar solar techniques as the photovoltaics is presently only solar technique having full commercial application in daily life world over. Thus, to make photogalavanic cells more efficient and practically applicable in daily life, some new gradients have to be exploited for assembling the PG cells. It is reported that alkaline medium and small sized platinum electrode (Koli et al., 2012) with surfactants (Groenen et al., 1984) enhances the efficiency of PG cells. The anionic surfactants are reported as most effective surfactants for solar power generation and its storage through the PG cells (Madhwani et al., 2007; Mukhopadhyay and Bhowmik, 1993). To best of my knowledge, there is no reported focus on use of sensitizer(s) in these cells having absorption below 500 nm.
Therefore, the present research study of the use of Sudan-I dye as photosensitizer- Fructose as reductant-Sodium Lauryl Sulphate (SLS) as surfactant- small Pt as anodic electrode-SCE part of combination electrode as cathodic electrode was undertaken in alkaline medium at 10.4 mW cm−2 (a low and artificial sun intensity) to further improve electrical performance by optimization of cell fabrication parameters for optimal performance of the Sudan-I system based PG cells. The observed results in present work clearly establish the novelty, originality and advancement over the already published results of the same photogalvanic chemical system (Koli et al., 2012).
2 Material and methods
2.1 Chemicals
The solutions, i.e., M/500 of Sudan-I (λmax 476 nm, Purity greater than 95.0%), M/100 of Fructose (99.8% Assay), M/10 of Sodium lauryl sulfate (SLS; purity 94% minimum), 1 M of NaOH (98% Assay), 1 M Oxalic Acid, and Phenolphthalein have been used as photosensitizer, reductant, surfactant, alkaline medium, standard solution for standardization of NaOH, and indicator, respectively. Sudan-I shows absorbance in UV–Visible range (mainly in 280 nm–650 nm) with characteristics bands at 480 nm (ε 14,481 LM−1cm−1), 314 nm (ε 6930 LM−1cm−1), and a shoulder band at 419 nm (ε 982 LM−1cm−1) in ethanol solvent (Supplementary Information-SI, Sec. 1).
2.2 Experimental and calculation method
The photogalvanic cell is fabricated by taking solutions of sensitizer, reductant, surfactant, and alkali NaOH in an H-shaped glass tube having Pt as anodic electrode in one arm and saturated calomel electrode (SCE) in another arm as shown in Figs. 1 and S2 (Koli et al., 2012; Sharma et al., 2011). The Pt anode area for calculation of the efficiency is also supported by Murthy et al. (Murthy et al., 1980).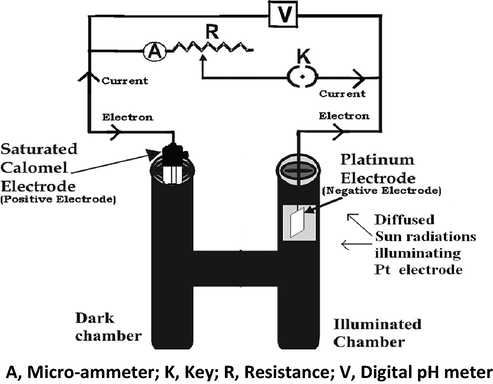
Photogalvanic cell set–up. A, Micro-ammeter; K, Key; R, Resistance; V, Digital pH meter.
3 Results and discussion
3.1 Variation of the photo-potential, current and power
First of all, the photogalvanic cell (SI, Sec. 2) was put in the dark to achieve a stable dark potential. Thereafter, the cell was illuminated through the illuminated window against the Pt electrode. With passage of time, the photo-potential rose continuously to achieve a maximum potential (Vmax) corresponding to a fast irreversible process in the beginning, and after some time, the establishment of photo-equilibrium of photo-processes led to a quite constant open-circuit potential corresponding to the zero circuit current (Table 1, Fig. 2). It can be explained on the basis of the 2nd law of thermodynamics that establishment of the equilibrium in any process needs time. In the beginning, processes are irreversible and in forward direction only. Later on, once the forward process products are formed causes backward processes. In the beginning, the amount of forward process products are less in quantity, therefore, as per the law of mass action, the extent of rate of backward process is low, and as the amount of forward process product increases, the rate of backward process increases to a equilibrium value at which the rate of both forward and backward processes are equal. As far as the photogalvanic cell is concerned, there are certain photo-processes occurring in the illuminated and dark chambers of the cell. In the beginning, the processes are only in forward direction to produce the product species causing continuous rise of the photo-potential. Thereafter, the establishment of the equilibrium of the photo-process results in generation of the equilibrium potential (open-circuit potential).
Time (min)
0
5
10
15
20
21
25
Potential (mV)
596
616
620
723
990
1020 (Vmax)
1014 (Voc)
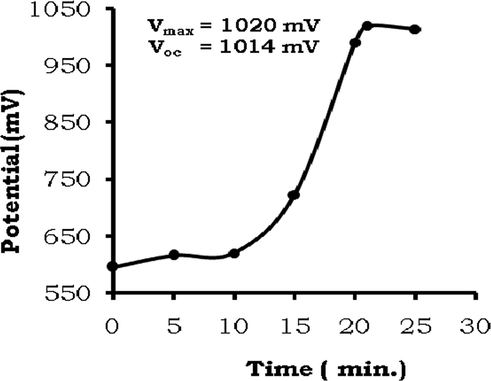
Variation of potential with time during charging of the cell.
It is well known fact that a cell works with maximum power output at a certain characteristics external load. This fact for present cell was determined by the manual i-V characteristics study done by noting potential values at corresponding and varied current values obtained by varied circuit resistance. The i-V curve and table shows that this cell gives maximum power 367.8 µW at current 600 µA and external load resistance 1021.6 Ω (Table 2, Fig. 3).
Current (µA)
Potential* (mV)
Power (µW)
Resistance (Ω)
1350
22
29.7
16.2
1300
60
78
46.1
1250
97
121.25
77.6
1200
130
156
108.3
1150
172
197.8
149.5
1100
185
203.5
168.1
1050
230
241.5
219
1000
256
256
256
950
290
275.5
305.2
900
333
299.7
370
850
364
309.4
428.2
800
389
311.2
486.2
750
428
321
570.6
700
504
352.8
720
650
551
358.15
847.6
(ipp) 600
(Vpp) 613
(ppp) 367.8
CE = 11.49%, FF = 0. 26, 1021.6
550
616
338.8
1120
500
625
312.5
1250
450
644
289.8
1431.1
400
659
263.6
1647.5
350
674
235.9
1848.5
300
687
206.1
2290
250
704
176
2816
200
732
146.4
3660
150
798
119.7
5320
100
832
83.2
8320
50
1012
50.6
20,240
0
1015
0
∞
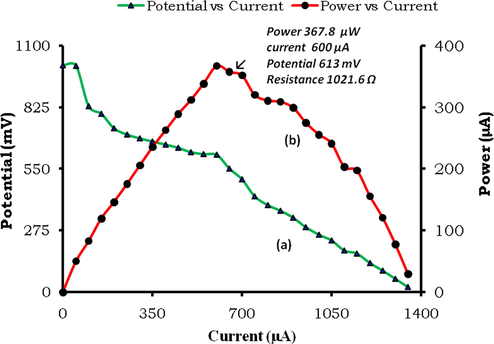
Variation of current with potential and power (i-V characteristics of cell).
The extraction of power from the cell in the dark (in absence of light after charging of the cell) has been studied at this external load resistance 1021.6 Ω. The extracted power diminishes with time in the dark to its half value, called half change time (t0.5). Even after the half change time, the cell give power in the dark till it is fully discharged (Table 3, Fig. 4). The power storage capacity of the cell and its extraction in the dark may be attributed to the stable and quite long lived semi/leuco reduced ground states of the molecules of the dye sensitizers. The power storage is not as a result of the charge gathering at electrodes. But, it is due to the average life of excited species like singlet and triplet sensitizer molecules, relative stability of the semi and leuco reduced forms of the sensitizer molecule, and inherent current carrying properties of the ionic species (e.g., surfactant and NaOH used in the cell electrolyte). The power storage is not as a result of the charge gathering at electrodes is also proved by the facts that, after removal of electrodes with which the electrolyte was illuminated, the insertion of fresh set of electrodes in the already photo-illuminated electrolyte also give current and power as soon as this new set of electrodes is dipped in solution.
Time (min)
Current (µA)
Potential (mV)
Power (µW)
0
600
613
367.8
5
600
570
342
10
570
528
300.96
15
560
452
253.1
20
530
400
212
25
520
384
199.6
28
510
378
192.7
30
510
358
(t0.5 30 min) 182.5
32
505
355
179.2
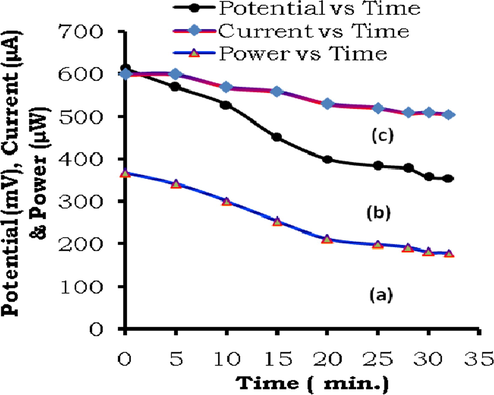
Study of cell performance (a) Power vs Time, (b) Potential vs Time, (c) Current vs Time.
The cell performance at cell parameters (like concentration, diffusion length, etc., See SI, Sec.3) is summarized as dark potential (Vdark) 596 mV; maximum potential (Vmax) 1020 mV; open-circuit potential (Voc) 1014 mV; photopotential (ΔV) 424 mV; charging time (t) 21 min; maximum current (imax) 1800 μA; equilibrium current (ieq) or short-circuit current (isc) 1350 μA; photo-current (i) 1350 μA; power at power point (ppp) 367.8 μW; potential at power point (Vpp) 613 mV; current at power point (ipp) 600 µA; t0.5 30 min; potential at t0.5 (Vt0.5) 358 mV; current at t0.5 (it0.5) 510 µA; conversion efficiency (CE) 11.49%; fill factor (FF) 0.26; and rate of change of current over t0.5 (Δi/Δt) 3.0 μA min−1.
For all classes of the solar cells like photovoltaic cells, dye-sensitized solar cells, perovskite solar cells, etc., the CE and FF values are concordant (if CE is high then FF is also proportionately high). But, for the photogalvanic cells as in the present study, the CE is high, but FF is not proportionately high. For photogalvanic cells, it may be attributed to
the photo-decay of dye photo-sensitizer, short life of excited states of dye photo-sensitizer, diffusion requirement of photosensitizer molecules, and lower resistance (shunt resistance type-Rsh) at isc point and higher resistance (series resistance type- Rs) at Voc. The photo-decay and deactivation of excited dye molecules are reported to follows non-zero order kinetics (Mosquera et al., 1994). For the photogalvanic cell under study, the calculated Rsh is low (of the order of 16.2 Ω cm2 and calculated Rs is very high (of the order of 20240 Ω cm2 or even higher).
3.2 Mechanism of photocurrent generation and storage capacity
The photo-electrochemistry of fructose reductant solution alone, pure SLS surfactant solution alone, and solution mixture of dye with reductant and alkali was studied in photogalvanic cell to arrive at a proposed mechanism with the help of published literature. The illumination of solution having dye sensitizer along with reductant and alkali shows development of the photo-potential and photo-current.
The dark potential is not due to the dye alone, but as a result of contribution of reductant, and surfactant also. The pure fructose reductant solution showed potential −151 mV (vs SCE) and zero current in the dark. The illumination of this fructose reductant solution showed no change in potential (the potential was still −151 mV) and current (the current was still zero) indicating that the fructose in neutral form is neither an electro-active species at electrodes (it is not giving/accepting electrons to/from Pt/or SCE) nor a charged carrier in the solution. But, the dye sensitizer in the presence of the fructose reductant generate photo-potential and photocurrent showing its electro-active nature, and electron exchange between dye and fructose molecules in turn showing formation of the reduced and oxidized states of the fructose. This fact is supported by the published literature that the reductant in its reduced and oxidized form behaves as an electron carriers diffusing through the path in the cell (Albery et al., 1979). The dye with fructose reductant shows photo-potential and current indicating that it is the dye that is an electro-active species. This fact is substantiated by the published work of Kaneko and Yamada (Kaneko and Yamada, 1977) that the leuco/or semi reduced form of the dyes, and the dyes itself are the main electro-active species at the illuminated and the dark electrodes, respectively (Wildes and Lichtin, 1978). The energy stored in the charge separated semi or leuco forms results into the electrical energy by the so-called photogalvanic effect. In the present study of the azo group Sudan-I dye, it should be the dye molecule itself and two electron reduced leuco form (Scheme 1).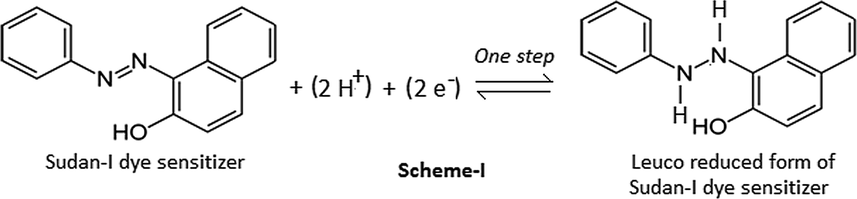
Reduction of Sudan -I dye sensitizer.
This fact of electrode process involving 2e− and 2H+ reduction of (–N = N–) group in the Sudan-I molecule into the hydrazo compound is substantiated by the published cyclic-voltammetric study. The dyes Sudan I, II, III, IV shows similar electrochemical behaviors under established conditions (vs Ag/AgCl on use of Pt cathode) with distinguished reductive peaks at potentials of ∼–0.50 V, –0.53 V, –0.57 V and –0.60 V, respectively. It is reported that reduction of the azo group of Sudan-I is a one step process at cathode potential −0.75 V and dependent on the pH and this process is diffusion controlled as indicated by the linear increase in cathode peak current with half potential (Bard, 1974; Kolthoff and Elving, 1976; Lizier et al., 2012; Ming et al., 2008).
From this redox reaction (Scheme 1), it is clear that the redox potential of Sudan-I will be pH dependent, and the 0.7645 V redox potential observed in this photogalvanic study is supported by the literature on cyclic voltammetry (reported redox potential 0.75 V).
In PG cell, the photon energy is not lost and degraded to heat but is involved in the endergonic processes occurring as storing quantum energy in the form of labile intermediates i.e., semi/leuco transition states (Stein, 1977). The higher delocalization of electrons and bulkiness of dye will enhance the stability of the excited states of the dye, and in turn it will lead to higher storage capacity. The recombination processes may lead to the lowering of storage capacity (Genwa et al., 2009).
The solution of anionic surfactant SLS alone shows potential −340 mV (vs SCE) and current 30 µA in both dark and illuminated state. It shows that the current and potential of SLS should be due to its anionic charge diffusion in the cell.
We know that higher the redox potential of a species means higher the tendency of this species to get the electrons to exist in the reduced state. In PG cell technique; the electrodes, sensitizer and reductant are the entities involved in electron exchange process. The current flows from SCE electrode to Pt electrode through the external circuit. It means the electrons will flow from SCE towards Pt in this series in the bulk of the electrolyte. The observed potential (vs SCE) of dye in the presence of reductant and SLS in dark and illuminated conditions are −596 mV (i.e., Vdark) and −1014 mV (i.e., Voc), respectively. By adjusting for potential for reductant and surfactant, the ground state and excited potential (vs SCE) of Sudan–I dye comes out to be −105 mV and −523 mV, respectively. With this calculation, the redox potentials (vs standard hydrogen electrode-SHE) of SCE, ground state Sudan-I dye, Fructose reductant, excited state Sudan-I dye, and Pt+2/Pt shall be +0.2415 V, +0.3465 V, +0.3925 V, +0.7645 V, and +1.18 V, respectively. We know that higher the redox potential means higher the tendency to get the electrons to exist in the reduced state. It means the electrons will flow from SCE (+0.2415 V) to ground state Sudan-I dye (+0.3465 V) to Fructose reductant (+0.3925 V) to excited state Sudan-I dye (+0.7645 V) to Pt (+1.18 V) in this series in the bulk of the electrolyte (Figs. 5 and 6). This is why the electron move from lower redox potential (i.e., 0.3925 V of Fructose reductant) to higher redox potential (i.e., + 0.7645 V, excited state Sudan-I dye), but not in reverse direction. It can also be explained in terms of Gibbs’ free energy (ΔG), which is defined as ΔG = - zEF, where, ‘z’, ‘E’ and ‘F’ is number of electrons exchanged, emf potential, and Faraday constant (96,490 Coulombs/mol), respectively. The free energy change is negative for spontaneous change. The free energy change is negative for one electron shift from reductant Fructose to excited Sudan-I dye [ΔG change = {(-1 × 0.7645 × F) for excited dye - (-1 × 0.3925 V × F) for Fructose reductant} = {- 0.7645 VF + 0.3925 VF} = − 0.372 VF]. Therefore, the electron move from reductant Fructose to excited Sudan-I dye smoothly, but reverse is not true. In summary, the FR+ (R+) do not react with SUD− (D−) in the light column to convert it back to SUD (D) as it will not be a feasible process owing to associated energy barrier of positive free energy change (i.e., ΔG change = + 0.372F). However, the second law of thermodynamics is natural limitation on every process including the electron shift from reductant to excited dye here. Therefore, this process of electron transfer from reductant to excited dye is also not a 100% efficient process providing some probability of reverse process (recombination or back process) of electron shift from SUD− to FR+ leading to formation of SUD and FR.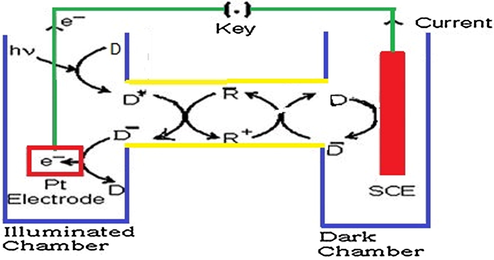
Mechanism of the photo-generation of the current in photogalvanic cell. Where SCE, Saturated calomel electrode; D, Sudan-I dye molecule; D*−, oxidised form of the Sudan-I molecule; R+, oxidised form of the fructose reductant; R, reduced state of the fructose; e-, electron.
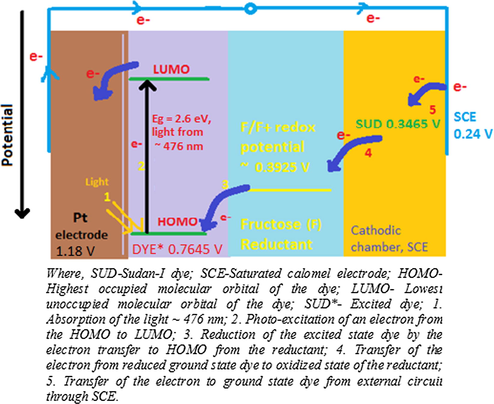
Energy level diagram for photo-generation of the current in cell.
This recombination process can be stopped by pushing forward process of electron transfer from reductant to excited dye by facilitating interaction between Pt and SUD− within life time of excited dye. It is ensured by illuminating electrolyte (dye) near the Pt electrode so that the electron excess excited dye molecule within its life reach the Pt and shed its excess electron to working electrode Pt. The increased SUD− and Pt interaction in turn lowers the number of SUD− species available for electron shift from SUD− to FR+.
In dark chamber, the tendency is of electron movement from ground state SUD− to FR+ as the redox potential of FR+ (+0.3925 V) is greater than that of ground state SUD− (+0.3465 V) .
The band gap for Sudan- I is the order of 2.6 eV equivalent to λmax 476 nm required for electron excitation from its highest occupied molecular orbital (HOMO) to lowest unoccupied molecular orbital (LUMO) (Editorial, 2015). The formation of excited state leaves a vacancy in ground state (HOMO) that can be filled by an electron donor like fructose reductant as redox potential of excited dye state is higher than that of fructose (electron transfer to HOMO of dye). The net result is that an excess electron is produced in higher energy state of the dye molecule. The excited state dye cannot hold this excess electron for long so this excess electron gets transferred to the Pt electrode. Electrons from the Pt electrode (high potential) flows through the external circuit to SCE (low potential) (Koli et al., 2012; Sharma et al., 2011). At SCE, the ground sate dye molecule in solution accepts electron as redox potential of ground state dye is higher than that of SCE. Excited dye should accept electron in HOMO and ground state dye should accept electron in LUMO. The current carrier in the electrolyte is the diffusion controlled ions. Ideally, the photo-galvanic system behaves as a light-driven cyclic electricity generator (Albery et al., 1979), and it has been found reversible for several cycles (Suresh et al., 1999). This reversible behavior is subject to the limitations imposed by the second law of thermodynamics. The ideal reversibility can be achieved only when the loss of power is zero, and that can be only when the resistance, friction, dissipation, etc., is zero, but such a position is impossible. Therefore, the element of irreversibility in photogalvanics is imminent. And, this is evident from the study done by the scientists Vos and Powels, who have reported that “the open-circuit operation is a reversible process like Carnot Engine and have zero efficiency, but in operation at maximum power at power point to get maximum efficiency, then the process is not reversible” (Vos and Powels, 1981). At small photo-potential, the quantum efficiency of the photoreaction is independent of the electrical resistance of the circuit only (Hillson and Rideal, 1953). The reductants may behave both reversibly and irreversibly, and the cyclic voltammograms show that dye reduction is reversible at low pH and quasi-reversible at high pH, where the protonation chemical reaction may be limiting the charge-transfer process (Murthy and Reddy, 1984).
The reversibility of the reductant use was reported in metallic redox couple Fe+2/Fe only (especially in thionine-iron system) in initially studies (Kamat and Lichtin, 1982; Rabinowitch, 1940). Later studies have used organic reductants like EDTA, oxalic acid, mannitol, etc; and Hendrich has used ascorbic acid as an irreversible reductant (Hendrich, 1958). It means the organic reductants may go photo decay leading to its sacrifice and in turn its sacrificial and irreversible use. In present study, the fructose (an organic compound) has been used as reductant, therefore, its use should be sacrificial in nature.
On the basis of afore mentioned facts, the mechanism of photocurrent generation (Figs. 5 & 6) in the photogalvanic cell can be schematically represented as follows (Kamat and Lichtin, 1982; Osif et al., 1978; Wildes and Lichtin, 1978)
Photo-processes occurring in the illuminated chamber containing Pt electrode-
Photo-processes occurring in the dark chamber containing SCE electrode-
Here, the FR, FR+, SUD*, and SUD− are the Fructose reductant, Fructose’s oxidized form, excited form of Sudan-I dye (photo-sensitizer), and its (Sudan-I) semi or leuco form, respectively. The ISC, T, and S are inter-system crossing process, triplet excited dye state, and singlet excited dye state, respectively.
The isc is the maximum current density achievable on generation of only one electron–hole pair from one photon (Ruhle, 2016).
3.3 Effect of variation of Sudan-I dye photosensitizer concentration
In all, the six photogalvanic cells were constructed for the study of effect of variation of Sudan-I dye photosensitizer concentration on the cell performance (See SI, Sec.4). The optimum cell performance in terms of the isc, Ppp, ipp and CE was observed at optimal dye concentration 3.04 × 10⁻⁵ M (Table 4, Fig. 7). This observation may be explained on the basis of the particle nature of the matter and sunlight as both these consists of the discrete particles namely molecules and photons, respectively. At dye concentration below the 3.04 × 10⁻⁵ M, the number of the available dye molecules for absorbing the photons shall be less in number than the available number of photons for absorption leading to the lower photo-generation of the current. At dye concentration above the 3.04 × 10⁻⁵ M, the available number of photons for absorption by the dye molecule near the Pt electrode shall be less in number as high dye concentration will prevent the photons from reaching to the solution nearby to the Pt electrode. It is to be noted that the photogalvanic cells are diffusion controlled cells requiring the reaching of excited dye molecules within their life time to donate electron to the Pt. Therefore, the dye molecules (absorbing photon) which are very close to Pt will be able to reach to Pt, and high dye concentration will limit such dye molecules leading to the lowering of the cell current. The high dye concentration may also result into dye aggregation leading to the reduced current and power generation. The suitability of 10−5 M dye concentration range for current generation is supported from the fact reported by the cyclic voltammetric study that the peak current increases linearly with incremental concentration of Sudan I in the range from 6.0 × 10⁻⁷ to 7.5 × 10⁻⁵ M. (Ming et al., 2008). The Table 4 shows that the characteristic redox potential values of the dye are almost independent of its initial concentration, which is also supported by Nabar and Shenai (Nabar and Shenai, 1963). *At [Fructose] = 6.4 × 10⁻⁴ M, [SLS] = 4 × 10⁻³ M, Temp. = 310 K, Pt electrode area = 0.4 × 0.2 cm2, light intensity = 10.4 mWcm−2, diffusion length (DL) = 5.6 cm, pH = 13.15.
Cell parameters
[Sudan-I dye concentration] × 10−5 M
1.60
2.08
2.56
3.04
3.52
4.0
Vdark (mV)
589
570
623
596
606
670
Vmax(mV)
1040
1007
1028
1020
1050
1063
Voc (mV)
1030
1003
1023
1014
1041
1055
ΔV(mV)
451
437
405
424
444
393
t (min)
11
27
14
21
34
53
imax (μA)
1280
1180
1310
1800
1690
1270
isc (μA)
990
1070
1280
1350
1160
1080
Ppp (μW)
289.1
309.5
353.8
367.8
334.8
313.7
Vpp (mV)
590
543
580
613
598
592
t0.5 (min)
18
32
22
30
23
13
vt0.5 (mV)
401
368
421
358
406
423
it0.5 (μA)
360
420
420
510
410
370
CE (%)
9.71
10.38
11.47
11.49
10.85
10.17
FF
0.28
0.28
0.27
0.26
0.27
0.27
Δi/Δt (μA min−1)
7.2
4.6
8.6
3.0
6.6
12.3
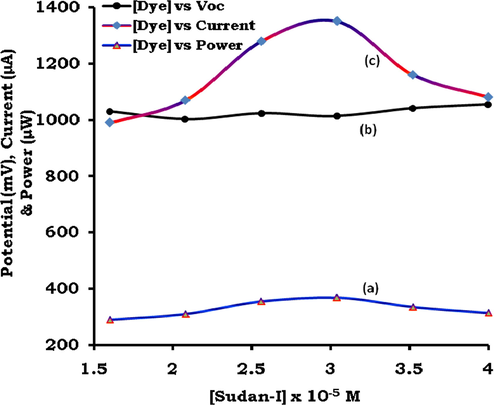
Effect of variation of dye photosensitizer on power (curve ‘a’), potential (curve ‘b’) and current (curve ‘c’).
3.4 Effect of variation of fructose reductant concentration
In all, the six photogalvanic cells were constructed for the study of effect of variation of fructose reductant concentration on the cell performance (See SI, Sec.5). The optimum cell performance in terms of the isc, Ppp, ipp and CE was observed at optimal fructose reductant concentration 6.4 × 10⁻⁴ M (Table 5, Fig. 8). This observation may be explained on the basis of the particle nature of the matter and sunlight as both these consists of the discrete particles namely molecules and photons, respectively. At fructose reductant concentration below the 6.4 × 10⁻⁴ M, the number of the available fructose reductant molecules shall be less in number for donating electrons to the dye molecules leading to the reduced cell current and power. At fructose reductant concentration above the 6.4 × 10⁻⁴ M, the increased back electron combination reaction (electron coming back from dye to reductant) coupled with the increased hindrance by the reductant molecules in the diffusion path of the dye molecules may be the reason for lowering of the cell power and current. *At [Dye] = 3.04 × 10⁻⁵ M, [SLS] = 4 × 10⁻³ M, Temp. = 310 K, Pt electrode area = 0.4 × 0.2 cm2, light intensity = 10.4 mWcm−2, diffusion length (DL) = 5.6 cm, pH = 13.15.
Cell parameters
[Fructose concentration] × 10−4 M
4.0
4.8
5.6
6.4
7.2
8.0
Vdark (mV)
609
591
624
596
600
690
Vmax(mV)
1005
1011
1017
1020
1042
1065
Voc (mV)
988
1002
1010
1014
1030
1060
ΔV(mV)
396
420
393
424
442
375
t (min)
51
45
19
21
16
36
imax (μA)
1140
1260
1130
1800
1380
1290
isc (μA)
1010
1200
1290
1350
1120
1060
Ppp (μW)
270.0
320.9
338.2
367.8
302.9
273.7
Vpp (mV)
600
544
604
613
541
595
t0.5 (min)
49
13
25
30
41
17
vt0.5 (mV)
419
363
426
358
388
402
it0.5 (μA)
320
440
340
510
390
340
CE (%)
8.74
10.01
10.54
11.49
9.46
7.87
FF
0.27
0.26
0.25
0.26
0.26
0.24
Δi/Δt (μA min−1)
2.6
11.53
5.6
3.0
4.1
7.0
![Effect of variation of Fructose (reductant) concentration on power (curve ‘a’), potential (curve ‘b’) and current (curve ‘c’); [Fr] is Fructose concentration.](/content/184/2021/14/2/img/10.1016_j.arabjc.2020.102918-fig9.png)
Effect of variation of Fructose (reductant) concentration on power (curve ‘a’), potential (curve ‘b’) and current (curve ‘c’); [Fr] is Fructose concentration.
3.5 Effect of variation of surfactant (SLS) concentration
In all, the six photogalvanic cells were constructed for the study of effect of variation of SLS surfactant concentration on the cell performance (See SI, Sec.6). The optimum cell performance in terms of the isc, Ppp, ipp and CE was observed at optimal fructose reductant concentration 4 × 10⁻³ M (Table 6, Fig. 9). This trend of effect of SLS on PG cell can be explained on the basis of certain reported and observed facts. It is a reported fact that the SLS and other surfactants have good solubilizing effect on the azo group Sudan-I as it (Sudan-I) can rotate around the azo bond to have more conformational freedom (Lang, 2009). The effect of surfactant can be explained in terms of Critical micelle concentration (CMC). The CMC of a surfactant is its concentration value below which no micelles is formed and above which it forms micelles. All the added amount of surfactant over and above CMC goes to form micelles. Before CMC, the surfactant changes surface tension of the solvent strongly, and above CMC, the change in surface tension remains nearly constant with a lower slope. The CMC value is affected by pressure, temperature, and by also the presence and concentration of other surface active substances and electrolytes. *At [Fructose] = 6.4 × 10⁻⁴ M, [Dye] = 3.04 × 10⁻⁵M, Temp. = 310 K, Pt electrode area = 0.4 × 0.2 cm2, light intensity = 10.4mWcm−2, diffusion length (DL) = 5.6 cm, pH = 13.15.
Cell parameters
[SLS concentration] × 10−3 M
2.4
3.2
4.0
4.8
5.6
6.4
Vdark (mV)
623
544
596
670
702
567
Vmax (mV)
1043
1023
1020
1027
1070
1060
Voc (mV)
1034
1008
1014
1023
1061
1053
ΔV (mV)
420
479
424
357
368
493
t (min)
11
34
21
45
12
27
imax (μA)
1190
1310
1800
1700
1440
1260
isc (μA)
1070
1280
1350
1300
1270
1150
Ppp (μW)
294.7
332.9
367.8
361.9
320.9
308.8
Vpp (mV)
578
574
613
635
563
572
t0.5 (min)
23
34
30
46
55
70
vt0.5 (mV)
398
405
358
427
400
367
it0.5 (μA)
370
410
510
420
400
420
CE (%)
9.20
10.00
11.49
11.71
8.80
9.27
FF
0.26
0.25
0.26
0.27
0.23
0.25
Δi/Δt (μA min−1)
6.0
5.0
3.0
3.2
3.0
1.7
![Effect of variation of Sodium Lauryl Sulfate (surfactant) concentration on power (curve ‘a’), potential (curve ‘b’) and current (curve ‘c’); [SLS] is Sodium Lauryl Sulfate concentration.](/content/184/2021/14/2/img/10.1016_j.arabjc.2020.102918-fig10.png)
Effect of variation of Sodium Lauryl Sulfate (surfactant) concentration on power (curve ‘a’), potential (curve ‘b’) and current (curve ‘c’); [SLS] is Sodium Lauryl Sulfate concentration.
It is a well known fact that the surfactant over its critical micelles concentration (CMC) solubilizes the dye, and this dye solubility increases linearly with rise in surfactant concentration. But, it holds good for moderate concentrations of the majority of the surfactants. It is because of the fact that at very high surfactant concentration the rod like micelles are formed leading to the rise in viscosity The reported CMC value of the SLS for the Sudan-I solubility is of the order of 10−3 M. The surfactant like SLS with a straight alkyl tail gives better solubilization. It is also a reported fact that in absence of any surfactant, the solubility of hydrophobic dye like Sudan-I is almost negligible in the pH interval 3–12, but addition of SLS causes dye solubility in the range of 0.2–0.3 mM. At higher pH over the 12, the increasing pH has positive impact on the dye solubility in inner, hydrophobic part of the micelle (Tehrani-Bagha et al., 2013; Tehrani-Bagha and Holmberg, 2013).
It is also a reported fact that once the micelles have grown to a certain size the solubilization of dyes is not further facilitated by the micelles becoming even more extended, ultimately often reaching a worm-like or thread-like structure (Ozeki and Ikeda, 1985).
On the basis of these characteristics of the surfactants, the effect of SLS on cell performance may be explained. In present study, the used concentration of SLS is of the order of its CMC 10−3 M. Therefore, the use of SLS enhances the solubility of the Sudan-I dye which in turn enhances available numbers of dye sensitizer for photogalvanics leading to an increase in the cell power. The cell power increases with rise in SLS concentration as the dye solubilization increases almost linearly with increasing surfactant concentration beyond the CMC. At very high SLS concentration, the higher viscosity of the electrolyte may be attributed the reasons behind the lowering of the diffusion of ions leading to the decrease in the cell performance. Thus, the lower electrical output may be attributed to the less number of available SLS molecules (at its lower concentration side) for facilitating electron transfer by enhancing solubility and stability of dye molecules. At higher concentration side of the SLS, the increased number of SLS molecules may hinder the diffusion of the dye molecules leading to the decreased cell current and power.
The SLS solution alone also shows a potential value ∼ (-) 300 mV and current ∼ 30 µA in the dark as well as in illuminated state. This nature of contribution of SLS to the current may also be one of the reasons for enhancement of the cell power in presence of the SLS.
3.6 Effect of variation of pH
In all, the six photogalvanic cells were constructed for the study of effect of variation of pH on the cell performance (See SI, Sec.7). The optimum cell performance in terms of the isc, Ppp, ipp and CE was observed at optimal pH 13.15 (Table 7, Fig. 10). *At [Fructose] = 6.4 × 10⁻⁴ M, [SLS] = 4 × 10⁻³ M, Temp. = 310 K, Pt electrode area = 0.4 × 0.2 cm2, light intensity = 10.4mWcm−2, diffusion length (DL) = 5.6 cm, [Dye] = 3.04 × 10⁻⁵ M.
Cell parameters
pH
12.98
13.07
13.15
13.22
13.28
13.33
Vdark (mV)
578
586
596
621
633
649
Vmax(mV)
1020
1020
1020
1036
1045
1078
Voc (mV)
1015
1010
1014
1034
1039
1071
ΔV(mV)
442
434
424
415
412
429
t (min)
38
33
21
23
16
12
imax (μA)
1310
1550
1800
1400
1210
1090
isc (μA)
1170
1200
1350
1250
1130
1080
Ppp (μW)
336.0
344.5
367.8
320.6
310.8
297.0
Vpp (mV)
600
584
613
509
536
487
t0.5 (min)
34
11
30
61
41
19
vt0.5 (mV)
420
419
358
356
361
313
it0.5 (μA)
400
410
510
450
430
470
CE (%)
11.28
11.59
10.97
9.24
9.69
8.90
FF
0.28
0.28
0.26
0.24
0.26
0.25
Δi/Δt (μA min−1)
4.7
16.3
3.0
2.9
3.65
7.3
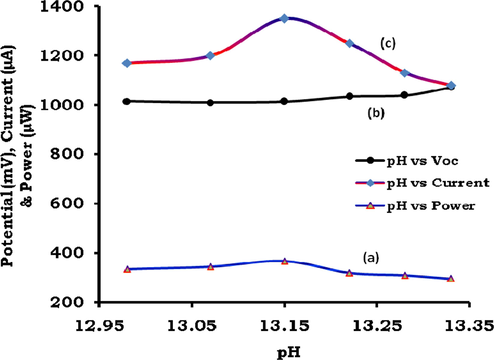
Effect of variation of pH on power (curve ‘a’), potential (curve ‘b’) and current (curve ‘c’).
To understand the effect of pH on the cell performance, the possible chemical structures (Scheme 2) (Tehrani-Bagha and Holmberg, 2013), and solubility of the azo group neutral Sudan–I at low and high pH with certain other reported facts have to be taken in to consideration.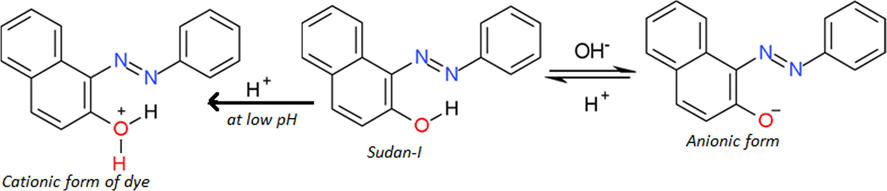
Deprotonation of Sudan-I dye sensitizer under alkaline conditions.
At higher pH, the dye will be in anionic form and in a more strong position to give electrons to the Pt electrode and reduced reductant while it is in its (dye) excited state and ground state, respectively, leading to an enhancement in the cell current. The dyes are also solubilized strongly at very high pH of the order of 12–14 leading to the enhancement in the cell output.
The anionic nature of the dye at higher pH coupled with anionic SLS may retard the aggregation behavior of the dyes in solution causing higher diffusion and current as PG cells are diffusion controlled. It is reported that the dyes’ photo- reduction with different reductants in different pH depends on the dyes’ reduction potential and reductants’oxidation potential. The redox potentials of the dyes becomes more negative with increasing pH as shown by the cyclic-voltammetric data as dye reduction will be difficult at higher pH due to less favorable protonation of the dye owing to protonation states of the leuco dyes and dyes change over the pH range (Murthy and Reddy, 1984), and preferential reduction of hydrogen cation at cathode will leads to the reduction in cell power.
This is also reported that minimum pH (12–14) is necessary for dyes to be reduced and solubilized completely supporting use of very pH 13 in present study (Nabar and Shenai, 1963).
3.7 Effect of variation of diffusion length
In all, the six photogalvanic cells were constructed for the study of effect of variation of pH on the cell performance (See SI, Sec.8). The optimum cell performance in terms of the isc, Ppp, ipp and CE was observed at optimal pH 13.15 (Table S1).
As explained previously, the photogalvanic cells are diffusion controlled cell devices in which the molecules including the dye carry the current inside the cell solution. The excited dye molecule must reach within its life time to Pt for electron transfer from the dye to the Pt. At higher diffusion length, the excited dye molecules are not able to reach the Pt within their life time leading to the reduced current. At higher diffusion length, the increased concentration gradient also diminishes the potential difference between the two electrodes leading to the reduced photo-potential. At lower diffusion length, the favorable conditions exist for excited dye molecules for reaching the Pt within life time, but in totality the number of such dye molecules will be less in number as there will be less volume of the solution between the electrodes, leading to the reduced current.
3.8 Effect of variation of temperature
In all, the six photogalvanic cells were constructed for the study of effect of variation of temperature on the cell performance (See SI, Sec.9). The optimum cell performance in terms of the isc, Ppp, ipp and CE was observed at an optimal temperature (Table S2). The temperature rise favors the photocurrent (imax) as a result of increased diffusion, and disfavors the photo-potential (Voc) as a result of disturbance in the double layer at electrode. The potential change is much higher than the current change. The rise in temperature (temperature range under observation) invariably leads to slight rise in the power output irrespective of the fall in photopotential.
The effect of temperature may be explained on the basis of certain reported and observed facts. It is a reported fact that the rise in temperature increases the solubility of hydrophobic dye like Sudan-I in the presence of the ionic surfactants due to increased (i) thermal agitation in the system, (ii) available space for solubilization in the micelle, and (iii) enthalpy term (Datyner, 1978; Rosen, 2004). From this fact, it is also clear that increased temperature will also increase the diffusion of dye molecules leading to the increased electrical performance of the diffusion controlled PG cell.
In the PG cell, the stock solutions which are used are stored at room temperature (∼25 °C to 30 °C). On illumination of the cell with illuminating source (incandescent 200 Wattage tungsten bulbs), the average 8 °C to 20 °C rise in the temperature of the electrolyte is observed. The magnitude of the rise in temperature depends on the duration of illumination (7 °C rise in about seven minutes and 20 °C rise in about 60 min). In sun, the rise in temperatures is very low (∼3 °C in 10 min). In the case of PG cells, temperature effect on efficiency is not expected adverse at high temperature range as highest achievable temperature of the cell electrolyte is 50 °C. But, there is loss of water and that can be tackled by safe sealing.
The temperature behavior of the dye based PG cells can also be understood with the help of the dye sensitized solar cells (DSSC). It is reported that the efficiency of the DSSC remains highest in the temperature range 30 °C−40 °C, and lowering in efficiency above this temperature. It is reported that the recombination kinetics in the cell is the same between −7 °C and 40 °C leading to the virtually constant efficiency and small differences in the FF associated with changes in the series resistance. Further rise in the temperature above 40 °C favors recombination kinetics lowering photo-potential and cell performance (Raga and F. F-Santiago, 2013).
3.9 Effect of variation of Pt electrode area
In all, the five photogalvanic cells were constructed for the study of effect of variation of Pt electrode on the cell performance (See SI, Sec.10). Under the observed effect of electrode area, the optimum cell performance in terms of the isc, Ppp, ipp and CE was observed at 0.30 cm × 0.25 cm (Table S3). For the observed effect of electrode area, the small Pt electrodes favors higher cell performance owing to relatively less hindrance to the diffusion of ions.
3.10 Discussions
Thus, we see that cell performance is found to be affected by variables like dye concentration, reductant concentration, pH, diffusion length, temperature, light intensity, electrode area, etc. The optimum performance of the cell can only be obtained by carefully selecting the best values for all these variables.
On the basis of optimization of cell fabrication variables (like concentrations, pH, etc), the optimal cell performance in terms of the current, power, etc. has been observed at Sudan-I dye concentration 3.04 × 10⁻⁵ M, Fructose reductant concentration 6.4 × 10⁻⁴ M, SLS surfactant concentration 4 × 10⁻³ M, pH 13.15, 0.4 cm × 0.2 cm Pt electrode area, 10.4 mW cm−2 light Intensity, 310 K temp., and 5.6 cm diffusion length. The observed optimal cell performance is as Voc 1014 mV, imax 1800 μA, isc 1350 μA, Ppp 367.8 μW, CE 11.49%, FF 0.26, current density ∼ 17 mAcm−2 and t0.5 30 min.
The photogalvanic cells based on various dyes has been reported. The Ppp 14.75 μW, isc 45 μA, CE 0.14%, FF 0.31, and t0.5 40 min is reported for Azur B dye photosensitizer with EDTA reductant andTergitol-7 surfactant (Gangotri et al., 2013). The Ppp 29.8 μW, isc 93 μA, CE 0.31%, and t0.5 65 min is reported for brilliant green and celestine blue mixed dyes with EDTA reductant (Yadav and Lal, 2013). The Ppp 162.96 μW, isc 240 μA, CE 0.70%, and t0.5 85 min is reported for Eosin dye photosensitizer with Arabinose reductant reductant system (Gangotri and Bhimwal, 2010).
The Ppp 244.02 μW, isc 972 μA, CE 7.58%, and t0.5 216 min is reported for Rhodamine B dye photosensitizer with Fructose as reductant in NaOH as alkaline medium (Koli et al., 2012).
The present photogalvanics reports advancements over the already reported work. This advancement may be attributed to the combined and cumulative effects of use of anionic SLS surfactant, small Pt electrode, relatively small MW and sized Sudan-I dye molecules, and C2H5OH alcohol as solvent for solubilization of Sudan-I dye.
The anionic surfactant leads to the increased solubility and electron donation power of the dye molecules. The small sized Pt electrode favors dye diffusion leading to the increased cell performance. The diffusion is inversely proportional to MW (Polson and Reyden, 1950), and size of the molecules and viscosity of the solvent. The MW and size of the Sudan-I (MW 248.28 gmol−1) is lower than that for Rhodamine-B (MW 479.02) (Scheme-I of SI). The viscosity of alcohol (1.1 centipoises at 25 °C) used to dissolve Sudan-I in present work is higher than that for water (0.91 centipoises at 25 °C) used to dissolve Rhodamine-B dye in reported work.
Thus, the present study on Sudan-I dye-Fructose-SLS surfactant photogalvanic system is promising for fabricating applicable and affordable PG cells (workable in natural sunlight) in the future. The present study (using Sudan-I photosensitizer) is different than earlier studies which are based on different photosensitizers Rhodamine B (Koli, 2019) and Brilliant Cresyl Blue (Koli et al., 2018).
A research field has a particular set of materials, method, experiments, observed variables, explanations, etc. The present manuscript reports advancement in photogalvanic cells by modifying cell fabrication at sensitizer, reductant, surfactant, conc., Pt electrode, etc. In present work, in addition to Sudan-I photosensitiser, the all means reported in literature for increasing cell performance have been used in combination at a time to claim change in the routine cells. The changes are use of anionic SLS surfactant (Groenen et al., 1984; Madhwani et al., 2007; Mukhopadhyay and Bhowmik, 1993) with very small Pt electrode (Koli et al., 2012), use of SCE terminal of combination electrode (Koli et al., 2012), high pH (Koli et al., 2012), well cleaned and scratched Pt electrode (Koli et al., 2012), etc. It is well known fact that the anionic SLS surfactant facilitates cell performance by increasing dye solubility and discouraging back reaction. The Gangotri (Gangotri and Gangotri, 2013) has shown more than two times increase in cell efficiency by use of this anionic SLS surfactant (CE 0.72% with SLS, and CE 0.33% without SLS). Thus, the increase in CE in present work on use of SLS is expected and justified.
It is reported in the Arabian Journal of Chemistry (AJC) (Koli, 2017) that the Sudan-I dye photo-sensitizer with fructose reductant and SLS surfactant combination is a very good photogalvanic system for fabrication of highly efficient PG cells workable in the natural sunlight. The study reported in AJC is based on illumination of photogalvanic cells with natural sunlight intensity. The present work is based on a different set of experiments with different results (different than that in AJC). The experimental conditions used in present work distinguish it from already published work. The already published work was studied in daily life natural conditions like the natural sunlight ∼ 1000 Wm−2. Whereas, the present study has been done at the artificial and low sunlight intensity ∼ 10.4 mWcm−2.
The set of experiments used in published work of AJC is natural sunlight intensity 100 mW cm−2, Sudan-I dye photo-sensitizer concentration 10.37 × 10⁻⁵ M, Fructose reductant concentration 2.37 × 10⁻³ M, SLS surfactant concentration 1.48 × 10⁻² M, 36.0 mL of 1 M NaOH (pH 13.72), and 6.3 cm diffusion length.
The set of experiments used in present work is artificial and low sunlight intensity (10.4 mW cm−2), 0.38 mL of M/500 Sudan-I dye (resultant concentration 3.04 × 10⁻⁵ M), 1.6 mL of M/100 Fructose (resultant concentration 6.4 × 10⁻⁴ M), 1.0 mL of M/10 SLS (resultant concentration 6.4 × 10⁻³ M), 3.6 mL of 1 M NaOH (resultant pH 13.72), and 5.6 cm diffusion Length.
The results reported in AJC are 1081.1 μW maximum powers, 4200 μA short-circuit current, and 1048 mV open-circuit. The results in present work are different (367.8 μW maximum powers, 1350 μA short-circuit current, and 1014 mV open-circuit).
The study reported in Arabian Journal of Chemistry (AJC) was done in Jodhpur (Latitude 26.2389, Longitude 73.0243) situated in western part of the Rajasthan. Rajasthan has more than 325 sunny days in a year with solar radiation of about 6–7 Kwhm−2day−1. Jodhpur in Rajasthan is receiving maximum solar radiation (up to 1250 Wm−2) which is known as Sun City of India. The sky in Jodhpur is clear almost round the year, and it was also during the study reported in AJC. So, the natural sun intensity was ∼ 1000 Wm−2 for the location of the study reported in the AJC.
But, it is to be noted that the global distribution of natural sun intensity is not same. Some places like California, Jodhpur, etc. receives highest sun intensity, and some places like north and south poles of Earth receives very less intensity. At a given place like Jodhpur, the sun intensity may vary from morning to evening hours. Therefore, the photogalvanic cells should be shown to work at high as well as low illumination intensity to meet energy needs of whole global community. Therefore, the present study of Sudan I- Fructose has been done at low sunlight intensity ∼ 10.4 mWcm−2 to explore the Photogalvanic cells for use in area receiving low sun intensity. There were mainly two assumptions/anticipations, (a) the cell performance should be enhanced if best possible reported cell fabrication variables are put together using Sudan- I photosensitizer; and (b) cell based on Sudan-I photosensitizers should also be workable in low illumination intensity. On both these counts, the observed results have been on expected lines of assumptions/anticipations. The chosen chemical system of Sudan-I dye sensitizer-anionic surfactant SLS- alkaline medium in present work has not only shown workability in low intensity illuminating source, but also very impressive optimal cell performance (i.e., isc 1350 μA, Ppp 367.8 μW and CE 11.49%). The observed results in present work clearly establish the novelty, originality and advancement over the already published PG cell performance (isc 972 μA, Ppp 244.02 μW, CE 7.58%) (Koli et al., 2012).
It is reported by Albery & Archer that the maximum power is unlikely to be greater than 10−6 Wcm−2 under some conditions like that both the electrodes are of same material and same area, all diffusion coefficients are same, etc. (Albery and Archer, 1977). Here it is clarified that the Albery & Archer have actually talked about the power density (i.e., Wmax/A ∼ 10−6 Wcm−2) with the remark that the most real PG systems shall not be able to fulfill the necessary conditions assumed for this conclusion of maximum power density. The power is reported by Albery & Archer to be affected by interplay of various factors like photochemistry, homogeneous kinetics, mass transport, electrode kinetics, reaction kinetics and concentrations. In present manuscript, author has reported power, but not power density. Author has reported power 367.8 μW, but not power 367.8 W. Further, the present manuscript has used two different electrodes, i.e., Anodic Pt in illuminated chamber and cathodic SCE in dark chamber, whereas the Albery & Archer used identical electrodes. Present manuscript is based on chemicals of different diffusion coefficients, whereas the Albery & Archer assumed of identical diffusion coefficients. Therefore, the conditions in present manuscript are different than that described by Albery & Archer, and these scientists have himself remarked that power output is result of interplay of various factors. Therefore, the experimentally observed power 367.8 μW in present work is realistic and justified by the concepts of Albery & Archer and also by our own previously published works (Koli, 2019; Koli et al., 2012; Koli and Sharma, 2016; Sharma et al., 2011).
According to Albery, the realistic CE is 5%−9%. It is pertinent to note here that Albery himself has estimated CE 18%, if all necessary conditions could be met. Therefore, the CE ∼ 11% observed in present study by using at a time all favorable cell fabrication variables and conditions necessary for optimal cell performance is well within the limit laid down by the Albery. It be noted that this efficiency ∼ 11% is repetitive any number of times under optimal conditions and method as described in this paper. This efficiency is validated by reputed photochemistry lab of one of the eminent photogalvanicist.
The efficiency has also been estimated by using method as “cell illuminated by the light for a defined period of time to calculate the received optical energy by the cell (integration of power over time) then transferring the stored energy to an external load and measuring the total delivered energy”. The estimation of power extracted from cell in dark (Power output) and power (sunlight) absorbed is ∼ 1.015128 J and ∼ 12.43176 J, respectively. The estimated efficiency from formula [(Power output × 100%)/ (power absorbed)] is ∼ 8.165%. Actual power output will be higher than estimated 1.015128 Joule because actual area under power vs time will be higher than estimated, and accordingly estimated efficiency will be as high as the calculated efficiency ∼ 11.49 (from Eq. (2). Present estimation of power is limited on the basis of already available research data (SI, sec.3).
In literature, various formulas are reported for the calculation of the solar energy conversion efficiency of the photogalvanic cells (Koli et al., 2020). Potter and Thaller (Potter and Thaller, 1959) have defined the power efficiency as [(½ E0c Ic/ (∊N)], where E0c is zero current voltage, Ic is the short circuit current, Є is the energy per absorbed photon and N is the number of photons absorbed per second. Clark and Eckert (Clark and Eckert, 1975) have defined Sunlight Engineering Efficiency as [(maximum Power × 100)/(incident sunlight power)]. Murthy et al. (Murthy et al., 1980) have defined conversion efficiency as [(Voc × isc × fill factor × 100)/(cross sectional area of electrode × Incident Sunlight Power)]. A review paper on photogalvanic cells have reported calculation of conversion efficiency as [(electrical power output (in watts) at its maximum power point × 100)/(input light in Wm−2 × electrode area of the photogalvanic cell in m2)] (Malviya and Solanki, 2016). The fill factor of photogalvanic cells is disproportionately low in comparison to conversion efficiency. Both the parameters (fill factor and efficiency) are indicator of solar energy conversion capacity of the photogalvanic cells. Therefore, the solar efficiency of cell as without linked to fill factor and linked to fill factor has also been defined as [(power at power point in mWm−2 × 100%)/(illuminating intensity in mWm−2 × Pt working electrode area in cm2], and [(power at power point in mWm−2 × fill factor × 100%)/(illuminating intensity in mWm−2 × Pt working electrode area in cm2)], respectively (Koli et al., 2012; Koli and Sharma, 2017). In present research work, the cell efficiency has been calculated as [(power at power point in mWm−2 × fill factor × 100%)/(illuminating intensity in mWm−2 × Pt working electrode area in cm2]. The justification of using this formula is explained as follows. The size of the open window has not been used for calculating the efficiency as- (i) the sunlight strike at illuminating window of the cell. The sunlight being of wave nature has phenomenon of scattering as well the diffraction at hole/barrier. The photogalvanic cells use very dilute solution of dye/pigments. The light diffraction effect and edge effect effectively illuminate the larger solution area, (ii) the PG cell is diffusion controlled, and therefore, only those dye molecules which are nearer to Pt anodic electrode shall be able to reach the electrode within their excited life time. It means that the number of such dye molecules shall be determinable with respect to Pt area, but not the illuminating area of the cell window size; (iii) the illuminating natural sunlight is free and available naturally leading to no change in cost and environmental pollution on account of illumination of the small or large area of the cell. The Pt size matters for the economic and ecological cost as use of its small size will be less costly and more eco-friendly; (iv) The Pt anode area (instead of cell illumination area) for calculation of the efficiency is also supported by Murthy et al. (Murthy et al., 1980), who have used cross sectional area of the anode for the calculation of solar engineering efficiency; and (v) The photogalvanic cells can also be charged at low illuminating efficiency (Koli et al., 2012). Therefore, the small or large sized illuminating window hardly matters for charging of the cell. The surface area of the window used to illuminate the cell is 1 cm × 1 cm.
The theoretically highest possible Voc for band gap of 2.6 eV is 2.24 V. In present case, the observed Voc for Sudan-I (band gap 2.6 eV) is only 1.01 V. However, it may be noted that for dye sensitized solar cells like PG cells, the low Voc may be one of the factor for their relatively low efficiency in comparison to that for PV cells. The low Voc may be attributed to the non-optimized energy levels of the dye sensitizers with respect to the redox potential of the electrolyte (Ruhle, 2016).
With these discussions for the optimization of cell performance at optimal cell fabrication parameters, the results and advancement of present study may be compared with already reported work on PG cell. The work reported in recently published papers (Gangotri et al., 2013; Gangotri and Bhimwal, 2010; Yadav and Lal, 2013) has not used the all means reported in literature for increasing cell performance. The present study involves the use of anionic SLS surfactant (Groenen et al., 1984; Madhwani et al., 2007; Mukhopadhyay and Bhowmik, 1993) with very small Pt electrode (Koli et al., 2012), use of SCE terminal of combination electrode (Koli et al., 2012), high pH (Koli et al., 2012), well cleaned and scratched Pt electrode (Koli et al., 2012), low molecular weight, etc. Whereas, the recently published papers are based on large Pt, normal SCE, low pH, surfactant other than SLS (Gangotri et al., 2013), and no surfactant use (Gangotri and Bhimwal, 2010; Yadav and Lal, 2013).
In the present study, there is no confusion regarding the effect of light intensity and dye material. For the given concentration of chemicals used in a cell, the optimum cell performance is at optimum illumination intensity. Keeping this concentration constant, any upward or downward change in intensity will decrease electrical output of the cell. But, if higher illumination intensity is used with higher optimal concentration of chemicals then the electrical output of the cell will be high (Mosquera et al., 1994). Regarding the dye nature, the light dye molecules have been found to show better cell performance (Koli et al., 2012).
Among the all techniques like photogalvanic cells (Gangotri and Lal, 2014), photovoltaic cells (PV), dye-sensitized solar cells (Guo et al., 2013; Yu and Fan, 2010; Zhang et al., 2013), etc., the PV technique is commercially popular world over for solar electricity generation. The use of solar techniques during odd hours like during the night time and no wind time requires inherent power storage capacity. It is because use of the external power storage devices shoots up prices. It is here, the photogalvanic cell has potential for inherent storage capacity in a cheaper manner as these cells are fabricated using very dilute solutions of cheap chemicals like photo-sensitizers, reductant, NaOH and surfactant.
The eco-friendly nature of the use of Sudan-I based PG cells can be enhanced by removal of exhausted cell solution containing this dye by decolorization process using Shewanella Oneidensis MR-1 method which removes 66.8% of the Sudan-I in 104 h, by reducing it to aniline. In this method, the higher lactate or biomass concentration was found most efficient electron donor for Sudan-I reduction (Ji et al., 2012). This dye removal method also gives hint for the use of lactate as reducing agent in Sudan-I based PG cells for future research.
4 Conclusion
The use of Sudan-I dye photosensitizer-Fructose reductant-SLS surfactant combination in photogalvanic cell was planned with the aim of further enhancing performance of these cells. The results obtained for this combination have been found very encouraging according to aim of the present work as results are significantly better than reported results in the field of photogalvanics. The Sudan-I dye - Fructose-SLS combination based photogalvanic cells also shows optimum performance in optimal conditions.
Therefore, the Sudan-I dye-Fructose-SLS combination is a good alternative for use in fabrication of highly efficient photogalvanic cells.
Acknowledgements
The author is thankful to Department of Chemistry, J.N.V. University, Jodhpur, Rajasthan (INDIA) for providing all necessary laboratory facilities.
Declaration of Competing Interest
The authors declare that they have no known competing financial interests or personal relationships that could have appeared to influence the work reported in this paper.
References
- Optimum efficiency of photogalvanic cells for solar energy conversion. Nature. 1977;270:399.
- [Google Scholar]
- Photogalvanic cells: II. current-voltage and power characteristics. J. Electrochem. Soc.. 1977;124:688.
- [Google Scholar]
- Photogalvanic cells: Part IX. Investigations using the transparent rotating disc electrode. J. Electroanal. Chem.. 1979;107(1):11.
- [Google Scholar]
- On electron effects under the influence of solar radiation. Comptes Rendues de 'l', Academic Science Paris. 1839;9:561.
- [Google Scholar]
- A comparative study on the performance of photogalvanic cells with different photosensitizers for solar energy conversion and storage: D-Xylose-NaLS systems. Energy. 2011;36(2):1324.
- [Google Scholar]
- The solubilization of disperse dyes by dispersing agents at 127 °C. J. Soc. Dyers Colour.. 1978;94:256.
- [Google Scholar]
- Editorial, Solar Energy Materials & Solar Cells, 133 (2015) A1–A6.
- Use of trypan blue-arabinose system in photogalvanic cell for solar energy conversion and storage. Int. J. Eng. Sci. Res. Technol.. 2014;3:447.
- [Google Scholar]
- Use of tergitol-7 in photogalvanic cell for solar energy conversion and storage: Toluidine blue-glucose system. Int. J. Energy Res.. 1996;20(7):581.
- [Google Scholar]
- The use of tergitol-7 in photogalvanic cells for solar energy conversion and storage: An EDTA–azur B system. Energy Sources Part A. 2013;35(4):312.
- [Google Scholar]
- The photochemical conversion of solar energy into electrical energy: Eosin-Arabinose system. Int. J. Electr. Power Energy Syst.. 2010;32:1106.
- [Google Scholar]
- Studies of the micellar effect on photogalvanics: solar energy conversion and storage in EDTA−safranine O−tween-80 system. Energy Fuels. 2009;23(5):2767.
- [Google Scholar]
- Studies of the micellar effect on photogalvanics: solar energy conversion and storage-EDTA-safranine O-NaLS system. Energy Sources Part A. 2013;35:1007.
- [Google Scholar]
- Study of the enhancement on photogalvanics: solar energy conversion and storage in EDTA-safranine O-NaLS system. Sustainable Energy Fuels. 2017;1:882.
- [Google Scholar]
- Photogalvanic solar energy conversion: Study with photosensitizers Toluidine Blue and Malachite Green in presence of NaLS. Appl. Energy. 2009;86(9):1431.
- [Google Scholar]
- Triton X-100 micelles in the ferrous/thionine photogalvanic cell. J. Phys. Chem.. 1984;88(7):1449.
- [Google Scholar]
- Highly efficient telluride electrocatalysts for use as Pt-free counter electrodes in dye-sensitized solar cells. Chem. Commun.. 2013;49:10157.
- [Google Scholar]
- The photovoltaic effect in the chlorophyll–ascorbic acid system. Roczniki Chemii. 1958;32:107.
- [Google Scholar]
- The Becquerel effect in the presence of dyes and the action of light on dyes. Proc. Royal Soc. London A. 1953;216:458.
- [Google Scholar]
- Removal of water-insoluble Sudan dyes by Shewanella oneidensis MR-1. Bioresour. Technol.. 2012;114:144.
- [Google Scholar]
- Electron transfer in the quenching of protonated triplet thionine and methylene blue by ground state thionine. J. Photochem.. 1982;18(3):197.
- [Google Scholar]
- Photopotential and photocurrent induced by a tolusafranine ethylenediaminetetraacetic acid system. J. Phys. Chem.. 1977;81(12):1213.
- [Google Scholar]
- Sodium lauryl sulphate enhanced solar energy conversion by photogalvanic effect of Rhodamine B-fructose in artificial light. Chem. Select. 2016;1(15):4624.
- [Google Scholar]
- Surfactant and natural sunlight enhanced Photogalvanic effect of Sudan I dye. Arabian J. Chem.. 2017;10(8):1077.
- [Google Scholar]
- Photogalvanic effect of natural photosensitizer (crude Spinach extract) in artificial light for simultaneous solar power generation and storage. Environ. Prog. Sustainable Energy. 2018;37(5):1800.
- [Google Scholar]
- Enhancing efficiency of Fast Green FCF –Fructose photogalvanic solar cell by using surfactant in natural sunlight. Int. J. Ambient Energy. 2019;40(8):868.
- [Google Scholar]
- Energy conversion in electrolyte under artificial light: Fast Green FCF–Fructose-Surfactant- small Pt electrode photogalvanic cell. Appl. Solar Energy. 2016;52(2):76.
- [Google Scholar]
- Photogalvanic effect of Brilliant Cresyl Blue-Fructose-surfactant-small Pt electrode-artificial light: Simultaneous solar energy conversion and storage. Energy Sources, Part A: Recovery, Utilization, and Environmental Effects. 2018;40:2163.
- [Google Scholar]
- Solar energy conversion and storage: Rhodamine B - Fructose Photogalvanic cell. Renewable Energy. 2012;37(1):250.
- [Google Scholar]
- Photochemical solar power and storage through Photogalvanic cells: Comparing performance of dye materials. Energy Sources Part A. 2017;39(6):555.
- [Google Scholar]
- Simultaneous electrochemical solar power and storage by using the alkaline Metanil Yellow-Formic acid as a new sensitizer-reductant couple in the photogalvanic cells. RSC Adv.. 2019;9:7560.
- [Google Scholar]
- Use of Congo red dye-formaldehyde as a new sensitizer-reductant couple for enhanced simultaneous solar energy conversion and storage by photogalvanic cells at the low and artificial sun intensity. Sci. Rep.. 2020;10:19264.
- [Google Scholar]
- Dyes and Pigments. New York: New Research Nova Science Publisher; 2009.
- Electrochemical reduction as a powerful tool to highlight the possible formation of by-products more toxic than Sudan III dye. Int. J. Electrochem. Sci.. 2012;7:7784.
- [Google Scholar]
- Use of fluoroscein-EDTA System in photogalvanic cell for solar energy conversion. Energy Sources, PartA: Recovery, Utilization, and Environ. Effects. 2007;29(8):721.
- [Google Scholar]
- Photogalvanics: A sustainable and promising device for solar energy conversion and storage. Renew. Sustainable Energy Rev.. 2016;59:662.
- [Google Scholar]
- Studies of surfactants in photogalvanic cells-NaLS-EDTA and azur-B. J. Chem. Sci.. 2004;116(3):179.
- [Google Scholar]
- Electrochemical determination of trace sudan I contamination in chili powder at carbon nanotube modified electrodes. Sensors. 2008;8:1890.
- [Google Scholar]
- Mechanism and kinetics of the degradation of chlorophylls during the processing of green table olives. J. Agric. Food. Chem.. 1994;42(5):1089.
- [Google Scholar]
- Kinetics of photoinduced electron transfer in a photoelectrochemical cell consisting of thiazine dyes and Triton X-100 surfactant. J. Photochem. Photobiol., A. 1993;69(3):363.
- [Google Scholar]
- Photogalvanic effect in riboflavin–ethylenediaminetetraacetic acid system. Int. J. Energy Res.. 1980;4:339.
- [Google Scholar]
- Cyclic-voltammetric studies of some phenothiazine dyes. J. Chem. Soc. Faraday Trans.. 1984;I(80):2745.
- [Google Scholar]
- Reduction potentials of vat dyes and their relation to the ease of reduction and tendering behavior. Text. Res. J. 1963:471.
- [Google Scholar]
- Kinetics of dark back reaction of products of the photoreduction of triplet thionine by iron (II). Evidence for association of leucothionine and semithionine with iron (III) J. Phys. Chem.. 1978;82(16):1778.
- [Google Scholar]
- The difference in solubilization power between spherical and rodlike micelles of dodecyldimethylammonlum chloride in aqueous solutions. J. Phys. Chem.. 1985;89:5088.
- [Google Scholar]
- Photogalvanic behaviour of [Cr2O2S2(1-Pipdtc)2(H2O)2] in aqueous DMF. Sol. Energy Mater. Sol. Cells. 2009;93(2):244.
- [Google Scholar]
- Use of anionic micelles in photogalvanic cells for solar energy conversion and storage dioctylsulfosuccinate-mannitol-safranine system. Energy Sources Part A. 2007;29(13):1253.
- [Google Scholar]
- The photogalvanic effect I. The photochemical properties of the thionine-iron system. J. Chem. Phys.. 1940;8(7):551.
- [Google Scholar]
- Raga, S.R., -Santiago, F.F, 2013. Temperature effects in dye-sensitized solar cells. Phys. Chem. Chem. Phys., 15, p. 2328.
- The action of light on the ferrous iodine iodide equilibrium. J. Chem. Soc., Trans.. 1925;127:258.
- [Google Scholar]
- Surfactants and Interfacial Phenomena (3rd ed.). New York: Wiley; 2004.
- Tabulated values of the Shockley-Queisser limit for single junction solar cells. Sol. Energy. 2016;130:139.
- [Google Scholar]
- Brilliant Cresyl Blue - Fructose for enhancement of solar energy conversion and storage capacity of photogalvanic solar cells. Fuel. 2011;90(11):3336.
- [Google Scholar]
- Photochemical conversion and storage of solar energy. Solar Power Fuels. (Proc Int. Conf.). 1977;1st:1-25.
- [Google Scholar]
- Investigation of manganese-molybdenum-diethyldithiocarbamate complex as a potential system for solar energy conversion. Int. J. Energy Res.. 1999;23(3):229.
- [Google Scholar]
- Solubilization of two organic water-insoluble dyes by anionic, cationic and non-ionic surfactants. Colloids Surf., A. 2013;417:133.
- [Google Scholar]
- On the thermodyanamic limit of photovoltaic energy conversion. Applied physics. 1981;25:119.
- [Google Scholar]
- Correlation of open-circuit voltage and short-circuit current of the totally illuminated, thin-layer iron-thionine Photogalvanic cell with photostationary composition. J. Am. Chem. Soc.. 1978;100(21):6568.
- [Google Scholar]
- Optimization of performance characteristics of a mixed dye based photogalvanic cell for efficient solar energy conversion and storage. Energy Convers. Manage.. 2013;66:271.
- [Google Scholar]
- Li Zhao, Dye-sensitized solar cells based on hollow anatase TiO2 spheres prepared by self-transformation method. Electrochim. Acta. 2010;55:597.
- [Google Scholar]
- Improvement of spectral response by co-sensitizers for high efficiency dye-sensitized solar cells. J. Mater. Chem. A. 2013;1:4812.
- [Google Scholar]
Appendix A
Supplementary material
Supplementary data to this article can be found online at https://doi.org/10.1016/j.arabjc.2020.102918.
Appendix A
Supplementary material
The following are the Supplementary data to this article:


