

Surface modification of iron oxide nanoparticles with κ-carrageenan/carboxymethyl chitosan for effective adsorption of bovine serum albumin
⁎Corresponding author. Tel.: +98 34470164, +98 4212276060; fax: +98 34458384, +98 4212276060. hosseinetemadi39@yahoo.com (Hossein Etemadi)
-
Received: ,
Accepted: ,
This article was originally published by Elsevier and was migrated to Scientific Scholar after the change of Publisher.
Peer review under responsibility of King Saud University.
Abstract
This paper describes preparation of novel magnetic and pH-sensitive nanocomposite beads through an environmentally friendly route for protein adsorption. Magnetic Fe3O4 nanoparticles (MNPs) were modified by a binary mixture of κ-carrageenan/carboxymethyl chitosan biopolymers. The structural and adsorption properties of new product were confirmed by TEM, SEM, VSM, XRD and UV/vis techniques. The protein adsorption performance of magnetic κ-carrageenan/carboxymethyl chitosan (mCMChitoCar) was investigated using bovine serum albumin (BSA) as a model protein. The results exhibited that the adsorption kinetic followed well the pseudo-second-order kinetic model, whereas the equilibrium adsorption data were interpreted by the Langmuir isotherm model. On the basis of pH studies, the maximum adsorption of BSA onto mCMChitoCar particles was obtained in the close of isoelectric point of BSA (73.3 mg BSA/g adsorbent). The thermodynamic parameters depicted the spontaneity and exothermic nature of adsorption process.
Keywords
Magnetic
Nanocomposites
BSA
Adsorption
Kinetic
Isotherm

1 Introduction
Proteins are responsible for physiological functions and play a crucial role in metabolism, gene expression, and signal transduction. Protein adsorption is a complex phenomenon which is strictly related to the physical and chemical properties of the substrate and protein. Therefore, it is of great significance to improve our knowledge of the mechanism involved in protein adsorption (Chen et al., 2014). The theories describing protein adsorption have been a controversial issue among scientists, as it can be occurred as a result of a variety of interactions between protein molecules and substrate. The amount of protein molecules adsorbed onto the surface of a potential substrate is driven by the net influence of variety of interactions between protein molecules and substrate including van der Waals forces and electrostatic forces (Salloum and Schlenoff, 2004). The factors affecting these interactions cover either the properties of protein such as charge and charge distribution or the solution properties such as ion strength, initial protein concentration and initial pH of solution (Murphy et al., 2000). Protein adsorption onto different substrates including hydroxyapatite (Swain and Sarkar, 2013), gold nanoparticles (Chaudhary et al., 2014), silica (Song et al., 2011), graphene (Cheng et al., 2014), and magnetic-based materials (Wei et al., 2012; Zhang & Zhang et al., 2013) has been reported. Of all the available technologies, magnetic separation based on MNPs is nowadays one of the most important trends in biotechnology research especially in protein adsorption and purification (Peng et al., 2004). In particular, magnetic nanoparticles open up immense opportunities for applications in much fundamental and applied science because of possessing superior characteristics such as superparamagnetism, high surface-to-volume ratio, high field saturation and biocompatibility (Jiang et al., 2004). However, the main challenge is self-aggregation of magnetic nanoparticles because of their high surface energy and strong magnetic dipole–dipole interactions (Albanese et al., 2012). Therefore developing well-defined strategies for fabrication of functionalized magnetic Fe3O4 nanoparticles with well-considered nanostructures is in great demand. In this regard, different classes of materials have been developed extensively for bioseparation application. Notably some of reported Fe3O4-based nanostructures are hydrophobic which are disadvantageous for bioapplications in aqueous media (Guo et al., 2009; Zhang et al., 2011; Yang et al., 2005; Yao et al., 2012). Accordingly, it is worthwhile to introduce an effective strategy for producing magnetic structures with carboxyl or hydroxyl hydrophilic functional groups. In this regard, many efforts have been mainly directed to the synthesis of non-toxic and hydrophilic biopolymers-based biopolymers such as, chitosan, alginate and κ-carrageenan for biomedical application (Jayakumar et al., 2010; Lee and Mooney, 2012). The main objective of present research was to assess the ability of novel hydrophilic affinity based on magnetic κ-carrageenan/carboxymethyl chitosan nanoparticles for adsorption of BSA. Carboxymethyl chitosan is one of the most important derivatives of chitosan polysaccharide. Because of carboxylate (–CO2−) and amine (–NH2) pendants, the interest on using of carboxymethyl chitosan has been extended for protein adsorption (Luo et al., 2013). Similar to carboxymethyl chitosan, considerable attention has been drawn toward new carrageenan-based materials due to non-toxicity, biodegradability, and biocompatibility of this biopolymer (Lima et al., 2013). In this report, we employed an in-situ technique for the synthesis of MNPs in the presence of biopolymers. For this purpose, first the iron ions-loaded κ-carrageenan/carboxymethyl chitosan beads were prepared. Then, the iron ions entrapped in the beads were treated with ammonia and subsequently MNPs were formed. Finally, a solution consisting of K+/Ca2+ ions was used for crosslinking the obtained magnetic nanocomposites. To evaluate the main process involved in adsorption mechanism, different experiments including initial concentration of BSA, pH and ion strength of solution, and temperature were carried out. According to results it was found that electrostatic interactions play a key factor on adsorption process.
2 Experimental
2.1 Chemicals and reagents
Bovine serum albumin (BSA; MW 67 kDa) was purchased from Sigma Chemical Company. κ-Carrageenan was obtained from Condinson Company (Denmark). N, O-Carboxy methyl chitosan was obtained from Sigma Chemical Company (Germany). The molecular weight and purity were 300,000 Da and 98%, respectively. All other chemicals were analytical grade and used without any purification.
2.2 Preparation of magnetic carboxymethyl chitosan/carrageenan nanoparticles
The magnetic nanocomposites were prepared via in-situ co-precipitation of iron ions in the presence of binary mixture of N,O-carboxymethyl chitosan and κ-carrageenan. The required amounts of initial materials for synthesis of nanocomposites are shown in Table 1. In brief, 1 g of κ-carrageenan was poured in 25 mL of distilled water and the temperature was adjusted at 70 °C. Carboxymethyl chitosan solution was prepared separately by dissolving 1 g of this biopolymer in 25 mL of distilled water. Two solutions were mixed together and the temperature was adjusted at 70 °C. Then, the desired amount of FeSO4·7H2O and FeCl3·6H2O salts was dissolved in 5 mL of water (the molar ratio of nFe+2/nFe+3 = 0.625/1) (Zhang et al., 2012). For fabrication of magnetic nanoparticles in the presence of biopolymers, the 3 M NH3 was slowly dropped into a solution and the dark magnetic nanoparticles were prepared. The pH of solution was adjusted at 10 and allowed to stir at 70 °C for 1 h. The magnetic nanocomposites were washed with distilled water and finally, immersed into crosslinking solution (0.2 M KCl and 0.2 M CaCl2) and stirred slowly for 60 min. The cross-linked magnetic nanocomposite beads were washed with distilled water and dried at ambient temperature until reaching a constant weight. The non-magnetic beads (CMChitoCar) were synthesized under the same condition as magnetic nanocomposites without the addition of iron ions or treating with ammonia solution. For the adsorption process, the mCMChitoCar nanocomposites were activated by glutaraldehyde. For this purpose, we followed the procedure reported by Z. Wang et al. (2013). Twenty milligrams of magnetic beads was dispersed in 5 mL phosphate buffer solution (PBS, pH 7.4) with 5% glutaraldehyde solution (V/V). The mixtures were then sonicated for 15 min and then left on a shaker with 150 rpm for 60 min. The resultant nanocomposites were washed with PBS to remove any unreacted chemicals and followed for the adsorption of BSA.
| k-Carrageenan (g) | CMchitosan (g) | FeCl3·6H2O (g) | FeSO4·7H2O (g) | |
|---|---|---|---|---|
| CMChitoCar | 1 | 1 | 0 | 0 |
| mCMChitoCar1 | 1 | 1 | 4 | 2.5 |
| mCMChitoCar2 | 1 | 1 | 8 | 5 |
| mCMChitoCar3 | 1.5 | 0.5 | 4 | 2.5 |
2.3 Swelling measurement
The kinetic of water absorbency of prepared nanoparticles was determined in distilled water. Dry nanocomposites (∼0.2 g) were placed in distilled water and kept at a constant temperature, 20 ± 0.5 °C. Swollen nanocomposites were periodically removed and weighted and the water absorbency was measured according to Eq. (1):
2.4 Structural characterization
Dried nanocomposites were coated with a thin layer of gold and imaged in a scanning electron microscopy spectroscopy (SEM; Vega, Tescan). The magnetic properties of the nanocomposites were studied with a vibrating sample magnetometer (VSM, Model 7400, Lakeshore Company, USA). It may be noted that the magnetic nanocomposites in powdered form were used to investigate the magnetic properties of nanocomposites. The un-cross-linked and wet nanocomposites were dispersed in ethanol and transmittance electron microscopy (TEM) micrographs were recorded with a Zeiss EM-900 operating at 80 kV tension. One-dimensional wide angle X-ray diffraction (XRD) patterns were obtained by using a SiemensD-500 X-ray diffractometer with wavelength, ʎ = 1.54 Å (Cu Kα), at a tube voltage of 30 kV, and tube current of 30 mA. The zeta potentials of CMChitoCar and mCMChitoCar were measured at different pH using a Brookhaven Zeta Plus 90 analyzer. Samples were prepared by diluting 20 mg of both particles in 10−3 M NaNO3 solution at different pH’s adjusted with diluted HNO3 and NaOH. Ultraviolet–visible (UV–vis) absorption spectra were measured on an UV–VIS-NIR spectrophotometer (Shimadzu UV-3600, Japan).
2.5 Batch adsorption studies
All adsorption experiments were examined through a batch method on a shaker with a constant speed at 120 rpm by immersing the 50 mg of adsorbents in 10 mL BSA solution. In the first attempt, the effect of contact time on the adsorption capacities of CMChitoCar and mCMChitoCar nanocomposites was investigated at a pH of 4.7 (isoelectric point of BSA) and an ionic strength of 0.01 M with concentration of 200 mg L−1. The amount of BSA adsorbed was calculated by subtracting the amount found in the supernatant solution after adsorption from the amount of protein present before addition of the adsorbent mCMChitoCar nanocomposites by UV absorption spectrometer at λmax = 280 nm using Eq. (2):
3 Results and discussion
3.1 Synthesis and characterization
An easy green synthetic method was performed for synthesizing nano-sized MNPs in biopolymer matrix via in-situ co-precipitation of iron ions under alkaline condition (Scheme 1). In this protocol, MNPs were directly synthesized in aqueous media as a colloidal stable system. Firstly, the biopolymers solution was dropped into solutions comprising Fe2+/Fe+3 ions for formation of beads through ionic crosslinking. The (Fe2+/Fe3+)-crosslinked beads were kept in ammonia solution to form magnetic Fe3O4 nanoparticles in biopolymer matrix. The synthesis procedure consists of the precipitation of ferric and ferrous ions by adding NH3 to a solution:
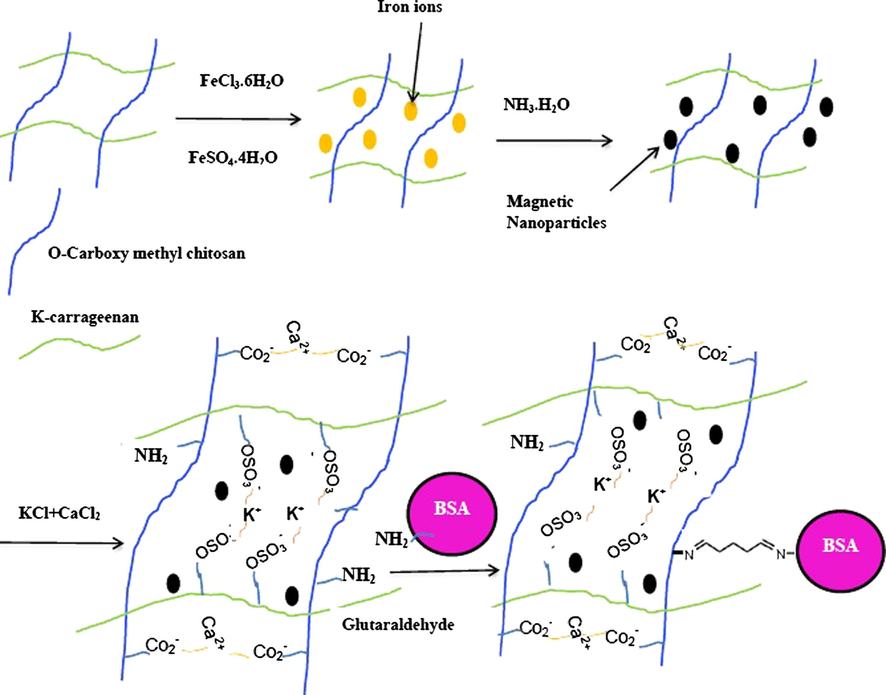
- Schematic illustration of the synthesis of magnetic κ-carrageenan/carboxymethyl chitosan nanocomposites.
Finally, the generated magnetic nanocomposites were immersed in a saline solution containing KCl and CaCl2 salts. The crosslinking of biopolymers by K+/Ca2+ can be achieved via electrostatic interaction of K+ cations with sulfate groups (–OSO3−) on k-carrageenan and also Ca2+ cations with carboxylate group (–CO2−) on carboxymethyl chitosan (Z. Wang at al., 2013; Morris et al., 1980). None of the materials used in this protocol were toxic. This procedure also shows the superiority over other synthetic strategies including green reaction media, easy purification of the products and high yield (Shundo et al., 2012). The magnetic nanocomposites were characterized by SEM, XRD, TEM, and VSM techniques.
3.2 SEM studies
In order to investigate the effect of magnetic nanoparticles on the morphology of nanocomposites, SEM images were applied. It was found that the quantity of MNPs plays an important role in changing the morphology of the products. The non-magnetic (CMChitoCar) beads showed a smooth and tight surface (Fig. 1a). Interestingly, incorporation of magnetic nanoparticles significantly affected the morphology of nanocomposites. As could be seen from Fig. 1b and c, a rough structure was obtained for magnetic nanocomposites. Obviously, the more the amount of MNPs is, the stronger the rough surface of biopolymers are; therefore, magnetic nanocomposites exhibited more compact network structure which provide higher possibility of interactions with protein molecules and accelerate the adsorption process. However no clear reason was proposed for this phenomenon (Sapir et al., 2012; Z.G. Wang et al., 2013). The rough surface of beads may be assigned to the magnetic nanoparticles which are shaped needle-like (TEM micrographs) and the more the nanoparticles the rougher the surface is obtained.
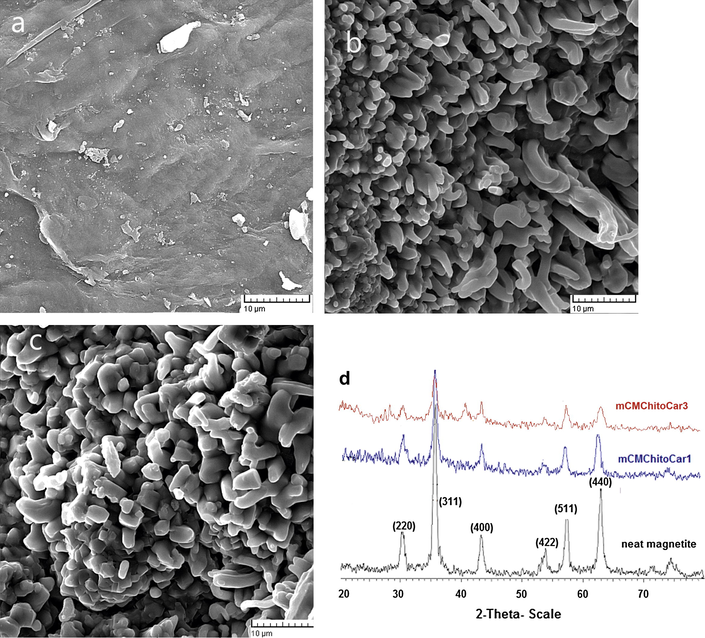
- SEM images of (a) non-magnetic CMChitoCar, (b) mCMChitoCar1, (c) mCMChitoCar2 and (d) XRD patterns of neat magnetic Fe3O4, mCMChitoCar1, and mCMChitoCar3 nanocomposites.
3.3 XRD, VSM and TEM studies
The crystalline structures and phase purities of the synthesized Fe3O4 and magnetic hydrogel were studied by XRD patterns. The XRD patterns of neat magnetic Fe3O4 nanoparticles, mCMChitoCar1, and mCMChitoCar3 nanocomposites are shown in Fig. 1d. In the spectrum of neat magnetic nanoparticles, the characteristic peaks of Fe3O4 were appeared at 2θ about 30.4°, 35.4°, 43.5°, 53.3°, 57.4°, and 63.2° indicating corresponding indices (220), (311), (400), (422), (511), and (440), respectively (Jiang et al., 2004). The results are in consistent with the database in JCPDS file (PDF No. 65-3107) indicating the formation of highly crystalline and pure magnetite nanoparticles with spinel structure (Zhang et al., 2012). The XRD patterns of mCMChitoCar1 and mCMChitoCar3 displayed the same characteristic diffraction peaks as MNPs without any changes in its structure and crystallinity. In fact, the formations of MNPs in the presence of biopolymers occurred without any phase change of magnetite (Cai et al., 2011). Meanwhile, the hysteresis loops of mCMChitoCar nanocomposites were measured by VSM technique between ±9 kOe at 298 K (Fig. 2). The magnetization curves illustrated that both mCMChitoCar1 and mCMChitoCar2 nanocomposites were superparamagnetic with no coercive at room temperature. The saturation magnetization values for mCMChitoCar1 and mCMChitoCar2 nanocomposites were 3.7 and 6.9 emu g−1, respectively, which indicates that the magnetization of the mCMChitoCar nanocomposites can be tuned by altering the weight ratio of MNPs (Kolhatkar et al., 2013). The TEM micrographs of mCMChitoCar1 (Fig. 3a and b) and mCMChitoCar3 (Fig. 3c) were also studied and according to the results, the magnetic Fe3O4 exhibited nano-scale particles with size of less than 100 nm. The shape of nanoparticles was obtained rod and relatively spherical in stabilized or aggregated forms when the ratio of κ-carrageenan and carboxymethyl chitosan was identical (mCMChitoCar1, Fig. 3a and b). The difference in the shape of nanoparticles may be attributed to the variation in the pore size of nanocomposites. When the ratio of κ-carrageenan was higher than that of the carboxymethyl chitosan (mCMChitoCar3), the magnetic nanoparticles were in agglomerated form (Fig. 3c). The results indicated that the size and shape of Fe3O4 nanoparticles can be affected by the ratio of biopolymers. Size distributions analysis from TEM images of mCMChitocar1 and mCMChitoCar3 with high number of nanoparticles (min. 120 particles) is shown in Fig. 3d and Fig. 3e, respectively. The average diameters of nanoparticles were obtained ∼9 and 70 nm for mCMChitocar1 and mCMChitoCar3, respectively.

- The hysteresis loops of mCMChitoCar1 and mCMChitoCa2 nanocomposites versus applied magnetic field.
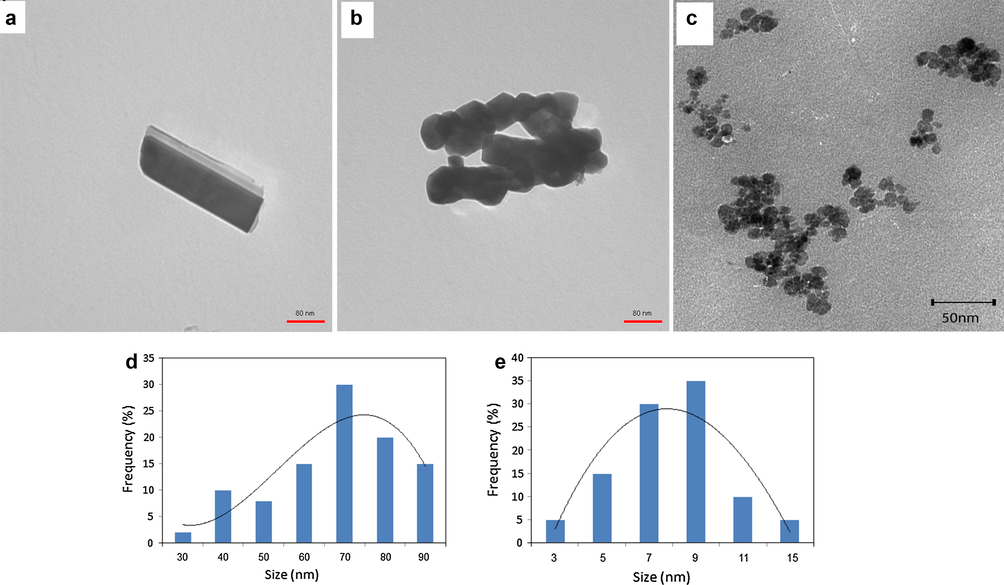
- TEM images of (a and b) mCMChitoCar1; and (c) TEM image of mCMChitoCar3; size distribution of nanoparticles for (d) mCMChitoCra1 and (e) mCMChitoCar3.
3.4 Water uptake
The water absorbing capacity of biopolymers is strongly influenced by their chemical composition. It depends on the ratio and nature of ionic and non-ionic functional groups (Omidian et al., 2010). Accordingly, a preliminary study was conducted on the swelling kinetic of nanocomposites. Fig. 4a represents the dynamic swelling behavior of magnetic nanocomposites in distillated water. Initially, the rate of water uptake was sharply increased and then began to level off. Comparing the dynamic swelling of nanocomposites, it is clear that water uptake and rate of swelling of biopolymers were affected by the composition of nanocomposites. Maximum and minimum swelling capacity was obtained for magnetic-free (CMChitoCar) and mCMChitoCar2 beads, respectively. Besides, the swelling capacity of all magnetic nanocomposites was obtained lower than that of the magnetic-free beads. This decrement in water absorbency can be attributed to the presence of Fe3O4 nanoparticles. The decrease in the swelling of magnetic nanocomposites arisen from (a) decrease in the ratio of hydrophilic and anionic functional groups and (b) the interaction between magnetic nanoparticles and polymeric chains resulted in more crosslink points and thereby decrease in swelling capacity (Philippova et al., 2011). In the case of magnetic mCMChitoCar3 nanocomposites, the swelling capacity was obtained higher than that of other magnetic nanocomposites. The weight ratio of two biopolymers in this sample was not equal and the content of k-carrageenan component was high. The reason for the high swelling may be due to the high content of k-carrageenan in the nanocomposite which contains sulfate groups. A similar observation has been reported by Muhamad et al. (2011), in which the swelling capacity of biopolymers consisting of carboxymethyl cellulose and k-carrageenan has been enhanced by increasing the content of k-carrageenan. According to the pKa of sulfate and carboxylate pendants (pKa of methane sulfonic acid is −2.5, while that of acetic acid is 4.8), the sulfate groups on the k-carrageenan dissociate in aqueous media more readily than the carboxylate groups (Hosseinzadeh et al., 2005). Accordingly, k-carrageenan behaves as a strong polyelectrolyte and the high swelling capacity of nanocomposites with the high content of k-carrageenan is originated from strong electrostatic repulsion between sulfate groups on k-carrageenan backbone (Mistsumata et al., 2003). Yin et al. have been indicated that the swelling kinetics of cross-linked hydrophilic polymers such as biopolymers is compatible with the Schott’s second-order diffusion models (Schott, 1992). This Phenomenon reveals that the swelling of biopolymers is controlled by stress relaxation of network. Thus, the experimental swelling data were analyzed by non-linear second-order swelling kinetic according to Schott’s models (Yin et al., 2002). The second-order swelling kinetic model is described as in Eq. (3), respectively:
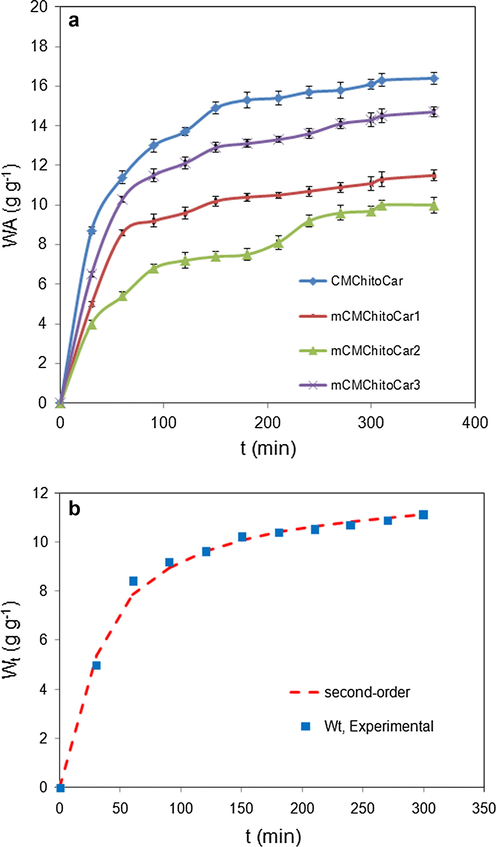
- (a) Swelling kinetic of nanocomposites in distilled water; (b) water absorbing of nanocomposites versus time according to experimental and second-order swelling kinetic model.
| Second-order kinetic | We.meas (g g−1) | |||
|---|---|---|---|---|
| k2 × 103 (g g−1 min−1) | We2 (g g−1) | r2 | ||
| CMChitoCar | 1.7 | 16.07 | 0.98 | 16.4 |
| mCMChitoCar1 | 2.3 | 12.4 | 0.99 | 11.5 |
| mCMChitoCar2 | 1.36 | 11.2 | 0.98 | 10 |
| mCMChitoCar3 | 1.64 | 14.2 | 0.99 | 14.7 |
3.5 Protein adsorption study
3.5.1 Kinetic of adsorption
The adsorption kinetic was investigated to measure the required equilibrium time for adsorption of BSA onto nanocomposites. The adsorption kinetic of 0.02 mg ml−1 BSA at pH = 4.7 was examined as a function of magnetic nanoparticles and weight ratio of biopolymers. Results showed that the adsorption reaches to equilibrium at first 30 min (Fig. 5a). At first step the adsorption process is very fast because the protein molecules occupy the accessible site of the adsorbent rapidly. As the adsorption process progresses, the rate of adsorption decreases and reaching the saturation adsorption in the final step. Furthermore, the magnetic nanocomposites displayed much higher adsorption value than that of non-magnetic one (CMChitoCar) for BSA molecule. The BSA adsorption capacity of CMChitoCar was 41.59 mg g−1. As the amount of magnetic nanoparticles enhanced in the composition of beads, adsorption capacity was found to be 50.15 mg g−1 and 54.71 mg g−1 for mCMChitoCar1 and mCMChitoCar2, respectively. In the present case, this observation may be attributed to this fact that magnetic nanocomposites possess bigger surface area providing more active sites (Badruddoza et al., 2011). In addition, based on SEM images, by incorporating the MNPs in polymer matrix, the surface becomes rougher resulting in more collision between BSA molecules and the active site of adsorbent. To further support this assumption, the UV−vis absorption of pure BSA, BSA-CMChitoCar and BSA-mCMChitoCar3 nanocomposites was studied in the range of 170–400 nm. The spectrum of pure BSA revealed the special absorption peak at 280 nm. The equal amount of CMChitoCar and mCMChitoCar3 was mixed with the same concentration of BSA solutions (0.02 mg ml−1 BSA in acetate buffer) and supernatant solution was taken for analysis in the abovementioned range. As shown in Fig. 5b, the absorption intensity of BSA at about 280 nm was slightly shifted to a lower wavelength of 210 nm after treating with the CMChitoCar. As form CMChitoCar3, the absorption intensity is greatly decreased to 180 nm (Yang et al., 2010; Shen et al., 2014), suggesting that mCMChitoCar3 has a significantly higher adsorption capacity for BSA than that of CMChitoCar beads. Also, by increasing the ratio of κ-carrageenan in polymer matrix (mCMChitoCar3), an enhancement in protein adsorption capacity was obtained with the adsorption capacity of 63.21 mg g−1. Swelling behavior is the main factor in this case (Fig. 4a). To be specific more, anion–anion electrostatic repulsion of anionic sulfate groups on κ-carrageenan (Shen et al., 2014) may be occurred resulting in higher adsorption efficacy.
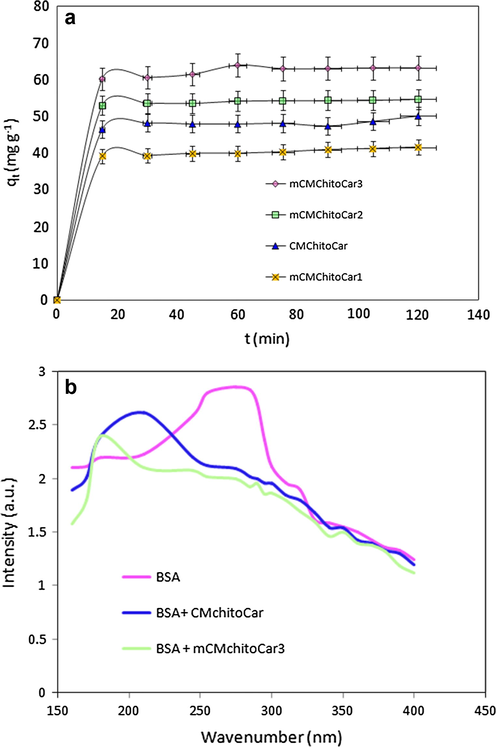
- (a) Adsorption kinetics of BSA onto magnetic nanocomposites (C0: 200 mg L−1, pH 4.6 and T 25 °C); (b) The UV–vis spectrum of 0.2 mg ml−1 BSA in acetate buffer solution at pH = 4.8 and UV–vis spectrum of supernatant solution of BSA contacted with CMChitoCar and mCMChitoCar3 nanocomposite.
Pseudo-first-order and pseudo-second-order kinetic models were examined to obtain rate constant and equilibrium adsorption capacity for beads (Ho and McKay, 1998; Ai et al., 2010). Kinetic data were analyzed using the pseudo-first-order equation (Eq. (4)) and pseudo-second-order equation (Eq. (5)) as follows:
| Pseudo-first-order | Pseudo-second-order | qe.exp | |||||
|---|---|---|---|---|---|---|---|
| k1 × 102 | qe.cal | R2 | k2 | qe.cal | R2 | ||
| min−1 | mg g−1 | g mg−1 min−1 | mg g−1 | mg g−1 | |||
| CMChitoCar | 2.92 | 34.58 | 0.994 | 4.44 | 39.91 | 0.999 | 41.59 |
| mCMChitoCar1 | 4.72 | 44.96 | 0.992 | 3.72 | 48.2 | 0.999 | 50.12 |
| mCMChitoCar2 | 5.32 | 49.19 | 0.992 | 5.76 | 51.75 | 0.999 | 54.71 |
| mCMChitoCar3 | 6.98 | 56.14 | 0.993 | 3.48 | 59.47 | 0.999 | 63.21 |
3.5.2 Adsorption isotherm
Adsorption isotherm can be considered as an essential necessity to design the adsorption system. The adsorption isotherms of BSA onto mCMChitoCar1 and mCMChitoCar3 nanocomposites were determined and the results are depicted in Fig. 6a and b. As the initial BSA concentration is increased, the adsorption capacity of beads is enhanced and then switches to level off. At higher initial concentration, the adsorption sites reach on saturation state and the adsorption remains constant. The Langmuir and Freundlich isotherm models can be applied to analysis of experimentally equilibrium data from adsorption of protein onto samples at equilibrium time. In the Langmuir model, the adsorption of adsorbate takes place at specific homogeneous sites within the adsorbent and valid for monolayer adsorption onto adsorbents. The expression of the applied Langmuir model is given by Eq. (6) (Ho and McKay, 1998):
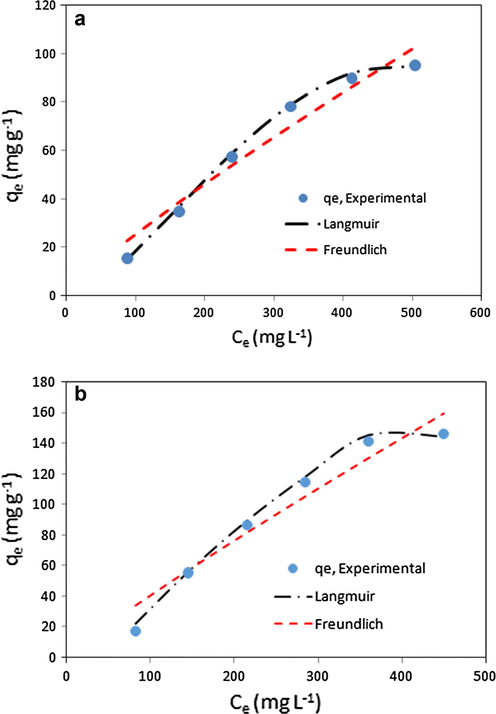
- Adsorption isotherms of BSA onto (a) mCMChitoCar1 and (b) mCMChitoCar3 nanocomposites at initial concentration range of C0: 200–600 mg L−1, pH = 4.6 and T = 25 °C.
| Langmuir model | Freundlich model | |||||
|---|---|---|---|---|---|---|
| qm | KL | R2 | N | kf | R2 | |
| mg g−1 | L mg−1 | g L−1 | (mg g−1) (L mg−1)1/n | |||
| CMChitoCar | 84.26 | 4.29 | 0.99 | 2.13 | 91.34 | 0.99 |
| mCMChitoCar1 | 99.18 | 10.31 | 0.99 | 2.29 | 102.17 | 0.92 |
| mCMChitoCar2 | 103.45 | 19.87 | 0.99 | 2.61 | 105.73 | 0.96 |
| mCMChitoCar3 | 133.26 | 48.76 | 0.99 | 3.11 | 139.56 | 0.96 |
3.5.3 Effect of pH on BSA adsorption
The electrostatic interactions involved in adsorption mechanism may be explained by the results of Zeta potential. The measured Zeta potentials of BSA, MNPs and mCMChitoCar3 at different pHs are shown in Fig. 7a. The Results indicated that the isoelectric point (pI) of magnetic particles is about 6.68 which agrees well with the literature value pI = 6.5 (Peng et al., 2004). On the other hand, as the surface of the particles was modified with biopolymers (mCMChitoCar3), the absolute value of zeta was shifted to 5.85. The effect of pH on the adsorption of BSA on mCMChitoCar3 nanocomposites is shown in Fig. 7b. At pH values higher than 7.4 (7.4–9.2) both BSA and mCMChitoCar3 are negatively charged, so an electrostatic repulsion between them resists the adsorption of protein. At pH values lower than 4.7, (pH 3.3) both BSA and mCMChitoCar3 are positively charged accordingly, and electrostatic repulsion contributes remarkably to the decrement of BSA adsorption. Notably the maximum adsorption of BSA onto nanocomposites was obtained at pH = 4.66 near the isoelectric point of BSA (pI = 4.7) (Peng et al., 2004; Lee et al., 2002). As it has been reported by researchers (Chun and Stroeve, 2002), the main reason for this phenomenon can be explained by this fact that the BSA molecules undergo lowest conformational changes in this situation and additionally the electrostatic repulsion between biopolymers and BSA molecules is minimized which promote adsorption process. At pH 5.2, magnetic particles are positively charged and BSA is negatively charged; therefore, there should be an electrostatic attraction between BSA molecules and nonmagnetic particles promoting the adsorption of BSA onto the surface of the particles. However, the results revealed that less BSA was adsorbed on the surface of nanoparticles. This phenomenon may be attributed to the expansion of the BSA molecule at acidic pH, which causes the decrement in adsorption (Bajpai, 2000). The results are consistent with the research reported by Kono et al., where the maximum adsorption capacity of BSA on chitosan-based hydrogel was at pH 4.5 (Kono et al., 2013).

- (a) Zeta potentials of BSA, MNPs and mCMChitoCar3 in 10−3 M NaNO3 at different pHs and (b) effect of pH on the adsorption of BSA onto mCMChitoCar1 (C0: 200 mg L−1, ionic strength 0.1 M, T = 25 °C).
3.5.4 Effect of ionic strength on adsorption
In the current study, we attempted to study the effect of ion strength on the BSA adsorption onto CMChitoCar and mCMChitoCar1 beads at different NaCl concentrations ranging from 0.01 to 0.1 M at pH = 4.7 (Fig. 8). The adsorption of BSA onto beads was increased as the salt concentration increased up to 0.05 M and then decreased. By increasing the salt concentration, the surface tension of the solution enhances resulting in interactions between inner hydrophobic part of BSA and biopolymers (Wang et al., 2008). On the other hand it may cause the suppression of the electric double layer of proteins which decrease the electrostatic repulsion between adsorbed protein and ensuring enhancement in adsorption efficiency (Chen et al., 2007). However, at salt concentration above 0.7 M, the adsorption of proteins decreased. This decrement in protein adsorption may be attributed to the screening of anionic sulfate (–OSO3−) groups on κ-carrageenan by Na+ cations (Sharma and Agarwal, 2001). Additionally, compared to BSA molecules the Na+ ions are smaller in size; therefore, its mobility is higher than that of BSA molecules. In other words, the adsorbent surface is more available for the Na+ cations than BSA molecules (Hu et al., 2013). The effect of ion strength on adsorption of BSA on poly(ethylenimine)-modified Sepharose FF has been investigated by Yu et al., and the adsorption capacity of adsorbents for BSA has been reduced by increasing ion strength of media (Yu and Sun, 2013).
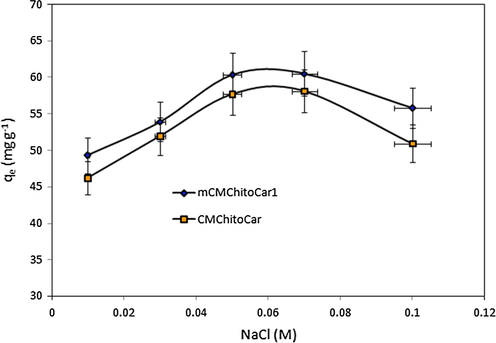
- Effect of NaCl concentration on the adsorption of BSA onto CMChitoCar and mCMChitoCar1 nanocomposites (C0: 200 mg L−1, pH: 4.6 and T = 25 °C).
3.5.5 Thermodynamic study
In the final step of present study, we tried to assess the adsorption capacity of mCMChitoCar3 nanocomposite as a function of temperature. In this regard, thermodynamic parameters such as standard Gibbs free energy (ΔG, J mol−1), enthalpy change (ΔH, J mol−1), and entropy change (ΔS, J K−1 mol−1) were calculated as follows:
| T | KL | qm | Kc | ΔG | ΔH | ΔS |
|---|---|---|---|---|---|---|
| K | L mg−1 | mg g−1 | L g−1 | kJ mol−1 | kJ mol−1 | J K−1 mol−1 |
| 278 | 0.0429 | 63.2 | 2.711 | −2.305 | −18.96 | −52.53 |
| 288 | 0.0489 | 68.5 | 3.349 | −2.894 | ||
| 298 | 0.0548 | 73.5 | 4.028 | −3.451 | ||
| 308 | 0.0698 | 78.15 | 5.454 | −3.343 |
4 Conclusion
In summary, magnetic and pH-sensitive nanocomposites were successfully prepared through a completely green route for protein adsorption. The magnetic Fe3O4 nanoparticles (MNPs) were synthesized inside the blend of biopolymers and the shape of magnetic nanoparticles was affected by the ratio of biopolymers. The swelling of nanocomposites was affected by the content of magnetic nanoparticles as well as the weight ratio of two biopolymers. While the swelling capacity was decreased by inclusion of magnetic particles, it was enhanced by the increase in the weight ratio of κ-carrageenan component. By imparting the MNPs the surface of biopolymers became rough resulted in higher adsorption capacity. Zeta potential measurement showed that the knowledge of the surface charge characteristics of adsorbate is required to predict the adsorption characteristic of bovine serum albumin onto nanocomposites. According to results it was found that electrostatic interactions play a key factor on adsorption. This study presents a new pathway for bioseparation technology by employing cheap, easy-obtained and non-toxic nanocomposites biopolymers.
References
- Activated carbon/CoFe2O4composites: facile synthesis, magnetic performance and their potential application for the removal of malachite green from water. Chem. Eng. J.. 2010;156(1–3):243-249.
- [Google Scholar]
- The effect of nanoparticle size, shape, and surface chemistry on biological systems. Annu. Rev. Biomed. Eng.. 2012;14:1-16.
- [Google Scholar]
- Carboxymethyl-β-cyclodextrin conjugated magnetic nanoparticles as nano-adsorbents for removal of copper ions: synthesis and adsorption studies. J. Hazard. Mater.. 2011;185(2–3):1177-1186.
- [Google Scholar]
- Adsorption of bovine serum albumin onto glass powder surfaces coated with polyvinyl alcohol. J. Appl. Polym. Sci.. 2000;78(5):933-940.
- [Google Scholar]
- β-Cyclodextrin conjugated magnetic nanoparticles for diazepam removal from blood. Chem. Commun.. 2011;47(27):7719-7721.
- [Google Scholar]
- Morphological effect of gold nanoparticles on the adsorption of bovine serum albumin. Phys. Chem. Chem. Phys.. 2014;16(38):20471-20482.
- [Google Scholar]
- The hydroPHobic interactions of the ion-exchanger resin ligands with proteins at high salt concentrations by adsorption isotherms and isothermal titration calorimetry. Sep. Purif. Technol.. 2007;54(2):212-219.
- [Google Scholar]
- Magnetic solid-phase extraction of proteins based on hydroxy functional ionic liquid-modified magnetic nanoparticles. Anal. Methods. 2014;6(20):8358-8367.
- [Google Scholar]
- Preparation of magnetic graphene composites with hierarchical structure for selective capture of phosphopeptides. J. Mater. Chem. B. 2014;2(29):4711-4719.
- [Google Scholar]
- Protein transport in nonporous membranes modified with self-assembled monolayers of functionalized thiols. Langmuir. 2002;18(12):4653-4658.
- [Google Scholar]
- Insights into the modeling of adsorption isotherm. Chem. Eng. J.. 2010;156(1):2-10.
- [Google Scholar]
- Theoretical description of hydrogel swelling: a review. Iran. Polym. J.. 2010;19(5):375-398.
- [Google Scholar]
- An easy co-casting method to synthesize mesostructured carbon composites with high magnetic separability and acid resistance. New J. Chem.. 2009;33(9):1926-1931.
- [Google Scholar]
- Isotherms, kinetics and thermodynamics of acid dye adsorption on activated palm ash. Chem. Eng. J.. 2007;133(1–3):195-203.
- [Google Scholar]
- Modified carrageenan-PAM, a novel biopolymer-based superabsorbent hydrogel. J. Bioact. Compat. Polym.. 2005;20(5):475-490.
- [Google Scholar]
- Dye adsorption by resins: effect of ionic strength on hydrophobic and electrostatic interactions. Chem. Eng. J.. 2013;228:392-397.
- [Google Scholar]
- Biomedical applications of chitin and chitosan based nanomaterials – a short review. Carbohydr. Polym.. 2010;82(2):227-232.
- [Google Scholar]
- Preparation and properties of superparamagnetic nanoparticles with narrow size distribution and biocompatible. J. Magnet. Magnet. Mater.. 2004;283(2–3):210-214.
- [Google Scholar]
- The preparation, swelling characteristics, and albumin adsorption and release behaviors of a novel chitosan-based polyampholyte hydrogel. React. Funct. Polym.. 2013;73:97-107.
- [Google Scholar]
- Tuning the magnetic properties of nanoparticles. Int. J. Mol. Sci.. 2013;14(8):15977-16009.
- [Google Scholar]
- Effect of electrostatic interaction on the adsorption of globular proteins on Ooctacalciumphosphate crystal film. J. Colloid Interf. Sci.. 2002;246(1):70-77.
- [Google Scholar]
- Alginates: properties and biomedical applications. Prog. Polym. Sci.. 2012;37(1):106-126.
- [Google Scholar]
- Blood protein adsorption on sulfonated chitosan and κ-carrageenan films. Colloids Surf. B Biointerf.. 2013;111:719-725.
- [Google Scholar]
- Development of carboxymethyl chitosan hydrogel nanocomposites in alcohol-aqueous binary solvent for nutrient delivery applications. Food Hydrocolloids. 2013;31(2):332-339.
- [Google Scholar]
- Adsorption of Reactive Red M-2BE dye from water solutions by multi-walled carbon nanotubes and activated carbon. J. Hazard. Mater.. 2011;192(3):1122-1131.
- [Google Scholar]
- PH respond of chitosan, k-carrageenan, carboxymethyl cellulose sodium salt complex biopolymers. Polymer. 2003;44(23):7103-7111.
- [Google Scholar]
- Cation-specific aggregation of carrageenan helices: Domain model of polymer gel structure. J. Mol. Biol.. 1980;138(2):349-362.
- [Google Scholar]
- Genipin-cross-linked kappa carrageenan/carboxymethyl cellulose nanocomposites and effects on beta-carotene release. Carbohydr. Polym.. 2011;83:1207-1212.
- [Google Scholar]
- Characterization of protein adsorption at the phosphorylcholine incorporated polymer–water interface. Macromolecules. 2000;33(12):4545-4554.
- [Google Scholar]
- Swelling and mechanical properties of modified HEMA-based superporous biopolymers. J. Bioact. Compat. Polym.. 2010;471:483-497.
- [Google Scholar]
- Adsorption of acid blue 193 from aqueous solutions 640 onto DEDMA-sepiolite. J. Hazard. Mater.. 2006;129:244-252.
- [Google Scholar]
- Adsorption of bovine serum albumin on nanosized magnetic particles. J. Colloid Interf. Sci.. 2004;271(2):277-283.
- [Google Scholar]
- Magnetic polymer nanocomposites: recent trends and developments in synthetic design and applications. Eur. Polym. J.. 2011;47:542-559.
- [Google Scholar]
- Kinetics and isotherms of leather dye adsorption by tannery solid waste. Chem. Eng. J.. 2012;183:30-38.
- [Google Scholar]
- Protein adsorption modalities on polyelectrolyte multilayers. Biomacromolecules. 2004;5(3):1089-1096.
- [Google Scholar]
- The promotion of in vitro vessel-like organization of endothelial cells in magnetically responsive alginate scaffolds. Biomaterials. 2012;33:4100-4109.
- [Google Scholar]
- Interactions of proteins with immobilized metal ions: role of ionic strength. J. Colloid Interf. Sci.. 2001;243(13–14):61-72.
- [Google Scholar]
- Synthesis and characterization of monodispersed chitosan-coated Fe3O4 nanoparticles via a facile one-step solvothermal process for adsorption of bovine serum albumin. Nanoscale Res. Lett.. 2014;9(1):296.
- [Google Scholar]
- Cytotoxicity evaluation of magnetite (Fe3O4) nanoparticles in mouse embryonic stem cells. Colloids. Surf. B Biointerf.. 2012;97:221-225.
- [Google Scholar]
- Optimization of adsorption conditions of BSA on thermosensitive magnetic composite particles using response surface methodology. Colloids Surf. B Biointerf.. 2011;84(2):477-483.
- [Google Scholar]
- Study of BSA protein adsorption/release on hydroxyapatite nanoparticles. Appl. Surface Sci.. 2013;286:99-103.
- [Google Scholar]
- Relationship between thermodynamic data and adsorption/desorption performance of acid and basic dyes onto activated carbons. J. Chem. Eng. Data. 2011;56(5):2100-2109.
- [Google Scholar]
- Magnetic g-Fe2O3@REVO4 (RE ¼ Sm, Dy, Ho) affinity microspheres for selective capture, fast separation and easy identification of phosphopeptides. Mater. Chem. B. 2013;1:1491-1500.
- [Google Scholar]
- Adsorption of bovin serum albumin (BSA) onto the magnetic chitosan nanoparticles prepared by a microemulsion system. Bioresour. Technol.. 2008;99(9):3881-3884.
- [Google Scholar]
- Kinetics of adsorption of bovine serum albumin on magnetic carboxymethyl chitosan nanoparticles. Int. J. Biolog. Macromol.. 2013;58:57-65.
- [Google Scholar]
- Preparation of Fe3O4@graphene oxide core–shell magnetic particles for use in protein adsorption. Mater. Lett.. 2012;82:224-226.
- [Google Scholar]
- Ophthalmic drug-loaded N,O-carboxymethyl chitosan biopolymers: synthesis, in vitro and in vivo evaluation. Acta Pharmacol. Sin.. 2010;31(12):1625-1634.
- [Google Scholar]
- Facile template synthesis of ordered mesoporous carbon with polypyrrole as carbon precursor. Chem. Mater.. 2005;17(2):355-358.
- [Google Scholar]
- Preparation of acid-resistant core/shell Fe3O4@C materials and their use as catalyst supports. Carbon. 2012;50(6):2287-2295.
- [Google Scholar]
- Swelling behavior of biopolymers for colon-site drug delivery. J. Appl. Polym. Sci.. 2002;83(13):2835-2842.
- [Google Scholar]
- Protein adsorption to poly(ethylenimine)-modified Sepharose FF: II. Effect of ionic strength. J. Chromatogr. A. 2013;1305:85-93.
- [Google Scholar]
- Synthesis of mesoporous carbon capsules encapsulated with magnetite nanoparticles and their application in wastewater treatment. J. Mater. Chem.. 2011;21(11):3664-3671.
- [Google Scholar]
- Synthesis of BSA/Fe3O4 magnetic composite microsPHeres for adsorption of antibiotics. Mater. Sci Eng. C. 2013;33(7):4401-4408.
- [Google Scholar]
- Preparation of Fe3O4/chitosan/poly(acrylic acid) composite particles and its application in adsorbing copper ion (II) Cellulose. 2012;19(6):2081-2091.
- [Google Scholar]


